A Green Pea starburst arising from a galaxy-galaxy merger
Abstract
Green Pea galaxies are low-redshift starburst dwarf galaxies, with properties similar to those of the high-redshift galaxies that reionized the Universe. We report the first mapping of the spatial distribution of atomic hydrogen (Hi) in and around a Green Pea, GP J0213+0056 at , using the Giant Metrewave Radio Telescope (GMRT). Like many Green Peas, GP J0213+0056 shows strong Hi 21 cm emission in single-dish spectroscopy, strong Ly emission, and a high [Oiii]5007Å/[Oii]3727Å luminosity ratio, O32 , consistent with a high leakage of Lyman-continuum radiation. Our GMRT Hi 21 cm images show that the Hi 21 cm emission in the field of GP J0213+0056 arises from an extended broken-ring structure around the Green Pea, with the strongest emission coming from a region between GP J0213+0056 and a companion galaxy lying kpc away, and little Hi 21 cm emission coming from the Green Pea itself. We find that the merger between GP J0213+0056 and its companion is likely to have triggered the starburst, and led to a disturbed Hi spatial and velocity distribution, which in turn allowed Ly (and, possibly, Lyman-continuum) emission to escape the Green Pea. Our results suggest that such mergers, and the resulting holes in the Hi distribution, are a natural way to explain the tension between the requirements of cold gas to fuel the starburst and the observed leakage of Ly and Lyman-continuum emission in Green Pea galaxies and their high-redshift counterparts.
1 Introduction
Faint star-forming dwarf galaxies have long been believed to be the main contributors of the Lyman-continuum (LyC) photons that ionized the Universe during the Epoch of Reionization (EoR) at (e.g. Fan et al., 2006). However, how the LyC photons escaped the EoR galaxies remains an open question today. Direct studies of these high-redshift galaxies is challenging due to limitations in both sensitivity and resolution. Studies of local analogs of the EoR galaxies, i.e. nearby galaxies with high escape fractions of LyC and Ly photons, hence provide an interesting avenue to understand the processes that led to cosmic reionization.
Green Pea galaxies are extreme emission-line galaxies with compact sizes, low metallicities, and high specific star formation rates, lying at low redshifts, (Cardamone et al., 2009). They are the most extreme of the actively star-forming galaxies in the local Universe, with H luminosities of erg s-1; for comparison, the “classic” luminous blue compact dwarf galaxy, I Zw 18, has an H luminosity of erg s-1, two orders of magnitude lower than that of typical Green Peas. Similarly, while galaxies of the Lyman Alpha Reference Sample (LARS; Östlin et al., 2014) have H luminosities similar to those of Green Peas (e.g. Pardy et al., 2014), eight of the 14 LARS galaxies do not meet the Ly rest equivalent width criterion, Å, used to identify high- Ly emitters (and, in fact, only one LARS galaxy, LARS14, would classify as a Green Pea). Conversely, Green Peas typically show strong Ly emission (Henry et al., 2015; Yang et al., 2016, 2017), with an equivalent width distribution matching that of high-redshift () Ly -emitting galaxies (Yang et al., 2016). Izotov et al. (2016, 2018b, 2018a) found LyC leakage in more than ten Green Peas, with escape fractions %, making them the strongest known LyC leakers in the local Universe. These lines of evidence suggest that Green Peas are excellent low- analogs of the galaxies that drove cosmological reionization.
A conundrum in our understanding of Green Peas is the need for sufficient cold neutral gas to fuel the starburst and yet a low enough Hi column density to allow the Ly and LyC photons to escape. Recently, Kanekar et al. (2021) used the Arecibo Telescope and the Green Bank Telescope (GBT) to detect Hi 21 cm emission from 19 Green Peas at . Two of the Green Peas with Hi 21 cm detections, GP J0213+0056 at and GP J1200+2719 at , are remarkable as they show both strong Hi 21 cm emission and strong Ly emission, with Ly escape fractions of and , respectively (McKinney et al., 2019). Both galaxies also have a high ratio of the [Oiii]5007 luminosity to the [Oii]3727 luminosity, (GP J0213+0056) and (GP J1200+2719), suggesting a high escape fraction of LyC radiation (Jaskot & Oey, 2013; Izotov et al., 2016, 2018b), although we emphasize that neither galaxy has so far been detected in LyC emission. However, both galaxies are also “gas-rich″(Kanekar et al., 2021), lying above the local relation between the Hi mass and the absolute B-magnitude (Dénes et al., 2014). These are currently the two best candidates to directly assess the conditions that allow the detection of both Hi 21 cm and Ly emission from a single galaxy. In this Letter, we report a Giant Metrewave Radio Telescope (GMRT) Hi 21 cm mapping study of GP J0213+0056 at , which has yielded the first determination of the spatial distribution of Hi in and around a Green Pea galaxy.
2 Observations and Data Analysis
| Beam | UV range | RMS noise | |
|---|---|---|---|
| () | () | (mJy Bm-1) | (cm-2) |
| 5 | 0.98 | 0.27 | |
| 12 | 0.91 | 1.2 | |
| 13.5 | 0.87 | 2.0 | |
| 20 | 0.74 | 3.0 | |
| 25 | 0.66 | 4.4 |
We observed GP J0213+0056 (J2000 co-ordinates: 02h13m06.6s, +00d56’12.5”) with the GMRT Band-5 receivers on 20-21 December 2019 (proposal 37_056; PI Chengalur). The observations used a bandwidth of 4.17 MHz, centred at 1373.67 MHz and sub-divided into 512 channels, with two polarizations. The GMRT Software Backend (GSB) was used as the correlator. The total on-source time was hours. Observations of 3C48 were used to calibrate the flux density scale and the system bandpass, while J0204+152 was used as the phase calibrator.
The data were analysed using standard procedures in the Common Astronomy Software Applications (casa Version 5.6; McMullin et al., 2007) package. We initially removed all visibilities from non-working antennas or affected by radio frequency interference (RFI) from the data set. We then used the calibrator data to determine the antenna-based gains and bandpass shapes, using the routines gaincalR and bandpassR (Chowdhury et al., 2020), and applied the gains and bandpass solutions to the target data. We then made a continuum image of the GP J0213+0056 field from the line-free channels, using the routine tclean and the w-projection algorithm. A standard iterative self-calibration procedure was then used, with a number of rounds of phase-only self-calibration and imaging, followed by inspection of the residual visibilities and further data editing to remove any data affected by RFI. The procedure was carried out until no improvement was seen in either the image or the residual visibilities on further self-calibration. The signal-to-noise ratio of the data was not sufficient to solve for both the amplitudes and the phases of the complex gains; we hence retained the gain amplitudes from the original calibration. The final continuum image has an angular resolution (full width at half maximum, FWHM, of the synthesized beam) of and a root-mean-square (RMS) noise of Jy Beam-1. The positions of point sources in the GMRT image are in excellent agreement with their positions in the 1.4 GHz image of the FIRST survey (Becker et al., 1995), within (i.e. less than half the FWHM of the FIRST synthesized beam). After applying the final gain solutions to the target data, we subtracted the cleaned continuum emission from the self-calibrated visibilities to obtain a residual visibility data set.
The unique GMRT antenna configuration, with a mix of short, intermediate, and long baselines, allowed us to make spectral cubes at a range of angular resolutions, providing information on both the total Hi content of GP J0213+0056 and the spatial distribution of the Hi. For each resolution, we first made a continuum image at the same resolution, and subtracted it out. We then made the spectral cube at this resolution from the residual visibilities. The cubes were made at resolutions of , , , , and , in the barycentric frame, with a velocity resolution of 10 km s-1.
The cubes were made with the tclean routine, cleaning the regions that showed Hi 21 cm emission down to a threshold of 0.5 times the per-channel RMS noise. We used robust weighting (Briggs, 1995), with robust at -resolution and robust for the higher-resolution cubes. This was done in order to increase the sensitivity at the lowest () resolution in order to pick up the entire Hi 21 cm emission, and to reduce sidelobes in the higher-resolution cubes where we aim to accurately map the Hi 21 cm emission. Finally, we used the task imcontsub, to fit a linear baseline to line-free channels at each spatial pixel of each cubes. We then subtracted out the fitted baselines, thus subtracting out any remaining continuum emission from each cube.
We used the routines immoments in casa and momnt in the Astronomical Image Processing System (AIPS; Greisen, 2003) to obtain velocity moments of the spectral cubes, to study the Hi spatial and kinematic distributions. All moment images were made from the ten velocity channels that were found by visual inspection to contain the Hi 21 cm emission. The Hi spatial distribution was obtained via a simple velocity integral over the line channels of the spectral cube; this directly provides the Hi column density at different spatial locations. This was done for the cubes at resolutions of . For the Hi velocity field, we used a single resolution, , chosen to provide both good Hi column density sensitivity and good angular resolution. We used a flux density threshold of on the cube to exclude noise peaks, where is the RMS noise on the cube per 10 km s-1 channel. The threshold was applied after smoothing the cube both spatially (Gaussian kernel, of FWHM times the synthesized beam) and spectrally (Hanning smoothing, by 10 channels). The wide Hanning-smoothing kernel was used because the spectral features are both wide and weak. We emphasize that the smoothing was done only in order to create the mask for applying the thresholds.
3 Results and Discussion
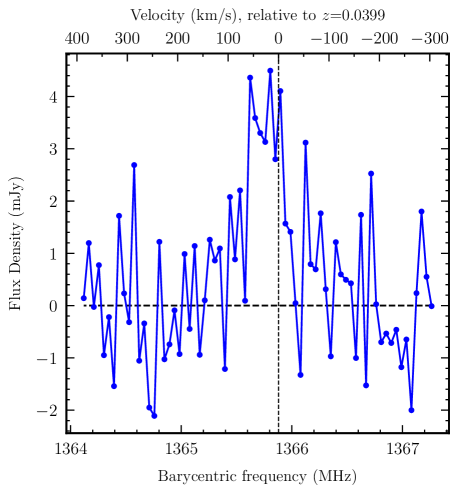
Fig. 1[A] shows the GMRT Hi 21 cm spectrum of GP J0213+0056, obtained from our lowest-resolution () cube, at a velocity resolution of 10 km s-1. The RMS noise on the spectrum is mJy per 10 km s-1 channel, and the integrated Hi 21 cm line flux density is Jy km s-1. This yields an Hi mass of , marginally lower than, but formally consistent with, the value of obtained by Kanekar et al. (2021) from their GBT spectrum.
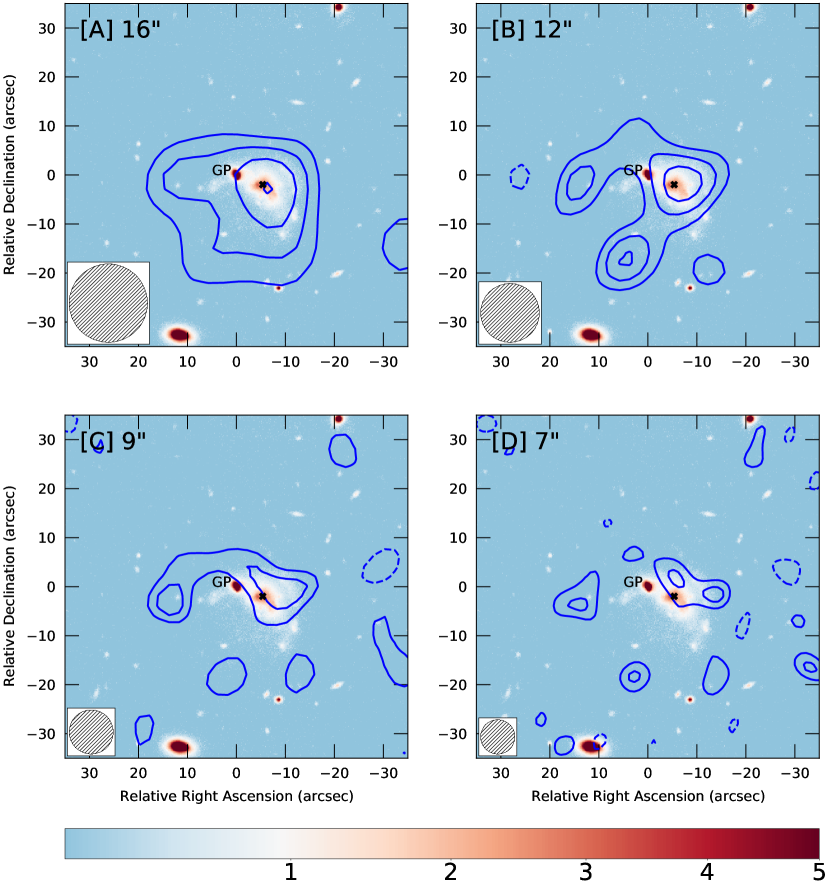
Fig. 2 shows images of the Hi 21 cm emission in and around GP J0213+0056 at angular resolutions of [A] , [B] , [C] , and [D] , overlaid on a Subaru HypersuprimeCam (HSC) -band image (Aihara et al., 2022) of the field. At the coarsest angular resolution of , Fig. 2[A] shows that the Green Pea lies away from the peak of the Hi 21 cm emission. At higher resolution, the Hi 21 cm emission in panels [B] and [C] is seen to arise from a ring-like structure around the Green Pea; the Hi distribution is clearly disturbed, indicating a merger system (e.g. Hibbard et al., 2001). We hence searched the SDSS for nearby companion galaxies, and identified a galaxy SDSS J021306.26+005609.9 (hereafter, G1) at , just , i.e. kpc, to the south-west of GP J0213+0056 and at almost exactly the same redshift. The locations of the Green Pea and G1 are indicated in the four panels of Fig. 2. The galaxy G1 is clearly detected in the Subaru HSC image, which shows that both the Green Pea and G1 are highly distorted due to the merger.
Fig. 2 shows that GP J0213+0056 lies at the edge of the Hi 21 cm emission, with no emission seen from the Green Pea location or immediately east of it in the highest-resolution images of [C] and [D]. The upper limit on the Hi column density at the Green Pea location is cm-2, from the 9”-resolution cube, at a velocity resolution of 10 km s-1. Indeed, it is clear from Figs. 2[C] and [D] that the strongest Hi 21 cm emission arises from neither the Green Pea nor G1, but from the region around them. The highest Hi column density in our Hi 21 cm images, cm-2 in the -resolution image of [D], arises to the west of G1 and the Green Pea. The angular offset between the highest Hi column density location and the centre of the galaxy G1 is , far larger than the positional accuracy of the GMRT images (, from the continuum image). As such, we rule out the possibility that the peak of the Hi column density arises from G1.
McKinney et al. (2019) tentatively detect weak Ly absorption in GP J0213+0056, around the much stronger Ly emission, obtaining an Hi column density of cm-2. This is consistent with the observed Hi distribution in Fig. 2, which indicates that the GP lies at the edge of the Hi 21 cm emission, with an Hi column density cm-2.
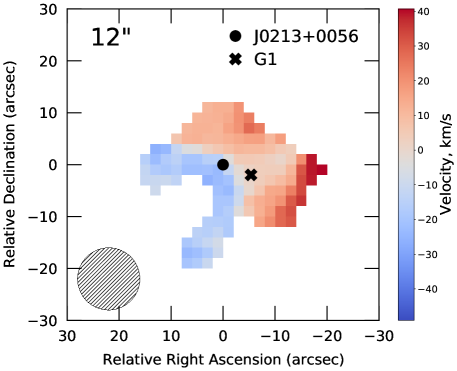
Fig. 3 shows the Hi velocity field at an angular resolution of . A velocity gradient is visible in the image, with the Hi in the arc towards the east and south-east of the Green Pea moving towards us, and that in the arc extending from north to south-west of the Green Pea moving away from us, GP J0213+0056 and G1 are located along the boundary between the two regions. It is possible that the interaction between the galaxies has driven the Hi out from the Green Pea (and possibly from G1 as well); deeper Hi 21 cm observations are needed to confirm this hypothesis.
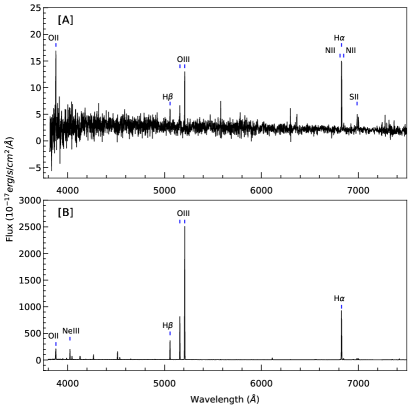
Fig. 4 shows the SDSS spectra of G1 and GP J0213+0056. The spectrum of G1 shows strong emission in the H, [Oiii]5007Å triplet, and [Oii]3727Å doublet lines, with an H line luminosity of , indicating active star formation. Duarte Puertas et al. (2017) obtain a star formation rate of yr-1 from the H line luminosity, and a stellar mass of by modelling the optical spectral energy distribution, indicating that G1 lies on the star-forming main sequence. We note that the stellar mass of G1 is larger than that of GP J0213+0056 (). Of course, the spectrum of GP J0213+0056, shown for comparison, displays extreme H and [Oiii]5007Å emission, times stronger than that of G1.
| O32 | EW(Ly ) | SFR | |||||
|---|---|---|---|---|---|---|---|
| Å | km s-1 | yr-1 | |||||
| 8.8 | 42 | 397 | 12% | 0.54 | 7.8 | 1.4 | 2.34 |
Our GMRT Hi 21 cm mapping of the Green Pea GP J0213+0056 has revealed that the Hi 21 cm emission from an extended region around the galaxy, with a broken-ring structure, and evidence of disturbed kinematics, clear indications of merger activity. Consistent with the merger hypothesis, we have identified a main-sequence galaxy G1, kpc away from GP J0213+0056 and at almost exactly the same redshift, , with a slightly higher stellar mass.
GP J0213+0056 and G1 are identified as independent galaxies by the SDSS. However, the separation between the two is very small, kpc. It is possible that the Green Pea is a young super star-cluster formed in G1 during the major merger, i.e. that GP J0213+0056 and G1 are not distinct galaxies. It has been suggested that such super star-clusters can form efficiently in both high- Ly -emitting galaxies (Elmegreen et al., 2012) and nearby dwarf starburst galaxies (Renaud, 2018). However, we note that the estimated stellar mass of GP J0213+0056 is quite large, , larger than expected for a super star-cluster within a galaxy.
GP J0213+0056 lies at the edge of the Hi 21 cm emission seen in Figs. 2[B–D], with no Hi 21 cm emission detected at the Green Pea location in the higher-resolution Hi 21 cm images. This lack of Hi 21 cm emission at the location of GP J0213+0056 suggests the presence of holes in the Hi spatial distribution, due to the merger. Such holes in the Hi distribution would facilitate the leakage of ionizing radiation from the Green Pea, consistent with the strong Ly emission detected by Jaskot et al. (2019), with a Ly escape fraction of . The major merger is likely to have both triggered the starburst in GP J0213+0056 and created the pathways by which Ly , and possibly LyC, radiation could leak from the Green Pea galaxy.
Unlike other Green Peas at higher redshifts, (e.g. Izotov et al., 2018b, a), LyC emission has not so far been directly detected from GP J0213+0056. However, LyC escape in Green Pea galaxies has been shown to correlate with the O32 value, the gas covering fraction, and the Ly emission properties such as the line equivalent width (EW), the Ly line peak separation and Ly escape fraction (Izotov et al., 2016, 2018b; Jaskot et al., 2017, 2019), although no individual property provides a definitive indicator (e.g. Verhamme et al., 2017). The properties of GP J0213+0056 are listed in Table 2. The moderately high O32 value and Ly equivalent width, and the moderate gas covering fraction, all suggest the possibility of LyC leakage from GP J0213+0056. However, the Ly escape fraction of % is not very high and the separation between Ly emission peaks is large, both indicators of low LyC leakage. The current data are thus not conclusive on whether or not GP J0213+0056 is likely to be a LyC leaker.
4 Summary
We have used the GMRT to map the Hi 21 cm emission from GP J0213+0056 at , providing the first images of the spatial distribution of Hi in and around a Green Pea galaxy. The GMRT images indicate that the starburst in GP J0213+0056 is likely to have been triggered as the result of a major merger with a companion galaxy, G1, just kpc away, and with a stellar mass higher than that of the Green Pea. The Hi 21 cm emission arises from a broken-ring structure around the Green Pea and G1, with no Hi 21 cm emission detected at the location of GP J0213+0056 in the higher-resolution images. The strong Ly emission observed from GP J0213+0056 is likely to arise due to the escape of Ly and LyC photons through holes in the Hi spatial distribution caused by the merger.
Acknowledgements
We thank an anonymous referee for a detailed report that significantly improved this manuscript. We thank the staff of the GMRT who have made these observations possible. The GMRT is run by the National Centre for Radio Astrophysics of the Tata Institute of Fundamental Research. S.P, N.K., and J.N.C. acknowledge support from the Department of Atomic Energy, under project 12-R&D-TFR-5.02-0700.
References
- Aihara et al. (2022) Aihara, H., AlSayyad, Y., Ando, M., et al. 2022, PASJ, 74, 247, doi: 10.1093/pasj/psab122
- Becker et al. (1995) Becker, R. H., White, R. L., & Helfand, D. J. 1995, ApJ, 450, 559, doi: 10.1086/176166
- Briggs (1995) Briggs, D. S. 1995, in American Astronomical Society Meeting Abstracts, Vol. 187, American Astronomical Society Meeting Abstracts, 112.02
- Cardamone et al. (2009) Cardamone, C., Schawinski, K., Sarzi, M., et al. 2009, MNRAS, 399, 1191, doi: 10.1111/j.1365-2966.2009.15383.x
- Chowdhury et al. (2020) Chowdhury, A., Kanekar, N., Chengalur, J. N., Sethi, S., & Dwarakanath, K. S. 2020, Nature, 586, 369, doi: 10.1038/s41586-020-2794-7
- Dénes et al. (2014) Dénes, H., Kilborn, V. A., & Koribalski, B. S. 2014, MNRAS, 444, 667, doi: 10.1093/mnras/stu1337
- Duarte Puertas et al. (2017) Duarte Puertas, S., Vilchez, J. M., Iglesias-Páramo, J., et al. 2017, A&A, 599, A71, doi: 10.1051/0004-6361/201629044
- Elmegreen et al. (2012) Elmegreen, B. G., Malhotra, S., & Rhoads, J. 2012, ApJ, 757, 9, doi: 10.1088/0004-637X/757/1/9
- Fan et al. (2006) Fan, X., Carilli, C. L., & Keating, B. 2006, ARA&A, 44, 415, doi: 10.1146/annurev.astro.44.051905.092514
- Greisen (2003) Greisen, E. W. 2003, in Astrophysics and Space Science Library, Vol. 285, Information Handling in Astronomy - Historical Vistas, ed. A. Heck, 109
- Henry et al. (2015) Henry, A., Scarlata, C., Martin, C. L., & Erb, D. 2015, ApJ, 809, 19, doi: 10.1088/0004-637X/809/1/19
- Hibbard et al. (2001) Hibbard, J. E., van Gorkom, J. H., Rupen, M. P., & Schiminovich, D. 2001, in Astronomical Society of the Pacific Conference Series, Vol. 240, Gas and Galaxy Evolution, ed. J. E. Hibbard, M. Rupen, & J. H. van Gorkom, 657. https://arxiv.org/abs/astro-ph/0110667
- Izotov et al. (2016) Izotov, Y. I., Schaerer, D., Thuan, T. X., et al. 2016, MNRAS, 461, 3683, doi: 10.1093/mnras/stw1205
- Izotov et al. (2018a) Izotov, Y. I., Schaerer, D., Worseck, G., et al. 2018a, MNRAS, 474, 4514, doi: 10.1093/mnras/stx3115
- Izotov et al. (2018b) Izotov, Y. I., Worseck, G., Schaerer, D., et al. 2018b, MNRAS, 478, 4851, doi: 10.1093/mnras/sty1378
- Jaskot et al. (2019) Jaskot, A. E., Dowd, T., Oey, M. S., Scarlata, C., & McKinney, J. 2019, ApJ, 885, 96, doi: 10.3847/1538-4357/ab3d3b
- Jaskot & Oey (2013) Jaskot, A. E., & Oey, M. S. 2013, ApJ, 766, 91, doi: 10.1088/0004-637X/766/2/91
- Jaskot et al. (2017) Jaskot, A. E., Oey, M. S., Scarlata, C., & Dowd, T. 2017, ApJ, 851, L9, doi: 10.3847/2041-8213/aa9d83
- Jiang et al. (2019) Jiang, T., Malhotra, S., Yang, H., & Rhoads, J. E. 2019, ApJ, 872, 146, doi: 10.3847/1538-4357/aaee79
- Kanekar et al. (2021) Kanekar, N., Ghosh, T., Rhoads, J., et al. 2021, ApJ, 913, L15, doi: 10.3847/2041-8213/abfb76
- McKinney et al. (2019) McKinney, J. H., Jaskot, A. E., Oey, M. S., et al. 2019, ApJ, 874, 52, doi: 10.3847/1538-4357/ab08eb
- McMullin et al. (2007) McMullin, J. P., Waters, B., Schiebel, D., Young, W., & Golap, K. 2007, in Astronomical Society of the Pacific Conference Series, Vol. 376, Astronomical Data Analysis Software and Systems XVI, ed. R. A. Shaw, F. Hill, & D. J. Bell, 127
- Östlin et al. (2014) Östlin, G., Hayes, M., Duval, F., et al. 2014, ApJ, 797, 11, doi: 10.1088/0004-637X/797/1/11
- Pardy et al. (2014) Pardy, S. A., Cannon, J. M., Östlin, G., et al. 2014, ApJ, 794, 101, doi: 10.1088/0004-637X/794/2/101
- Renaud (2018) Renaud, F. 2018, New A Rev., 81, 1, doi: 10.1016/j.newar.2018.03.001
- Verhamme et al. (2017) Verhamme, A., Orlitová, I., Schaerer, D., et al. 2017, A&A, 597, A13, doi: 10.1051/0004-6361/201629264
- Yang et al. (2016) Yang, H., Malhotra, S., Gronke, M., et al. 2016, ApJ, 820, 130, doi: 10.3847/0004-637X/820/2/130
- Yang et al. (2017) —. 2017, ApJ, 844, 171, doi: 10.3847/1538-4357/aa7d4d