DoWhy-GCM: An extension of DoWhy for causal inference in graphical causal models
Abstract
We introduce DoWhy-GCM, an extension of the DoWhy Python library, that leverages graphical causal models. Unlike existing causality libraries, which mainly focus on effect estimation questions, with DoWhy-GCM, users can ask a wide range of additional causal questions, such as identifying the “root causes” of outliers and distributional changes, causal structure learning, attributing causal influences, and diagnosis of causal structures. To this end, DoWhy-GCM users first model cause-effect relations between variables in a system under study through a graphical causal model, fit the causal mechanisms of variables next, and then ask the causal question. All these steps take only a few lines of code in DoWhy-GCM.
The library is available at https://github.com/py-why/dowhy.
Keywords: Causal Inference, Graphical Causal Models, Causality Library
1 Introduction
An analysis of complex systems that goes beyond correlations is becoming increasingly important in modern data science (Peters et al., 2017; Pearl, 2009). In order to analyze a system and to understand the interaction between components, modeling their causal interactions is crucial. One of the wide-spread applications of causality is in effect estimation problems, where the goal is to estimate the effect of intervention on one variable on another (Imbens and Rubin, 2015; Rubin, 1974). But causal questions span beyond effect estimations (Janzing et al., 2020a; Budhathoki et al., 2021; Janzing et al., 2019b, 2020b). DoWhy-GCM offers causal inference capabilities beyond effect estimations, by leveraging graphical causal models (GCMs) (Pearl, 2009).
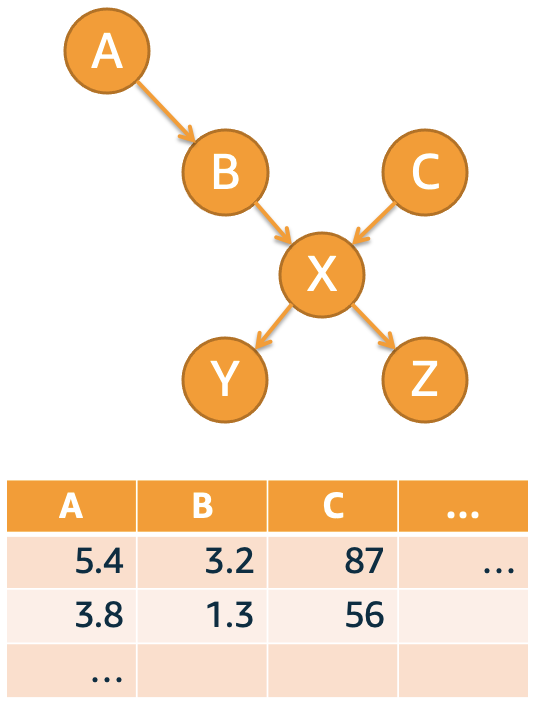
DoWhy-GCM is an extension of the DoWhy Python library (Sharma and Kiciman, 2020) that facilitates scientists and engineers to answer causal questions. To get started with DoWhy-GCM, users need to provide two objects: a directed acyclic graph (DAG) representing the causal relationships between variables in a system, and tabular observational data corresponding to the variables in the DAG (see Figure 1 left). The user then can fit a GCM and ask causal questions, such as quantifying cause-effect relationships beyond mediation analysis (Janzing et al., 2013, 2020c, 2020b), identifying root causes of outliers and distributional changes (Janzing et al., 2019b; Budhathoki et al., 2021) or perform what-if analysis, such as point- or population- level based estimations of complex interventions and counterfactuals (Pearl, 2009; Peters et al., 2017).
An often raised key question in graphical causal modeling is, “Where does the causal graph come from?”. Often, causal graphs are articulated as graphical constraints among variables, based on domain knowledge. However, domain knowledge may not always suffice to construct a full causal graph, especially in complex, high-dimensional settings. To assist users in such scenarios, the library also provides causal discovery algorithms which learn the causal structure between variables from observational data. Causal discovery, however, is a scientific field in its infancy and far from solving general use cases robustly.
Infrastructure-wise, the library has a modular design in order to facilitate the integration of third-party libraries. This way, we want to ensure that users are able to contribute their own algorithms, models or discovery methods. To enable this, we define certain minimal interface criteria to ensure compatibility with other parts of the library. For instance, this way a user can simply provide an implementation of a custom model if the functional relationship between variables is known. In its core, DoWhy-GCM is based on NumPy (Harris et al., 2020) and Pandas (Wes McKinney, 2010). While DoWhy-GCM comes with various native implementations of certain algorithms (e.g., PC-algorihtm, measuring causal influences, different independence tests etc.), it also provides several wrappers to popular existing third-party libraries for machine learning such as scikit-learn (Pedregosa et al., 2011) and SciPy (Virtanen et al., 2020).
2 General building blocks
DoWhy-GCM is based on graphical causal models, a formal framework developed by the Turing award winner Judea Pearl to model cause-effect relationships between variables in a system. A key ingredient of graphical causal models is the causal graph which represents the relationships among the observed variables, with an arrow from a cause to its effect. A causal graph is also a graphical blueprint of sequential data generation processes along the arrows. That is, each variable has its own data-generating process (also called its “causal mechanism”) that describes how its values are generated from the values of its parents. These processes are assumed to be modular, or autonomous, or invariant, i.e., we can independently change the causal mechanism of one variable without affecting the causal mechanisms of other variables in the system (see Peters et al. (2017, Ch. 2) for a review on the implications of modularity assumption in causal inference). In general, there are three key steps to answering a causal question using graphical causal models, which DoWhy-GCM embraces.
-
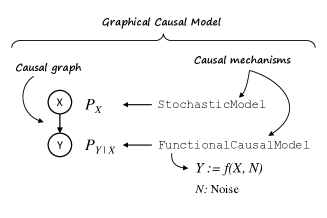
Model cause-effect relationships in a graphical causal model: The first step is to model the cause-effect relationships between variables relevant to the use case through a causal graph. To model this, any graph library can be used as long as it abides by our interface, e.g. networkx (Hagberg et al., 2008). In addition, we assign a causal mechanism at each node in the causal graph. In particular, a probabilistic causal mechanism of a node yields its conditional distribution given its parents. As a root node does not have any parents, we obtain its marginal distribution. A more refined model such as an additive noise model (ANM) (Hoyer et al., 2009) is also a probabilistic causal model. In an ANM, each node is a deterministic function of its observed parents in the causal graph, and an additive unobserved noise term that is independent of the observed parents. To illustrate this idea, let us use a simple causal graph (see Figure 1 right). This causal graph articulates our assumption that causes . If we were to assign probabilistic causal mechanism to and , we would obtain the marginal distribution for , and the conditional distribution for . We can also do that by assigning an ANM to and , wherein the structural assignments would follow: , and , where and are independent. Here, the values of and are sampled from their respective marginal distributions, which can be e.g. uniquely inferred in case of ANMs. In DoWhy-GCM, noises and can be represented by a probability distribution, whereas the function can be any prediction function (e.g., (non-)linear regression). While a user can always assign a data-generating process of their choice to each node in the causal graph, DoWhy-GCM also provides an API to automatically infer the causal mechanisms from observational data. We refer to the causal graph together with the causal mechanisms as a graphical causal model (GCM).
-
Fit the causal mechanisms: After assigning causal mechanisms to nodes in the causal graph, the next step is to learn the parameters of those mechanisms from data. We can skip this step, if we know the exact underlying causal mechanism. In fact, DoWhy-GCM allows users to provide their own “ground truth” causal mechanism. After this step, the GCM is ready for causal reasoning tasks.
-
Ask a causal question: Finally, we can now ask causal questions to the fitted GCM. To this end, DoWhy-GCM offers a wide range of causal queries for answering causal questions leveraging graphical causal models. The GCM object can be reused for various causal queries.
3 Code design
DoWhy-GCM follows the rules of functional programming, where algorithms are functions that, in most cases, expect a graphical causal model and other parameters as inputs, and returns a specific result. The main reasons for this is to avoid code delegation, code duplication, bookkeeping, being stateful or scalability issues in terms of an ever growing class API. In general, our design choices are guided by our main focus on causal questions. Whenever possible, we leverage existing libraries to avoid reinventing the wheel, e.g., we use networkx for graph-related operations, whereas NumPy and Pandas for data manipulation. We consider the following four points when designing the API.
-
Functional: We provide functions that operate on a GCM object instead of manipulating the GCM object. In other words, APIs for causal queries do not modify the GCM object.
-
Defaults: Whenever an operation requires the user to specify a parameter, we provide defaults if it is possible and sensible. For instance, we automatically infer an appropriate measure for attributing outliers to upstream nodes based on the type of data.
-
Convenience: Whenever possible, we provide convenience functions for the users to get started quickly with the library, and automatically infer parameters from data. For example, we provide the option to automatically assign the data-generating processes to nodes from observational data.
-
Inspection: We expose various components of causal models (e.g., prediction model, distribution) as public attributes, which helps users in debugging.
4 Functionality
DoWhy-GCM offers a wide range of causal questions. We broadly characterize them into two types.
-
Causal Discovery: Infer a causal graph given data, and domain knowledge if available.
-
Causal Reasoning: Infer quantitative causal insights given a causal graph.
We further characterize causal reasoning problems into four groups.
-
Graph Validation: Validate model assumptions, which could be the rejection of a graph structure or validating the types of assigned causal mechanisms.
-
Attribution: Attribute observed effects to its root causes, such as attributing outliers, causal influences or distributional changes to upstream nodes.
-
Effect Estimation: Estimate the causal effect of past treatment on a target variable of interest.
-
What-If: Predict the effect of interventions and compute counterfactuals. We support complex interventions beyond standard atomic interventions.
This wide range of features are possible in DoWhy-GCM because of graphical causal models. There are at least two reasons for this. First, we explicitly model the data-generating process of each node in a graphical causal model. Second, those processes are modular. Together, they allow us to explicitly model the propagation of causal influence in a modular fashion, which allows us to answer various causal questions. But this does not come for free. We need to estimate the entire joint distribution of the variables in the causal graph. To compensate for this, we introduce model class restrictions like additive noise or post non-linear models (Zhang and Hyvärinen, 2009), which we consider a good trade-off to avoid introducing strong inductive bias. DoWhy-GCM also offers several statistical tools, such as conditional and pairwise independence tests, estimation methods for KL divergence, and a generic framework for estimating Shapley values with arbitrary set functions.
5 Discussion
We presented DoWhy-GCM, an extension to DoWhy, that complements DoWhy’s existing feature set by adding features for graphical causal models. These models allow us to look at a system as a whole, not just the effect of one variable on another. That is, we model cause-effect relationships between all variables relevant for a use case into a causal graph, learn their causal mechanisms which are modeled by probabilistic models, and use such trained probabilistic models to answer different causal questions. The API is designed with a focus on modularity that allows an easy integration of custom models, algorithms or other third-party libraries. The computational complexity of the library varies across algorithms that provide causal answers. The scalability of these algorithms depends on the inference complexity of the models used, the number of variables in the causal graph, the sample size, or the structure of the causal graph. In contrast to other causality libraries such as EconML (Battocchi et al., 2019), cdt (Kalainathan and Goudet, 2019), DiCE (Mothilal et al., 2020), Tetrad (Ramsey et al., ), CausalNex (Beaumont et al., 2021) or WhyNot (Miller et al., 2020) that primarily focus on effect estimation, DoWhy-GCM offers additional features (e.g., for root cause analysis) and novel algorithms leveraging graphical causal models.
References
- Battocchi et al. (2019) Keith Battocchi, Eleanor Dillon, Maggie Hei, Greg Lewis, Paul Oka, Miruna Oprescu, and Vasilis Syrgkanis. EconML: A Python Package for ML-Based Heterogeneous Treatment Effects Estimation. https://github.com/microsoft/EconML, 2019. Version 0.x.
- Beaumont et al. (2021) Paul Beaumont, Ben Horsburgh, Philip Pilgerstorfer, Angel Droth, Richard Oentaryo, Steven Ler, Hiep Nguyen, Gabriel Azevedo Ferreira, Zain Patel, and Wesley Leong. CausalNex, 10 2021. URL https://github.com/quantumblacklabs/causalnex.
- Budhathoki et al. (2021) Kailash Budhathoki, Dominik Janzing, Patrick Bloebaum, and Hoiyi Ng. Why did the distribution change? In Arindam Banerjee and Kenji Fukumizu, editors, Proceedings of The 24th International Conference on Artificial Intelligence and Statistics, volume 130 of Proceedings of Machine Learning Research, pages 1666–1674. PMLR, 13–15 Apr 2021.
- Hagberg et al. (2008) Aric Hagberg, Pieter Swart, and Daniel S Chult. Exploring network structure, dynamics, and function using networkx. Technical report, Los Alamos National Lab.(LANL), Los Alamos, NM (United States), 2008.
- Harris et al. (2020) Charles R. Harris, K. Jarrod Millman, Stéfan J. van der Walt, Ralf Gommers, Pauli Virtanen, David Cournapeau, Eric Wieser, Julian Taylor, Sebastian Berg, Nathaniel J. Smith, Robert Kern, Matti Picus, Stephan Hoyer, Marten H. van Kerkwijk, Matthew Brett, Allan Haldane, Jaime Fernández del Río, Mark Wiebe, Pearu Peterson, Pierre Gérard-Marchant, Kevin Sheppard, Tyler Reddy, Warren Weckesser, Hameer Abbasi, Christoph Gohlke, and Travis E. Oliphant. Array programming with NumPy. Nature, 585(7825):357–362, September 2020. doi: 10.1038/s41586-020-2649-2. URL https://doi.org/10.1038/s41586-020-2649-2.
- Hoyer et al. (2009) P. Hoyer, D. Janzing, J. Mooij, J. Peters, and B Schölkopf. Nonlinear causal discovery with additive noise models. In D. Koller, D. Schuurmans, Y. Bengio, and L. Bottou, editors, Proceedings of the conference Neural Information Processing Systems (NIPS) 2008, Vancouver, Canada, 2009. MIT Press.
- Imbens and Rubin (2015) Guido W. Imbens and Donald B. Rubin. Causal Inference for Statistics, Social, and Biomedical Sciences: An Introduction. Cambridge University Press, 2015.
- Janzing et al. (2013) D. Janzing, D. Balduzzi, M. Grosse-Wentrup, and B. Schölkopf. Quantifying causal influences. Annals of Statistics, 41(5):2324–2358, 2013.
- Janzing et al. (2019a) D. Janzing, K. Budhathoki, L. Minorics, and P. Blöbaum. Causal structure based root cause analysis of outliers. arXiv:1912.02724, 2019a.
- Janzing et al. (2020a) D. Janzing, P. Blöbaum, and L. Minorics. Quantifying indirect causal influence via structure preserving interventions. arXiv:2007.00714, 2020a.
- Janzing et al. (2020b) D. Janzing, L. Minorics, and P. Bloebaum. Feature relevance quantification in explainable ai: A causal problem. In S. Chiappa and R. Calandra, editors, Proceedings of the Twenty Third International Conference on Artificial Intelligence and Statistics, volume 108 of Proceedings of Machine Learning Research, pages 2907–2916, Online, 26–28 Aug 2020b. PMLR.
- Janzing et al. (2019b) Dominik Janzing, Kailash Budhathoki, Lenon Minorics, and Patrick Blöbaum. Causal structure based root cause analysis of outliers, 2019b.
- Janzing et al. (2020c) Dominik Janzing, Patrick Blöbaum, Lenon Minorics, and Philipp Faller. Quantifying causal contribution via structure preserving interventions. 2020c. URL https://arxiv.org/abs/2007.00714.
- Kalainathan and Goudet (2019) Diviyan Kalainathan and Olivier Goudet. Causal discovery toolbox: Uncover causal relationships in python, 2019. URL https://arxiv.org/abs/1903.02278.
- Miller et al. (2020) John Miller, Chloe Hsu, Jordan Troutman, Juan Perdomo, Tijana Zrnic, Lydia Liu, Yu Sun, Ludwig Schmidt, and Moritz Hardt. Whynot, 2020. URL https://doi.org/10.5281/zenodo.3875775.
- Mothilal et al. (2020) Ramaravind K Mothilal, Amit Sharma, and Chenhao Tan. Explaining machine learning classifiers through diverse counterfactual explanations. In Proceedings of the 2020 Conference on Fairness, Accountability, and Transparency, pages 607–617, 2020.
- Pearl (2009) J. Pearl. Causality: Models, Reasoning, and Inference. Cambridge University Press, New York, NY, 2nd edition, 2009.
- Pedregosa et al. (2011) F. Pedregosa, G. Varoquaux, A. Gramfort, V. Michel, B. Thirion, O. Grisel, M. Blondel, P. Prettenhofer, R. Weiss, V. Dubourg, J. Vanderplas, A. Passos, D. Cournapeau, M. Brucher, M. Perrot, and E. Duchesnay. Scikit-learn: Machine learning in Python. Journal of Machine Learning Research, 12:2825–2830, 2011.
- Peters et al. (2017) J. Peters, D. Janzing, and B. Schölkopf. Elements of Causal Inference – Foundations and Learning Algorithms. MIT Press, 2017.
- (20) Joseph D Ramsey, Kun Zhang, Madelyn Glymour, Ruben Sanchez Romero, Biwei Huang, Imme Ebert-Uphoff, Savini Samarasinghe, Elizabeth A Barnes, and Clark Glymour. Tetrad—a toolbox for causal discovery.
- Rubin (1974) D. B. Rubin. Estimating causal effects of treatments in randomized and nonrandomized studies. Journal of Educational Psychology, 66:688–701, 1974.
- Sharma and Kiciman (2020) Amit Sharma and Emre Kiciman. Dowhy: An end-to-end library for causal inference, 2020. URL https://arxiv.org/abs/2011.04216.
- Virtanen et al. (2020) Pauli Virtanen, Ralf Gommers, Travis E. Oliphant, Matt Haberland, Tyler Reddy, David Cournapeau, Evgeni Burovski, Pearu Peterson, Warren Weckesser, Jonathan Bright, Stéfan J. van der Walt, Matthew Brett, Joshua Wilson, K. Jarrod Millman, Nikolay Mayorov, Andrew R. J. Nelson, Eric Jones, Robert Kern, Eric Larson, C J Carey, İlhan Polat, Yu Feng, Eric W. Moore, Jake VanderPlas, Denis Laxalde, Josef Perktold, Robert Cimrman, Ian Henriksen, E. A. Quintero, Charles R. Harris, Anne M. Archibald, Antônio H. Ribeiro, Fabian Pedregosa, Paul van Mulbregt, and SciPy 1.0 Contributors. SciPy 1.0: Fundamental Algorithms for Scientific Computing in Python. Nature Methods, 17:261–272, 2020. doi: 10.1038/s41592-019-0686-2.
- Wes McKinney (2010) Wes McKinney. Data Structures for Statistical Computing in Python. In Stéfan van der Walt and Jarrod Millman, editors, Proceedings of the 9th Python in Science Conference, pages 56 – 61, 2010. doi: 10.25080/Majora-92bf1922-00a.
- Zhang and Hyvärinen (2009) K. Zhang and A. Hyvärinen. On the identifiability of the post-nonlinear causal model. In Proceedings of the 25th Conference on Uncertainty in Artificial Intelligence, Montreal, Canada, 2009.