A Wide and Deep Exploration of Radio Galaxies with Subaru HSC (WERGS). VII.
Redshift Evolution of Radio Galaxy Environments at
Abstract
We examine the redshift evolution of density environments around 2,163 radio galaxies with the stellar masses of between redshifts of , based on the Hyper Suprime-Cam Subaru Strategic Program (HSC-SSP) and Faint Images of the Radio Sky at Twenty-cm (FIRST). We use the -nearest neighbor method to measure the local galaxy number density around our radio galaxy sample. We find that the overdensities of the radio galaxies are weakly but significantly anti-correlated with redshift. This is consistent with the known result that the relative abundance of less-massive radio galaxies increases with redshift, because less-massive radio galaxies reside in relatively low density regions. Massive radio galaxies with stellar mass of are found in high density environments compared with the control sample galaxies with radio-non-detection and matched-stellar-mass. Less-massive radio galaxies with reside in average density environments. The fraction of the radio galaxies associated with the neighbors within a typical major merger scale, kpc, is higher than (comparable to) that of the control galaxies at (). We also find that the local densities around the radio galaxies are anti-correlated with the radio luminosities and black hole mass accretion rates at fixed stellar mass. These findings suggest that massive radio galaxies have matured through galaxy mergers in the past, and have supermassive black holes whose mass accretion almost ceased at , while less-massive radio galaxies undergo active accretion just at this epoch, as they have avoided such merger events.
1 INTRODUCTION
Radio galaxies host active galactic nuclei (AGNs) that launch strong radio jets/lobes, which are expected to affect the star formation not only in the host halo but also the surrounding halos (Morganti et al., 2005; McNamara & Nulsen, 2007; Bîrzan et al., 2008; Shabala et al., 2011; Yuan et al., 2016; Nesvadba et al., 2017). Thus, in order to understand galaxy formation and evolution throughout the history of the universe, it is key to understand how/where radio galaxies appear.
In the local Universe, radio galaxies are often found in rich environments, such as galaxy overdense regions or massive halos (e.g., Peacock & Nicholson, 1991; Magliocchetti et al., 2004; Venturi et al., 2007). This fact is qualitatively consistent with radio jet/lobe triggering mechanism, Blandford Znajek process (Blandford & Znajek, 1977). According to this process, the radio jet/lobe luminosity is a monotonically increasing function of black hole mass and spin which are built up by galaxy mergers (e.g., Fanidakis et al., 2011). Thus, radio galaxies are likely to easily appear in galaxy overdense regions, where galaxy mergers had been frequently experienced.
The galaxy overdensities around radio galaxies depend on their types significantly (Ramos Almeida et al., 2013; Ching et al., 2017). Radio galaxies can be divided into two types, high-excitation radio galaxies (HERGs) and low-excitation radio galaxies (LERGs). HERGs have strong radiation from accretion disk, caused by quasar mode accretion (Bower et al., 2006; Croton et al., 2006). This accretion channel dominantly occurs in the dark matter halos whose masses are (Orsi et al., 2016). On the other hand, LERGs appear through relatively slow mass accretion onto supermassive black hole (SMBH), and are hosted by more massive halos than HERGs (Turner & Shabala, 2015; Orsi et al., 2016). At , LERGs are observed to reside in galaxy denser regions than HERGs significantly (Ramos Almeida et al., 2013; Ching et al., 2017). HERGs are also reported to have lower stellar masses than LERGs on average (Ching et al., 2017).
The overdensities around radio galaxies are expected to depend on the age of the universe. The relative abundance of HERGs in radio galaxies is observed to increase with redshift in the range of (Donoso et al., 2009). The abundance of radio AGNs hosted by star forming galaxies or less massive () galaxies is reported to rise with redshift (Delvecchio et al., 2018). Delvecchio et al. (2018) found that the radiatively-efficient accretion in radio AGN becomes to be dominant at , suggesting the increase of the proportion of less-massive HERGs at this epoch. These facts imply that radio galaxies do not reside in the most overdense regions, on average, at . Thus, it is key to examine the redshift evolution of the galaxy densities around radio galaxies over the wide stellar mass range, up to .
Unfortunately, the redshift evolution of the radio galaxy environments are still shrouded in a deep fog. Kolwa et al. (2019) found that radio AGN, on average, reside in the overdense regions at by using the data of GHz Very Large Array (VLA) survey and the Sloan Digital Sky Survey (SDSS) Stripe 82 (Heywood et al., 2016). That wide coverage over deg2 allows us to characterize the radio galaxy environments statistically. However, the radio AGN sample and also the surrounding galaxy sample is biased toward massive galaxies () due to the shallowness of the survey ( and ). Malavasi et al. (2015) found that radio AGN always are located in rich and dense environments up to in the Cosmological Evolution Survey (COSMOS) field whose survey area is deg2. This small area survey could miss rare objects and make a sparse redshift distribution that is insufficient to investigate the redshift evolution.
The data of a Wide and Deep Exploration of Radio Galaxies with Subaru HSC (WERGS, Yamashita et al., 2018; Toba et al., 2019; Yamashita et al., 2020; Ichikawa et al., 2021; Uchiyama et al., 2021) can overcome the difficulties. WERGS is the wide optical counterpart survey of radio galaxies with the optical depth down to . This project is based on the wide and deep optical imaging data (Aihara et al., 2018) produced by Subaru/Hyper Suprime-Cam Subaru Strategic Program (HSC-SSP) survey and the 1.4 GHz radio continuum catalog of the Faint Images of the Radio Sky at Twenty-cm survey using VLA (“FIRST”; Becker et al., 1995; Helfand et al., 2015). The combination of these survey can make the statistical radio galaxy sample with a wide stellar mass range of at .
In this paper, we examine the redshift evolution of radio galaxy environments up to , by using the data of WERGS. The radio galaxy sample is extracted from WERGS data. We also construct the control galaxy sample covering similar stellar masses and redshifts, but without radio detections. We can refer to the possible relation between the density environments and the radio jets, by comparing the radio galaxies with the control ones. The dependency of the density environments on their stellar masses are also investigated.
The paper is organized as follows. In section 2, we describe the data of HSC-SSP, FIRST and WERGS. The construction of the radio galaxy and control galaxy samples is also described. In section 3, the method to measure the local densities around radio and control galaxies is explained. The results of the redshift evolution of the radio galaxy environments and the possible dependency of the local densities on the stellar masses of the galaxies are shown in section 4. The implications of our results are discussed in section 5. Finally, in section 6 we summarize our findings. We assume the following cosmological parameters: , , km s-1 Mpc-1, and magnitudes are given in the AB system.
2 DATA AND SAMPLE
2.1 Data
The Subaru HSC-SSP survey (Aihara et al., 2018; Kawanomoto et al., 2017; Komiyama et al., 2018; Furusawa et al., 2018; Bosch et al., 2018; Ivezic et al., 2008; Axelrod et al., 2010; Jurić et al., 2015; Schlafly et al., 2012; Tonry et al., 2012; Magnier et al., 2013) is an unprecedented deep-and-wide optical survey using HSC with 116 2K 4K Hamamatsu fully-depleted CCDs and the field-of-view of 1.∘5 diameter (Miyazaki et al., 2012, 2018). In this present study, we use the “wide layer” data of DR S16A (Aihara et al., 2018), which consists of wide field image of deg2 with a median seeing of and is taken by the five optical filters of -bands. The limiting magnitudes of -bands for point sources measured in arcsec apertures are expected to be , , , , and , respectively. We use cModel magnitudes, which are measured by fitting two components that are PSF-convolved galaxy models (de Vaucouleurs and exponential) to the source profile (Abazajian et al., 2004).
The survey area of VLA FIRST is deg2, and cover the HSC-SSP survey area. The images produced have a typical root-mean-square photometric noise of 0.15 mJy. The angular resolution of the FIRST survey is 5.4 arcsec.
2.2 Sample
2.2.1 WERGS
We describe the key steps of the construction of the WERGS radio source catalog (Yamashita et al., 2018).
The HSC-SSP sources were extracted from the wide layer data of HSC-SSP. The edge of each independent field was masked because the limiting magnitudes at the edges are relatively shallower than those in the central regions. The HSC-SSP flags summarized in Yamashita et al. (2018) were imposed for the sources to remove fake detections. The signal to noise ratio () for the -bands were required to be greater than five. As a result, 23,795,523 sources were found in the effective area of 154 deg2 (hereinafter referred to as “HSC sources”).
The HSC-FIRST sample was constructed by matching the HSC sources with the FIRST sources. The FIRST sources with mJy radio flux and the of were extracted from the final release FIRST catalog (Helfand et al., 2015). Here, is a probability that the source is a side lobe of a nearby bright source. 7,072 FIRST radio sources were found in the HSC-SSP wide layer. Then, the radio sources were matched with HSC sources using a search radius of arcsec, which is the separation where the contamination rate and completeness function intersect. The contamination rate and the completeness were estimated to be % and %, respectively. As a result, 3,579 HSC-FIRST sources were found in the wide layer (Yamashita et al., 2018).
2.2.2 Radio galaxies
We extract radio galaxies from the HSC-FIRST sources using the rest-frame 1.4 GHz luminosities, [W Hz-1] according to Ichikawa et al. (2021). The of the HSC-FIRST sources were calculated to be W Hz-1 assuming a radio spectral index of with the form of (Yamashita et al., 2018). The redshift of each source is calculated using the photo- calculated by Mizuki spectral energy distribution (SED) fitting code (Tanaka et al., 2018). We use only the HSC-FIRST sources with W Hz-1. This luminosity cut can effectively split radio galaxies and star forming galaxies (e.g., Condon et al., 2013). Point sources are excluded as quasars using the same method as Yamashita et al. (2018). This reduces the number of the sources to 2,918.
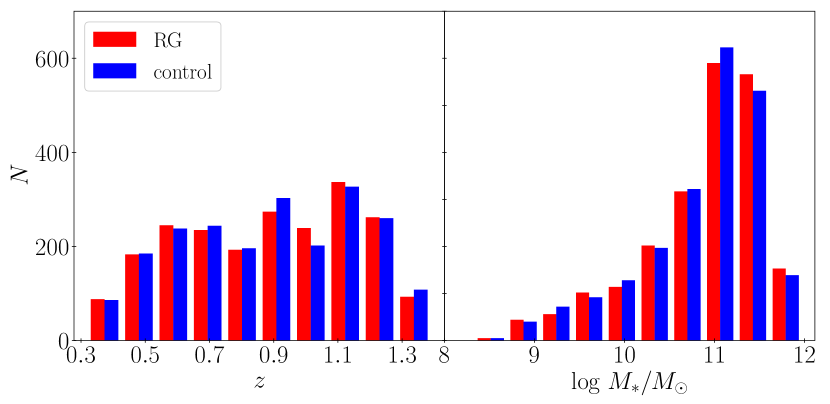
At least one of the HSC filters can detect the flux at the bluer or redder side of the Balmer break wavelength of the sources at (e.g., Ishikawa et al., 2020). For the photo- accuracy, we select galaxies with photo- error and reduced square , based on Yamashita et al. (2018), Toba et al. (2019), and Ichikawa et al. (2021). As a result, we obtain 2,163 radio galaxy candidates at (hereinafter referred to as “radio galaxies”). The radio galaxies have stellar masses, [], of estimated in the Mizuki SED fitting code. The redshift and stellar mass distributions of the radio galaxies are shown in Figure 1.
2.2.3 & matched control sample
A control galaxy sample without radio emission is constructed to compare the environments at between radio galaxies and radio-quiet galaxies. First, we impose the same photo- conditions as the radio galaxies on the HSC sources. Then, we extract HSC sources (hereinafter, “control galaxies””) that have the same redshift and stellar mass as each radio galaxy but have no detection in FIRST. The absolute values of the difference in redshift and stellar mass between a radio galaxy and a corresponding control galaxy, and [], obey the conditions and , respectively. and [] are the errors of the redshift and stellar mass of the radio galaxy, respectively. If multiple control galaxies are selected for a radio galaxy, one control galaxy is randomly selected. We confirm that there is at least one corresponding control galaxy for each radio galaxy. As a result, 2,163 control galaxies are selected.
Figure 1 shows the stellar mass and redshift distributions of the control galaxies. There is no difference in the distributions between the radio and control galaxy samples statistically. The - and -values for the redshift (stellar mass) distribution between the radio and control galaxies are (0.03) and (0.18) in the Kolmogorov-Smirnov test, respectively.
2.2.4 Galaxies for density measurements
We construct a galaxy sample to be used in measuring the density environments around the radio and control galaxies. The same photo- conditions are imposed on the HSC sources as on the radio galaxies. We use photo- sources with the stellar masses of . The stellar mass cut corresponds to the % completeness limit of the stellar mass functions at in the Cosmic Evolution Survey (COSMOS) field (Ishikawa et al., 2020). As a result, we obtain 2,080,217 galaxies at for density measurement (hereinafter referred to as “density galaxies”).
| radio galaxy | control galaxy | |||
|---|---|---|---|---|
| overdensity | aaCorrelation coefficient of Spearman rank correlation test. | bb-value of Spearman rank correlation test. | aaCorrelation coefficient of Spearman rank correlation test. | bb-value of Spearman rank correlation test. |
| 0.80 | ||||
| 0.96 | ||||
| 0.81 | ||||
| overdensity | aaCorrelation coefficient of Spearman rank correlation test. | bb-value of Spearman rank correlation test. | aaCorrelation coefficient of Spearman rank correlation test. | bb-value of Spearman rank correlation test. | aaCorrelation coefficient of Spearman rank correlation test. | bb-value of Spearman rank correlation test. | aaCorrelation coefficient of Spearman rank correlation test. | bb-value of Spearman rank correlation test. |
|---|---|---|---|---|---|---|---|---|
| radio galaxy | ||||||||
| 0.24 | 0.31 | 0.30 | 0.27 | |||||
| 0.21 | 0.34 | 0.29 | 0.22 | |||||
| 0.24 | 0.29 | 0.28 | 0.21 | |||||
| control galaxy | ||||||||
| 0.16 | 0.032 | 0.074 | 0.061 | 0.093 | 0.016 | 0.14 | ||
| 0.13 | 0.078 | 0.11 | 0.11 | 0.16 | ||||
| 0.077 | 0.30 | 0.094 | 0.017 | 0.12 | 0.16 | |||
2.3 Radio galaxy with IR photometry
IR photometry for our radio sample is taken from Toba et al. (2019). The CIGALE (Code Investigating GALaxy Emission; Burgarella et al., 2005; Noll et al., 2009; Boquien et al., 2019) SED fitting with the stellar, star formation, AGN, and radio components was conducted for the HSC sources in Toba et al. (2019). The IR data used in the SED fitting comprises of data from the VISTA Kilo-degree Infrared Galaxy Survey (VIKING; Arnaboldi et al., 2007), the Wide-field Infrared Survey Explorer (WISE; Wright et al., 2010), and the Herschel Space Observatory (Pilbratt et al., 2010) Astrophysical Terahertz Large Area Survey (H-ATLAS; Eales et al., 2010). In the SED fitting, the photometric redshift estimated by photo- Mizuki code (Tanaka et al., 2018) was used.
The physical quantities we use in this study are obtained by transforming the quantities obtained from the SED fitting. The bolometric AGN luminosity, [], can be obtained through the bolometric correction for the IR luminosity [] obtained by the SED fitting; (Delvecchio et al., 2014; Inayoshi et al., 2018; Ichikawa et al., 2021). The specific black hole mass accretion rate ( [erg s-1 ]) is defined as (e.g., Mullaney et al., 2012; Ichikawa et al., 2021). is good indicator of the Eddington ratio () according to the relation (Magorrian et al., 1998; Marconi & Hunt, 2003). According to Ichikawa et al. (2021), can be expressed by a function of and :
| (1) |
assuming (Kormendy & Ho, 2013). The number of the radio galaxies with and is found to be 1257 (hereinafter, we call the subsample to “IR radio galaxies”).
3 Measurement of galaxy environment
We use the -nearest neighbor method to measure the local density environments of the radio galaxies and control galaxies. The details of the method are as follows.
The local density of a radio/control galaxy, [pkpc-2], is estimated through the following equation.
| (2) |
where, [pkpc] is the projected distance from a radio/control galaxy to the -th nearest density galaxy within the redshift range of [] (Lai et al., 2016), where and are the redshift and its error of the radio/control galaxy, respectively. Lai et al. (2016) demonstrated that when the photometric redshift error of a galaxy is employed as a redshift slice, the measured overdensity of a galaxy sample with photometric redshifts can best trace the true one. In the calculation of the local density (2), we correct it by the fraction of the non-masked projected area within a circle around a radio/control galaxy with a radius [pkpc]. Then, the overdensity () for a radio/control galaxy is defined by
| (3) |
where, [pkpc-2] is the median local density of photo- galaxies within the same redshift range as the radio/control galaxy. If is higher than unity, the density around radio galaxies is overdense compared to field. We choose the overdensities with , 2, and to compare the local densities in between different physical scales. By using the defined local densities, we examine their redshift evolution up to .
The medians of the projected distances are about , , and pkpc for , 2 and for the radio galaxy sample, respectively. It is important to compare the projected distance to the nearest neighbor, , with the typical major merger scale pkpc (Larson et al., 2016). This comparison could allow us to understand whether the triggering of radio galaxies is associated with major mergers or not (section 5.1).
4 RESULTS
4.1 Redshift evolution of density environments
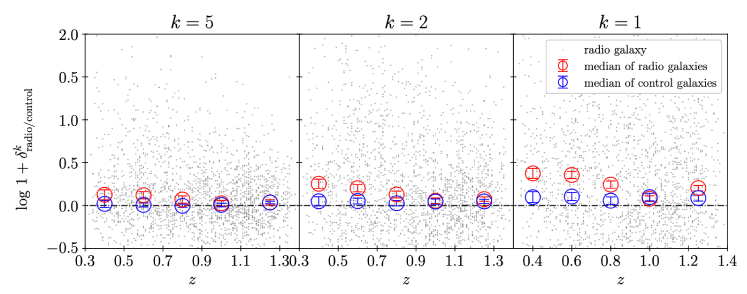
We show the measured overdensities of the radio galaxy sample and the control galaxy one as a function of redshift in Figure 2. We find that at the median for all is significantly higher than unity. The excess decreases as increases. These suggest that the radio galaxies at , on average, reside in galaxy overdense compact regions. On the other hand, at , the median overdensities of the radio galaxies are close to unity for all . These results suggest that the ambient densities of the radio galaxies are negatively correlated with redshift. The Spearman rank correlation test supports this negative correlation. The results of the test are summarized in Table 1.
For the stellar-mass-matched control sample, the overdensities for all are confirmed to be, on average, around unity over all the redshifts that we investigate. This suggests that the radio jet launches are related with the galaxy overdensities.
4.2 Dependence of the overdensities on the stellar masses
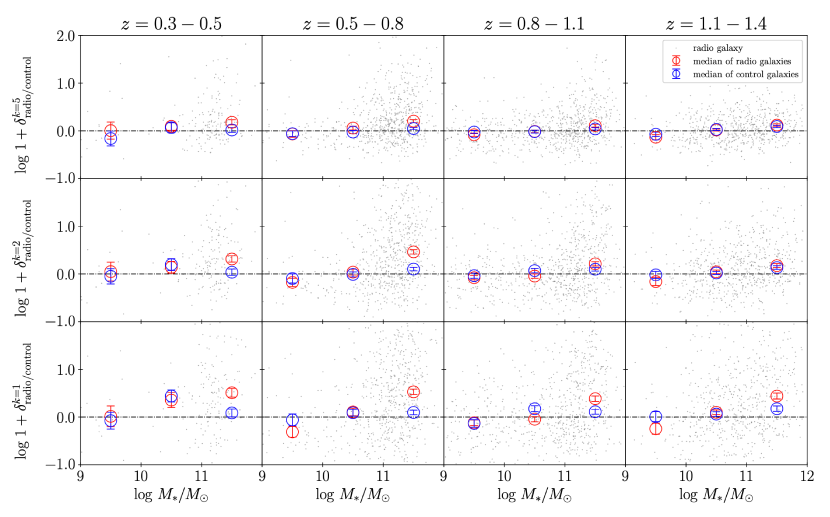
The dependence of the overdensities of the radio galaxies on their stellar masses is shown in Figure 3. We divide the radio/control galaxies into four subsamples with , , , and , in order to exclude the redshift dependency on the overdensities. At the low stellar mass regime (log ), the median overdensities of the radio and control galaxies are comparable, and are around unity for all . The control galaxies reside in the high density regions in the high stellar mass regime of log . The ambient densities of radio galaxies are, on average, significantly higher than those of the control galaxies at log for the case of . The positive correlations between stellar mass and density are found to be significant using the Spearman rank correlation test as summarized in the Table 2. The overdensities of the radio galaxies are more strongly correlated with the stellar masses compared to the control ones. This overdensity excess decreases for and . There are no significant differences of the overdensities and between the radio and control galaxies at .
We can compare our findings with previous studies. Kolwa et al. (2019) found that massive radio AGNs, on average, reside in the kpc-scale overdense regions. Malavasi et al. (2015) studied the environments of the radio AGNs with by the deep but narrow survey in the COSMOS field and found that the radio AGNs reside in high density regions compared to the non-radio sources with the same stellar masses. These results are consistent with our result of the massive radio galaxies.
5 Discussion
5.1 Redshift evolution of radio galaxy environments
We found the weak and negative correlation of the overdensity of the radio galaxies with redshift at . At , the radio galaxies on average reside in the galaxy overdense regions, while at , the overdensities of the radio galaxies approach to be around unity. Kolwa et al. (2019) found that at , radio AGNs exist in the overdense regions. We, for the first time, have given a statistical insight that the overdensities of radio galaxies tend to decrease with redshift at .
This can be explained by the increase of the relative abundance of less-massive HERGs with redshift, assuming that the local observational result that the less-massive HERGs reside in the relatively low dense regions compared to massive LERGs (Ching et al., 2017) is valid at . In fact, Donoso et al. (2010) found that the proportion of less-massive HERGs increases with redshift. Delvecchio et al. (2018) also suggested that at the accretion disk of radio AGN tend to be radiatively efficient. This means the increase of the population of HERGs in radio galaxies beyond . In our WERGS radio galaxy sample, the radio galaxies with high , that is, HERG-like galaxies are dominantly distributed at (Toba et al., 2019; Ichikawa et al., 2021). The stellar masses of the radio galaxies are also found to be significantly anti-correlated with redshift. The correlation coefficient, , and -value in the Spearman rank correlation test are and , respectively. These results suggest that the relative abundance of less-massive HERGs in the radio galaxy sample is high at , and thus, the overdensities of the radio galaxies tend to decrease with redshift.


| overdensity | aaCorrelation coefficient of Spearman rank correlation test. | bb-value of Spearman rank correlation test. | aaCorrelation coefficient of Spearman rank correlation test. | bb-value of Spearman rank correlation test. | aaCorrelation coefficient of Spearman rank correlation test. | bb-value of Spearman rank correlation test. | aaCorrelation coefficient of Spearman rank correlation test. | bb-value of Spearman rank correlation test. |
|---|---|---|---|---|---|---|---|---|
| 0.89 | ||||||||
| 0.027 | ||||||||
| 0.087 | 0.023 | |||||||
| 0.12 | 0.061 | 0.028 | ||||||
| 0.023 | ||||||||
5.2 Dependence of the density environments on the SMBH states of radio galaxies
Ching et al. (2017) reported that HERGs tend to reside in the lower density regions compared to LERGs at . If this result is valid even at , this implies that the ambient densities of the radio galaxies are anti-correlated with the radio luminosities and the mass accretions onto their SMBHs, because HERGs have high SMBH accretion rates and radio luminosities compared to LERGs (e.g., Heckman & Best, 2014; Miraghaei & Best, 2017). In this subsection, we discuss the possible correlation between the ambient environments and such AGN states of radio galaxies at higher-.
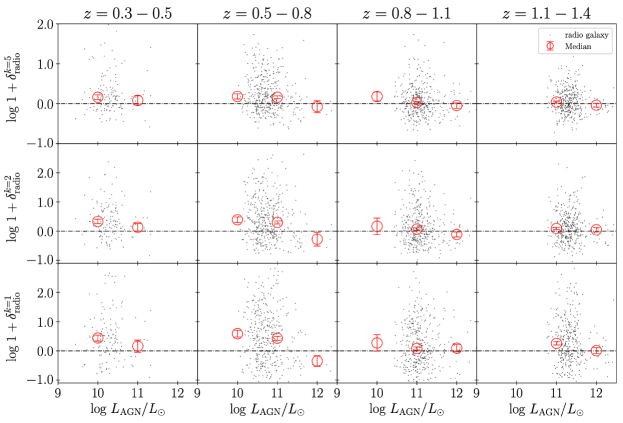
Figure 4 shows the overdensity of the IR radio galaxies as a function of the bolometric AGN luminosity . Objects with higher have higher mass accretion on their SMBHs. The overdensities with all , on average, tend to be higher than unity at the faint-end regime of the AGN luminosities. As the AGN luminosities increase, the overdensities decrease and eventually reach around unity at all the redshift bins. However, these relations are not significant according to the Spearman rank correlation test (Table 3).
Note that the AGN luminosities strongly depends on the black hole masses (e.g., Woo & Urry, 2002) and thus, the stellar masses. In order to capture the mass accretion rate onto SMBH, we should use the AGN luminosities normalized with the stellar masses (that is, ). Figure 5 shows the relation between the overdensities and of the IR radio galaxies. Both are negatively correlated with each other. The weak but significant negative correlation between the and overdensities is guaranteed by the result of the Spearman rank correlation test (Table 3). At the low regime, the overdensities are, on average, significantly higher than unity. On the other hand, at the high regime, the overdensities of the IR radio galaxies are comparable to be around unity. The fraction of the IR radio galaxies with tend to increase with redshift ( % at , and % at ).
We further examine the dependence of the overdensities on the radio luminosities, , which can trace the radio jet power (e.g., Fanidakis et al., 2011). As shown in Figure 6, no correlation between the overdensities and radio luminosities are found. No significant correlation between them is also found by the Spearman rank correlation test (Table 3). This is consistent with the result of Kolwa et al. (2019) who found no correlation between the surrounding densities and radio luminosities of radio galaxies at .
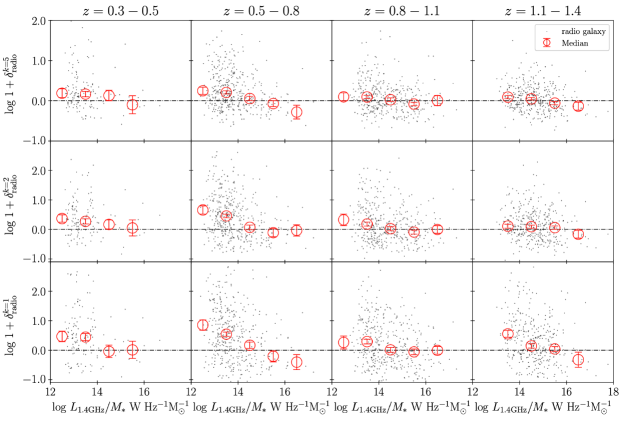
As is the case of the AGN luminosity, the radio luminosity depends on the black hole mass and thus stellar mass (e.g., Fanidakis et al., 2011). In order to separate HERGs and LERGs in the radio luminosity space more effectively, the radio luminosity should be normalized with the stellar mass (e.g., Miraghaei & Best, 2017). Figure 7 shows the relation between the overdensities and normalized radio luminosities [W Hz-1 ] of the radio galaxies. The radio galaxies with the faint-end normalized radio luminosities, on average, tend to reside in the overdense regions. The surrounding densities of the radio galaxies tend to decrease as the normalized radio luminosities increase. The local overdensities of the bright-end radio galaxies converge to unity or less than unity. The Spearman rank correlation test proposes a significant negative correlation between the normalized radio luminosities and the overdensities of the radio galaxies as summarized in Table 3.
To summarize, the radio galaxies with low mass accretion and low radio luminosity tend to reside in galaxy overdensity regions, on average, at fixed stellar mass. These findings are qualitatively consistent with the result at found by Ching et al. (2017) that LERGs reside in the higher density regions compared to HERGs. Our results suggest that the correlation of the SMBHs and ambient densities of radio galaxies are guaranteed up to . The anti-correlation between the radio jet luminosities and surrounding densities of the radio galaxies is also consistent with the theoretical model of radio jets proposed by Kawakatu et al. (2009), if the core matter densities of the radio galaxies are correlated with the surrounding galaxy densities. This model shows that if the matter densities in the core of the radio galaxies are relatively high, the radio jets launched from the radio galaxies cannot expand beyond host halo due to the energy loss of the radio jets by the interaction with the surrounding matters. This would result in the LERG-like radio galaxies.
5.3 Triggering of radio galaxy and role of the local environment
Triggering of radio galaxy is closely associated with the local density environment (e.g., Kolwa et al., 2019). Especially, the distance to the nearest neighbor can be a good measure to diagnose whether radio galaxy triggering is linked with galaxy mergers or secular process (Ching et al., 2017). In this subsection, we examine if of the radio galaxies are typical major merger scale, and discuss whether the radio galaxies are powered by mergers.
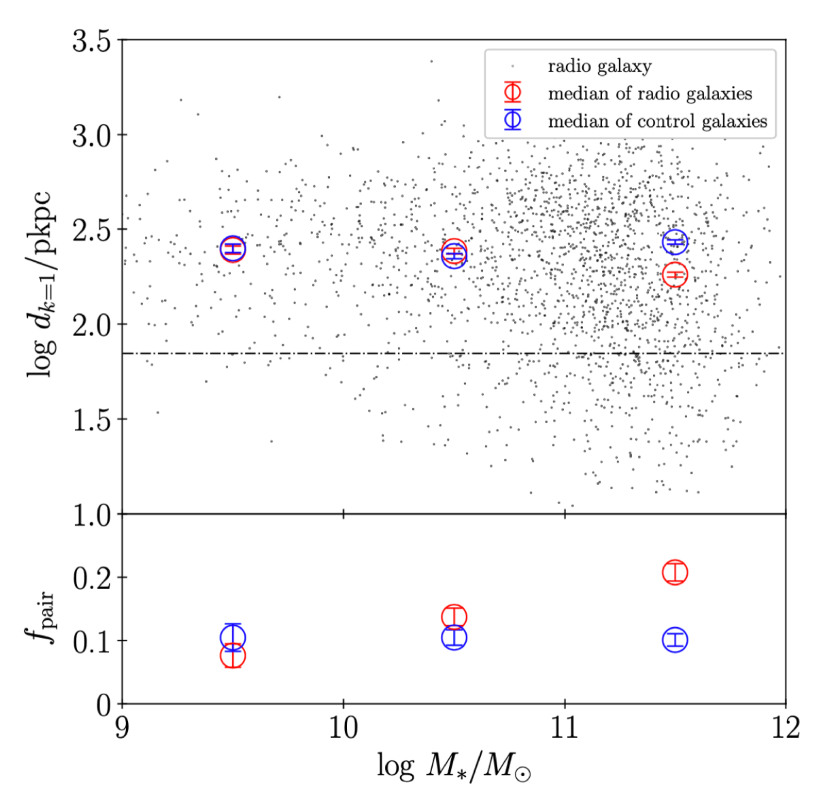
In section 4.2, we found that the massive radio galaxies with log reside in high density regions compared to control galaxies. The density enhancements around radio galaxies are most prominent when . These facts suggest that the projected distances from the radio galaxies to the nearest neighbors, , are, on average, small compared to the control galaxies at the massive-end. Upper panel in Figure 8 shows the dependence of of the radio and control galaxies on the stellar masses. We find that the median of the radio galaxies is significantly smaller than that of the control galaxies at the stellar mass regime of log .
We define the pair fraction, , where is the number of the radio/control galaxies with pkpc, which corresponds to the separation of two galaxies at the beginning of a major merger (Larson et al., 2016), and is the total number of the radio or control galaxies in a given stellar mass regime of log . Lower panel in Figure 8 shows the pair fraction for the stellar masses of the radio and control galaxies. The pair fraction is estimated to be which is comparable to the results of previous studies at this epoch (e.g. Lotz et al., 2011). We find that the pair fraction of radio galaxies is significantly higher than that of the control galaxies at log . This suggests that the triggering of a significant fraction of massive-end radio galaxies is associated with galaxy mergers. The values of and for each stellar mass are summarized in Table 4.
Less massive radio galaxies appear to have a different triggering mechanism to the higher mass radio galaxies, because in log the pair fraction and (or local densities) of the less-massive radio galaxies are comparable to those of the control galaxies within error (Figure 8, and section 4.2). We also found that in section 5.2, the radio galaxies with high black hole accretion rates tend to reside in the low-density regions. These findings imply that high mass accretions onto SMBHs of less-massive radio galaxies occur, regardless of the richness of the associated environments. This is consistent with a recent result of Davis et al. (2022) who studied radio AGN hosted by dwarf galaxies at by combining HSC and Low-Frequency Array (LOFAR) data. Davis et al. (2022) found that the ignitions of AGN in dwarf galaxies come from self-interactions, not from interactions with its surroundings.
Our findings imply that massive radio galaxies have experienced galaxy mergers in the past, have already grown up by , and then at , the mass accretions onto SMBHs have almost ceased, because galaxy merger rate is expected to increase with stellar mass and redshift (e.g., Hopkins et al., 2010). Less-massive radio galaxies, on the other hand, are expected to have avoided merger events and are beginning to undergo active accretion just at . According to recent simulations (e.g., Bower et al., 2017; Habouzit et al., 2017), the reservoir gas stored in less-massive galaxy is expected to be easily blown off and carried beyond the host halo by star formation pressures. Such negative feedback prevents the gas from falling into the central SMBH, and causes “galaxy grows first, BH comes later” phase (e.g., Ichikawa et al., 2021). This phase is expected to continue until the stellar mass reaches critical one (; Bower et al., 2017; Habouzit et al., 2017). Once the stellar mass approaches to critical one, the negative feedback no longer has enough energy to blow the gas beyond the host halo. Then, the active mass accretion to the central SMBH can begin. Most of the less-massive radio galaxies are expected to have been spared from the environmental effects that promote the rapid growth phase of SMBHs, such as galaxy mergers.
| radio galaxy | control galaxy | |||||||
|---|---|---|---|---|---|---|---|---|
| [pkpc] | ||||||||
6 Conclusion
We embraced the wide and deep imaging data of HSC-SSP to characterize the redshift evolution of radio galaxy environments between . The radio galaxy sample was extracted from the WERGS data (Yamashita et al., 2018). The redshifts and stellar masses are estimated by Mizuki SED fitting code (Tanaka et al., 2018). The control sample was constructed by matching to the stellar masses and redshifts of the radio galaxies. Multi wavelength data from Toba et al. (2019), for the radio galaxies was used to examine the possible correlation between the surrounding density environments and the AGN states of the radio galaxies. In order to define the surrounding densities around the radio and control galaxies, the -nearest neighbor method was used. We examined the redshift evolution of the local densities of the radio galaxies, and the possible relations between the densities and the properties such as stellar mass and AGN states of the radio galaxies. Our findings are as follows:
-
•
There is no correlation between the overdensities and redshifts of the control galaxies, while the overdensities of the radio galaxies are significantly but weak anti-correlated with redshift.
-
•
In the low stellar mass regime of log , both of the radio and control galaxies, on average, reside in similar environments with the overdensities of . On the other hand, at log , the control galaxies tend to exist in regions with the overdensities higher than unity, while the median density of the radio galaxies is significantly higher than that of the control galaxies.
-
•
The projected distances from the radio galaxies to their nearest neighbors are significantly smaller than those of the control galaxies at the massive-end. On the other hand, no difference in the projected distances is found between the radio and control galaxies at the less-massive end.
-
•
The radio luminosities and of the radio galaxies are significantly anti-correlated with their surrounding densities at fixed stellar mass.
Our results support the known scenario where the relative abundance of less-massive HERGs increases with redshift. HERGs tend to reside in low density regions compared to LERGs. In addition, our findings suggest that massive radio galaxies have already matured through galaxy mergers in the past and have SMBHs whose mass accretion almost ceased between , while less-massive radio galaxies undergo active accretion in this epoch and have avoided any merger events.
References
- Abazajian et al. (2004) Abazajian, K., Adelman-McCarthy, J. K., Agüeros, M. A., et al. 2004, AJ, 128, 502
- Aihara et al. (2018) Aihara, H., Armstrong, R., Bickerton, S., et al. 2018, PASJ, 70, S8
- Aihara et al. (2018) Aihara, H., Arimoto, N., Armstrong, R., et al. 2018, PASJ, 70, S4
- Arnaboldi et al. (2007) Arnaboldi, M., Neeser, M. J., Parker, L. C., et al. 2007, The Messenger, 127, 28
- Axelrod et al. (2010) Axelrod, T., Kantor, J., Lupton, R. H., & Pierfederici, F. 2010, Proc. SPIE, 7740, 774015
- Becker et al. (1995) Becker, R. H., White, R. L., & Helfand, D. J. 1995, ApJ, 450, 559.
- Best & Heckman (2012) Best, P. N. & Heckman, T. M. 2012, MNRAS, 421, 1569.
- Bîrzan et al. (2008) Bîrzan, L., McNamara, B. R., Nulsen, P. E. J., et al. 2008, ApJ, 686, 859.
- Blandford & Znajek (1977) Blandford, R. D., & Znajek, R. L. 1977, MNRAS, 179, 433
- Boquien et al. (2019) Boquien, M., Burgarella, D., Roehlly, Y., et al. 2019, A&A, 622, A103.
- Bosch et al. (2018) Bosch, J., Armstrong, R., Bickerton, S., et al. 2018, PASJ, 70, S5
- Bower et al. (2006) Bower, R. G., Benson, A. J., Malbon, R., et al. 2006, MNRAS, 370, 645.
- Bower et al. (2017) Bower, R. G., Schaye, J., Frenk, C. S., et al. 2017, MNRAS, 465, 32.
- Burgarella et al. (2005) Burgarella, D., Buat, V., & Iglesias-Páramo, J. 2005, MNRAS, 360, 1413.
- Ching et al. (2017) Ching, J. H. Y., Croom, S. M., Sadler, E. M., et al. 2017, MNRAS, 469, 4584.
- Condon et al. (2013) Condon, J. J., Kellermann, K. I., Kimball, A. E., et al. 2013, ApJ, 768, 37.
- Croton et al. (2006) Croton, D. J., Springel, V., White, S. D. M., et al. 2006, MNRAS, 365, 11.
- Davis et al. (2022) Davis, F., Kaviraj, S., Hardcastle, M. J., et al. 2022, MNRAS, 511, 4109.
- Dekel & Birnboim (2006) Dekel, A. & Birnboim, Y. 2006, MNRAS, 368, 2.
- Delvecchio et al. (2014) Delvecchio, I., Gruppioni, C., Pozzi, F., et al. 2014, MNRAS, 439, 2736.
- Delvecchio et al. (2018) Delvecchio, I., Smolčić, V., Zamorani, G., et al. 2018, MNRAS, 481, 4971.
- Donoso et al. (2009) Donoso, E., Best, P. N., & Kauffmann, G. 2009, MNRAS, 392, 617.
- Donoso et al. (2010) Donoso, E., Li, C., Kauffmann, G., Best, P. N., & Heckman, T. M. 2010, MNRAS, 407, 1078
- Eales et al. (2010) Eales, S., Dunne, L., Clements, D., et al. 2010, PASP, 122, 499.
- Fanidakis et al. (2011) Fanidakis, N., Baugh, C. M., Benson, A. J., et al. 2011, MNRAS, 410, 53.
- Furusawa et al. (2018) Furusawa, H., Koike, M., Takata, T., et al. 2018, PASJ, 70, S3
- Habouzit et al. (2017) Habouzit, M., Volonteri, M., & Dubois, Y. 2017, MNRAS, 468, 3935.
- Hatch et al. (2014) Hatch, N. A., Wylezalek, D., Kurk, J. D., et al. 2014, MNRAS, 445, 280
- Heckman & Best (2014) Heckman, T. M. & Best, P. N. 2014, ARA&A, 52, 589.
- Helfand et al. (2015) Helfand, D. J., White, R. L., & Becker, R. H. 2015, ApJ, 801, 26
- Heywood et al. (2016) Heywood, I., Jarvis, M. J., Baker, A. J., et al. 2016, MNRAS, 460, 4433. doi:10.1093/mnras/stw1250
- Hopkins et al. (2010) Hopkins, P. F., Croton, D., Bundy, K., et al. 2010, ApJ, 724, 915.
- Inayoshi et al. (2018) Inayoshi, K., Ostriker, J. P., Haiman, Z., et al. 2018, MNRAS, 476, 1412.
- Ichikawa et al. (2021) Ichikawa, K., Yamashita, T., Toba, Y., et al. 2021, arXiv:2108.02781
- Ishikawa et al. (2020) Ishikawa, S., Kashikawa, N., Tanaka, M., et al. 2020, ApJ, 904, 128.
- Ivezic et al. (2008) Ivezic, Z., Axelrod, T., Brandt, W. N., et al. 2008, Serbian Astronomical Journal, 176, 1
- Jackson & Wall (1999) Jackson, C. A. & Wall, J. V. 1999, MNRAS, 304, 160.
- Jamrozy et al. (2014) Jamrozy, M., Stawarz, Ł., Marchenko, V., et al. 2014, MNRAS, 441, 1260.
- Jurić et al. (2015) Jurić, M., Kantor, J., Lim, K., et al. 2015, arXiv:1512.07914
- Kawakatu et al. (2009) Kawakatu, N., Kino, M., & Nagai, H. 2009, ApJ, 697, L173.
- Kawanomoto et al. (2017) Kawanomoto, S. et al. to be submitted to PASJ
- Kolwa et al. (2019) Kolwa, S., Jarvis, M. J., McAlpine, K., et al. 2019, MNRAS, 482, 5156.
- Komiyama et al. (2018) Komiyama, Y., Obuchi, Y., Nakaya, H., et al. 2018, PASJ, 70, S2
- Kormendy & Ho (2013) Kormendy, J. & Ho, L. C. 2013, ARA&A, 51, 511.
- Kron et al. (1985) Kron, R. G., Koo, D. C., & Windhorst, R. A. 1985, A&A, 146, 38
- Lai et al. (2016) Lai, C.-C., Lin, L., Jian, H.-Y., et al. 2016, ApJ, 825, 40.
- Lan & Prochaska (2020) Lan, T.-W. & Prochaska, J. X. 2020, arXiv:2009.04482
- Larson et al. (2016) Larson, K. L., Sanders, D. B., Barnes, J. E., et al. 2016, ApJ, 825, 128.
- Lotz et al. (2011) Lotz, J. M., Jonsson, P., Cox, T. J., et al. 2011, ApJ, 742, 103.
- Madau & Dickinson (2014) Madau, P. & Dickinson, M. 2014, ARA&A, 52, 415.
- Magliocchetti et al. (2004) Magliocchetti, M., Maddox, S. J., Hawkins, E., et al. 2004, MNRAS, 350, 1485.
- Magnier et al. (2013) Magnier, E. A., Schlafly, E., Finkbeiner, D., et al. 2013, ApJS, 205, 20
- Magorrian et al. (1998) Magorrian, J., Tremaine, S., Richstone, D., et al. 1998, AJ, 115, 2285
- Malavasi et al. (2015) Malavasi, N., Bardelli, S., Ciliegi, P., et al. 2015, A&A, 576, A101.
- Marconi & Hunt (2003) Marconi, A., & Hunt, L. K. 2003, ApJ, 589, L21
- McNamara & Nulsen (2007) McNamara, B. R. & Nulsen, P. E. J. 2007, ARA&A, 45, 117.
- Miraghaei & Best (2017) Miraghaei, H. & Best, P. N. 2017, MNRAS, 466, 4346.
- Miyazaki et al. (2012) Miyazaki, S., Komiyama, Y., Nakaya, H., et al. 2012, Proc. SPIE, 8446, 84460Z
- Miyazaki et al. (2018) Miyazaki, S., Komiyama, Y., Kawanomoto, S., et al. 2018, PASJ, 70, S1.
- Morganti et al. (2005) Morganti, R., Tadhunter, C. N., & Oosterloo, T. A. 2005, A&A, 444, L9.
- Mullaney et al. (2012) Mullaney, J. R., Daddi, E., Béthermin, M., et al. 2012, ApJ, 753, L30.
- Nesvadba et al. (2017) Nesvadba, N. P. H., De Breuck, C., Lehnert, M. D., et al. 2017, A&A, 599, A123.
- Noll et al. (2009) Noll, S., Burgarella, D., Giovannoli, E., et al. 2009, A&A, 507, 1793.
- Orsi et al. (2016) Orsi, Á. A., Fanidakis, N., Lacey, C. G., & Baugh, C. M. 2016, MNRAS, 456, 3827
- Peacock & Nicholson (1991) Peacock, J. A. & Nicholson, D. 1991, MNRAS, 253, 307.
- Ramos Almeida et al. (2013) Ramos Almeida, C., Bessiere, P. S., Tadhunter, C. N., et al. 2013, MNRAS, 436, 997.
- Pilbratt et al. (2010) Pilbratt, G. L., Riedinger, J. R., Passvogel, T., et al. 2010, A&A, 518, L1.
- Sabater et al. (2013) Sabater, J., Best, P. N., Verdes-Montenegro, L., et al. 2013, Highlights of Spanish Astrophysics VII, 461
- Schlafly et al. (2012) Schlafly, E. F., Finkbeiner, D. P., Jurić, M., et al. 2012, ApJ, 756, 158
- Shabala et al. (2011) Shabala, S. S., Kaviraj, S., & Silk, J. 2011, MNRAS, 413, 2815.
- Tanaka et al. (2018) Tanaka, M., Coupon, J., Hsieh, B.-C., et al. 2018, PASJ, 70, S9.
- Toba et al. (2019) Toba, Y., Yamashita, T., Nagao, T., et al. 2019, ApJS, 243, 15.
- Tonry et al. (2012) Tonry, J. L., Stubbs, C. W., Lykke, K. R., et al. 2012, ApJ, 750, 99
- Turner & Shabala (2015) Turner, R. J. & Shabala, S. S. 2015, ApJ, 806, 59.
- Uchiyama et al. (2021) Uchiyama, H., Yamashita, T., Toshikawa, J., et al. 2021, arXiv:2112.01684
- Venturi et al. (2007) Venturi, T., Giacintucci, S., Brunetti, G., et al. 2007, A&A, 463, 937.
- White et al. (1997) White, R. L., Becker, R. H., Helfand, D. J., et al. 1997, ApJ, 475, 479.
- Woo & Urry (2002) Woo, J.-H. & Urry, C. M. 2002, ApJ, 579, 530.
- Wright et al. (2010) Wright, E. L., Eisenhardt, P. R. M., Mainzer, A. K., et al. 2010, AJ, 140, 1868.
- Yamashita et al. (2018) Yamashita, T., Nagao, T., Akiyama, M., et al. 2018, ApJ, 866, 140.
- Yamashita et al. (2020) Yamashita, T., Nagao, T., Ikeda, H., et al. 2020, AJ, 160, 60.
- Yuan et al. (2016) Yuan, Z. S., Han, J. L., & Wen, Z. L. 2016, MNRAS, 460, 3669.