Sign-reversed anomalous Nernst effect in the ferromagnetic Weyl-semimetal Fe3-δGeTe2: the role of Fe vacancies
Abstract
Anomalous Nernst effect, as a thermal partner of anomalous Hall effect, is particularly sensitive to the Berry curvature anomaly near the Fermi level, and has been used to probe the topological nature of quantum materials. In this work, we report the observation of both effects in the ferromagnetic Weyl-semimetal Fe3-δGeTe2 with tunable Fe vacancies. With decreasing Fe vacancies, the anomalous Hall conductivity evolves as a function of the longitudinal conductivity from the hopping region to the region where the intrinsic Berry curvature contribution dominates. Concomitant evolutions in the anomalous Nernst signal and the anomalous off-diagonal thermoelectric coefficient are observed below the Curie temperature, displaying a unique sign change caused by the Fe vacancies. Combining these results with first-principles calculations, we argue that the Fe-vacancy concentration plays a unique role in simultaneously tuning the chemical potential and ferromagnetism, which in turn controls the Berry curvature contribution in this family of ferromagnetic topological semimetals.
pacs:
72.15.Jf; 73.43.–f; 03.65.VfI Introduction
In recent decades, tremendous efforts to uncover the exotic states of matter from the perspective of topology in condensed matter physics have led to the discovery of a large family of topological quantum materials such as topological insulators and topological semimetals(TSMs) Wang et al. (2013); Liang et al. (2015); Wang et al. (2012); Weng et al. (2015); Arnold et al. (2016); Shekhar et al. (2015); Ghimire et al. (2015); Zhang et al. (2017); Li et al. (2016); Wang et al. (2019). Of particular interest is the situation when magnetism meets topology in the semimetal family, where a series of unexpected transport properties, such as the anomalous Hall/Nernst effect (AHE/ANE)Li et al. (2017); Ramos et al. (2014); Xu et al. (2020); Sakai et al. (2018); Liu et al. (2018a); Wang et al. (2018); Yang et al. (2020) and topological Hall effect (THE)Kanazawa et al. (2011) have been reported. However, whether and how these effects are related to the topological electronic structure and the broken time reversal symmetry in the material remains uncertain. Recent experimental results such as the Kagome-lattice ferromagnetic(FM) Co3Sn2S2Liu et al. (2018a); Wang et al. (2018); Yang et al. (2020) and the triangular antiferromagnets Mn3Sn(Ge)Li et al. (2017); Nayak et al. (2016) have demonstrated that the ANE and AHE originate from the Berry curvature around Weyl nodes, and this connection is supported by first principles calculations(FPCs)Zou et al. (2019).
The recently discovered 2D-van der Waals magnet Fe3GeTe2 has been proposed as a new candidate for the FM TSM with nodal linesKim et al. (2018). This material exhibits a remarkably high Curie temperature of = 150-220 K in the bulk samplesMay et al. (2016); Zhu et al. (2016); Wang et al. (2017); Liu et al. (2018b); Drachuck et al. (2018); You et al. (2019). In the monolayer, is even higher and approaches room temperatureDeng et al. (2018); thus, this material is considered a promising new class of building blocks for heterostructures in spintronics. Furthermore, the frustrated magnetic structures due to triangular lattices formed by the iron atoms in this compound and the spin textures with spatial variation in local magnetic moments driven by the Dzlashinsky-Moriya interaction have been suggested and observed in the Fe3GeTe2 systemWang et al. (2017). Such nontrivial topological spin structures are also expected to directly give rise to AHE or THELiu et al. (2018b); Wang et al. (2017); You et al. (2019). Therefore, Fe3GeTe2 provides a unique platform for studying the interplay between magnetism and topology.
Compared to the Hall effect, the Nernst effect is less explored because of weak thermoelectric signals. In conventional metals, the normal contribution of the Hall effect is always finite, while the normal Nernst signal generally vanishes because of the Sondheimer cancellationSondheimer (1948), indicating that the ANE may become very prominent. In fact, the thermoelectric response depends on the derivative of the conductivity and is more sensitive to the anomalous contribution of the Nernst effect. Theoretically, the AHE is dominated by the sum of Berry curvatures of all occupied bands, while the ANE is governed by the nontrivial Berry curvature at the Fermi levelXiao et al. (2010, 2006). Therefore, tuning the transport behavior revealed by the Nernst effect is a highly desired way to probe the topological nature of materials.
In this Letter, we report observing the AHE and ANE in bulk Fe3-δGeTe2(), where both effects are found tunable by the Fe-vacancies. We performed transport measurements of the high-quality Fe3-δGeTe2 single crystals with different Fe-vacancies. We found that with decreasing Fe-vacancies the Hall conductivity dependency on evolves from the bad-metal-hopping regime to the intrinsic regime. The anomalous Nernst signal and the anomalous off-diagonal thermoelectric conductivity exhibit a prominent sign changing behavior in the low Fe-vacancy samples. Combining the FPCs, we propose that Fe-vacancies tune not only the magnetism, but also the chemical potential which in turn leads to the variation in contributed from the Berry curvature anomaly when the Weyl points(or node lines) are near the Fermi level.
II Methods
Large single crystals of Fe3-δGeTe2() with a minimeter size were grown through the flux methodchen2013magnetic . The crystal X-ray diffraction patterns were obtained using a D/MaxrA diffractometer with CuKα radiation at 300 K, which determines the crystal orientations, and their actual Fe contents (see Table 1 in SI) are determined using energy-dispersive X-ray (EDX) spectroscopy. The (magneto)resistivity and Hall coefficient measurements were performed using the standard four-terminal method in a commercial Quantum Design PPMS-9 system. The magnetization measurements were performed using a commercial SQUID magnetometer. The thermoelectric effects, such as thermopower and the Nernst effect, were studied with a one-heater-two-thermometers technique in PPMS with a high-vacuum environment.
The first-principles calculations were performed using plane-wave basis density functional theory as implemented in the Vienna Abinit Simulation Package (VASP)kresse1996efficient . The projected augmented wave (PAW) methodPhysRevB.59.1758 and the Perdew, Burke, Ernzerhoff (PBE)PhysRevLett.77.3865 type exchange-correlation functional were employed. The energy cut-off was chosen to be 480 eV, while a 12124 -centered K-mesh was used to ensure convergence. All atomic coordinates and lattice constants were fully relaxed until the forces were less than 0.01 eV/Å for all atoms. The magnetic moments of Fe atoms were taken to be along the -direction, and spin-orbit coupling was added as a second variational method. After convergence, the two Fe atoms in the FeGe-plane has net moment of 1.55 /Fe, while the other 4-four atoms had a net moment of 2.47 /Fe, all aligned in the same direction. These numbers significantly overestimate the experimentally observed saturating moments, similar to previous studiesZhu et al. (2016). This overestimation of the ordered moment is associated with lack of spin-fluctuations in DFT calculations, as shown in studies of iron-based superconductorsPhysRevB.77.220506 ; PhysRevB.78.085104 ; PhysRevB.83.144512 . Nevertheless, the DFT band structure reproduces the quasi-particle spectrum of a DFT+DMFT calculation, which is comparable to ARPES experimentKim et al. (2018). The DFT electronic structure is then fitted to a 120-orbital tight-binding model including Fe-3d, Fe-4s, Ge-4s, Ge-4p, Te-5s, and Te-5p orbitals, using the maximally projected Wannier function methodmethod:wannier90 . The resulting Hamiltonian is then symmetrized using the WannSymm codeWannSymmCode , and the symmetrized Hamiltonian is employed to calculate using 727272 K-mesh.
III Results and Discussion
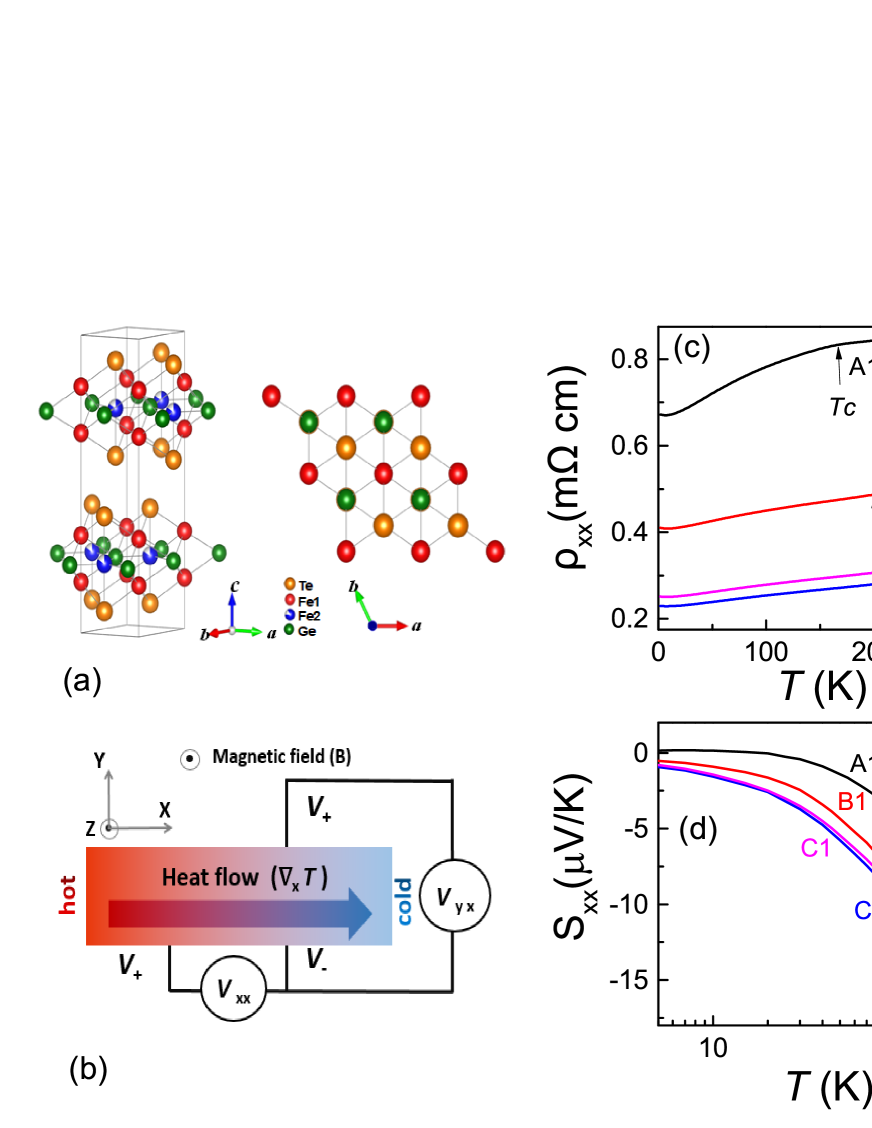
A cartoon picture of the Fe3-δGeTe2 crystal structure (space group ) with the atomic positions labeled is shown in Fig.1a, where Fe(1)-Fe(1) bonds pierce the center of each hexagon formed by Fe(2)-Ge. Using a standard two-thermometers-one-heater setup (Fig. 1b), we measured the diagonal ( and ) and off-diagonal ( and ) transport coefficients of the sample. As seen in Fig. 1c, the in-plane resistivity exhibits a clear kink from 165 K to 210 K for each measured sample. The kink feature is also observed in the negative thermopower near the same temperature, as indicated in Fig.1d. As the Fe-vacancy decreases, decreases significantly, and increases monotonically, while the corresponding kink position associated with the ferromagnetic phase transition at shifts to high temperature.
Magnetization measurements confirmed the paramagnetic to FM phase transition at in Fig.1e. The temperature dependence of magnetization under the field B c-axis suddenly increases below , followed by a significant splitting at the zero field cooling (ZFC) and the field cooling (FC) curves at lower temperatures for the three samples, implying the entrance into ferromagnetic state. The lower the Fe-vacancies are, the larger the splitting of the ZFC and FC curves. This feature is not evident in the previous polycrystalline samplesMay et al. (2016). The saturated magnetization along the -axis at 5 K is displayed in Fig. 1f. The lower Fe-vacancy samples possess the larger magnetic moments (see Table 1 in SI). For instance, Sample C2 ( with the highest = 210 K) exhibits the largest hysteresis loop with the largest saturated magnetic moment of = 1.44 .
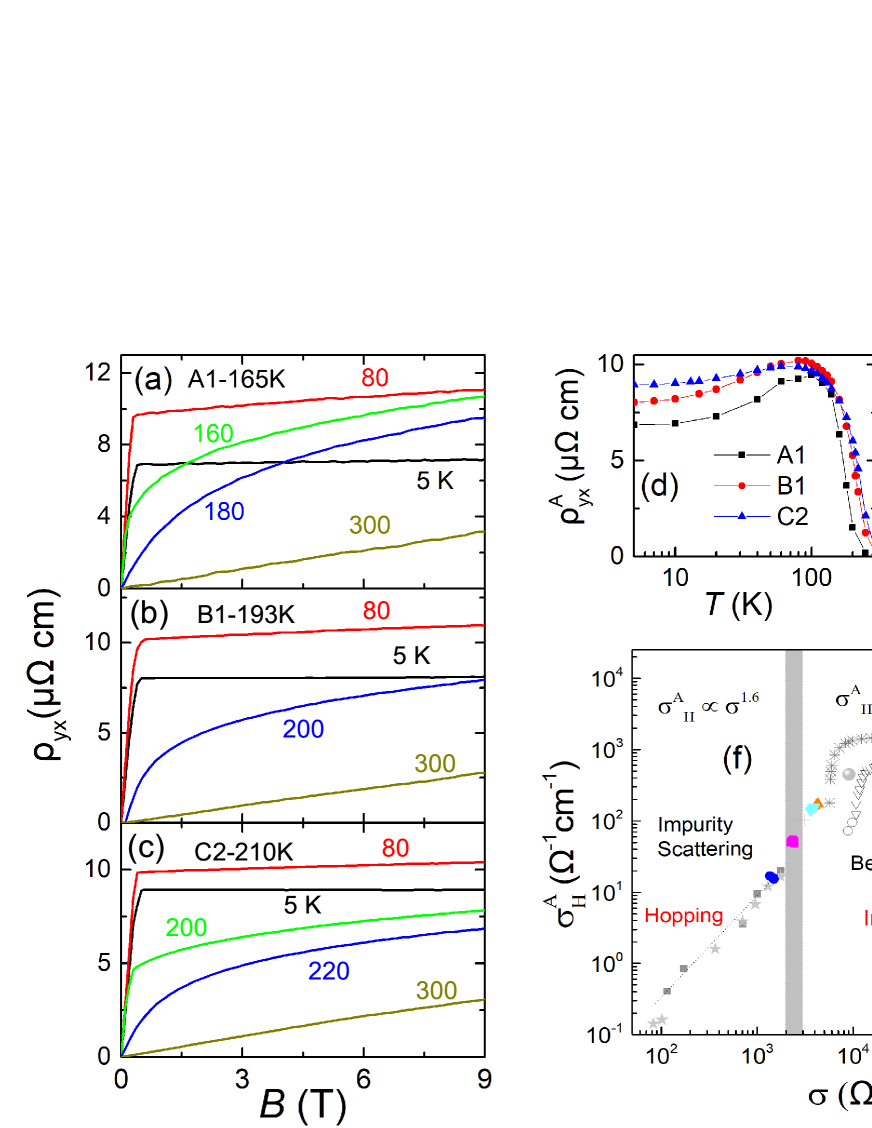
Figs. 2a-2c display vs. at several temperatures below for Samples A1, B1 and C2, respectively. At = 5 K, the Hall resistivity exhibits a steep jump at low fields and then becomes almost flat at high fields, which is inconsistent with the literatureLiu et al. (2018b). As the temperature increases, ( = 165 K for A1, 193 K for B1 and 210 K for C2), starts to broaden and the jump is less prominent. Note that the nonlinear field dependence of is clearly observed above as well ( for more details, see SI). This AHE has been reported in some recently discovered magnetic TSMsLiu et al. (2018a); Yang et al. (2020); Sakai et al. (2018). The anomalous is then extracted by extrapolating the high-field part of the Hall resistivity to the zero field. As shown in Fig. 2d, increases significantly with decreasing temperature (below ), then reaches a local maximum near 80-100 K (defined as ) and saturates gradually at the low temperature limit. Accordingly, the anomalous Hall conductivity (AHC) can be extracted from in Fig. 2e, with the former being calculated using the formula . remains almost constant below . Among them, the of sample C2 attains its maximum value of 175 below , close to the intrinsic contribution ( is the lattice constant along the -axis). This value is almost one or two orders in magnitude larger than that of sample A1. In contrast, of those samples is comparable in the whole temperature regime. Such sample-dependent diversity of the AHC is unexpected, indicating the significant role played by Fe vacancies in tuning the AHE in Fe3-δGeTe2.
On the basis of the unified theoretical pictureMiyasato et al. (2007); Onoda et al. (2006), the origin of the AHE is ascribed to an extrinsic or intrinsic mechanism due to magnetic impurity scattering or nontrivial Berry curvature, respectively. The former is composed of the side-jump and the skew scattering. The intrinsic AHE can be expressed as , where is the Fermi-Dirac distribution function and denotes the Berry curvature. These contributions can be identified by plotting as function of the longitudinal conductivity , as shown in Fig.2f for the measured samples. Samples C1 and C2 completely fall into the intrinsic regime where is dominated by the Berry-phase curvature while Sample A1 lies in the extrinsic regime where is determined by the impurities scattering, consistent with the smaller Onoda et al. (2006). As for Sample B1, it is located at the boundary between the intrinsic and extrinsic regimes. These results reveal an interesting Fe-vacancy-driven crossover from extrinsic to intrinsic mechanisms of the AHE due to the interplay of magnetism and topology. Therefore, with increasing Fe-vacancies, the decreasing moments will give rise to a decreasing intrinsic Hall effect that is proportional to magnetization. The disorder may play a minor role in contributing to the extrinsic AHE. However, the shift in chemical potential near the Fermi level may be less important for the intrinsic AHE, which is governed by the sum of the Berry curvatures of all occupied bandsYang et al. (2020).
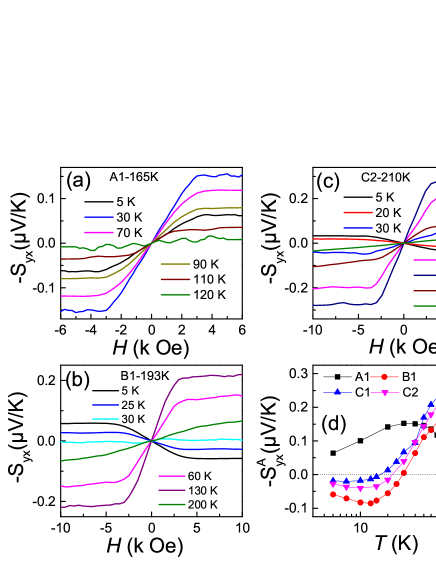
Compared with the AHE, our samples exhibit a more exotic ANE in Fig. 3a-3c. Below , the Nernst signal (NS), , shows a clear jump at low fields and tends to saturate at high fields. Above , the abnormal jump is less identified, and obeys a linear field dependence, indicating a normal NS. Surprisingly, in Samples B1 and C2 follows a positive field dependence() above 20-30 K but reverses to a negative one () below this temperature, revealing a remarkable sign change in with decreasing temperature. This behavior is absent in Sample A1. Such unusual field dependence in a Nernst signal does not match the magnetization curve and the Hall resistivity data in a simple way. Rather, it indicates a strong dependence of the ANE on the amount of Fe vacancies. The anomalous NS is then extracted from the data (for detailed information, see SI) as displayed in Figure 3d. clearly increases suddenly below , and then shows a broad peak near 30 K for Sample A1, 130 K for Sample B1, and 140 K for Samples C1 and C2. The maximum value of varies from 0.15 to 0.3 V/K, which is much larger than those of conventional magnets (the pure metal FeMiyasato et al. (2007), CuCr2Se4-xBrxLee et al. (2004), and the single crystal Fe3O4Ramos et al. (2014)), and is comparable to the magnetic TSM (the Mn3Sn(Ge)Li et al. (2017); Nayak et al. (2016)). The unexpected crossover from positive to negative in Samples B1, C1 and C2 occurs near 15-25 K, followed by a local minimum at lower temperatures of 10-15 K. To date, this sign reversing feature in ANE has not been reported in the known magnetic TSMs.
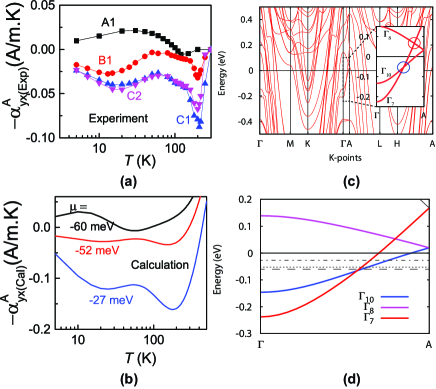
We now turn to the anomalous off-diagonal thermoelectric conductivity , which is closely associated with and via and by (for more details, see SI). As shown in Fig. 4a, is moderate in the range of 0.01-0.1 Am-1K-2. It displays a nonmonotonic temperature-dependence below . For Sample A1, is positive with a broad hump near 30 K, then approaches zero at zero temperature. In contrast, in Samples B1, C1, and C2 becomes negative and exhibits a local minimum near 20 K and a dip near 200 K. The dip position is slightly above the Curie temperature, and linked to the ignorable Nernst signal because of the Sondheimer cancellation in the paramagnetic state of a normal metalSondheimer (1948). The local minimum is due to vanishing when the sign-reversal occurs such that the anomalous Hall conductivity is the main contributor to ().
To clarify this point, we performed an FPC for the pristine compound and obtained using semiclassical approachXiao et al. (2010)(for details, see SI), as shown in Fig. 4b. The calculated band structure with spin-orbit coupling (SOC) is shown in Fig.4c, where the band inversions from the -point to the -point near the Fermi level yield two crossing points (W1 and W2) located at -65 meV and 70 meV, respectively. Notably that the chirality of W1 is , while W2 is the normal Weyl point with chirality of . Moreover, the chiralities of the two nodal points sitting on the same side of the - plane have different signs. Since , where , the ANE is related to the Berry curvature anomalies within thermal thinness. As a result, the Weyl nodes with opposite signs compete with each other when the chemical potential is tuned in between. Govern that the reduction of the saturated moment is roughly proportional to the vacancy concentration , and that previous coherent potential approximation calculations suggest a negligible change in spin-splitting size in systems with iron vacanciesKim et al. (2018), we argue that the major effect of iron-vacancy in our cases (up to 10%) is charge doping without altering the local moment on individual Fe atoms. Therefore, we simulate the influence of Fe-vacancies by rigidly shifting the chemical potential, i.e. ignoring the local moment change and focusing on the charge doping effect. Three representative chemical potentials (-60 meV, -52 meV, and -27 meV) are chosen as indicated in Fig. 4d and the corresponding value of is calculated as shown in Fig. 4b. The calculated does evolve from positive to negative below under the shift in the chemical potential from -60meV to -27meV. All calculated results (in Fig. 4b) and experimental results (in Fig. 4a) are in fair agreement. The theoretical values of are slightly larger than the experimental values possibly because of the neglected influence of the temperature-dependent magnetic moments as well as the contribution from other possible mechanisms. The good agreement between calculation and experiment confirms that the dominant contribution to is from the Berry curvature near the Weyl points close to the Fermi level. The competition between two Weyl nodes with different topological charges caused by the doping effect gives rise to the nontrivial behavior of the ANE.
In short, the AHE and ANE exhibit a clear difference in transport with respect to the Fe vacancy concentration in the system. At high Fe vacancy levels as in Sample A1, the system exhibits low and small , associated with small and caused by the intrinsic magnetic structure or the extrinsic disorder effect. At low Fe vacancy levels as in Sample C2, the system displays high and large , associated with large and . undergoes a sign change in the low temperature regime where has the opposite sign below . The sign changing behavior can be attributed to the shift in the chemical potential which can tune the contribution of Berry curvature in the electronic band structure.
IV Conclusion
In summary, we studied the AHE and the ANE of bulk Fe3-δGeTe2() compounds. We found that with decreasing Fe-vacancy, dependency on evolves from the bad metal hopping regime to the intrinsic regime, indicating the different dominating mechanisms behind the AHE. The accompanying undergoes an unexpected sign change at low temperature, where has the opposite sign below . Calculation and experimentation suggest that the Fe-vacancies can not only tune the magnetism, but also tune the chemical potential, leading to an interesting variation ins whose dominating contribution is from the Berry curvature when the Weyl points (or nodal lines) are near the Fermi level. The results also indicate a possible crossover from extrinsic to intrinsic AHE and ANE driven by the Fe-vacancies. Our work reveals the unique role played by Fe-vacancies in the present ferromagnetic TSMs and suggests that this family could be a new platform for studying the interplay between magnetism and topology.
Acknowledgments
The authors thank Yongkang Luo and Huiqiu Yuan for fruitful discussions and valuable comments. This research was supported in part by the NSF of China (under the Grant Nos. U1932155, 11874136, 11874137 and U19A2093), the National Key Projects for Research and Development of China (Contract No. 2019YFA0308602), and the Key R&D Program of Zhejiang Province China (No. 2021C01002). Yu-Ke Li was also supported by an open program from Wuhan National High Magnetic Field Center (2016KF03).
References
- Wang et al. (2013) Z. J. Wang, H. M. Weng, Q. S. Wu, X. Dai, and Z. Fang, Phys. Rev. B 88, 125427 (2013).
- Liang et al. (2015) T. Liang, Q. Gibson, M. N. Ali, M. H. Liu, R. J. Cava, and N. P. Ong, Nat. Mater. 14, 280 (2015).
- Wang et al. (2012) Z. J. Wang, Y. Sun, X. Q. Chen, C. Franchini, G. Xu, H. M. Weng, X. Dai, and Z. Fang, Phys. Rev. B 85, 195320 (2012).
- Weng et al. (2015) H. M. Weng, C. Fang, Z. Fang, B. A. Bernevig, and X. Dai, Phys. Rev. X 5, 011029 (2015).
- Arnold et al. (2016) F. Arnold, C. Shekhar, S. C. Wu, Y. Sun, R. D. Dos Reis, N. Kumar, M. Naumann, M. O. Ajeesh, M. Schmidt, A. G. Grushin, J. H. Bardarson, M. Baenitz, D. Sokolov, H. Borrmann, M. Nicklas, C. Felser, E. Hassinger, and B. H. Yan, Nat. Commun. 7 (2016).
- Shekhar et al. (2015) C. Shekhar, A. K. Nayak, Y. Sun, M. Schmidt, M. Nicklas, I. Leermakers, U. Zeitler, Y. Skourski, J. Wosnitza, Z. K. Liu, C. Y. L., W. Schnelle, H. Borrmann, Y. Grin, C. Felser, and B. H. Yan, Nat. Phys. 11, 645 (2015).
- Ghimire et al. (2015) N. J. Ghimire, Y. K. Luo, M. Neupane, D. J. Williams, E. D. Bauer, and F. Ronning, J. Phys. Condens. Matter 27, 152201 (2015).
- Zhang et al. (2017) C. L. Zhang, Z. J. Yuan, Q. D. Jiang, B. B. Tong, C. Zhang, X. C. Xie, and S. Jia, Phys. Rev. B 95, 085202 (2017).
- Li et al. (2016) Y. Li, L. Li, J. Wang, T. Wang, X. Xu, C. Xi, C. Cao, and J. Dai, Phys. Rev. B 94, 121115 (2016).
- Wang et al. (2019) J. Wang, H. Yang, L. Ding, W. You, C. Xi, J. Cheng, Z. Shi, C. Cao, Y. Luo, Z. Zhu, et al., npj Quantum Mater. 4, 1 (2019).
- Li et al. (2017) X. K. Li, L. C. Xu, L. C. Ding, J. H. Wang, M. S. Shen, X. F. Lu, Z. W. Zhu, and K. Behnia, Phys. Rev. Lett. 119, 056601 (2017).
- Ramos et al. (2014) R. Ramos, M. H. Aguirre, A. Anadón, J. Blasco, I. Lucas, K. Uchida, P. A. Algarabel, L. Morellón, E. Saitoh, and M. R. Ibarra, Phys. Rev. B 90, 054422 (2014).
- Sakai et al. (2018) A. Sakai, Y. P. Mizuta, A. A. Nugroho, R. Sihombing, T. Koretsune, M. T. Suzuki, N. Takemori, R. Ishii, D. Nishio-Hamane, R. Arita, P. Goswami, and S. Nakatsuji, Nat. Phys. 14, 1119 (2018).
- Liu et al. (2018a) E. K. Liu, Y. Sun, N. Kumar, L. Muechler, A. L. Sun, L. Jiao, S. Y. Yang, D. F. Liu, A. J. Liang, Q. N. Xu, H. Kroder, J. Borrmann, C. Shekhar, Z. S. Wang, C. Y. Xi, W. Wang, W. H. Schenlle, S. Wirth, Y. L. Chen, S. T. B. Goennenwein, and C. Felser, Nat. Phys. 14, 1125 (2018a).
- Wang et al. (2018) Q. Wang, Y. F. Xu, R. Lou, Z. H. Liu, M. Li, Y. B. Huang, D. W. Shen, H. M. Weng, S. C. Wang, and H. C. Lei, Nat. Commun. 9, 3681 (2018).
- Yang et al. (2020) H. Y. Yang, W. You, J. L. Wang, J. W. Huang, C. Y. Xi, X. F. Xu, C. Cao, M. L. Tian, Z. A. Xu, J. H. Dai, and Y. K. Li, Phys. Rev. Mater. 4, 024202 (2020).
- Xu et al. (2020) L. Xu, X. Li, L. Ding, T. Chen, A. Sakai, B. Fauqué, S. Nakatsuji, Z. Zhu, and K. Behnia, Phys. Rev. B 101, 180404 (2020).
- Kanazawa et al. (2011) N. Kanazawa, Y. Onose, T. Arima, D. Okuyama, K. Ohoyama, S. Wakimoto, K. Kakurai, S. Ishiwata, and Y. Tokura, Phys. Rev. Lett. 106, 156603 (2011).
- Nayak et al. (2016) A. K. Nayak, J. E. Fischer, Y. Sun, B. H. Yan, J. Karel, A. C. Komarek, C. Shekhar, N. Kumar, W. Schnelle, J. Kübler, C. Felser, and S. S. P. Parkin, Sci. Adv. 2, e1501870 (2016).
- Zou et al. (2019) J. Y. Zou, Z. R. He, and G. Xu, npj Comput. Mater. 5, 1 (2019).
- Kim et al. (2018) K. Kim, J. Seo, E. Lee, K. T. Ko, B. S. Kim, B. G. Jang, J. M. Ok, J. W. Lee, Y. J. Jo, W. Kang, J. H. Shim, C. Kim, H. W. Yeom, B. Il Min, B. J. Yang, and J. S. Kim, Nat. Mater. 17, 794 (2018).
- May et al. (2016) A. F. May, S. Calder, C. Cantoni, H. B. Cao, and M. A. McGuire, Phys. Rev. B 93, 014411 (2016).
- Zhu et al. (2016) J. X. Zhu, M. Janoschek, D. S. Chaves, J. C. Cezar, T. Durakiewicz, F. Ronning, Y. Sassa, M. Mansson, B. L. Scott, N. Wakeham, E. D. Bauer, and J. D. Thompson, Phys. Rev. B 93, 144404 (2016).
- Wang et al. (2017) Y. H. Wang, C. Xian, J. Wang, B. J. Liu, L. S. Ling, L. Zhang, L. Cao, Z. Qu, and Y. M. Xiong, Phys. Rev. B 96, 134428 (2017).
- Liu et al. (2018b) Y. Liu, E. Stavitski, K. Attenkofer, and C. Petrovic, Phys. Rev. B 97, 165415 (2018b).
- Drachuck et al. (2018) G. Drachuck, Z. Salman, M. W. Masters, V. Taufour, T. N. Lamichhane, Q. S. Lin, W. E. Straszheim, S. L. Bud’ko, and P. C. Canfield, Phys. Rev. B 98, 144434 (2018).
- You et al. (2019) Y. R. You, Y. Y. Gong, H. Li, Z. F. Li, M. M. Zhu, J. X. Tang, E. K. Liu, Y. Yao, G. Z. Xu, F. Xu, and W. H. Wang, Phys. Rev. B 100, 134441 (2019).
- Deng et al. (2018) Y. J. Deng, Y. J. Yu, Y. C. Song, J. Z. Zhang, N. Z. Wang, Z. Y. Sun, Y. F. Yi, Y. Z. Wu, S. W. Wu, J. Y. Zhu, J. Wang, X. H. Chen, and Y. B. Zhang, Nature 563, 94 (2018).
- Sondheimer (1948) E. H. Sondheimer, P. Roy. Soc. A: Math., Phy. 193, 484 (1948).
- Xiao et al. (2010) D. Xiao, M.-C. Chang, and Q. Niu, Rev. Mod. Phys. 82, 1959 (2010).
- Xiao et al. (2006) D. Xiao, Y. Yao, Z. Fang, and Q. Niu, Phys. Rev. Lett. 97, 026603 (2006).
- Miyasato et al. (2007) T. Miyasato, N. Abe, T. Fujii, A. Asamitsu, S. Onoda, Y. Onose, N. Nagaosa, and Y. Tokura, Phys. Rev. Lett. 99, 086602 (2007).
- (33) B. Chen, J. H. Yang, H. D. Wang, M. Imai, H. Ohta, C. Michioka, K. Yoshimura, and M. H. Fang, J. Phys. Soc. Jpn. 82, 124711 (2013).
- (34) G. Kresse and J. Furthmüller, Phy. Rev. B 54, 11169 (1996).
- (35) G. Kresse and D. Joubert, Phys. Rev. B 59, 1758 (1999).
- (36) J. P. Perdew, K. Burke, and M. Ernzerhof, Phys. Rev. Lett. 77, 3865 (1996).
- (37) C. Cao, P. J. Hirschfeld, and H. P. Cheng, Phys. Rev. B 77, 220506 (2008).
- (38) I. I. Mazin, M. D. Johannes, L. Boeri, K. Koepernik, and D. J. Singh. Phys. Rev. B 78, 085104 (2008).
- (39) K. Nakamura, R. Arita, and H. Ikeda. Phys. Rev. B 83, 144512 (2011).
- (40) A. A. Mostofi, J. R. Yates, Y. S. Lee, I. Souza, D. Vanderbilt, and N. Marzari, Comput. Phys. Commun. 178, 685 (2008).
- (41) G. X. Zhi, C. C. Xu, S. Q. Wu, F. L. Ning, and C. Cao, Comput. Phys. Commun. 271, 108196 (2022).
- Onoda et al. (2006) S. Onoda, N. Sugimoto, and N. Nagaosa, Phys. Rev. Lett. 97, 126602 (2006).
- Lee et al. (2004) W. L. Lee, S. Watauchi, V. L. Miller, R. J. Cava, and N. P. Ong, Phys. Rev. Lett. 93, 226601 (2004).