Marginally Stable Current Sheets in Collisionless Magnetic Reconnection
Abstract
Non-collisional current sheets that form during the nonlinear development of magnetic reconnection are characterized by a small thickness, of the order of the electron skin depth. They can become unstable to the formation of plasmoids, which allows the magnetic reconnection process to reach high reconnection rates. In this work, we investigate the marginal stability conditions for the development of plasmoids when the forming current sheet is purely collisionless and in the presence of a strong guide field. We analyze the geometry that characterizes the reconnecting current sheet, and what promotes its elongation. Once the reconnecting current sheet is formed, we identify the regimes for which it is plasmoid unstable. Our study shows that plasmoids can be obtained, in this context, from current sheets with an aspect ratio much smaller than in the collisional regime, and that the plasma flow channel of the marginally stable current layers maintains an inverse aspect ratio of .
Magnetic reconnection is a fundamental plasma process that involves a rapid topological change of the magnetic field leading to an efficient magnetic energy conversion. Magnetic reconnection typically occurs via current sheets (CS), where non-ideal plasma effects become important allowing the change of magnetic field line connectivity Zweibel and Yamada (2009); Yamada et al. (2010); Ji et al. (2022).
It is well established that the instabilities of thin CS, that lead to the formation of plasmoids, have a fundamental impact on the reconnection rate Daughton et al. (2009); Bhattacharjee et al. (2009). Indeed, even in the resistive magnetohydrodynamics (MHD) framework, the development of plasmoids in the reconnection layer induces a fast magnetic reconnection regime characterized by a reconnection rate that can exceed the estimates based on the Sweet-Parker (SP) theory Sweet (1958); Parker (1957) by several orders of magnitude. In collisional CS, it has been shown that plasmoids develop when the Lundquist number exceeds the threshold value Biskamp (1986). Here, the Lundquist number is defined with the length of the CS, . The other quantities are the plasma resistivity , the speed of light , and the Alfvén speed . The threshold value on the Lundquist number, , separates the Sweet-Parker regime from the plasmoid-mediated regime of collisional reconnection. In addition, it controls the reconnection rate in the plasmoid-mediated regime, Huang and Bhattacharjee (2010); Uzdensky et al. (2010); Comisso et al. (2015a); Comisso and Grasso (2016), where is the reconnecting magnetic field. The extension of the resistive reconnection regime with the inclusion of the ion dynamics associated with the ion sound Larmor radius, , or the ion inertial length, , complicates the picture. Indeed, when the thickness of the reconnecting CS shrinks below (for reconnection with a guide field) or (for reconnection without guide field), the process becomes even faster and approaches Comisso and Bhattacharjee (2016). Given its importance, the transition between the different regimes of reconnection has been thoroughly investigated, and the current understanding of reconnection driven by plasma resistivity has been summarized in the form of parameter space diagrams Ji and Daughton (2011); Daughton and Roytershteyn (2012); Huang and Bhattacharjee (2013); Karimabadi and Lazarian (2013); Comisso et al. (2015b); Le et al. (2015); Loureiro and Uzdensky (2015); Bhat and Loureiro (2018).
In contrast, the marginal stability of reconnecting CS in the collisionless regime has seen relatively little investigation. This subject was approached in Ji and Daughton (2011), in which it is argued that, below the scales or , no plasmoids were formed. Yet, it is acknowledged that reconnection in nature is often driven by collisionless effects beyond the resistive MHD description.
In this Letter, we investigate a phase space described by the two kinetic scales (electron inertial length) and , compared to the current length . We show how the aspect ratio of the marginally stable reconnection layer depends on these relevant kinetic scales. We believe this study might also be useful to support observational and experimental results. In particular, recent observations revealed many reconnection onsets driven by electrons, in the presence of a strong guide field, close to the dayside magnetopause and magnetosheath Burch et al. (2016); Phan et al. (2018). Moreover, in Ref. Phan et al. (2018), current sheets having a thickness of the order of the electron inertial length were identified. A study also gave direct experimental proof of plasmoid formation at the X point and at the electron scale in a regime where no plasmoids were predicted by the theory Olson et al. (2016).
We assume a plasma immersed in a strong (guide) magnetic field of amplitude , resulting in low plasma (the ratio of plasma pressure to magnetic pressure). In order to reduce the problem to a few essential ingredients, in our analysis we adopt a simple two-fluid model that retains electron inertia effects, as well as ion sound Larmor radius effects. Specifically, the equations governing the plasma dynamics are (e.g. Cafaro et al., 1998)
| (1) |
| (2) |
where and are the magnetic and electrostatic potential, is the electron density perturbation, and is the parallel electron velocity, also proportional to the current density. The variables are normalized as , where the caret () indicates dimensional quantities and with the characteristic equilibrium scale length set by the equilibrium magnetic field. The normalized magnetic field and the perpendicular velocity are related to and as and , respectively. The parameters are and , corresponding to the normalized electron skin depth and ion sound Larmor radius, respectively. Ions are assumed to be cold. In Eqs. (1)-(2), .
In order to analyze the marginal stability conditions of the plasmoid instability in the collisionless regime, we conducted a large number () of numerical simulations of the system of Eqs. (1)-(2). The numerical solver is pseudo-spectral and the advancement in time is done through a third order Adams–Bashforth scheme. We considered a periodic 2D domain , resolved with a number of grid points up to . On the other hand, in the figures presented in the paper, only a part of the computational domain is shown. We set up an initial equilibrium given by , . The tearing stability parameter for this equilibrium is . This equilibrium is tearing unstable if , thus for a wavenumber . We will always refer to as being associated to the mode , and we change its value by taking different box lengths along the direction. With this set up, one or several tearing modes are initially unstable. The dominant mode generates two magnetic islands separated by a reconnection point (X-point). During the nonlinear phase, a slowly thinning CS forms self-consistently at the X-point location. The evolution of this current sheet will be decisive for the formation of plasmoids.
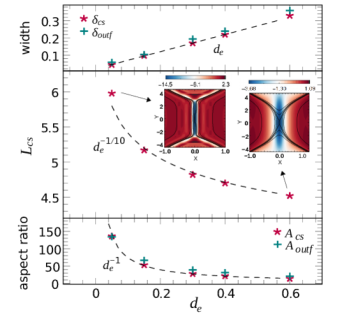
In the following, we characterize this reconnecting CS according to the parameters , , and .
Specifically, we measured the length and the width of the CS at a time just before the plasmoid onset. We define the measure , such that, taking the variation from the highest current position ( evaluated at the -point), the standard deviation of the current distribution from to equals unity, I.e. , where is the distance between two grid-points along and indicates the number of points from to . This method makes it possible to account for the decrease of the current intensity along the layer. Once is identified, the half width of the CS, which we denote by , corresponds to the distance, along , between and the position where the current reaches the value . We also measure the width and length of the outflow velocity channel coming out from the end of the CS. The length corresponds to the distance between the upward and downward peaks in the distribution of . while the width is also measured with the standard deviation method. The aspect ratios and are also reported.
We first focus on the limit shown in Fig. 1. As discussed in Ref. Ottaviani and Porcelli (1993), in this limit . To better show the geometry, the colored contour maps of with superimposed contour lines of in black, are shown for certain cases on Fig. 1 as well as on Fig. 2. For low values of , a high and uniform current density allows the parallel alignment of a high density of magnetic field lines (see color map of for and ). On the other hand, for high values, the current is not uniform enough along the layer for the magnetic field lines to line up perfectly, since their density decreases in the region where the current is weaker, (see and ). As we discuss below, this latter case is less likely to develop plasmoids. Finally, in the limit , we obtain the approximate scalings and .
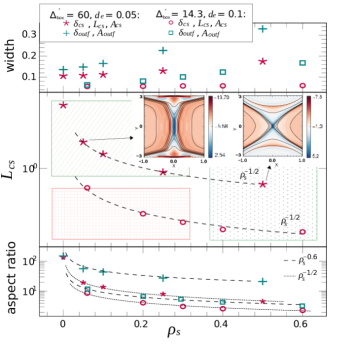
When is taken into account, ion sound Larmor effects can become important and the CS changes into a cross shaped structure aligned with the magnetic island separatrices Cafaro et al. (1998). Indeed, in Fig. 2, when is increased (for ), a part at the end of the layer splits to extend along the separatrices (see and ). Here, the measured still corresponds to the length distributed symmetrically on both sides of . We measured . As for the aspect ratios, they scale as and . For the series of simulations with and , the reconnection process occurs without forming any plasmoids (gridded red region) until .
For and (green diagonally striped region), the aspect ratio is sufficiently large and one plasmoid emerges from the center of the CS. This corresponds to a low wavenumber fluctuation that develops in the CS, which is entering the nonlinear phase.
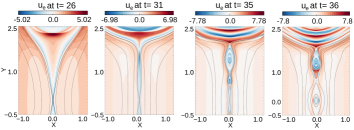
For (green dotted region), the CS reaches a perfect cross shape Cafaro et al. (1998). This very different geometry can still lead to a more complex plasmoid formation. Indeed, in the regime , the first plasmoids that break up the CS are symmetrically located above and below the -point. This process is detailed in Fig. 3. We observe 4 main phases: (I) formation of the -shaped current, (II) its ends meet to form a local -shaped CS, (III) plasmoids emerge and enter the nonlinear phase, (IV) they are expelled by the outflow and the center plasmoid emerges. This type of plasmoid onset takes place for in Fig. 2.
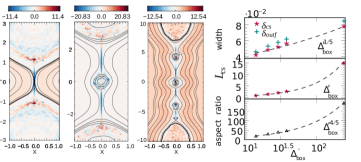
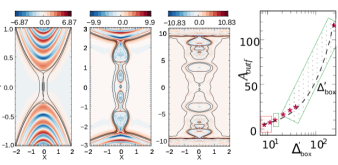
We now discuss the dependence on the parameter, for and for . In order to clearly identify a CS, we have considered large values, which vary from to . For (Fig. 4), the depends linearly on , as in the resistive case Waelbroeck (1989); Jemella et al. (2003, 2004); Loureiro et al. (2005). We do not obtain plasmoids for , in agreement with Del Sarto et al. (2003) where this regime is shown to be prone to the development of the Kelvin-Helmholtz instability. In the cases with , one plasmoid emerges and breaks up the reconnecting CS. For , two other plasmoids are formed when the reconnecting CS becomes more elongated (unstable) as increases. In the limit , the outflow channel follows the CS and we observe indeed the scaling (not shown here).
For (Fig. 5), on the other hand, the case with is plasmoid unstable. In this regime, the small-scale, oscillating current layer pattern located inside the two magnetic islands, identified in Refs. Grasso et al. (2001); Del Sarto et al. (2003), is visible on the two left panels. In the rightmost panel of Fig. 5, we show the measured aspect ratio of the outflow velocity channel just before the appearance of the first plasmoid. For the least unstable reconnecting CS (, we measured and , which implies a steady state reconnection rate of . The red area corresponds to stable cases. The green striped area corresponds to the onset of only one plasmoid located at the center of the CS. Finally, the green dotted region corresponds to the cases where the first plasmoids emerge from a local -shaped CS (as described on Fig. 3).
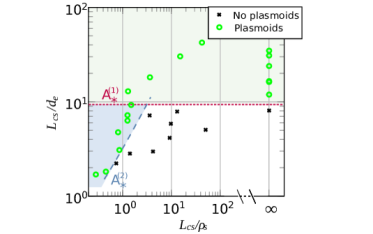
We can construct a parameter space diagram (Fig. 6), analogously to what was done for reconnection induced by plasma resistivity Ji and Daughton (2011); Daughton and Roytershteyn (2012); Cassak and Drake (2013), which allows one to identify the collisionless plasmoid regimes that take place once a reconnecting layer of a certain length is formed. According to our numerical simulations, the critical aspect ratio above which plasmoids break up the reconnecting CS is when . On the other hand, for , the plasmoid formation has a different threshold , and the simulations indicate .
We can evaluate by taking inspiration from the plasmoid instability theory presented in Refs. Comisso et al. (2016, 2017); Huang et al. (2017). We consider a forming CS in which the amplitude of the tearing mode grows as , where and are the tearing mode growth rate and wavenumber, respectively, while is the magnetic flux amplitude at . The plasmoid half-width is given by , where is evaluated at the resonant surface and is the half-width of the CS. We verified that the CS profiles are well fitted by a Harris sheet Biskamp (2000), for which . Given that the CS is slowly shrinking toward a finite width, we assume that, just before the plasmoid onset, the CS is in nearly steady-state and we neglect its time dependence. From Eqs. (1)-(2), one can derive the dispersion relation of the collisionless tearing mode for arbitrary values of Porcelli (1991). For the marginally stable CS, one can consider the limit , with indicating the width of the inner tearing layer. In this case, the full dispersion relation Porcelli (1991) reduces to for , while when .
We denote by the timescale for the plasma to be expelled from the CS because of the Alfvénic outflow. If the magnetic flux amplitude becomes nonlinear (with plasmoid half-width ) in a time shorter than , the CS is broken by at least one plasmoid. Otherwise it remains stable. Therefore, taking , the threshold for the plasmoid formation can be written as
| (3) |
Assuming that the needed amplification factor of the magnetic flux perturbation is the same for the and cases, requiring , making use of the numerical result , and considering that for we have , with , gives us the threshold condition
| (4) |
We identified a proportionality coefficient for which the proposed scaling, shown by the dashed blue line in Fig. 6, correctly captures the plasmoid formation that occurs for significantly lower values of the CS aspect ratio when .
While the aspect ratio of the CS controls the plasmoid growth, the aspect ratio of the plasma flow channel regulates the rate of inflowing plasma via mass conservation. For , the aspect ratios and essentially coincide since the plasma behaves as a one fluid. Therefore, for an incompressible flow in steady state, the marginal stability threshold yields the reconnection rate . On the other hand, for , two-fluid effects lead to a decoupling of the plasma flow channel from the electric current density, and in this case we find that even when . Since the global reconnection rate is controlled by the marginally stable CS Comisso and Bhattacharjee (2016), eventually in the entire green and blue parameter space regions of Fig. 6.
In summary, we have identified, with two-fluid numerical simulations and analytical arguments, the marginal stability conditions for the development of plasmoids in collisionless reconnecting CS. We find that in the collisionless regime, reconnecting CS are unstable to the formation of plasmoids for critical aspect ratios that can be as small as . For the marginally stable CS, we find that the aspect ratio of the outflow channel is independent of the microscopic plasma parameters. The space of collisionless plasma parameters ( and ) for which magnetic reconnection driven by electron inertia occurs in the plasmoid-mediated regime is organized in a new phase space diagram for collisionless reconnection. A new phase space diagram spanned by and for collisionless reconnection is presented, which extends the diagram of plasmoid onset for collisional plasmas Ji and Daughton (2011). Our results allow one to separate the collisionless laminar regime of reconnection from the collisionless plasmoid-mediated regime. The properties of the marginally stable CS obtained in this study contribute to the understanding of the rate of collisionless reconnection mediated by the plasmoid instability.
Acknowledgements.
C.G. acknowledges the financial support provided by the Universitée Franco-Italienne through the Vinci program. This work benefits from the support of the CNR contract DFM.AD003.261 (IGNITOR)-Del. CIPE n.79 del 07/08/2017 and of the grant DOE DESC0021254. The numerical simulations were performed using the EUROfusion high performance computer Marconi Fusion and Gallileo100 hosted at CINECA (project FUA35-FKMR and IsC86MR-EFLRA), and the computing facilities provided by Mesocentre SIGAMME hosted by Observatoire de la Côte d’Azur.References
- Zweibel and Yamada (2009) E. G. Zweibel and M. Yamada, Annu. Rev. Astron. Astrophys. 47, 291 (2009).
- Yamada et al. (2010) M. Yamada, R. Kulsrud, and H. Ji, Reviews of Modern Physics 82, 603 (2010).
- Ji et al. (2022) H. Ji, W. Daughton, J. Jara-Almonte, A. Le, A. Stanier, and J. Yoo, Nature Reviews Physics 4, 263 (2022), 2202.09004 .
- Daughton et al. (2009) W. Daughton, V. Roytershteyn, B. J. Albright, H. Karimabadi, L. Yin, and K. J. Bowers, Phys. Rev. Lett. 103, 065004 (2009).
- Bhattacharjee et al. (2009) A. Bhattacharjee, Y.-M. Huang, H. Yang, and B. Rogers, Physics of Plasmas 16, 112102 (2009), 0906.5599 .
- Sweet (1958) P. A. Sweet, in Electromagnetic Phenomena in Cosmical Physics, Vol. 6, edited by B. Lehnert (1958) p. 123.
- Parker (1957) E. N. Parker, J. Geophys. Res. 62, 509 (1957).
- Biskamp (1986) D. Biskamp, The Physics of Fluids 29, 1520 (1986).
- Huang and Bhattacharjee (2010) Y.-M. Huang and A. Bhattacharjee, Physics of Plasmas 17, 062104 (2010), 1003.5951 .
- Uzdensky et al. (2010) D. A. Uzdensky, N. F. Loureiro, and A. A. Schekochihin, Phys. Rev. Lett. 105, 235002 (2010).
- Comisso et al. (2015a) L. Comisso, D. Grasso, and F. L. Waelbroeck, Physics of Plasmas 22, 042109 (2015a), 1502.06408 .
- Comisso and Grasso (2016) L. Comisso and D. Grasso, Physics of Plasmas 23, 032111 (2016), 1603.00090 .
- Comisso and Bhattacharjee (2016) L. Comisso and A. Bhattacharjee, Journal of Plasma Physics 82, 595820601 (2016), 1609.02998 .
- Ji and Daughton (2011) H. Ji and W. Daughton, Physics of Plasmas 18, 111207 (2011).
- Daughton and Roytershteyn (2012) W. Daughton and V. Roytershteyn, Space Science Reviews 172, 271 (2012).
- Huang and Bhattacharjee (2013) Y.-M. Huang and A. Bhattacharjee, Physics of Plasmas 20, 055702 (2013), 1301.0331 .
- Karimabadi and Lazarian (2013) H. Karimabadi and A. Lazarian, Physics of Plasmas 20, 112102 (2013).
- Comisso et al. (2015b) L. Comisso, D. Grasso, and F. L. Waelbroeck, Journal of Plasma Physics 81, 495810510 (2015b), 1505.00726 .
- Le et al. (2015) A. Le, J. Egedal, W. Daughton, V. Roytershteyn, H. Karimabadi, and C. Forest, Journal of Plasma Physics 81, 305810108 (2015).
- Loureiro and Uzdensky (2015) N. F. Loureiro and D. A. Uzdensky, Plasma Physics and Controlled Fusion 58, 014021 (2015).
- Bhat and Loureiro (2018) P. Bhat and N. F. Loureiro, Journal of Plasma Physics 84, 905840607 (2018), 1804.05145 .
- Burch et al. (2016) J. L. Burch, R. B. Torbert, T. D. Phan, L.-J. Chen, T. E. Moore, R. E. Ergun, J. P. Eastwood, D. J. Gershman, P. A. Cassak, M. R. Argall, S. Wang, M. Hesse, C. J. Pollock, B. L. Giles, R. Nakamura, B. H. Mauk, S. A. Fuselier, C. T. Russell, R. J. Strangeway, J. F. Drake, M. A. Shay, Y. V. Khotyaintsev, P.-A. Lindqvist, G. Marklund, F. D. Wilder, D. T. Young, K. Torkar, J. Goldstein, J. C. Dorelli, L. A. Avanov, M. Oka, D. N. Baker, A. N. Jaynes, K. A. Goodrich, I. J. Cohen, D. L. Turner, J. F. Fennell, J. B. Blake, J. Clemmons, M. Goldman, D. Newman, S. M. Petrinec, K. J. Trattner, B. Lavraud, P. H. Reiff, W. Baumjohann, W. Magnes, M. Steller, W. Lewis, Y. Saito, V. Coffey, and M. Chandler, Science 352, aaf2939 (2016).
- Phan et al. (2018) T. Phan, J. Eastwood, M. Shay, J. Drake, B. Sonnerup, M. Fujimoto, P. Cassak, M. Oieroset, J. Burch, R. Torbert, A. Rager, J. Dorelli, D. Gershman, C. Pollock, P. Sharma Pyakurel, C. Haggerty, Y. Khotyaintsev, B. Lavraud, Y. Saito, and W. Magnes, Nature 557 (2018).
- Olson et al. (2016) J. Olson, J. Egedal, S. Greess, R. Myers, M. Clark, D. Endrizzi, K. Flanagan, J. Milhone, E. Peterson, J. Wallace, D. Weisberg, and C. Forest, Physical Review Letters 116 (2016).
- Cafaro et al. (1998) E. Cafaro, D. Grasso, F. Pegoraro, F. Porcelli, and A. Saluzzi, Phys. Rev. Lett. 80, 4430 (1998).
- Ottaviani and Porcelli (1993) M. Ottaviani and F. Porcelli, Phys. Rev. Lett. 71, 3802 (1993).
- Waelbroeck (1989) F. L. Waelbroeck, Physics of Fluids B 1, 2372 (1989).
- Jemella et al. (2003) B. D. Jemella, M. A. Shay, J. F. Drake, and B. N. Rogers, Phys. Rev. Lett. 91, 125002 (2003).
- Jemella et al. (2004) B. D. Jemella, J. F. Drake, and M. A. Shay, Physics of Plasmas 11, 5668 (2004).
- Loureiro et al. (2005) N. F. Loureiro, S. C. Cowley, W. D. Dorland, M. G. Haines, and A. A. Schekochihin, Phys. Rev. Lett. 95, 235003 (2005).
- Del Sarto et al. (2003) D. Del Sarto, F. Califano, and F. Pegoraro, Physical Review Letters 91, 235001 (2003).
- Grasso et al. (2001) D. Grasso, F. Califano, F. Pegoraro, and F. Porcelli, Phys. Rev. Lett. 86, 5051 (2001).
- Cassak and Drake (2013) P. A. Cassak and J. F. Drake, Physics of Plasmas 20, 061207 (2013).
- Comisso et al. (2016) L. Comisso, M. Lingam, Y.-M. Huang, and A. Bhattacharjee, Physics of Plasmas 23, 100702 (2016).
- Comisso et al. (2017) L. Comisso, M. Lingam, Y.-M. Huang, and A. Bhattacharjee, The Astrophysical Journal 850, 142 (2017).
- Huang et al. (2017) Y.-M. Huang, L. Comisso, and A. Bhattacharjee, Astrophys. J. 849, 75 (2017), 1707.01863 .
- Biskamp (2000) D. Biskamp, Magnetic Reconnection in Plasmas, Cambridge Monographs on Plasma Physics (Cambridge University Press, 2000).
- Porcelli (1991) F. Porcelli, Phys. Rev. Lett. 66, 425 (1991).