11email: gisella.clementini@inaf.it
2 INAF-Osservatorio Astronomico di Capodimonte, Via Moiariello 16, I-80131 Naples, Italy
3 Department of Astronomy, University of Geneva, Ch. d’Ecogia 16, 1290 Versoix, Switzerland
4 GEPI, Observatoire de Paris, Université PSL, CNRS, 5 Pla Jules Janssen,92190 Meudon, France
5Observatoire Astronomique de Strasbourg, Université de Strasbourg, CNRS, UMR 7550, 11 rue de l’Université, 67000 Strasbourg, France
6Department of Astronomy, University of Geneva, Chemin Pegasi 51, 1290 Versoix, Switzerland
7 Sednai Sàrl, Geneva, Switzerland
8 Max Planck Institute for Astronomy, Königstuhl 17, 69117 Heidelberg, Germany
9 Konkoly Observatory, ELKH Research Centre for Astronomy and Earth Sciences, Eötvös Loránd Research Network, Konkoly Thege Miklós út 15-17, 1121 Budapest, Hungary
10 CSFK Lendület Near-Field Cosmology Research Group, Konkoly Thege Miklós út 15-17, 1121 Budapest, Hungary
11 Institute of Astronomy, University of Cambridge, Madingley Road, Cambridge CB3 0HA, UK
Gaia DR3: Specific processing and validation of all-sky RR Lyrae and Cepheid stars - The RR Lyrae sample
Abstract
Context. RR Lyrae stars are excellent tracers of the oldest stars (ages 9-10 Gyr) and standard candles to measure the distance to stellar systems composed prevalently by an old stellar population. The Gaia Third Data Release (DR3) publishes a catalogue of full-sky RR Lyrae stars observed during the initial 34 months of science operations, that were processed through the Specific Object Study (SOS) pipeline, developed to validate and characterise Cepheids and RR Lyrae stars (SOS Cep&RRL) observed by Gaia.
Aims. Main steps of the SOS Cep&RRL pipeline are described in the documentation and papers accompanying previous Gaia Data Releases. For DR3 the pipeline was modified as to process, besides the Gaia multiband (, , ) time series photometry, also epoch radial velocities measured for RR Lyrae and Cepheids by the Radial Velocity Spectrometer (RVS) on board Gaia.
Methods. The SOS Cep&RRL validation of DR3 candidate RR Lyrae stars relies on diagnostics tools that include the Period versus -amplitude diagram and the Period versus and parameters of the light curve Fourier decomposition, as defined by a reference sample of bona fide RR Lyrae stars known in the literature (Gold Sample). Great care was devoted to build a large and pure Gold Sample comprising more than 200 000 RR Lyrae stars. The SOS processing led to an initial catalogue of 271 779 RR Lyrae stars, that are listed in the vari_rrlyrae table of the DR3 archive. A thorough cleaning procedure was then performed, to produce a final catalogue of SOS-confirmed DR3 RR Lyrae stars, by dropping sources that clearly are contaminants, or have an uncertain classification.
Results. Multiband time series photometry and characterisation are published in Gaia DR3 for a clean, validated sample of 270 905 RR Lyrae stars (174 947 fundamental mode, 93 952 first overtone and 2 006 double-mode RR Lyrae) confirmed and fully characterised by the SOS Cep&RRL pipeline. They are distributed all over the sky, including variables in 95 globular clusters and 25 Milky Way (MW) companions (the Magellanic Clouds, 7 dwarf spheroidal galaxies and 16 ultra-faint dwarf satellites of the MW). RVS time series radial velocities are also published for 1 096 RR Lyrae and 799 Cepheids of different types (Classical, Anomalous and Type II Cepheids). Of the 270 905 DR3 RR Lyrae stars, 200 294 are already known in the literature (Gold Sample) and 70 611 are, to the best of our knowledge, new discoveries by Gaia. An estimate of the interstellar absorption is published for 142 660 fundamental-mode RR Lyrae stars from a relation based on the -band amplitude and the pulsation period. Metallicities derived from the Fourier parameters of the light curves are also released for 133 559 RR Lyrae stars.
Conclusions. The final Gaia DR3 catalogue of confirmed RR Lyrae stars almost doubles the DR2 RR Lyrae catalogue. An increase of statistical significance, a better characterization of the RR Lyrae pulsational and astrophysical parameters, and the improved astrometry published with Gaia EDR3, make the SOS Cep&RRL DR3 sample, the largest, most homogeneous and parameter-rich catalogue of All-Sky RR Lyrae stars published so far, in the magnitude range from = 7.64 mag (the magnitude of RR Lyr itsef, the class prototype) to = 21.14 mag (the faintest RR Lyrae in the catalogue).
Key Words.:
star: general – Stars: oscillations – Stars: variables: RR Lyrae – Stars: variables: Cepheids – Methods: data analysis – Magellanic Clouds1 Introduction
RR Lyrae are low mass (typical masses around 0.60.8 M☉), old (ages larger than 9-10 billion years) stars whose surface expands and contracts regularly with periods shorter than a day. The pulsation gives rise to a variation of brightness occurring in two main flavours. The c-type RR Lyrae (RRc) stars have close to sinusoidal light curves, that repeat in time with periodicities typically between about 0.2 and 0.42 day (d), and an amplitude of the light variation of up to about half a magnitude in the visual band. RRc stars oscillate in the radial first overtone pulsation mode. The ab-type RR Lyrae (RRab) stars have asymmetrical, sawtooth light curves, periods typically between about 0.42 and 1 d, and visual amplitudes in the Gaia G band from above 0.1 to more than one magnitude. They pulsate in the fundamental pulsation mode. In a small fraction of RR Lyrae stars, fundamental and first overtone pulsation modes are excited at the same time, giving rise to the double-mode (d-type) RR Lyrae (RRd). The characteristic light variation makes RR Lyrae stars easily recognizable even in very crowded region of the sky or high extinction conditions. Their pulsation characteristics (periods, amplitudes, mean magnitudes/colours, etc) allow an estimate of their metal abundance and reddening, thus bringing invaluable added values (see, e.g. Smith, 1995; Catelan & Smith, 2015, for comprehensive reviews on RR Lyrae stars).
RR Lyrae stars allow to measure the distance to the systems they live in as they follow luminosity – metallicity () relations in the visual bands (see, e.g. Cacciari & Clementini 2003, and references therein; Clementini et al. 2003, and references therein and, e.g. Muraveva et al. 2018, for more recent relations in the Johnson and bands, calibrated on parallaxes; Garofalo et al. 2022, for more recent relations in the Johnson and bands, calibrated on parallaxes) and period – luminosity - (metallicity) () relations in the infrared (see, e.g. Muraveva et al., 2018; Bhardwaj et al., 2021, and references therein, for relations in the and infrared bands). These variable stars are the only abundant, stellar tracers with a small relative distance error (5%), particularly at large distances, hence allowing to measure the most accurate distances to old, distant stellar populations. But also at 5 - 10 kpc from the Milky Way (MW) disc, they are the stars with the most precise distances.
RR Lyrae stars are also excellent tracers of the oldest stars which witnessed the first epoch of galaxy formation, thus can provide hints on the “building blocks” that contributed to the build up of galactic halos (see, e.g. Catelan & Smith, 2015; Martínez-Vázquez et al., 2019, and references therein). All these properties make the RR Lyrae stars invaluable dynamical tracers of the Galaxy and a crucial tool for a plethora of applications, from Galactic archaeology and the search for the fossil records of the Galactic formation, to tidal streams, to dynamics, to validation of distances and extinction maps, and characterization of small scale extinction; therefore explaining the renewed, large interest in these stars within the astronomical community.
Previous Gaia data releases (Gaia Collaboration et al. 2016; Gaia Collaboration et al. 2018) already showed the great potential of the mission in the field of stellar variability (Gaia Collaboration et al., 2019) and for RR Lyrae stars and Cepheids in particular (Gaia Collaboration et al. 2017; Clementini et al. 2016, hereafter Paper I; Clementini et al. 2019, hereafter Paper II). This is thanks to the multi-epoch nature and almost simultaneous acquisition of the (spectro-)photometry, astrometry and spectroscopy data collected by Gaia all over the celestial sphere.
The small sample of RR Lyrae stars and Cepheids in the Large Magellanic Cloud (LMC; about 3 200 sources in total) published with Gaia Data Release 1 (DR1; Paper I), were only a teaser of the samples and data products published for these pulsating stars in subsequent Gaia releases. Multi-band time-series photometry and pulsation characteristics were published in Gaia Data Release 2 (DR2; Gaia Collaboration et al. 2018) for a catalogue of about 140 000 RR Lyrae stars and for about 10 000 Cepheids observed over the whole Galaxy (including 87 globular clusters and 14 MW companions) during the first 22 months of Gaia operation (Paper II). The number of RR Lyrae has now almost doubled, and that of Cepheids has increased by 50%, compared to DR2, thanks to the larger amount and extended time baseline (34 months) spanned by the Gaia Data Release 3 (DR3).
On 13 June 2022 with Gaia DR3 (Gaia Collaboration et al., 2022b) multiband (, , and ) light curves are released for 270 905 RR Lyrae stars and 15 006 Cepheids confirmed and fully characterised by the Specific Object Study pipeline for Cepheids and RR Lyrae (hereafter, SOS Cep&RRL; Paper I and II) developed within the Gaia Data Processing and Analysis Consortium (DPAC). Radial velocity (RV) time series measurements obtained with the Radial Velocity Spectrometer (RVS; Cropper et al. 2018) on board Gaia for a sub-sample comprising 1 096 RR Lyrae stars and 799 Cepheids (Ripepi et al., 2022) validated by the SOS Cep&RRL pipeline are also published with DR3. The above numbers all refer to samples cleaned from contaminants and sources with an uncertain classification.
In this paper we present changes implemented in the SOS Cep&RRL pipeline with respect to DR2. We describe in particular a new module activated to process the RVS time series data and explain how the RR Lyrae and Cepheid variables with epoch RVs published in DR3 were selected. We then focus on the procedures and validations that led to the production of the final, clean sample of confirmed RR Lyrae stars released in DR3. The processing and validation of the confirmed DR3 Cepheids are described instead in a companion paper (Ripepi et al., 2022).
Characteristic parameters derived by the SOS pipeline for the final sample of Gaia DR3 RR Lyrae stars, that are published in the vari_rrlyrae table, include: pulsation period(s), peak-to-peak amplitudes of the , and [Amp, Amp(), Amp()] light curves, classification in type/pulsation mode (RRab, RRc and RRd), mean magnitudes computed as an intensity-average over the full pulsation cycle, along with the , , and parameters of the Fourier decomposition of the -band light curves. Metallicities ([Fe/H]) computed from a relation found to exist with the pulsation period and the Fourier parameter of the RR Lyrae light curves (Jurcsik & Kovacs, 1996; Nemec et al., 2013), and individual absorption values derived from the relation existing with the pulsation period and the amplitude of the light variation (Piersimoni et al., 2002) are also released for about a half of the whole SOS RR Lyrae sample. Amplitudes of the RV curves and mean RV values, computed after modeling the RV curves, are also provided in the DR3 vari_rrlyrae and vari_cepheid tables, for sub-samples of RR Lyrae stars and Cepheids.
The paper is organised as follows. In Section 2 we provide a brief overview of the SOS Cep&RRL pipeline and describe changes and developments implemented to process the Gaia DR3 photometry and radial velocity time series data. Section 3 presents the DR3 input data, the selections applied to run the pipeline on the RR Lyrae candidates and results from the processing. Section 4 focuses on the analysis of the RVS radial velocity (RV) time series data for sub-samples of RR Lyrae stars and Cepheids for which RVS RV curves are published in DR3. Section 5 specifically discusses the astrophysical parameters (metallicity and -band absorption values) we derived from the pulsation characteristics of RR Lyrae stars. Cleaning from contaminants, re-classifications and final validation of the RR Lyrae catalogue are described in Sect. 6. In Sect. 7 we discuss the completeness and purity of the clean catalogue of RR Lyrae stars published in DR3 and present colour-magnitude diagrams and sky maps defined by these RR Lyrae stars. Finally, conclusions and further developments of the SOS Cep&RRL pipeline, in preparation for future Gaia data releases (DR4 and 5), are briefly discussed in Sect. 8.
2 The SOS Cep&RRL pipeline: general overview and changes for DR3
The variability processing (see Chapter 10 in Gaia DR3 Documentation, Rimoldini et al., 2022b) 111https://geapre.esac.esa.int/archive/documentation/GDR3. (This link will be updated afterwards). is based on the analysis of Gaia DR3 calibrated and integrated and time-series photometry (Riello et al., 2021) and, for RR Lyrae stars and Cepheids, also on the RVS radial velocity time series (Sartoretti et al., 2022), through the various steps (modules) of the general variability analysis approach described in Eyer et al. (2017) and in Eyer et al. (2022) specifically for DR3. This includes identification and classification in different types of the variable candidates, that are then fed to the Specific Objects Study (SOS) pipelines, each of which is specifically tailored to validate and characterise a certain type of variability. Figure 10.1 in the Gaia DR3 Documentation (Rimoldini et al., 2022b) shows a schematic view of the general variability processing occurring before entering the SOS pipelines.
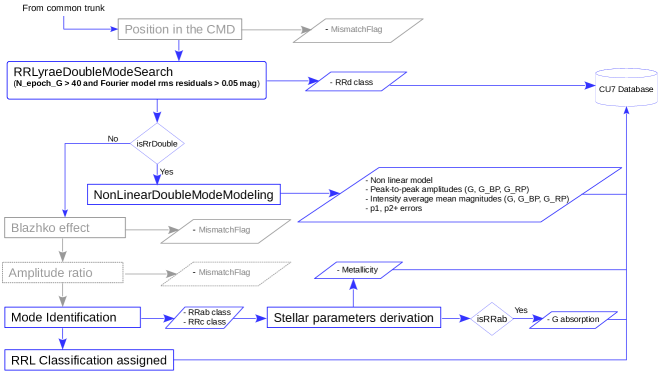
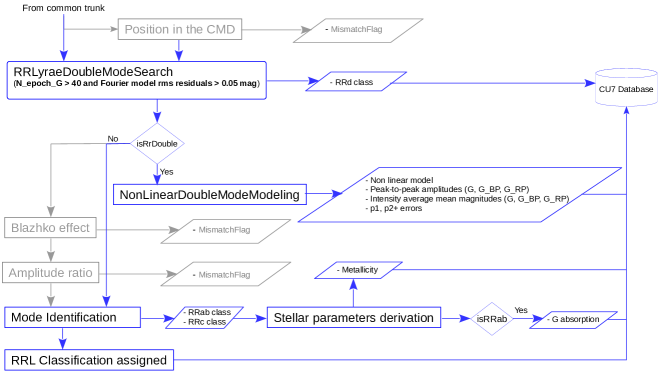
The SOS Cep&RRL pipeline is designed to validate and characterise all-sky candidate RR Lyrae stars and Cepheids identified in the Gaia , , and time series photometry by the General Supervised Classification module (Rimoldini et al. 2022a) in the variability analysis pipeline. This module uses machine learning methods and multi-class supervised classifiers to classify Gaia time series of candidate variable objects into categories. A full description of the SOS Cep&RRL pipeline can be found in Papers I and II, to which the interested reader is referred for details. In the following, we summarise steps of the pipeline that are in common to RR Lyrae stars and Cepheids (pipeline main trunk, Fig. 1) and the processing taking place in the RR Lyrae branch (Fig. 2). The Cepheid branch is discussed in a companion paper (Ripepi et al., 2022).
Steps of the SOS Cep&RRL pipeline main trunk include:
- •
-
•
modeling of the time series data, folded according to the derived , using the Levenberg-Marquardt (Levenberg 1944; Marquardt 1963) non-linear fitting algorithm (NonLinearFourierAnalysis module in Fig. 1), which refines both the period and model of the light curves;
-
•
derivation of the variable star main parameters [intensity-averaged mean magnitudes; peak-to-peak amplitudes: Amp, Amp, Amp; epoch of maximum light; etc.], from the light curves modelled by the non-linear fitting algorithm;
-
•
Fourier decomposition of the -band light curve and derivation of the Fourier parameters: , , R21 and ;
-
•
search for secondary periodicities.
In the RR Lyrae branch the following diagnostic tools and combination of parameters are used to extract bona fide RR Lyrae stars from the candidates, classify them in type (RRc, RRab, RRd)/pulsation mode (first-overtone, fundamental mode, double-mode), and derive their astrophysical parameters [metallicity – [Fe/H], and absorption in the -band – ]:
-
•
pulsation Period (P) versus Amp diagram ();
-
•
versus diagram;
-
•
R21 versus diagram;
-
•
versus diagram;
-
•
R31 versus diagram;
-
•
Fe/H versus , relation;
-
•
versus Amp, , relation.
A number of changes were implemented and new parts of the pipeline were activated for the processing of the DR3 RR Lyrae and Cepheid candidates. We have highlighted them in boldface in Figs. 1, 2 and describe below those occurring in (and before) the pipeline main trunk and the RR Lyrae branch. A detailed description of the changes implemented in the Cepheid branch (improved detection of multimode Cepheids, adoption of new Period-Luminosity and Period-Wesenheit relations directly computed in the Gaia passbands for the different types of Cepheids, etc.) is presented in Ripepi et al. (2022).
-
•
Optimization of outlier-removal operators
Outliers and measurements of poor quality in the Gaia photometry and RV time series data are filtered out by operators of the general variability pipeline, whose configuration parameters can be adapted to the specific type of variable sources under investigation. In the main chain of operators that are applied sequentially to transform and filter the input photometric time series the RemoveOutliersFaintAndBrightOperator (ROFABO), adopted for DR2, was replaced by the MultibandOutlierRemovalOperator (MORO), (see Section 10.2.3.2 in Gaia DR3 Documentation, Rimoldini et al., 2022b, and Eyer et al. 2022). MORO identifies outliers from the comparison of the measurements in the three Gaia photometric bands. However, a ROFABO step, with configuration parameters we specifically tailored to RR Lyrae and Cepheid variables, was also added to the operators chain to improve the rejection of bad measurements in the time series photometry of sources processed through the SOS Cep&RRL pipeline. An RvsOutlierRemovalOperator, that applies a similar approach as the ROFABO, was also applied to clean the RVS time series data (see Rimoldini et al., 2022b, for details). -
•
Processing of RVS radial velocity time series
A specific routine was activated that processes the RVS time series RV measurements. The routine constructs the Fourier model of the RV curve obtained by folding the data according to the period inferred from the G-band time series photometry and returns the Fourier amplitudes and phases, the peak-to-peak amplitude of the RV curve [Amp(RV)], the mean RV and the epoch of minimum RV value. -
•
Error estimate via bootstrap technique
Errors for all the parameters of the RR Lyrae stars and Cepheids processed and confirmed by the SOS pipeline for DR3 were estimated via a bootstrap technique, that replaced the Monte Carlo simulations (consisting into randomly varying the data within their errors) adopted for DR1 and DR2 (Paper I and II). Specifically, errors on the Fourier fit parameters (period, amplitudes and phases) and the quantities characterizing the light and RV curves (mean magnitudes, mean velocity, peak-to-peak amplitudes, etc.) were estimated by randomly re-sampling the input data (allowing data point repetitions) and the parameters were recalculated from the resulting simulated sample. The procedure was repeated 100 times and, for each parameter, the error was estimated from the robust standard deviation (1.486 MAD, where MAD is the median absolute deviation) of the resulting bootstrap distributions. A similar procedure was also applied to estimate random errors of other attributes released for RR Lyrae stars, such as metal abundances and absorption values.
-
•
New and revised sky sub-regions
The last module of the pipeline main trunk subdivides the sources according to different regions on the sky, before sending them to the RR Lyrae and Cepheid branches. This is because different relations are needed to classify the sources, depending on their position on the sky (see Paper II). For DR2 we divided the sky in three separate regions: Large Magellanic Cloud (LMC), Small Magellanic Cloud (SMC) and, All-Sky comprising the remaining part of the sky. The LMC and SMC regions were expanded for DR3. The new region for the LMC is a box centred on the galaxy at RALMC(J2000)= , DecLMC(J2000)= and extending from to in RA and from to in Dec. Similarly, the new region for the SMC is a box centred at RASMC(J2000)= , DecSMC(J2000)= and extending from to in RA and from to in Dec. Two further regions were also defined, one centred on the Andromeda galaxy (M31) and one around the Triangulum galaxy (M33), to allow the processing of bright Cepheids within the reach of Gaia in these galaxies. Details on these two additional regions are provided in Ripepi et al. (2022).In DR2 a number of Cepheids with -band amplitude smaller than 0.5 mag and periods shorter than 1 d were missed or misclassified as RR Lyrae stars. A change was implemented in the SOS pipeline for DR3 by which sources classified as RR Lyrae stars at the end of the common trunk in Fig. 1 were sent to both the RR Lyrae and the Cepheid branches if they belonged to the region of the sky and satisfied the conditions described in the following:
-
–
All-Sky sources with a parallax available were always sent to both branches;
-
–
sources in the LMC and in the SMC sub-regions (as defined above) with amplitude smaller than 0.5 mag and periods shorter than 1 d, and mean magnitude brigther than 18.5 and 19 mag in the LMC and SMC, respectively;
-
–
all sources with 1 d in the M31 and M33 sub-regions.
-
–
This procedure caused a number of sources to have a double classification. They were checked and finally classified in just one class (RR Lyrae star or Cepheid; see Sects. 3.2 and 3.3).
Two major changes were implemented in the RR Lyrae branch (Fig. 2) of the SOS pipeline:
-
•
Improvement of double-mode RR Lyrae detection
The module to search for a secondary periodicity in the time series photometry of RR Lyrae stars was activated only for sources with more than 40 measurements (FoV transits) in the -band time series data, and when residuals from the Fourier model best fitting the -band light curve folded with the primary period were larger than 0.05 mag. This allowed us to reduce significantly the number of spurious double-mode RR Lyrae detections. -
•
Implementation of new thresholds in the Period-Amplitude diagnostic
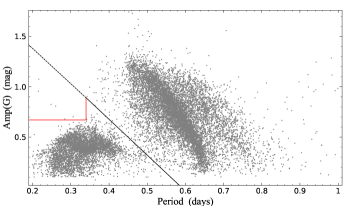
The Period-Amplitude () diagram, is used by the SOS pipeline to separate fundamental mode and first overtone RR Lyrae stars (see fig. 4 in Paper II). For DR1 and DR2 we applied a straight line to separate the RRab and RRc regions. For DR3 we have defined new boundaries of the two regions, in order to properly distinguish high amplitude/short period RRab from RRc stars. The new boundaries are shown by the red segments (described by the condition: Amp() mag for d) that replaced the dotted portion of the black straight line in Fig. 3. All sources below the red segments and the black solid line are classified as RRc stars, whereas sources above those lines are RRab stars. However, the new thresholds were not able to capture all such short period RRab stars (see Sect. 6.1). A more efficient procedure will be implemented for Gaia DR4 that, specifically taking into account the much steeper rise to maximum light of RRab compared to RRc stars, will help to better disentangling the two types.
Finally, shown in gray in Fig. 2 are three modules not activated for DR3. Among them, the Amplitude ratio routine, although not operational during the SOS processing, was used during validation to compute Amp/Amp, Amp/Amp, Amp/Amp ratios and identify eclipsing binaries contaminating the RR Lyrae sample (see Sect. 6).
3 Application of the SOS Cep&RRL pipeline to the DR3 dataset: input data and source selections
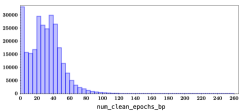
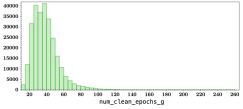
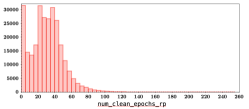
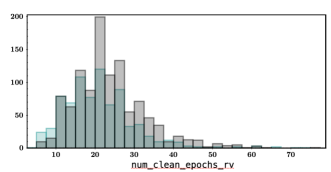
Input data fed into the SOS Cep&RRL pipeline in DR3 consisted of FoV and integrated and (when available) time series photometry of all-sky variable sources classified as RR Lyrae (and Cepheids, see Ripepi et al. 2022) candidates with various probability values, by the General Supervised Classification module (Rimoldini et al. 2022a; see Fig. 1) of the variability pipeline, as well as RV time series data from the RVS, for small subsamples of these sources with mean magnitude brighter than 14 mag.222 is the Gaia magnitude of the flux collected in the RVS passband: 845 - 872 nm. For the transformation from to magnitude see Eq. 2 in Gaia Collaboration et al. (2018). In practise, 0.48 and 0.45 mag, for RRc and RRab stars, respectively. The photometry and RV datasets comprise observations collected by Gaia over 34 months, from 2014 July 25 to 2017 May 28. In this time frame, for the confirmed RR Lyrae stars discussed in this paper, Gaia obtained on average about 38-39 useful photometric measurements in the -band (with min/max values between 12 and 257 measures, depending on the source position on sky, Fig. 4, centre panel), to compare with 30 measures in DR2, and about 30 measurements in (with min/max values between 0 and 258, Fig. 4, left panel) and (with min/max values between 0 and 254, Fig. 4, right panel). Similarly, the Gaia RVS time series data for the sub-samples of RR Lyrae and Cepheids presented in Sect. 4 comprise an average of about 23 RV measurements (min/max values between 5 and 77).
The following criteria were applied to select RR Lyrae candidates to process with the SOS Cep&RRL pipeline:
-
•
sources classified as RR Lyrae candidates, by the Classifiers of the General Supervised Classification module, with minimum probability thresholds chosen as to maximise the recovery of RR Lyrae stars known from different surveys in the literature (see Sect. 3.1);
-
•
sources with a minimum number of 12 -FoV transits, after the application of the MORO and ROFABO outlier removal operators (see Fig. 4);
-
•
a minimum number of 5 measurements, for the publication of the RV time series and, at least 7 transits for the modeling of the folded RV curve (see Fig. 11);
-
•
a peak-to-peak amplitude 0.1 mag in the -band;
-
•
periods in the range of 0.2 1.0 d.
3.1 Training sets and literature reference catalogues
Candidate RR Lyrae stars to be processed through the SOS Cep&RRL pipeline were selected on the basis of their probability score, as to maximise the recovery of RR Lyrae stars already known in the literature. A preliminary step was the creation of a reference database of known RR Lyrae stars, by collecting catalogues of these variables from major surveys in the literature, including those in 152 different stellar systems: the Magellanic Clouds, 107 globular clusters, 9 dwarf spheroidal galaxies (dSphs; Carina, Draco, Fornax, Leo I, Leo II, Sagittarius, Sculptor, Sextans and Ursa Minor) and 34 ultra-faint dwarfs (UFDs). This large catalogue, homogenized by eliminating duplicates, contains more than 425,000 unique, all-sky, RR Lyrae entries and spans an about 16 magnitude range, from RR Lyr itself (V=7.76 mag, Fernley et al. 1998) to V6, the lone RR Lyrae star identified in Leo T (Clementini et al., 2012), one of the furthest ultra-faint MW satellites, that with a mean magnitude V=23.59 mag overcomes Gaia’s faint limit by about 3 magnitudes. However, we note that 97% of the sources in our custom RR Lyrae catalogue are within Gaia’s limiting magnitude and have a counterpart in the EDR3 source_table (see below). To build our custom catalogue we primarily used as reference the OGLE catalogues for RR Lyrae stars (version IV of the survey, Soszyński et al. 2014, 2019), which have a high completeness and purity for the LMC, SMC and the MW bulge and disc, along with the Gaia DR2 RR Lyrae catalogue in the gaiadr2.vari_rrlyrae table (Paper II), CATALINA (Drake et al., 2013, 2014, 2017; Torrealba et al., 2015), KEPLER (Molnár et al., 2018), the Zwicky Transient Facility (ZTF; Chen et al. 2020), the All Sky Automated Survey (ASAS; Pojmanski 2000, 2002; Pigulski et al. 2009), the All-Sky Automated Survey for Supernovae (ASAS-SN; Jayasinghe et al. 2019), LINEAR (Palaversa et al., 2013; Sesar et al., 2013), The Palomar Transient Factory (PTF; Sesar et al. 2014), the VISTA Variables in the Via Lactea survey (VVV; Contreras Ramos et al. 2018; Dékány et al. 2018), the fifth edition of the General Catalogue of Variable Stars (GCVS; Samus’ et al. 2017) and, the PanSTARRS1 3 survey (PS1; Sesar et al. 2017). To integrate our compilation with known RR Lyrae stars in Galactic globular clusters (GCs), we used as main references an updated version of the Variable Stars in Galactic Globular Clusters catalogue (Clement et al., 2001), while for RR Lyrae stars in the MW UFDs we used the compilation in Vivas et al. (2020). For the MW dSphs we used the RR Lyrae collections by Muraveva et al. (2020) for Draco, Martínez-Vázquez et al. (2016) for Sculptor, Bersier & Wood (2002) for Fornax, Coppola et al. (2015) for Carina, Siegel & Majewski (2000) for Leo II, Stetson et al. (2014) for Leo I, Vivas et al. (2019) for Sextans, Kunder et al. (2008) for Sagittarius and, by Nemec et al. (1988) and Bellazzini et al. (2002) for Ursa Minor.
We specifically note that in building our custom RR Lyrae catalogue we privileged inclusiveness, hence, we did not make any cut as far as purity is concerned. For the selection procedures described in the following sections we used a version frozen at December 2020 of our custom RR Lyrae catalogue. However, the catalogue is being regularly updated as soon as new RR Lyrae compilations appear in the literature, and we plan to make a most updated version available on-line soon after Gaia DR3 (Garofalo et al. 2022, in prep.).
We performed a spatial cross-match, within a 2.5 paring radius, of our custom RR Lyrae catalogue and sources in the gaia_source table of the Gaia EDR3 archive (gaiaedr3.gaia_source) finding a counterpart in the EDR3 main catalogue for 414 082 (97) of the RR Lyrae stars in our collection.333We refer the reader to Gavras et al. (2022), for a comprehensive catalogue of known variable sources cross-matched with Gaia DR3, extending to also other types of variability the catalogue being discussed here. The Classifiers of the General Supervised Classification module returned these 414,082 sources as RR Lyrae candidates with probabilities ranging from very low values. Among them, more than 75% (311 798) were classified as RR Lyrae by the SOS Cep&RRL pipeline, with characteristic parameters (, pulsation mode, etc. ) consistent with the literature recovered for about 65% of them.
3.2 Gold sample and validation criteria
In order to validate the unexpectedly large number of candidate RR Lyrae produced by the Classifiers and confirmed by the SOS Cep&RRL pipeline, and extract a bona fide sample to release in DR3, we adopted a strategy driven by our custom RR Lyrae reference catalogue and the RR Lyrae diagnostic tools summarised in Sect 2. Our strategy consisted of two main steps:
-
1.
we divided the sources between known (311,798 sources) and potentially new/unknown RR Lyrae stars, based on our custom catalogue;
-
2.
we used the diagnostic tools of known RR Lyrae stars correctly characterized by the SOS Cep&RRL pipeline (Gold Sample RR Lyrae stars, hereafter) as a reference to select and validate new/unknown RR Lyrae stars.
A large effort was devoted to build from the initial sample of 311,798 known RR Lyrae stars recovered and characterized by the SOS Cep&RRL pipeline a Gold Sample as large and pure as possible. We started by selecting from the 311 798 known RR Lyrae stars those with SOS pulsation properties simultaneously satisfying the following conditions:
-
•
—— 0.001 d;
-
•
the Fourier parameter within the range appropriate for RR Lyrae stars: 3.0 5.8 rad, in the vs diagram, for sources with light curves modeled with at least 2 harmonics.
Then, for sources with light curves modeled with only 1 harmonic, we used the diagram to reject those falling outside the regions appropriate for RR Lyrae stars. We also relaxed the period criterion (to —— 0.003 d and to —— 0.01 d) in a number of cases (5 617 sources in total), after visual inspection of the light curves. By this procedure the original sample of 311 798 known RR Lyrae stars reduced to 201 173 sources. Among them, 369 were found to be eclipsing binaries, based on the ratios of the , , light curve amplitudes (see end of Sect 2), and then further confirmed by visual inspection of the light curves; and 168 sources with a double classification were re-classified as Cepheids (see also Sect. 6).
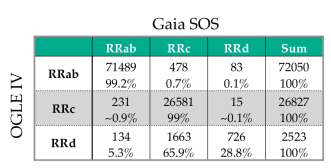
This led us to a final Gold Sample comprising 200 636 bona fide known RR Lyrae stars. Among them 101 400 are RR Lyrae stars observed by OGLE in the LMC, SMC and the Galactic bulge and disc, of which 71 489 are classified as RRab, 26 581 as RRc and 726 as RRd stars for both the SOS Cep&RRL pipeline and OGLE. Figure 5 shows a confusion matrix for the Gold Sample RR Lyrae stars, drawn using as control sample the OGLE-IV RR Lyrae catalogue.
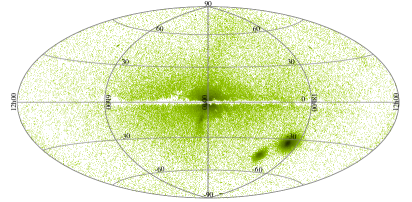
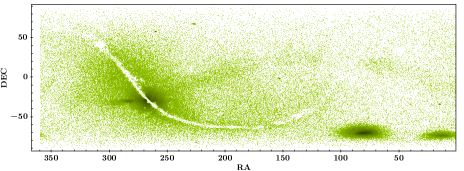
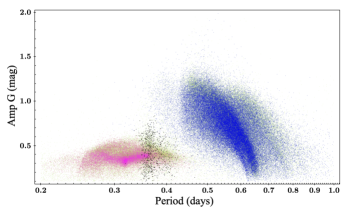
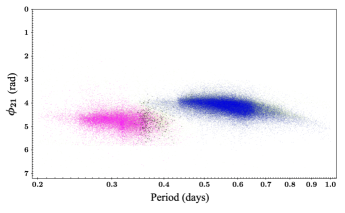
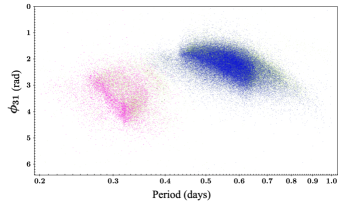
Figure 6 shows the sky distribution (using galactic and equatorial coordinates in the top and bottom panels, respectively) of the RR Lyrae stars in the Gold Sample. The three panels of Fig. 7 show their , vs and vs diagrams, where the RR Lyrae stars in common with OGLE (101,400 sources) are plotted using different colours for RRab (blue), RRc (magenta) and RRd (black) stars.
3.3 Potentially new/unknown RR Lyrae stars
We have used the Gold Sample as a training set, to select bona fide RR Lyrae stars from the remaining very large sample of potentially new/unknown RR Lyrae candidates provided by the Classifiers and processed through the SOS Cep&RRL pipeline. Specifically, we used the , vs and vs diagrams defined by the Gold Sample RR Lyrae stars (see Fig. 7), to select, through sequential steps, potentially new/unknown, bona fide RR Lyrae stars, as briefly outlined below.
-
•
Among the sources with light curves modeled with 3 or more harmonics, we retained as bona fide RR Lyrae stars only those with the parameter in the proper region of the vs diagram, as defined by the Gold Sample RR Lyrae stars (0.6 5.1 rad, see, bottom panel of Fig. 7).
-
•
Bona fide RR Lyrae stars were selected from sources with light curves modeled with only 2 harmonics, by making a 2-dimensional cartesian cross-match between their (, ) parameters and those of the Gold Sample RR Lyrae stars as reference (see, centre panel of Fig. 7), and verifying afterwards that they were properly located also in the Gold Sample diagram (see upper panel of Fig. 7).
-
•
Finally, bona fide RR Lyrae stars were selected from sources with light curves modeled with only 1 harmonic, by making a 2-dimensional cartesian cross-match between their [, Amp] parameters and those of the Gold Sample RR Lyrae stars as reference (see, upper panel of Fig. 7).
Some of sources retained as bona fide new RR Lyrae stars, according to the above selection procedures, turned out to have a double classification. This occurred for sources with d and Amp mag (see Sect. 2) which could either be c-type RR Lyrae stars or first-overtone classical Cepheids (DCEP_1O). The light curves of these sources were visually inspected and their position on the Period-Luminosity, Period-Wesenheit relations for DCEPs (see Ripepi et al., 2022) checked, to finally classify them in one class or the other. At the end of these extensive selection and cleaning procedures we were left with a sample of 72 167 new/unknown (to the best of our knowledge) bona fide RR Lyrae stars.
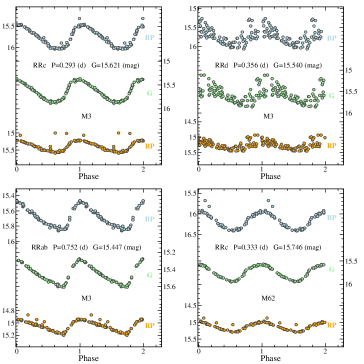
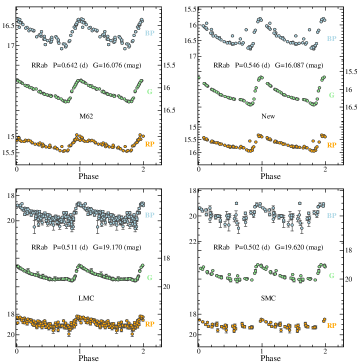
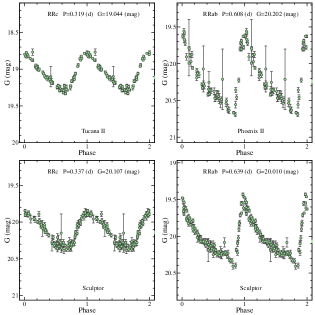
To summarise, the total number of DR3 RR Lyrae stars confirmed and fully characterised by the SOS Cep&RRL pipeline adds to 272 803 sources (between known RR Lyrae stars in the Gold Sample and new discoveries by Gaia). These sources were first cross-matched with catalogues of different types of variable stars produced by other SOS variability pipelines, to check for possible overlaps. A number were found with ellipsoidal variables (ELL; Gomel et al., 2022), eclipsing binaries (ECL; Mowlavi et al., 2022) and Active Galactic Nuclei (AGN; Carnerero et al. 2022). They were solved by assigning the overlapping sources to a unique variability class after visual inspection of the light curves. The resulting RR Lyrae catalogue then went through an iterative process of cross-validation aimed to ensure consistency and quality of the different data products (astrometry, photometry, variability, etc.) published for the Gaia DR3 sources. By this whole procedure the RR Lyrae catalogue was trimmed down to 271 779 sources, of which 200 589 are in the Gold Sample and 71 190 are potentially new RR Lyrae stars, that are published in the DR3 vari_rrlyrae table. Examples of the , and light curves for DR3 RR Lyrae stars with different pulsation mode (RRab, RRc and RRd) in the MW field and in a number of different stellar systems (the GCs M3 and M62, the LMC and the SMC, the Sculptor dSph, and the Phoenix II and Tucana II UFDs) are presented in Figs. 8 and 9.
The catalogue of 271 779 RR Lyrae stars was further cleaned by contaminants and sources affected by issues which emerged after the final export of the DR3 vari_rrlyrae table. This final cleaning procedure is described in Sect. 6.
4 RVS radial velocity time series for RR Lyrae stars and Cepheids
With DR3 for the first time epoch RVs measured from the RVS spectra are published for a small sample of RR Lyrae stars and Cepheids. This small dataset provides a first quality assessment of the RVS transit RVs. At the same time, it anticipates RVS data-products that will become available with next Gaia releases. In the following subsections we describe how this sample was selected (Sect. 4.1), processed by the SOS pipeline (Sect. 4.2) and validated with the literature (see Sect. 4.3 for the RR Lyrae stars, and Sect. 6.6 in Ripepi et al. 2022 for the Cepheids).
4.1 Target selection
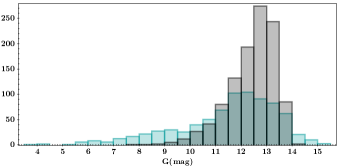
The gaia_source table in the DR3 archive provides RV values444The RV values of RR Lyrae stars and Cepheids in the DR3 gaia_source table are combined RVs obtained in 2 different ways depending on the star magnitude. For bright stars (12 mag), the combined RV is the median of the single-transit RVs. For faint stars, for which the single-transit RVs are less precise, the single-transit cross-correlation functions are averaged. The mean cross-correlation function obtained in this way is then used to measure the star RV. for 5 096 RR Lyrae stars and 3 190 Cepheids that were confirmed by the SOS Cep&RRL pipeline. Among them we selected sources with 5 of more epoch RV measurements and mean magnitude brighter than 15.5 mag. A further selection was made by visual inspection of the light and RV curves, ending up with a sample of 1 100 RR Lyrae stars and 798 Cepheids.
The 1 100 RR Lyrae stars have intensity-averaged mean magnitudes (as computed by the SOS pipeline) in the range of 7.64 14.33 mag (Fig. 10, gray histogram) and a number of RVS individual measurements ranging from 5 to 77 (Fig. 11, gray histogram). The 798 Cepheids have intensity-averaged mean magnitudes in the range of 3.75 15.46 mag (Fig. 10, cyan histogram) and a number of valid RVS individual measurements ranging from 5 to 74 (Fig. 11, cyan histogram).
The epoch RVs are computed using the RVS pipeline described in the on-line documentation Sartoretti et al. (2022, Chap. 6). In practice they are derived by comparing each cleaned and calibrated RVS spectrum with the synthetic reference template of a star with similar atmospheric parameters. See Sartoretti et al. (2022, Section 6.4.8) and Sartoretti et al. (2018, Sect. 7) for a detailed description of how epoch RVs are calculated, and Sartoretti et al. (2022, Fig. 6.13) for the median precision of epoch measurements as a function of . The quality of the epoch RVs depends on several factors: the magnitude of the star (since the fainter the star, the noisier the spectrum); the appropriate match with a synthetic reference template (see Sartoretti et al. (2022, Section 6.4.8.3) for how template spectra are associated with RVS spectra); the quality of astrometric data; and potential limitations of the processing software (e.g., for deblending or the identification of peculiar stars). The epoch RVs published in DR3 are only those of the 1 100 RR Lyrae stars and 798 Cepheids described in this paper, which are available via the Gaia archive vari_epoch_radial_velocity table. Typical uncertainties of the epoch RVs for these sources are 1 km/s for 9-9.5 mag ( mag, for RR Lyrae stars) and 6.5 km/s for 13 mag ( mag for RR Lyrae stars) (see Sartoretti et al. (2022, Fig. 6.13). The epoch data of all remaining stars will be published in DR4. The other RVS-pipeline products published in DR3 are at source level (i.e., obtained combining data from all epochs). They are listed in Table 6.1 of the on-line documentation and are available via the Gaia archive gaia_source table. These products include, for example, information about the magnitude of the star (called grvs_mag in the Gaia archive) and the atmospheric parameters of the synthetic reference template used to derive the star epoch RVs (called rv_template_teff, rv_template_logg and rv_template_feh, and rv_atm_param_origin). Not all the 1 100 RR Lyrae stars and 798 Cepheids with epoch RVs published in DR3 also have source-level RVS pipeline products published. Source-level information is lacking for 51 Cepheids and 45 RR Lyrae stars, for which the all-epoch-combined RV was deemed of insufficient quality (see Katz et al., 2022, for the filters applied to the all-epoch-combined RVs). In most cases, the reason was the detection of potential variability, such as double lines in more than 10% of the epoch spectra, variability in spectral-sample flux from epoch to epoch, or a large dispersion in epoch RV (radial_velocity_error40 km/s). In other cases, the spectra were deemed too noisy, or the effective temperature was found to exceed the limit for good-quality RV measurements (i.e., 7 000 K for 12 mag; and 14 500 K for 12 mag). However, we note that most of the above issues are normal features, for high amplitude variable sources like RR Lyrae stars and Cepheids, whose RV curves typically exhibit amplitudes of tens of km/s. In fact, we carefully inspected the RV curves of these 51 Cepheids and 45 RR-Lyrae stars and none of them was found to have a peculiar shape. On the contrary, the large majority of these sources have very regular and nice RV curves. Therefore, we kept them for publication and, in Appendix A.1, provide information about their magnitudes and the atmospheric parameters of the associated templates, along with the reason why they do not have source-level RVS pipeline products published.
4.2 Processing of the RV data through the SOS Cep&RRL pipeline and results
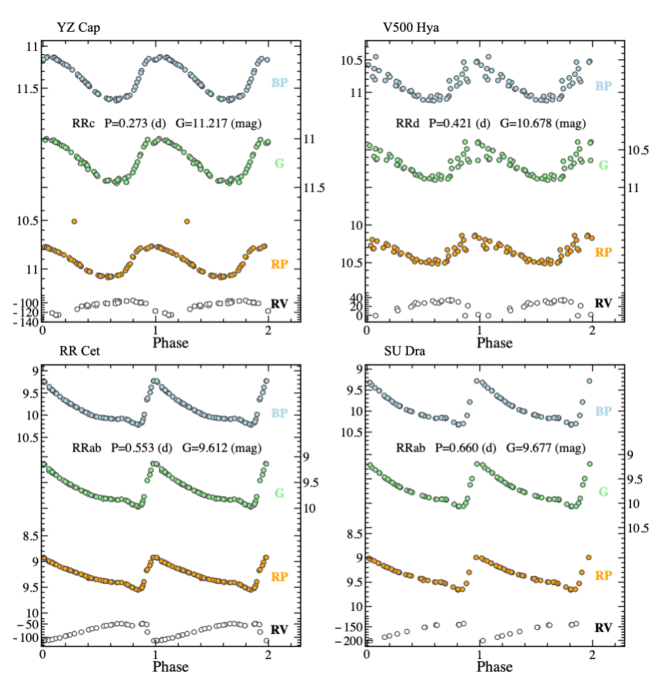
The time series RV data of the 1 100 RR Lyrae stars and 798 Cepheids were processed by the SOS Cep&RRL pipeline and for sources with more than 7 transits (1 097/1 100 of the RR Lyrae stars and 785/798 of the Cepheids) the RV curves obtained by folding the data with the periods inferred from the -band photometry were modelled with truncated Fourier functions. Mean RV (RV), peak-to-peak RV amplitude [Amp(RV)] and epoch of minimum RV were computed from the modelled RV curves, that are published in the DR3 vari_rrlyrae and vari_cepheid tables. Fig. 12 shows, from top to bottom, examples of , , light and RV curves for RR Lyrae stars that are released in DR3. The RV curves have the typical shape compared to the light curves with the minimum value in RV corresponding to maximum star brightness.
An atlas of the light and RV curves for the full sample of 1 100 RR Lyrae stars with time series RVs published in DR3 is presented in Appendix A.3. Examples of RV curves and an Atlas of the light and RV curves for the 798 Cepheids is presented in Ripepi et al. (2022).
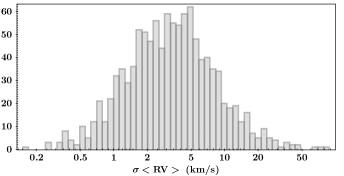
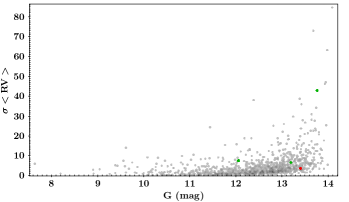
Figure 13 shows the error distribution of the mean RV values computed by the SOS pipeline () for the 1097/1100 RR Lyrae stars, whereas Fig. 14 shows as a function of the mean magnitude of these sources. The uncertainty ranges from 0.48 km/s to 84.88 km/s for ranging from 7.64 to 14.30 mag, with peak between 3 and 6 km/s, corresponding to the bulk of RR Lyrae stars with mean magnitude between 12 and 13 mag in Fig. 14 and consistently with fig. 6.13 in Sartoretti et al. (2022). Less than 20 sources have 25 km/s corresponding to sources in the faint magnitude tail of Fig. 14.
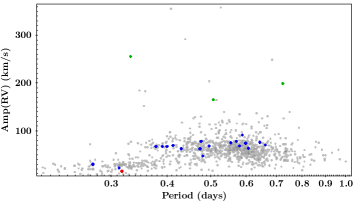
Finally, Figure 15 shows the vs Amp(RV) diagram of the 1097 RR Lyrae stars. A few sources have very large Amp(RV) values. Three of them are contaminants (green filled circles), the others have very few RV measurements, hence very uncertain Amp(RV) values.
A comparison was made between the SOS mean RV values of the 1 097 RR Lyrae stars and the combined RV values for these stars in the Gaia DR3 gaia_source table. The two RV values are available for 1 054 RR Lyrae stars. This comparison is shown in Fig. 16. There is good agreement, within the errors, between the two sets of RV measurements.
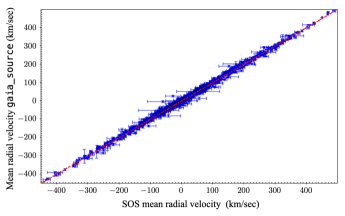
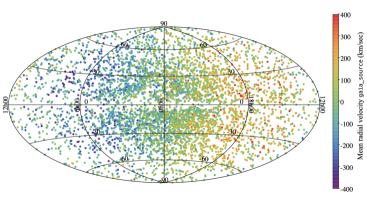
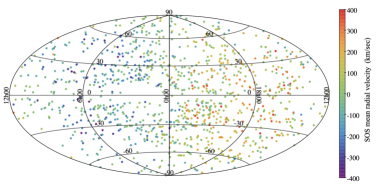
Median and mean difference between the two average values are of 5.21 and 6.88 km/s (with 6.35 km/s standard deviation), respectively. Finally, Fig. 17 shows the RV map defined by the 1 097/1 100 RR Lyrae stars in the DR3 vari_rrlyrae (righ panel) and, in the left panel, the map defined by the 5 096 RR Lyrae stars in the DR3 gaia_source table, for comparison. The sources have been colour-coded according their mean RV values. The two distributions are very well consistent, as expected from the good agreement between the two sets of RV values (see Fig. 16). RR Lyrae stars are distributed at all galactic latitudes and populate the maps with RVs ranging from large negative to large positive values.
4.3 Validation with the literature
A number of RR Lyrae stars and Cepheids for which epoch RVs are published in DR3 were analysed in the past with the Baade-Wesselink (B-W) technique (e.g. Cacciari et al. 1992, and references therein, for different versions of the B-W method applied to RR Lyrae stars and, Gieren et al. 1989, Ripepi et al. 1997, for B-W analyses of Cepheids). Hence, high accuracy RV measurements either obtained with the CORAVEL spectrophotometer (Baranne et al., 1979), or from high resolution spectra, are available in the literature for these stars. We have selected 19 RR Lyrae stars with 10 or more epoch RVS measurements in the RV curves and have made a detailed comparison with the high accuracy RVs covering the whole star pulsation cycle, available for these variable stars in the literature. We have mainly used for our comparison data taken from the most recent literature, as datasets collected in/before the early eighties often have very large uncertainties. A similar comparison for a sample of DCEPs is presented in Ripepi et al. (2022).
The 19 RR Lyrae stars used for this test are listed in Tables 15. In the table we indicate the literature data used for the comparison, the star mean astrophysical parameters (, log g, and iron abundance: [Fe/H]), that are, in general, the values adopted for or derived from the B-W analyses. The sample comprises 17 RRab and 2 RRc stars. They span a range in [Fe/H] of more than 2 dex. Three of them are known or suspected to be affected by Blako effect (Blažko, 1907), a periodic modulation of the amplitude and shape of the light (and RV) curve, occurring with periodicities from tens to hundreds of days; one (V32) is a member of a globular cluster (NGC 6121 – M4); whereas UU Vir is an RR Lyrae star suspected to be in a binary system, according to anomaly detected in the DR2 proper motions for the source (Kervella et al., 2019). The 19 RR Lyrae stars have 0.273 P 0.660 d, 9.56 12.90 mag and 10 or more (up to 37) individual RVS measurements, with errors in the range from 0.41 to 16 km/s depending on the magnitude and pulsation phase).
The RVS measurements of these 19 RR Lyrae stars are reasonably well distributed over the pulsation cycle and often there is more than one RV dataset available in the literature to make the comparison. The literature RVs and the Gaia RVS measurements of the stars in Table 15 span time intervals up to a few decades and the literature periods often do not allow to optimally phase all the available RV datasets. We have thus performed a new period search on each combined (literature plus ) RV dataset with the package Graphical Analyzer of Time Series (GRATIS; custom software developed at the Bologna Observatory by P. Montegriffo, see e.g. Clementini et al. 2000) and defined periods allowing to optimally match the Gaia and the literature RV curves for all sources used for this comparison555 This procedure worked quite well as, contrary to Cepheids, RR Lyrae stars generally show slow, if any, period changes. This is consistent with their evolution being much slower than for Cepheids. Furthermore, as far as we know none of the 19 RR Lyrae stars considered for our comparison is known to present significant period changes. Indeed, for some of these RR Lyrae stars, the period is known to be fairly constant.. No photometry was involved in the procedure, however, we note that the differences between the periods derived for the 19 RR Lyrae stars from the combined RV datasets () and the periods derived by the SOS pipeline () from the DR3 time series photometry are in the range of d d for 18 of the 19 stars in our sample. Only for V440 Sgr, (source_id= 6771307454464848768) is 0.048 d shorter than the period derived from the combined RV dataset, and it is clearly wrong, as this star has only sparsely sampled light and RV curves. The correct period for V440 Sgr is provided in Table 15.
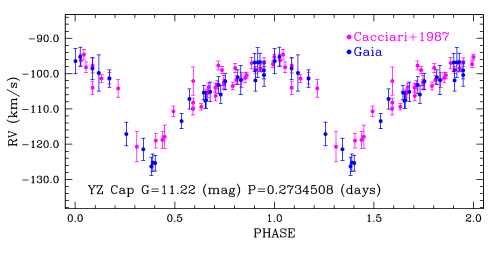
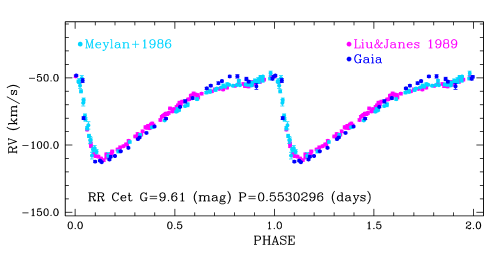
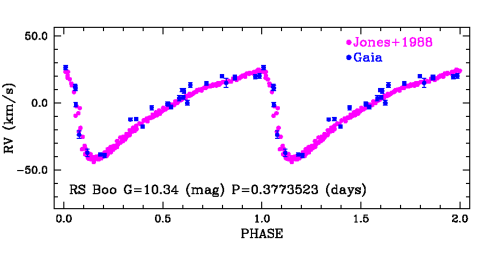
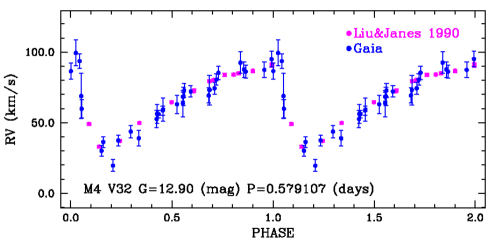
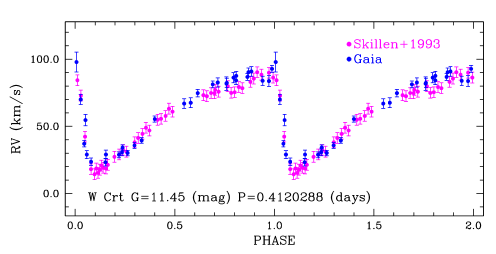
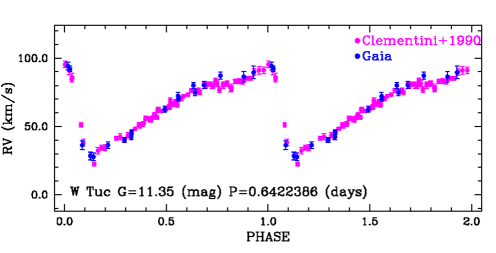
As an example, Fig. 18 shows the radial velocity curves of the RRc star YZ Cap and the RRab stars RS Boo, W Crt, RR Cet, V32 in M4 and W Tuc, using different colours for the literature and the RVS data. The RV curves of the remaining 13 RR Lyrae stars are presented in Figure 37. This comparison shows that there is a good agreement both in the shape and the amplitude of the Gaia RVS and the literature RV curves for 14 of the 19 RR Lyrae stars in the sample, thus assessing the good quality of the RVS epoch RV data for these sources. Specifically, the agreement is good for: YZ Cap, RS Boo, W Tuc, V Ind, DX Del, UU Cet V440 Sgr, and also for V32 in M4, TV Boo, AV Peg, TW Her and UU Vir, upon rigidly shifting their RVS curves by +5 km/s for the first two, 3 km/s for the third one and by 4 km/s for the latter two, as to better match the literature curves. Agreement is also acceptable for RV Phe and SS For, in spite of the large scatter caused by the Blazhko affecting these two stars. Conversely, there are noticeable differences between the literature and Gaia RV curves for RR Cet, RX Eri, SU Dra, SW Dra and, to a lesser extent, also for W Crt. These differences are most apparent around the bump just before the RV maxima, around phases 0.7-0.9, where the Gaia RVS curves reach higher velocities than the literature curves. Investigating the reason causing these differences is beyond the purposes of this paper, however, we note that shock waves are known to propagate in the atmosphere of RR Lyrae stars in correspondence with the hump (phase 0.9) and bump (phase 0.7) in the light and RV curves (Gillet & Crowe, 1988; Clementini et al., 1994; Gillet & Fokin, 2014, and references therein) that cause flux redistribution, H line emission and U-excess. The RVS measurements seem to better reflect than the literature RVs the flux redistribution caused by shocks propagating in the atmospheres of these 5 RR Lyrae stars.
5 Astrophysical parameters
The StellarParametersDerivation module of the SOS Cep&RRL pipeline (see Fig. 2) computes two main astrophysical parameters for the confirmed RR Lyrae stars: 1. a photometric estimate of individual metal abundance ([Fe/H]) for RRab and RRc stars whose light curves have been Fourier-modelled with at least 3 harmonics and, 2. a band absorption [] for RRab stars for which the () colour is available. The StellarParametersDerivation module is fully described in Sect. 2.1 of Paper II. Here, we only note that unlike in DR2, uncertainties in metallicity and values (as well as for any other parameter derived by the SOS pipeline) in DR3 were calculated with the bootstrap.
In the following we present the [Fe/H] abundances (Sect. 5.1) and values (Sect. 5.2) computed from the pulsation characteristics of the confirmed RR Lyrae stars, and compare them with values in the literature and with the astrophysical parameters derived by the Gaia pipeline that processes the RVS spectra and the , low-resolution prism spectra (Apsis, Creevey et al. 2022; Sects. 5.1.1 and 5.2.1).
5.1 Metallicity
In the Gaia DR3 vari_rrlyrae table, individual photometric metallicities ([Fe/H]) are published for 133 557 RR Lyrae stars. They are computed by the StellarParametersDerivation module from the pulsation period and the parameter of the light curve Fourier decomposition, using the relations for RRab and RRc stars derived in Nemec et al. (2013). These relations are calibrated on [Fe/H] values obtained from abundance analysis of high-resolution spectra (R36 000 and 65 000) of 41 field RR Lyrae stars.
Figure 19 shows the error distribution of the photometric metallicities for the 133 557 RR Lyrae in the sample.
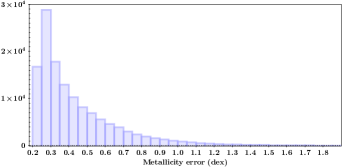
Mean and median metallicity errors are 0.46 dex (with 0.33 dex std) and 0.36 dex, respectively. Errors were computed by adding in quadrature the uncertainty estimated with the bootstrap, the scatter around the calibration relations: 0.084 dex and 0.13 dex for RRab and RRc stars, respectively (Nemec et al., 2013), and adopting a rather generous systematic error of 0.2 dex, that likely led to an overestimation of the metallicity uncertainties.
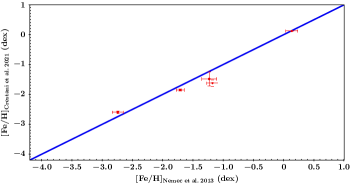
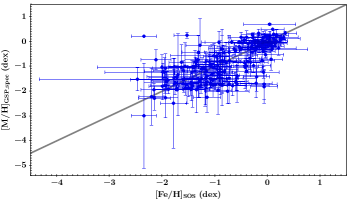
To validate the photometric metallicities, firstly we checked how well they reproduce the metal abundance of the Nemec et al. (2013)’s calibrators. This is shown in Fig. 20, where the [Fe/H] metallicities derived by the SOS Cep&RRL pipeline are compared with the metal abundances from high resolution spectra of 39 RR Lyrae among the Nemec et al. (2013) calibrators for which both estimates are available. The agreement is good within the errors, confirming that the SOS photometric metallicities of RR Lyrae stars are closely tied to the metallicity scale from abundance analysis of Nemec et al. (2013). We note, however, that the photometric metallicity of RR Lyr, the prototype and brightest star of the class, is significantly discrepant and poorly determined, as shown by the very large error bars, likely due to a poor determination of the parameter for the star.
As already noted in Paper I, the photometric metallicities inferred from the [Fe/H], and relation better represent the mean metal abundance of a population of RR Lyrae stars than the metallicy of the individual sources. Furthermore, new calibrations of this relation have appeared in the recent literature (e.g. Iorio & Belokurov 2021, Mullen et al. 2021)666We remind the reader that the pipelines processing the Gaia data are frozen well in advance of releases. Specifically, the SOS Cep&RRL pipeline adopted to process the DR3 data was frozen in early 2020. Claims have been made by Iorio & Belokurov (2021) that metallicities based on the Nemec et al. (2013) calibrations are biased toward high metallicities. Conversely, Mullen et al. (2021) found an excellent agreement for higher metallicities in the Nemec et al. (2013) calibration range ( dex) while estimates diverge for lower metallicities.
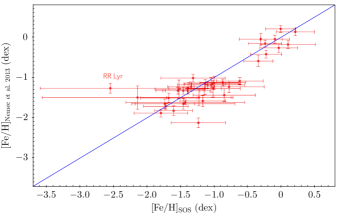
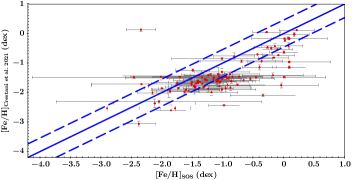
In order to test the reliability of the RR Lyrae metallicities computed by the SOS pipeline we have compared them with the metal abundances from high resolution spectroscopy available in the literature for different samples of RR Lyrae stars. Since Mullen et al. (2021) relations are calibrated on the RR Lyrae metallicities from high-resolution spectra (R35 000) of Crestani et al. (2021), in the following we discuss the comparison with Crestani et al. (2021). Comparison with other abundance analyses of RR Lyrae stars in the literature is presented in Sect. B.1.
First we have compared the metal abundances from high resolution spectra for RR Lyrae stars in common between Nemec et al. (2013) and Crestani et al. (2021). This comparison is shown in the left panel of Fig. 21 and seems to confirm that Nemec et al. (2013)’s metallicities may be 0.1-0.2 dex higher than Crestani et al. (2021)’s for [Fe/H] dex. The right panel of Fig. 21 shows instead the comparison between the photometric metallicities derived by the SOS Cep&RRL pipeline and the metal abundances from high resolution spectra from Crestani et al. (2021) for 105 RR Lyrae stars in common between the two studies and, as expected, confirms the metallicity offset seen in the left panel of the figure, nevertheless the two sets of estimates are still generally consistent, within the admittedly large errors of the SOS metallicities.
In Table 1 we compare metallicities available in the literature for a sample of globular clusters (GCs) and dwarf spheroidal galaxies (dSphs), with the metal abundances obtained by averaging individual photometric estimates from the SOS pipeline for RR Lyrae stars in these systems. The agreement is satisfactory and, except for M62, it is always within the standard deviations of the mean values estimated from the RR Lyrae stars.
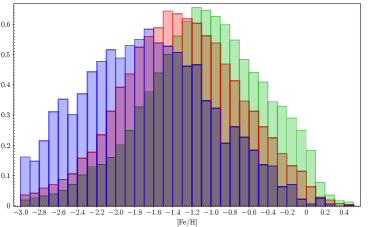
Finally, the metallicity distributions of RR Lyrae stars in the All-Sky, LMC, and SMC regions, are shown with different colours in Figure 22. A photometric metallicity estimate is available for 114 653 RR Lyrae in the All-Sky region, for 16 295 in the LMC region and, for 2 634 in the SMC region. The metallicity distributions peak at mean values of [Fe/H]= 0.63, 0.62, and 0.66 dex for the All-Sky, LMC, and SMC variables, respectively. The mean value estimated for the LMC variables confirms to be about 0.2 dex higher than found by Gratton et al. (2004) from low resolution (R 800) spectra of 98 RR Lyrae stars in the bar of the LMC: [Fe/H] dex (on the Harris 1996 metallicity scale) and, by Borissova et al. (2006), [Fe/H] dex, from 78 RR Lyrae stars, covering a wide range of distances, out to 2.5 degrees from the LMC centre.
5.1.1 Comparison with GSP_Spec metallicities
The astrophysical_parameters table in the Gaia DR3 archive contains metallicities derived by specific modules of the Apsis pipeline (Creevey et al., 2022), that analyse the Gaia RVS spectra and the low-resolution , prism spectra. In particular, of interest for our comparison are the metal abundances produced by GSP_Spec, the module that processes the RVS spectra (Recio-Blanco et al., 2022).
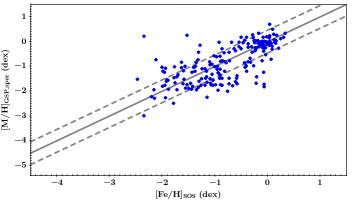
[M/H] metal abundances computed by the GSP_Spec module (mh_gspspec) are available for 288 RR Lyrae stars among the sample with photometric metallicity computed by the SOS pipeline. Following recommendations in Recio-Blanco et al. (2022), we applied the GSP_spec quality flag (flags_gspspec), to filter out sources with lower quality GSP_Spec abundances. This reduced the sample to 193 RR Lyrae stars. The left panel of Fig. 23 shows the comparison between the [M/H] abundances from GSP_Spec and the [Fe/H] metallicities computed by the SOS pipeline for these 193 RR Lyrae stars. The agreement between the two sets of metallicities is satisfactory over the whole range from [Fe/H] to +0.3 dex, with about 70% of the sources laying within 0.46 dex (the mean metallicity error in Fig. 19) from the one-to-one line and 93% laying within 0.5 dex. This gives us confidence in the reliability of the photometric metallicities obtained with the SOS Cep&RRL pipeline.
[M/H] metal abundances computed by GSP_Phot (mh_gsphot), the Apsis module that processes the low resolution prism spectra (Andrae et al., 2022) are also available for several thousands RR Lyrae stars confirmed by the SOS pipeline. However, the GSP_phot metallicities of RR Lyrae stars appear to be affected by very large uncertainties and systematic effects. In particular, for the 193 RR Lyrae stars discussed previously, the GSP_Phot metallicities are systematically offset from both the GSP_Spec and the SOS estimates by more than 1 dex towards larger abundances. The reason for this likely residing in the unusually large flux errors in the time-averaged spectra of RR Lyrae stars compared to non-variable sources of same spectral type (see Fig. 41 in Appendix B), as well as in issues of the instrument model of the spectra due to a lack of calibrators with emission lines below 400 nm (see Gaia Collaboration et al., 2022a, for details). We come back to this issue later when discussing the GSP_Phot absorption in Sect. 5.2.1.
5.2 -band absorption
An estimate of individual interstellar absorption in the -band [] was obtained by the StellarParametersDerivation module for
142 867 fundamental-mode RR Lyrae stars from an empirical relation among the amplitude of the light curve [Amp], the pulsation period () and the colour of these RRab stars (see Sect. 2.1.2 in Paper II, for details).
Typical uncertainties in
are of about 0.4 mag, corresponding to the mean of the absorption uncertainty (g_absorption_error) values in the vari_rrlyrae table for the 142 867 RR Lyrae stars.
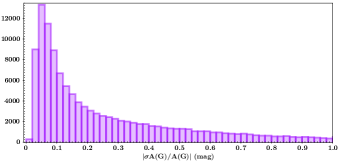
Figure 24 shows the error distribution, in , of the values.
For 30% of the 142 867 RRab stars is
less than 10%, for
47% of the sample
is less that 20% and, for
68% of the sample is less than 50%.
Finally, for 19% of the sample is larger than 100%.
In the right part of Table 1 we compare the values obtained transforming the values in the literature for a sample of GCs and dSphs, using the ratio between extinction coefficients in different bands by Bono et al. (2019), (see Notes in Table 1) with the values obtained by averaging the individual -absorption estimates computed by the SOS pipeline for RR Lyrae stars in these systems.
Mean A(G) measurements and relative standard deviations listed in Table 1 were computed over the entire sample of RR Lyrae stars contained in each system. However, the innermost RR Lyrae stars in the GCs are affected by significant crowding effects that impact the magnitudes in particular, and may thus lead to unreliable (large) values.
Indeed, if RR Lyrae stars within the half-light radius of each cluster are excluded, the derived mean values are more compatible with the literature values and their standard deviations are reduced by up to 50%.
We also recommend to use with caution the values obtained by the SOS pipeline for RR Lyrae stars fainter than 18.519 mag. These sources may have very uncertain magnitudes, hence, as well leading to unreliable values. This is the case for some of the dSphs listed in Table 1. Among them, Ursa Major II, the only dSph among those listed in Table 1 containing bright RR Lyrae stars ( 18 mag), has in fact a mean value with small std and in perfect agreement with the literature estimation.
Finally, an absorption map drawn from the 142 867 RRab stars is presented in Sect. 7.
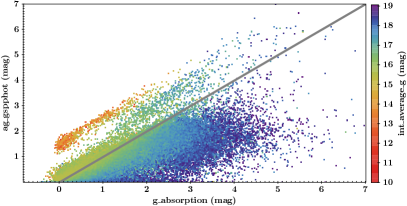
5.2.1 Comparison with GSP_phot absorption values
The astrophysical_parameters table in the Gaia DR3 archive contains values (ag_gspphot) derived by the GSP_Phot module of the Apsis pipeline (Creevey et al., 2022). GSP_Phot values are available for 84 501 of the RRab stars with an estimate from the SOS pipeline. In Figure 25 we show the comparison between the two independent estimates. The values are colour-coded according to the intensity-averaged magnitudes of the RR Lyrae stars. Two sequences can be clearly seen above the one-to-one line. These bright sequences are composed by a mixture of RR Lyrae stars for which absorption values were either computed by the ESP_HS module of Apsis, the routine designed to derive astrophysical parameters of bright (17.65 mag) O-, B-, and A-type stars, or by the GSP_Phot module (see panel (a) of Fig. 42 in Appendix B). Misidentification as OB stars of the RR Lyrae in the brightest sequence in Fig. 25 is the culprit of the overestimated (ESP_HS) absorption values for these sources. On the other hand, as discussed more in detail in Appendix B, the peak-to-peak variability of about one magnitude in (Amp parameter in the vari_rrlyrae table) of the RRab stars is “absorbed” as increased flux uncertainties in the time-averaged spectra used to estimate the GSP_Phot absorption. Given the unusually large flux uncertainties, the is “flattened” thus opening the room for degeneracies. In particular, this appears to be most likely an extreme case of temperature-extinction degeneracy due to GSP_Phot adopting wrong mean temperatures for these RR Lyrae stars.
To conclude, as already pointed out for the GSP_Phot metallicities (Sect. 5.1.1), the comparison of the values shows the difficulty to correctly infer astrophysical parameters for high amplitude variables, such as the RR Lyrae stars, based on time-averaged spectra, and recommends use for RR Lyrae stars (or for any other type of high amplitude pulsating variable stars) of the epoch spectra individually (if their S/N allows for it) along with epoch and values, and then average the results, to get more reliable GSP_Phot metallicities and absorption values. On the other hand, as further discussed in Appendix B, the SOS Cep&RRL and GSP_Phot absorption values agree within 0.2 mag for RR Lyrae stars for which the GSP_Phot module uses values in the proper range for fundamental mode RR Lyrae stars (e.g. 6 300 6 800 K; see column 11 in Table 15 and the top panel of Fig. 43). This is likely the case for about 14 000 RR Lyrae stars among the 84 501 sources for which both absorption estimates are available. We also find that for these same RR Lyrae strars the SOS Cep&RRL [Fe/H] values and the GSP_Phot metallicities agree within 0.5 dex.
| Name | [Fe/H]C09 | RRLs | [Fe/H]Gaia | St. dev.[Fe/H]Gaia | RRLs | St. dev.[] | A | Ref. | |
| dex | N1 | dex | dex | N2 | mag | mag | mag | ||
| NGC 1261 | 1.27 | 14 | 1.13 | 0.49 | 12 | 1.32 | 1.47 | 0.02 | (1) |
| NGC 1851 | 1.18 | 21 | 1.11 | 0.48 | 18 | 1.27 | 1.06 | 0.05 | (2) |
| NGC 288 | 1.32 | 1 | 1.24 | 0.33 | 1 | 0.07 | 0.08 | 0.08 | (3) |
| NGC 3201 | 1.59 | 73 | 1.27 | 0.36 | 77 | 0.73 | 0.30 | 0.62 | (4) |
| NGC 5024 | 2.10 | 25 | 1.66 | 0.57 | 25 | 0.49 | 0.69 | 0.05 | (5) |
| NGC 5139-OCen | 1.53 | 36 | 1.42 | 0.63 | 39 | 0.43 | 0.36 | 0.31 | (6) |
| NGC 5272-M3 | 1.50 | 125 | 1.38 | 0.39 | 105 | 0.89 | 1.52 | 0.01 | (7) |
| NGC 6266-M62 | 1.18 | 105 | 0.73 | 0.36 | 88 | 2.77 | 1.81 | 1.23 | (8) |
| IC 4499 | 1.53 | 64 | 1.45 | 0.48 | 58 | 0.66 | 0.23 | 0.60 | (9) |
| NGC 7078-M15 | 2.37 | 44 | 1.95 | 0.54 | 30 | 0.89 | 0.83 | 0.26 | (10) |
| Sculptor | 1.68 | 289 | 1.64 | 0.50 | 275 | 0.53 | 0.63 | 0.05 | (11) |
| Draco | 1.93 | 258 | 1.79 | 0.67 | 216 | 0.54 | 0.43 | 0.08 | (12) |
| Ursa Major I | 2.18 | 5 | 2.38 | 0.43 | 5 | 1.94 | 2.00 | 0.02 | (13) |
| Ursa Major II | 2.47 | 1 | 2.24 | 0.45 | 3 | 0.26 | 0.04 | 0.25 | (14) |
. N1 and N2 are the number of RR Lyrae stars on which the mean [Fe/H]Gaia and values were computed, with the corresponding standard deviation of the mean in Columns 5 and 8, respectively. \tablebib(1) Salinas et al. (2016); (2) Walker (1998); (3) Kaluzny et al. (1997), Arellano Ferro et al. (2013); (4) Layden & Sarajedini (2003), Arellano Ferro et al. (2014); (5) Cuffey (1966), Goranskij (1976), Arellano Ferro et al. (2011); (6) Braga et al. (2018); (7) Benkő et al. (2006); (8) Contreras et al. (2010); (9) Walker & Nemec (1996); (10) Corwin et al. (2008); (11) Martínez-Vázquez et al. (2016);(12) Muraveva et al. (2020); (13) Garofalo et al. (2013); (14) Vivas et al. (2020).
6 Final cleaning and validation of the DR3 RR Lyrae catalogue
During the final validation of the catalogue of 271 779 RR Lyrae stars confirmed and characterized by the SOS pipeline a number of issues, misclassifications and uncertain classifications were detected. In this section we discuss them and provide tables with the identifiers of the affected sources. A final statistics of the SOS confirmed DR3 RR Lyrae stars, cleaned for the issues described in this section, is presented in Sect. 7.
6.1 Mode identification for short period RR Lyrae stars
Short period RRab stars with d overlap with RRc stars in the diagram. In DR3 we have adopted new boundaries of the RRab and RRc regions in the diagram to separate the fundamental mode from the first overtone RR Lyrae stars (see Sect. 2 and Fig. 3). However, some RRab stars were not captured by the new boundaries and were wrongly classified as RRc stars. This is the case of the RRab stars: 4297554691689496192 (=0.366 d) and 1826975050760883072 (=0.357 d). We warn the reader that there may be a few more cases like these in the DR3 vari_rrlyrae table.
6.2 Double-mode RR Lyrae stars with
There are 2007 double-mode RR Lyrae stars with parameters published in the DR3 vari_rrlyrae table. For 121 of them the two periodicities, and , listed in the table differ by less than 0.01 d. This was likely caused by a re-mapping problem of and , the two periodicities detected in the time series photometry of these sources, into (fundamental pulsation period) and (first overtone pulsation period). In fact, for all these 121 sources the and values differ and are in the proper ratio for double-mode RR Lyrae stars. We provide in Table 2 the correct and values computed by the SOS pipeline for these 121 double-mode RR Lyrae stars.
| Gaia sourceid | ||
|---|---|---|
| 408895729987233536 | 0.373330688241618 | 0.512642740772834 |
| 501173342860631808 | 0.356601096360751 | 0.479398897708066 |
| 510602690164934528 | 0.450007942826883 | 0.333771875260333 |
| 711991473282863616 | 0.405938896214094 | 0.544093988121247 |
| 799159586901582464 | 0.41546585867929 | 0.556716992103652 |
| 1009169258447656576 | 0.373435128605576 | 0.501424952889536 |
| 1019488037636107136 | 0.377019820562923 | 0.505549683973198 |
| 1300079698489198464 | 0.401148054398303 | 0.537722672814259 |
| 1323028808262955264 | 0.478288427372862 | 0.35013538941965 |
| … | … | … |
6.3 RR Lyrae stars with large or null errors for main parameters
The peak_to_peak_bp, peak_to_peak_rp, int_average_bp and int_average_rp parameters of a number of RR Lyrae stars in the DR3 vari_rrlyrae table have very large errors (see e.g. for source: 4660156103061766400), or errors set to zero (see e.g. sources: 4660223379454198144, 4685971467924582144 and 5027218748491264768). This happens for bona fide RR Lyrae stars with mean magnitude (int_average_g) fainter than 18.5-19 mag and sparse measurements with large errors in the and light curves. The affected sources are mainly in the Magellanic Clouds, in the Galactic bulge and in a number of MW dSphs and UFDs.
Additionally, the (r21_g) and (r31_g) Fourier parameters of the light curves for 4 400 DR3 RR Lyrae stars exceed the expected range of [0,1]. However, these limits are fully respected if the rather large errors associated with the , parameters of these sources are taken into account.
6.4 RR Lyrae stars with negative or very large values
The absorption (; g_absorption parameter) is negative (with values ranging from 0 to 1.279 mag) for 9 503 DR3 RR Lyrae stars, corresponding to 6.3% of the 142 867 RR Lyrae stars with an value in the vari_rrlyrae table (see Sect. 5.2), and it is larger than 10 magnitudes (up to 3 367.32 mag for source 5847675733921242624) for 286 sources (i.e., 0.2% of the RR Lyrae stars with an estimate).
As discussed in Sect. 5.2, 19% of the RR Lyrae stars with an estimate have . This is the case of all the 9 503 sources with a negative . Among them, 8 033 have mag; 9 297 have mag, and 9 487 have mag. The remaining sources (0.2%) with mag are sources fainter than 19 mag, hence, have uncertain colours, that affected the estimations.
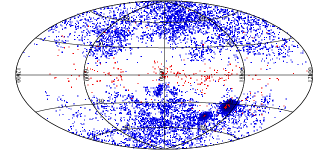
Regarding the 286 RRLyrae stars with large positive values, discarding the extreme case of 5847675733921242624, which clearly has a wrong value, for 77% of them and for 91%. The sky distribution of the RR Lyrae stars with low/negative or very large values is shown in Fig.26, using blue symbols for the former and red symbols for the latter. As expected, the RR Lyrae stars with very large values are mainly confined in the Galactic disc and the regions with highest reddening in the Magellanic Clouds, while RR Lyrae stars with a low/negative value are mainly located at high latitudes in the MW halo.
6.5 RR Lyrae stars with a different classification in the OGLE catalogue
In the Gaia DR3 vari_rrlyrae table there are 31 sources that the Classifiers of the General Supervised Classification module (Rimoldini et al., 2022a) classified only as RR Lyrae candidates, hence, they were processed only through the RR Lyrae branch of the SOS Cep&RRL pipeline, which confirmed their classification as RR Lyrae stars. However, these sources are classified as Cepheids (5 as DCEPs and 26 as ACEPs) in the OGLE-IV catalogue of variable stars. Using their Gaia EDR3 parallaxes these sources were plotted on the period-luminosity () and period-Wesenheit () relations of DR3 Cepheids (see Table 2 in Ripepi et al., 2022) and for two of them the classification as RRab stars was confirmed, while 22 were reclassified as Cepheids (5 DCEPs and 17 ACEPs) and 7 have an uncertain classification between ACEPs or RRab stars. The sourceids of these 31 sources are provided in Table 3 along with their final classifications. One of the sources re-classified as DCEP (source 5861856101075703552) is included in the list of 1100 RR Lyrae stars with RVS time series RVs published in DR3. Owing to this re-classification, the number of RR Lyrae stars with epoch RVs drops to 1099 and the Cepheid number increases to 799 (but see also Sect. 6.9).
| Gaia sourceid | Revised type | Type | |
|---|---|---|---|
| (mag) | (this paper) | (OGLE-IV) | |
| 4121189659364789632 | 18.407 0.040 | RRab | ACEP 1O |
| 6724031478150071680 | 14.782 0.007 | RRab | ACEP 1O |
| 3325594070648057344 | 13.304 0.007 | DCEP_1O | CEP 1O/2O |
| 5259472605426820864 | 17.174 0.002 | DCEP_1O | CEP 1O/2O |
| 5337626858335118080 | 17.471 0.002 | DCEP_1O | CEP 1O |
| 5861856101075703552(∗) | 13.398 0.010 | DCEP_MULTI | CEP F/1O |
| 6025724977547669120 | 15.533 0.010 | DCEP_1O | CEP F/1O |
| 4086063080350131968 | 13.863 0.025 | ACEP_F | ACEP F |
| 4088429190686315136 | 16.836 0.021 | ACEP_F | ACEP F |
| 4099638849167163648 | 13.514 0.024 | ACEP_1O | ACEP 1O |
| 4123275364279164672 | 14.546 0.004 | ACEP_1O | ACEP 1O |
| 5253954057825909504 | 17.249 0.005 | ACEP_F | ACEP F |
| 5333097209687948032 | 19.000 0.007 | ACEP_F | ACEP 1O |
| 5343906650256155392 | 15.834 0.002 | ACEP_1O | ACEP 1O |
| 5355902184686008832 | 14.863 0.003 | ACEP_1O | ACEP 1O |
| 5625331663591871104 | 17.862 0.002 | ACEP_1O | ACEP 1O |
| 5949793765379361152 | 17.784 0.006 | ACEP_1O | ACEP 1O |
| 5956690971798673664 | 15.261 0.020 | ACEP_F | ACEP F |
| 5970892843763951104 | 17.397 0.003 | ACEP_F | ACEP F |
| 5978313726930066048 | 16.533 0.004 | ACEP_1O | ACEP 1O |
| 5979051907235436160 | 17.042 0.004 | ACEP_F | ACEP F |
| 6026530163731660928 | 15.445 0.009 | ACEP_F | ACEP F |
| 6029981290235791232 | 15.607 0.002 | ACEP_1O | ACEP 1O |
| 6724250895118108928 | 15.294 0.003 | ACEP_1O | ACEP 1O |
| 4048728299707790976 | 15.562 0.014 | ACEP_1O/RRab? | ACEP 1O |
| 4101192497784043520 | 14.931 0.010 | ACEP_1O/RRab? | ACEP 1O |
| 4107356012051364480 | 15.654 0.020 | ACEP_1O/RRab? | ACEP 1O |
| 5956833835251660800 | 15.975 0.014 | RRab/ACEP_F? | ACEP F |
| 5968150764841574912 | 18.733 0.005 | ACEP_1O/RRab? | ACEP 1O |
| 5980267829660152960 | 17.404 0.005 | ACEP_1O?/RRab? | ACEP 1O |
| 6061867986376466688 | 16.290 0.005 | ACEP_F/RRab? | ACEP F |
6.6 RR Lyrae stars missing in the vari_rrlyrae table
The catalogue of 271 779 RR Lyrae stars does not contain 14 bona fide RR Lyrae stars confirmed by the SOS Cep&RRL pipeline that, by mistake, were removed from the SOS final catalogue, but are listed in the vari_classifier_result table. Table 4 gives the sourceids of these 14 RR Lyrae stars and in Table 16 we provide parameters (, peak-to-peak , , amplitudes, mean magnitudes, etc.) computed by the SOS pipeline for these sources.
| Gaia DR3 sourceid |
|---|
| 4092009204924599040 |
| 4120414435009794048 |
| 4144246349481643392 |
| 5797652730842515968 |
| 5797917193442176640 |
| 5846086424210395520 |
| 5917239841741208576 |
| 5991733644318583424 |
| 6017924835910361344 |
| 6069336998880602240 |
| 6707009423228603904 |
| 5935214760885709440 |
| 4362766825101261952 |
| 5967334102579505664 |
6.7 Overlaps with pipelines processing galaxies and QSO
| Gaia DR3 sourceid | Tentative class(∗) |
|---|---|
| 252947980027906048 | RR Lyrae? |
| 367375357718907776 | galaxy/QSO |
| 392996452549916416 | … |
| 406587893736299136 | … |
| 419307353484601472 | … |
| 3206068021312873728 | … |
| 1056196096618040960 | … |
| 5571533079335954816 | … |
| 4685908211622296576 | … |
| 4928220400858440704 | … |
| … | … |
| Gaia DR3 sourceid | Class(∗) |
|---|---|
| 5710645592594769280 | ECL |
| 5246357493290558336 | ECL |
| 4661507982702013312 | … |
| 5116113679481496832 | … |
| 2456881998103809280 | … |
| 1305269977485608192 | … |
| 6242394047412731520 | … |
| … | … |
A total of 1 139 sources in the vari_rrlyrae table are classified as galaxies by other DPAC pipelines. After visual inspection of their light curves, 618 of them were confirmed as RR Lyrae stars, of which over 400 are known RR Lyrae stars in the OGLE-IV catalogue or in the catalogue of variable stars in GCs. The remaining 521 sources are listed in Table 5. The majority of them are rather faint sources (20 mag), and either clearly not RR Lyrae stars, or have an uncertain classification.
About 57 000 RR Lyrae stars in the vari_rrlyrae table are classified as QSO by other DPAC pipelines. Among them 55 448 are known RR Lyrae stars (30 000 from the OGLE-IV catalogue and 25 400 from other major catalogues of RR Lyrae stars in the literature). We visually inspected the light curves of the remaining 1 635 sources and for 1 353 of them confirmed the classification as RR Lyrae stars (80 of them are classified as RR Lyrae stars also in the SIMBAD database, Wenger et al. 2000). A remaining 282 sources, listed in Table 6, either are clearly not RR Lyrae stars or have an uncertain classification.
6.8 Non-single star sources identified by SEAPipe
| Gaia DR3 sourceid |
| 4061010604884154624 |
| 4097861458597689856 |
| 4043627562186192768 |
| 1827951859436521728 |
| 6045465845526924544 |
| … |
The DPAC-Source Environment Analysis Pipeline (SEAPipe; Harrison (2011), Harrison et al., in preparation) was run on the catalogue of 271 779 RR Lyrae stars confirmed by the SOS Cep&RRL pipeline to check whether additional sources are present in the vicinity (within a radius of 2), which might contaminate the light of the RR Lyrae stars. SEAPipe returned a list of 80 RR Lyrae stars found to be non-single sources. These 80 sources reside mainly in the MW bulge and disk, 79 of them are RR Lyrae stars already known in the literature (67 are in the OGLE-IV catalogue and 12 in the ZTF and Gaia DR2 catalogues), only 1 is a new discovery. Visual inspection of the light curves allowed us to confirm that they are all ab-type RR Lyrae stars, with different levels of noise particularly in the and light curves, often also accompanied by a reduced amplitude of the -band light curve. These are clear signatures of contamination and blending by neighboring stars (see e.g., Fig 16 in Di Fabrizio et al., 2005) that can affect the estimated mean magnitude and peak-to-peak amplitudes of these RR Lyrae stars, but not the derived periods. We list these 80 RRab stars in Table 7 and warn the reader that caution should be taken when using amplitudes, mean magnitudes, Fourier parameters and derived quantities of these sources.
6.9 Contamination by binaries and other types of variable stars
RR Lyrae stars in the vari_rrlyrae with Gaia EDR3 parallaxes accurate to better than 5% were plotted on a relation along with DR3 Cepheids with same parallax accuracy (see Ripepi et al., 2022, for details). A group of 147 RR Lyrae stars appear to be from 0.5 to 8.5 mag fainter than expected in this plot. These sources are all known RR Lyrae stars classified by various different surveys: OGLE (44 sources), ASASSN (40), CATALINA (25), PS1(5) and ZTF, DR2, GCVS and the catalogue of variable stars in GCs (33 sources altogether). The light curves of these 147 sources were visually inspected and often found to exhibit large scatter, split branches and other issues, despite they are all rather bright sources. On the basis of the light curves eyeballing the sample contains: 75 bona fide RR Lyrae stars or most likely RR Lyrae stars (59 RRab and 16 RRc stars); 55 ECLs 111111The classification as ECL was based on the value of the ratio between peak-to-peak amplitudes of the and light curves (this ratio for eclipsing binaries typically is AmpAmp 0.2, while is 1.6 for RR Lyrae stars) and on the visual inspection of the light curves folded with once and twice the period determined by the pipeline. that contaminate the RR Lyrae sample or with classification uncertain between ECL and RR Lyrae star, or between ECL and non-RR Lyrae source; 8 sources with a very prominent bump before the minimum in the light curve; and 9 sources with such poor light curves that a classification in type is not possible. We provide in Table 8 the identifiers of the 72 sources in this sample that we re-classify as ECLs or possible ECLs (55 in total), and variable stars with poor light curves and uncertain classification in type (17 sources).
Finally, three of the sources re-classified as ECLs (sources: 4130380472726484608, 3062985235999231104 and 5734183009797858176) are included in the list of 1100 RR Lyrae stars with RVS time series RVs published in DR3. Owing to their re-classification and the re-classification as DCEP of the source discussed in Sect. 6.5, the number of bona fide RR Lyrae stars with epoch RVs finally drops to 1096.
6.10 Scan-angle-period correlations
A clear correlation was found to exist between the scan-angle of the Gaia observations and the detection of spurious periods for variable stars of different types. A detailed analysis of this correlation, and parameters defined to assess the reliability of the periods derived from the time series data analysis of variable sources, are presented in (Holl et al., 2022). The SOS sample of 271 779 RR Lyrae stars was checked and correlation-value plots were produced showing that, at most, perhaps a few percent of the sources in the sample is affected by possible scan-angle effects. Hence, a low, but perhaps not fully negligible percentage.
| Gaia DR3 sourceid | Class(∗) | Lit_Survey |
|---|---|---|
| 87159184382553088 | ECL | CATALINA |
| 568221222620689024 | ECL | ASAS-SN |
| 326383086038685952 | ECL | GCVS |
| 6812645960632807296 | ECL | ASAS |
| 5292689405748796160 | ECL | CATALINA |
| … | … | … |
7 Results and final accounting
The validation process described in Sect. 6 allowed us to clean the catalogue of 271 779 RR Lyrae stars that are published in the DR3 vari_rrlyrae table, by rejecting 888 sources that are contaminants (mainly ECLs), and objects with an uncertain classification (Sects. 6.5, 6.7, 6.9), thus leading to a clean sample of 270 891 confirmed RR Lyrae stars. To this number we add the 14 RR Lyrae stars (4 RRab and 10 RRc stars), discussed in Sect. 6.6, thus leading to a final sample of 270 905 DR3 bona fide RR Lyrae stars, of which 200 294 are RR Lyrae already known in the literature (Gold Sample) and 70 611 are new discoveries by Gaia. For ease of the reader we collect in just one table (Table 9) the sourceids of the 888 sources rejected during the final validation process described in Sect. 6. We also note that it turned out that the period of a fraction of the 888 sources we rejected during the final cleaning, may indeed be affected by the scan-angle effects mentioned in Sect 6.10.
| Gaia DR3 sourceid |
| 72425797289881344 |
| 87159184382553088 |
| 252947980027906048 |
| 271665825465872256 |
| 279252868010888960 |
| … |
Figure 27 shows the magnitude distribution of the clean sample of 270 905 DR3 RR Lyrae stars confirmed by the SOS pipeline. The magnitude distribution of the 70 611 new RR Lyrae stars is highlighted in black.
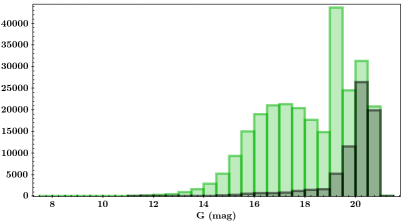
Table 10 summarises some statistic about the SOS DR3 RR Lyrae sample, namely, the subdivision between known (Gold Sample) and new discoveries by Gaia; the number of RRab, RRc and RRd types; the number in the LMC, SMC and All-Sky regions; how many RR Lyrae stars have a metallicity or absorption estimate and, finally, the number of RR Lyrae stars (and Cepheids) with RVS time series RVs published in DR3.
| Sample | N(14) | Nclean(14) | Nclean(14) |
|---|---|---|---|
| vari_rrlyrae | |||
| Gold Sample | 200 589 | 200 293 | 200 294 |
| New discoveries(a) | 71 190 | 70 598 | 70 611 |
| Total number of RR Lyrae stars | 271 779 | 270 891 | 270 905 |
| LMC region(b) | 31 535 | 31 379 | 31 379 |
| SMC region(b) | 4 828 | 4 788 | 4 788 |
| All-Sky region(b) | 235 416 | 234 724 | 234 738 |
| Fundamental mode (RRab)(c) | 175 350 | 174 943 | 174 947 |
| First overtone (RRc)(c) | 94 422 | 93 942 | 93 952 |
| Double mode (RRd) | 2 007 | 2 006 | 2 006 |
| [Fe/H] values (RRab and RRc) | 133 577 | 133 558 | 133 559 |
| values (RRab only) | 142 867 | 142 656 | 142 660 |
| RV time series (RR Lyrae)(d) | 1 100 | 1 096 | 1 096 |
| RV time series (Cepheids)(d) | 798 | 799 | 799 |
| RV time series (other type) | … | 3 | 3 |
| Total number of sources with RV time series data | 1 898 | 1 898 | 1 898 |
(b)Regions for the LMC, SMC and All-Sky are as defined in Sect. 2.
(c)Numbers of RRab and RRc stars in column Nclean(14) are corrected for the re-classifications in Sect. 6.1.
(d)Numbers of RR Lyrae and Cepheids with RV time series data published in DR3 are corrected in column Nclean(14) for the re-classifications in Sects. 6.5 and 6.9.
We note that 1 676 RR Lyrae stars of the 270 905 clean sample are distributed among 95 GCs, and 1 114 are spread among 7 dSph galaxies (of which 505 in Sculptor) and 16 UFD satellites of the MW.
The following parameters, computed by the SOS Cep&RRL pipeline are released for the clean sample of 270 891 RR Lyrae stars (as well as for the 888 sources filtered out in Sect. 6) in the Gaia DR3 vari_rrlyrae table, along with the related uncertainties:
-
•
source pulsation period(s) (main and secondary periodicity, if any);
-
•
intensity-averaged mean , , magnitudes;
-
•
mean RV (for 1 096 RR Lyrae stars, one RR Lyrae star re-classified as DCEP_1O, and 3 sources re-classified as ECLs);
-
•
epochs of maximum light in the 3 pass-bands;
-
•
epoch of minimum RV;
-
•
and Fourier parameters of the light curve;
-
•
and Fourier parameters of the light curve;
-
•
peak-to-peak , , , RV amplitudes [, Amp(), Amp(), Amp(RV)];
-
•
RR Lyrae subclassification into RRab, RRc and RRd types;
-
•
absorption in the band, , for RRab stars;
-
•
photometric metallicity, [Fe/H], for RRab and RRc stars.
The SOS Cep&RRL parameters for the 14 bona fide RR Lyrae stars that do not appear in the vari_rrlyrae table (see Sect. 6.6) are provided instead in Table 16.
Gaia’s sourceids, coordinates, , and time series photometry for each of the 270 905 RR Lyrae stars (as well as for the 888 rejected sources) and RVS time series RVs for 1 895 between RR Lyrae stars and Cepheids and for 3 RR Lyrae stars re-classified as ECLs, can be retrieved from the Gaia data release archive141414http://archives.esac.esa.int/gaia/ and its mirror nodes. The archives also provide tools for queries and cross-match of Gaia data with other catalogues available in the literature.
We provide in Table 12 the specific link to the vari_rrlyrae table of the Gaia DR3 archive and summarise the names of the parameters computed by SOS Cep&RRL that can be retrieved for RR Lyrae stars from the archive table. Finally, in Appendix E we give examples of queries to retrieve some of the quantities and parameters listed in Table 12.
7.1 Completeness and purity of the DR3 RR Lyrae sample
The final, clean catalogue of 270 905 RR Lyrae stars confirmed by the SOS pipeline released in Gaia DR3 almost doubles the DR2 RR Lyrae catalogue. This is thanks to the improved sky coverage, the increased statistic, and the longer time baseline (34 months) covered by the DR3 time series data (see Sect. 3), that all contributed to improving the completeness and purity of the DR3 RR Lyrae catalogue. This is well shown by comparing the DR3 and the OGLE-IV catalogues of RR Lyrae stars, that we use in the following to estimate the completeness, contamination and percentage of new RR Lyrae stars in the LMC, SMC and Galactic bulge regions. We also note that while the completeness of our catalogue can be easily estimated in these regions, because our reference catalogue, OGLE-IV, is complete more or less at the same magnitude of the Gaia data, completeness in the All-Sky region is much more difficult to establish, because we still lack a likewise complete and homogeneous catalogue as OGLE’s for All-Sky RR Lyrae stars. In principle, we could use as reference for the All-Sky region our custom catalogue of 414 082 literature RR Lyrae stars, with a counterpart in the EDR3 gaia_source table and, specifically, the subsample of 311 798 sources confirmed as RR Lyrae stars by the SOS Cep&RRL pipeline. However, this reference catalogue suffers from being a compilation of many different surveys, each with a rather different sky coverage, depth/limiting magnitude, completeness and contamination.
With these caveats in mind
to estimate the completeness
of our clean, final catalogue of 270 905 DR3
RR Lyrae stars we have used as reference the following
catalogues that cover different regions of the sky:
i) OGLE IV for the RR Lyrae stars in the
LMC, SMC and the Galactic Bulge (red areas in Fig. 44);
ii) the All-Sky catalogue
in the DR2 vari_rrlyrae table (hereafter, Gaia DR2 catalogue) cleaned from contaminant galaxies (139 801 RR Lyrae stars, see Paper II);
iii) the ASAS-SN
catalogue, that contains 28 337 RR Lyrae stars with magnitudes in the range mag, distributed all-sky as shown by Fig. 45;
iv) the CATALINA
catalogue, that contains 42 775 RR Lyrae stars with magnitudes in the range mag, distributed
nearly all-sky as shown in Fig. 46; and,
v) the catalogue of 311 798 all-sky known RR Lyrae stars (extracted from
our custom catalogue of literature RR Lyrae stars (see Sect. 3.1), that the SOS pipeline confirms as RR Lyrae stars, along with the 200 294
RR Lyrae stars in the clean Gold Sample, for which periods are correctly recovered by the SOS pipeline151515We note that a
large fraction of the 311 798 known RR Lyrae stars confirmed by the SOS Cep&RRL pipeline (see Sect. 3.1) were finally rejected because the SOS periods for these sources differ by more than 0.001 d from the literature periods. Part of these rejected sources are listed in the vari_classifier_result table..
Results are summarised in Table 11.
Completeness values in Col. 2 correspond to the recovery percentages from a cross-match within 2.5
between RR Lyrae stars in the DR3 clean catalogue and the reference catalogues as listed in Col. 1.
Percentages of new discoveries in Col. 3 correspond to the percentage of additional sources in the DR3 catalogue with respect to the number of recovered sources in each reference catalogue.
Contamination in Col. 4 is estimated only for the new sources in the DR3 catalogue, by checking how many of the new sources have a non-RR Lyrae classification in the SIMBAD catalogue, and corresponds to the percentage of contaminants over the number of new sources with respect of each reference catalogue.
| Completeness | New(a) | Contamination | |
| OGLE-IV(b) | |||
| LMC | 83% | 4% | 1.8% |
| SMC | 94% | 6% | 8% |
| Bulge-up | 79% | 20% | 0.15% |
| Bulge-down | 82% | 40% | … |
| Gaia DR2(c) | 90% | 103% | 0.12% |
| ASAS-SN(b) | 73.7% | ||
| CATALINA(b) | 85.5% | ||
| All Surveys(d) | 64.2% |
(b) Regions used for the comparison with OGLE-IV are shown in red in Fig. 44, for ASAS-SN are shown in Fig. 45 and for CATALINA in Fig. 46.
(c)Comparison with the 139 801 sources in the DR2 RR Lyrae catalogue, after cleaning from contaminant galaxies.
(d) Comparison between the 311 798 all-sky known RR Lyrae stars, and the Gold Sample RR Lyrae stars whose periods are correctly recovered by the SOS pipeline.
7.2 Colour-magnitude diagrams
Figure 28 shows colour-magnitude diagrams (CMDs) in apparent vs () magnitudes defined by RR Lyrae stars in the DR3 clean catalogue. In particular, the left panel shows the CMD of RR Lyrae stars in GCs (red symbols) and with blue symbols the RR Lyrae stars in dSphs and UFDs for which the () colours are available. The middle panel shows instead the CMD of the whole sample of 215 115 (out of 270 905) RR Lyrae stars for which the () colours are available, using different colours for variables in the LMC, SMC and All-Sky regions, as defined in Sect. 2. Finally, the right panel shows the CMD of the whole sample (gray symbols), with red, green and blue symbols showing RR Lyrae stars with parallax better than 10%, 20% and 50%, respectively. In the left panel of Fig. 29 we show instead the HR diagram in absolute magnitude (M) and dereddend ( colour of 915 RRab stars that have parallax with 0.1, RUWE171717See Section 14.1.2 of ”Gaia Data Release 2 Documentation release 1.2”; https://gea.esac.esa.int/archive/documentation/GDR2/., and 0.2 mag. Then in the right panel, are shown 620 RRab stars from the same sample, but with 0.1 mag. The observed mean magnitudes were dereddened using the values estimated by the SOS pipeline, while the magnitudes were derived from the observed GBP values using the relations: = 0.840 and )= 1.086 from Bono et al. (2019). The RR Lyrae stars have been colour-coded according to their metallicity, as computed by the SOS pipeline, and appear to be a mixture of a metal poor and bluer component and a more metallic and redder component. We have over-plotted the HR diagrams in Fig. 29 with the boundaries of theoretical instability strips (ISs) for fundamental mode RR Lyrae stars of three different chemical compositions (Z=0.0001; Z=0.001; and Z=0.02), from the suite of theoretical models by Marconi et al. (2015). The RR Lyrae stars nicely fall within the boundaries of the theoretical ISs shown in Fig. 29. The slight discrepancy at the red boundary of the IS between observed RR Lyrae position and the predicted edge might be due to the treatment of convection. As extensively discussed in (Di Criscienzo et al., 2004) an increase in the mixing length parameter from the adopted 1.5 value to 2.0, makes the predicted boundary bluer by about 300 K, thus much better matching the observed star distribution. We also note that the few RR Lyrae stars with ( colours larger than 0.3 mag, that fall outside the red boundaries of the Z=0.001 and 0.02 ISs, have SOS metallicity estimates with errors larger than 0.46 and up to 1.5 dex.
7.3 Sky maps
Figure 30 shows the distribution on sky, in galactic coordinates, of the clean sample of 270 905 DR3 RR Lyrae stars and Fig. 31 shows their , vs and vs diagrams. The two extended RR Lyrae overdensities in the bottom-right quadrant of Fig. 30 trace the halos of the Large and Small Magellanic Clouds. The stream of RR Lyrae stars crossing the Galactic disc is the disrupting Sagittarius dSph galaxy popping out just below to the left from the centre of the map. Other smaller RR Lyrae overdensities can easily be recognised, like the Sculptor dSph (with more than 500 RR Lyrae) close to the south Galactic pole, the Ursa Minor and Draco dSphs in the upper north-west quadrant, the Sextans dSph in the upper north-east quadrant and close to the north Galactic pole the concentration of more than 150 RR Lyrae stars of the M3 GC. Further 1 500 RR Lyrae stars are concentrated in other 94 different GCs in the map.
The DR3 RR Lyrae clean catalogue contains 70 611 new RR Lyrae stars discovered by Gaia. They are mainly faint sources (see Fig. 27) and, according to Fig. 32, they are mainly concentrated in high reddening regions of the Galactic disc and bulge, that were poorly sampled with Gaia DR2 scanning law.
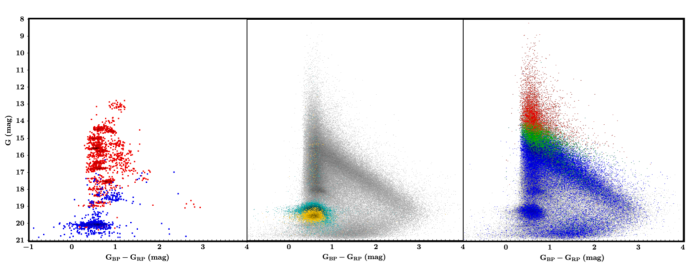
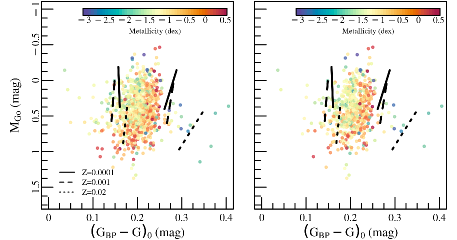
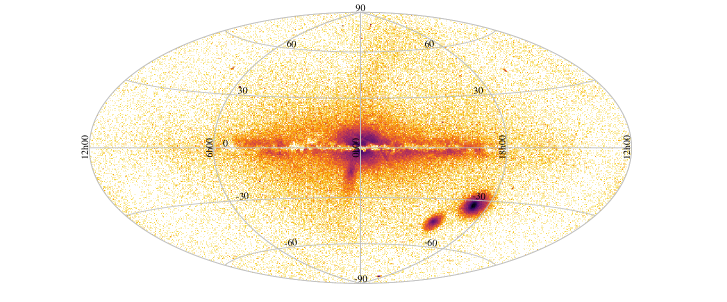
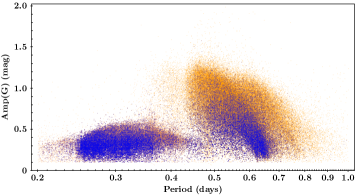
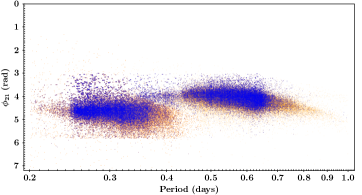
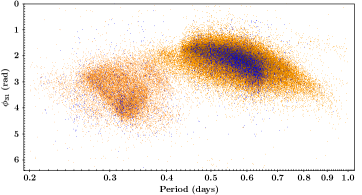
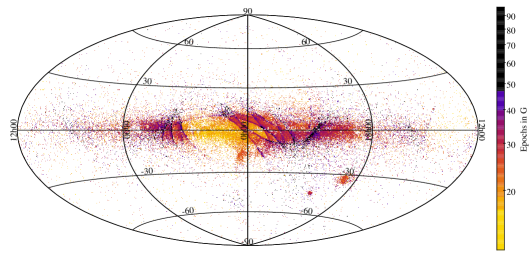
Fig. 33 presents a map, in galactic coordinates, drawn from 133 559 RR Lyrae stars in the DR3 clean catalogue for which individual photometric metallicities ([Fe/H)] obtained by the SOS Cep&RRL pipeline (see Sect. 5.1) are published in the Gaia DR3 vari_rrlyrae table. We have colour-coded the sources in the map according to their metallicity.The higher metallicity of the RR Lyrae stars in the MW bulge and disc compared to variables in the Galactic halo can easily be appreciated, as it is also clear the lower metal abundance of the RR Lyrae stars in the SMC compared to the variables in the LMC. To make sure that the features we see in Fig. 33 are not an artifact due to measurement errors, or to the adopted metallicity calibration (Nemec et al., 2013), in Fig. 34 we show only RR Lyrae stars with metallicity errors 0.46 dex (the mean error of the SOS Cep&RRL metallicity estimates according to Fig. 19 in Sect. 5.1). The relative difference in metallicity of the RR Lyrae stars in the LMC, SMC, Galactic halo, and in the bulge and thin disc of our Galaxy is still rather cleanly visible, and it would not change significantly were we to adopt, for instance, Crestani et al. (2021) metallicity calibration. Fig. 35 shows the diagram of the 133 559 RR Lyrae stars with a metallicity estimate. We have again colour-coded the sources according to their metal abundance. The colour-coding highlights very nicely the difference in metallicity of the various sequences (Oosterhoff loci, Oosterhoff 1939) seen in the diagram, in particular the higher metallicity of short period RRab and RRc stars, compared to the lower metal abundance of long period fundamental mode and first overtone RR Lyrae.
Finally, we show in Fig. 36 a map in galactic coordinates of 142 660 fundamental-mode RR Lyrae stars with absorption in the -band computed by the SOS pipeline (see Sect. 5.2). The sources are colour-coded according to their individual values. They neatly trace the high extinction regions along the Galactic plane.
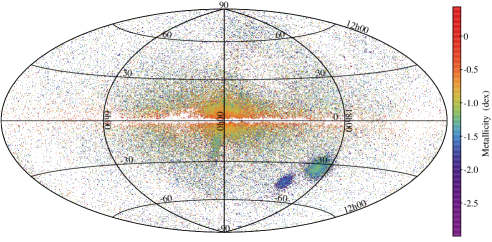
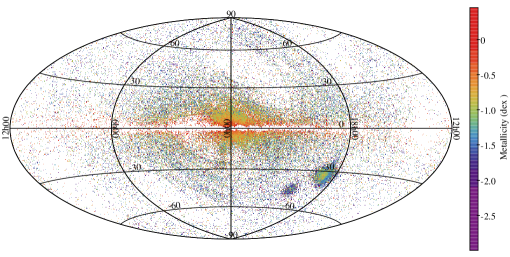
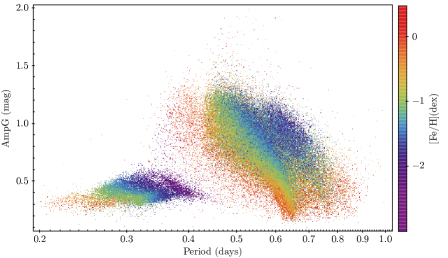
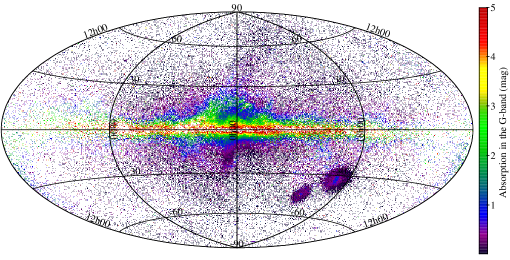
8 Conclusions and future developments
An factor two in statistic with respect to DR2, a better characterization of the RR Lyrae stars and their pulsational and astrophysical parameters, along with the improved astrometry published with Gaia EDR3 (Gaia Collaboration et al., 2021), make the SOS Cep&RRL DR3 sample, the largest, most homogeneous and parameter-rich catalogue of All-Sky RR Lyrae stars published so far, in the magnitude range from 7.64 mag (the magnitude of RR Lyr itsef, sourceid: 2125982599343482624), and 21.14 mag (the magnitude of star 658193189673442944, the faintest RR Lyrae in the catalogue).
The DR3 RR Lyrae catalogue along with known RR Lyrae stars confirmed by the SOS pipeline, but for which the SOS periods differ from the literature periods (see Sect. 3.1), lead to about 370 000 the census of RR Lyrae stars, within Gaia’s limiting magnitude, in our Galaxy and its close companions.
Gaia Data Release 4 (DR4), will be based on 66 months of data, hence, it will allow the SOS Cep&RRL pipeline to better pin down the pulsation period(s) and more efficiently characterise RR Lyrae stars and Cepheids. The pipeline is currently being re-designed and simplified, and a number of changes will be implemented to improve the processing in view of Gaia DR4. Some of these changes are briefly outlined below.
-
1.
Tests are in progress about how to improve the algorithm for the period determination (currently the Lomb-Scargle, see Sect. 2), in order to reduce the number of spurious period detections, particularly when several peaks of similar power are present in the power spectrum of the sources;
-
2.
The number of harmonics for modeling the light curves of RRc stars with well sampled light/RV curves will be increased to more than 2, in order to increase the number of RR Lyrae stars for which the Fourier parameter is available;
-
3.
The skewness of the light curve and the time of rise to maximum light (-rise time) will be adopted, besides the position on the diagram, to distinguish RRab from RRc stars, particularly in the short period regime ( 0.4 d);
-
4.
Luminosity-metallicity (), and -metallicity () relations in the Gaia bands, calibrated on Gaia parallaxes (such as those published by Garofalo et al., 2022) will be adopted in the pipeline to classify RR Lyrae stars with reliable parallax values;
-
5.
CMDs in absolute magnitude, colour-colour diagrams and the comparison with theoretical instability strips will be used to improve the source classification, the derivation of intrinsic parameters (e.g. effective temperatures) and the removal of contaminants;
-
6.
We will test different calibrations of the relations used to estimate photometric metallicities from the Fourier parameter and the pulsation period of RR Lyrae stars;
-
7.
We will revise how errors in metallicity are computed as currently they may be overestimated;
-
8.
Test will be made to derive astrophysical parameters (metallicities, gravities and values) to best select the template spectra for the cross-correlation to measure radial velocities of RR Lyrae stars, using also the time series of spectra.
To conclude, the SOS Cep&RRL clean catalogue of 270 905 RR Lyrae stars published with Gaia DR3 already represents a significant step forward in the construction of a complete, homogeneous and parameter-rich catalogue of All-Sky RR Lyrae stars, within the limiting magnitude of Gaia, that was lacking so far. We anticipate this RR Lyrae catalogue to be consolidated and further improved with Gaia DR4.
| Table URL | http://archives.esac.esa.int/gaia/ |
|---|---|
| RR Lyrae main parameters computed by the SOS Cep&RRL pipeline | |
| Table Name | gaiadr3.vari_rrlyrae |
| Source ID | source_id |
| Type | best_classification (one of RRc, RRab or RRd) |
| p_f, p1_o | |
| pf_error, p1_o_error | |
| E(a)a\rm(a)(a)a\rm(a)footnotemark: (, , , RV) | epoch_g, epoch_bp, epoch_rp, epoch_rv |
| epoch_g_error, epoch_bp_error, epoch_rp_error, epoch_rv_error | |
| , | int_average_g, int_average_bp, int_average_rp, average_rv |
| , , , | int_average_g_error, int_average_bp_error, int_average_rp_error, average_rv_error |
| Amp | peak_to_peak_g, peak_to_peak_bp, peak_to_peak_rp, peak_to_peak_rv |
| peak_to_peak_g_error, peak_to_peak_bp_error, peak_to_peak_rp_error, peak_to_peak_rv_error | |
| phi21_g | |
| phi21_g_error | |
| r21_g | |
| r21_g_error | |
| phi31_g | |
| phi31_g_error | |
| r31_g | |
| r31_g_error | |
| (b)b\rm(b)(b)b\rm(b)footnotemark: | metallicity |
| ([Fe/H]) | metallicity_error |
| A()(c)c\rm(c)(c)c\rm(c)footnotemark: | g_absorption |
| A() | g_absorption_error |
| ( band) | num_clean_epochs_g |
| ( band) | num_clean_epochs_bp |
| ( band) | num_clean_epochs_rp |
| (RV) | num_clean_epochs_rv |
Acknowledgements.
This work has made use of data from the ESA space mission Gaia, processed by the Gaia Data Processing and Analysis Consortium (DPAC). Funding for the DPAC has been provided by national institutions participating in the Gaia Multilateral Agreement. In particular, the Italian participation in DPAC has been supported by Istituto Nazionale di Astrofisica (INAF) and the Agenzia Spaziale Italiana (ASI) through grants I/037/08/0, I/058/10/0, 2014-025-R.0, 2014-025-R.1.2015 and 2018-24-HH.0 to INAF (PI M.G. Lattanzi), the Swiss participation by the Swiss State Secretariat for Education, Research and Innovation through the “Activités Nationales Complémentaires”. The work was supported in part by” the French Centre National de la Recherche Scientifique (CNRS), the Centre National d’Etudes Spatiales (CNES), the Institut des Sciences de l’ Univers (INSU) through the Service National d’Observation (SNO) Gaia. UK community participation in this work has been supported by funding from the UK Space Agency, and from the UK Science and Technology Research Council. RA has been funded by the DLR (German space agency) via grants 50QG0602, 50QG1001, 50QG1403, and 50QG201. The Gaia mission website is: http://www.cosmos.esa.int/gaia. This research has made use of the SIMBAD database, operated at CDS, Strasbourg, France. We warmly thank O. Creevey, A. Recio-Blanco and M. Fouesneau for advises on the use of products from the GSP_Spec and GSP_Phot modules of the Apsis pipeline, D. Harrison for running the SEAPipe pipeline on the catalogue of RR Lyrae stars produced by the SOS Cep&RRL pipeline and P. Montegriffo for the development and maintenance of the GRATIS software. In this study we have largely made use of TOPCAT, Taylor, M. B. (2005), “TOPCAT & STIL: Starlink Table/VOTable Processing Software”, in Astronomical Data Analysis Software and Systems XIV, eds. P. Shopbell et al., ASP Conf. Ser. 347, p. 29.References
- Andrae et al. (2022) Andrae et al. 2022, A&A in prep.
- Arellano Ferro et al. (2014) Arellano Ferro, A., Ahumada, J. A., Calderón, J. H., & Kains, N. 2014, Rev. Mexicana Astron. Astrofis., 50, 307
- Arellano Ferro et al. (2013) Arellano Ferro, A., Bramich, D. M., Giridhar, S., et al. 2013, Acta Astron., 63, 429
- Arellano Ferro et al. (2011) Arellano Ferro, A., Figuera Jaimes, R., Giridhar, S., et al. 2011, MNRAS, 416, 2265
- Baranne et al. (1979) Baranne, A., Mayor, M., & Poncet, J. L. 1979, Vistas in Astronomy, 23, 279
- Barnes et al. (1988) Barnes, Thomas G., I., Moffett, T. J., Hawley, S. L., Slovak, M. H., & Frueh, M. L. 1988, ApJS, 67, 403
- Bellazzini et al. (2002) Bellazzini, M., Ferraro, F. R., Origlia, L., et al. 2002, AJ, 124, 3222
- Benkő et al. (2006) Benkő, J. M., Bakos, G. Á., & Nuspl, J. 2006, MNRAS, 372, 1657
- Bersier & Wood (2002) Bersier, D. & Wood, P. R. 2002, AJ, 123, 840
- Bhardwaj et al. (2021) Bhardwaj, A., Rejkuba, M., de Grijs, R., et al. 2021, ApJ, 909, 200
- Blažko (1907) Blažko, S. 1907, Astronomische Nachrichten, 175, 325
- Bono et al. (2019) Bono, G., Iannicola, G., Braga, V. F., et al. 2019, ApJ, 870, 115
- Borissova et al. (2006) Borissova, J., Minniti, D., Rejkuba, M., & Alves, D. 2006, A&A, 460, 459
- Braga et al. (2018) Braga, V. F., Stetson, P. B., Bono, G., et al. 2018, AJ, 155, 137
- Cacciari & Clementini (2003) Cacciari, C. & Clementini, G. 2003, in Stellar Candles for the Extragalactic Distance Scale, ed. D. Alloin & W. Gieren, Vol. 635, 105–122
- Cacciari et al. (1989a) Cacciari, C., Clementini, G., & Buser, R. 1989a, A&A, 209, 154
- Cacciari et al. (1992) Cacciari, C., Clementini, G., & Fernley, J. A. 1992, ApJ, 396, 219
- Cacciari et al. (1989b) Cacciari, C., Clementini, G., Prevot, L., & Buser, R. 1989b, A&A, 209, 141
- Cacciari et al. (1987) Cacciari, C., Clementini, G., Prevot, L., et al. 1987, A&AS, 69, 135
- Carnerero et al. (2022) Carnerero et al. 2022, A&A in prep.
- Catelan & Smith (2015) Catelan, M. & Smith, H. A. 2015, Pulsating Stars, Wiley-VCH
- Chen et al. (2020) Chen, X., Wang, S., Deng, L., et al. 2020, VizieR Online Data Catalog, J/ApJS/249/18
- Clement et al. (2001) Clement, C. M., Muzzin, A., Dufton, Q., et al. 2001, AJ, 122, 2587
- Clementini et al. (1990) Clementini, G., Cacciari, C., & Lindgren, H. 1990, A&AS, 85, 865
- Clementini et al. (1995) Clementini, G., Carretta, E., Gratton, R., et al. 1995, AJ, 110, 2319
- Clementini et al. (2012) Clementini, G., Cignoni, M., Contreras Ramos, R., et al. 2012, ApJ, 756, 108
- Clementini et al. (2000) Clementini, G., Di Tomaso, S., Di Fabrizio, L., et al. 2000, AJ, 120, 2054
- Clementini et al. (2003) Clementini, G., Gratton, R., Bragaglia, A., et al. 2003, AJ, 125, 1309
- Clementini et al. (1994) Clementini, G., Merighi, R., Pasquini, L., Cacciari, C., & Gouiffes, C. 1994, MNRAS, 267, 83
- Clementini et al. (2016) Clementini, G., Ripepi, V., Leccia, S., et al. 2016, A&A, 595, A133
- Clementini et al. (2019) Clementini, G., Ripepi, V., Molinaro, R., et al. 2019, A&A, 622, A60
- Contreras et al. (2010) Contreras, R., Catelan, M., Smith, H. A., et al. 2010, AJ, 140, 1766
- Contreras Ramos et al. (2018) Contreras Ramos, R., Minniti, D., Gran, F., et al. 2018, ApJ, 863, 79
- Coppola et al. (2015) Coppola, G., Marconi, M., Stetson, P. B., et al. 2015, ApJ, 814, 71
- Corwin et al. (2008) Corwin, T. M., Borissova, J., Stetson, P. B., et al. 2008, AJ, 135, 1459
- Creevey et al. (2022) Creevey et al. 2022, A&A in prep.
- Crestani et al. (2021) Crestani, J., Braga, V. F., Fabrizio, M., et al. 2021, ApJ, 914, 10
- Cropper et al. (2018) Cropper, M., Katz, D., Sartoretti, P., et al. 2018, A&A, 616, A5
- Cuffey (1966) Cuffey, J. 1966, AJ, 71, 514
- Dékány et al. (2018) Dékány, I., Hajdu, G., Grebel, E. K., et al. 2018, ApJ, 857, 54
- Di Criscienzo et al. (2004) Di Criscienzo, M., Marconi, M., & Caputo, F. 2004, ApJ, 612, 1092
- Di Fabrizio et al. (2005) Di Fabrizio, L., Clementini, G., Maio, M., et al. 2005, A&A, 430, 603
- Drake et al. (2013) Drake, A. J., Catelan, M., Djorgovski, S. G., et al. 2013, ApJ, 763, 32
- Drake et al. (2017) Drake, A. J., Djorgovski, S. G., Catelan, M., et al. 2017, MNRAS, 469, 3688
- Drake et al. (2014) Drake, A. J., Graham, M. J., Djorgovski, S. G., et al. 2014, ApJS, 213, 9
- Eyer et al. (2017) Eyer, L., Mowlavi, N., Evans, D. W., et al. 2017, arXiv e-prints, arXiv:1702.03295
- Eyer et al. (2022) Eyer et al. 2022, A&A in prep.
- Fernley et al. (1998) Fernley, J., Barnes, T. G., Skillen, I., et al. 1998, A&A, 330, 515
- Fernley et al. (1989) Fernley, J. A., Lynas-Gray, A. E., Skillen, I., et al. 1989, MNRAS, 236, 447
- Gaia Collaboration et al. (2018) Gaia Collaboration, Brown, A. G. A., Vallenari, A., et al. 2018, A&A, 616, A1
- Gaia Collaboration et al. (2021) Gaia Collaboration, Brown, A. G. A., Vallenari, A., et al. 2021, A&A, 649, A1
- Gaia Collaboration et al. (2016) Gaia Collaboration, Brown, A. G. A., Vallenari, A., et al. 2016, A&A, 595, A2
- Gaia Collaboration et al. (2017) Gaia Collaboration, Clementini, G., Eyer, L., et al. 2017, A&A, 605, A79
- Gaia Collaboration et al. (2019) Gaia Collaboration, Eyer, L., Rimoldini, L., et al. 2019, A&A, 623, A110
- Gaia Collaboration et al. (2022a) Gaia Collaboration, Montegriffo, P., & …. 2022a, A&A in prep.
- Gaia Collaboration et al. (2022b) Gaia Collaboration, Vallenari, A., & … 2022b, A&A in prep.
- Garofalo et al. (2013) Garofalo, A., Cusano, F., Clementini, G., et al. 2013, ApJ, 767, 62
- Garofalo et al. (2022) Garofalo, A., Delgado, H. E., Sarro, L. M., et al. 2022, MNRAS, 513, 788
- Gavras et al. (2022) Gavras et al. 2022, A&A in prep.
- Gieren et al. (1989) Gieren, W. P., Barnes, Thomas G., I., & Moffett, T. J. 1989, ApJ, 342, 467
- Gillet & Crowe (1988) Gillet, D. & Crowe, R. A. 1988, A&A, 199, 242
- Gillet & Fokin (2014) Gillet, D. & Fokin, A. B. 2014, A&A, 565, A73
- Gomel et al. (2022) Gomel et al. 2022, A&A in prep.
- Goranskij (1976) Goranskij, V. P. 1976, Peremennye Zvezdy Prilozhenie, 3, 1
- Gratton et al. (2004) Gratton, R. G., Bragaglia, A., Clementini, G., et al. 2004, A&A, 421, 937
- Harrison (2011) Harrison, D. L. 2011, Experimental Astronomy, 31, 157
- Holl et al. (2022) Holl et al. 2022, A&A in prep.
- Iorio & Belokurov (2021) Iorio, G. & Belokurov, V. 2021, MNRAS, 502, 5686
- Jayasinghe et al. (2019) Jayasinghe, T., Stanek, K. Z., Kochanek, C. S., et al. 2019, MNRAS, 485, 961
- Jones et al. (1988) Jones, R. V., Carney, B. W., & Latham, D. W. 1988, ApJ, 332, 206
- Jones et al. (1987) Jones, R. V., Carney, B. W., Latham, D. W., & Kurucz, R. L. 1987, ApJ, 314, 605
- Jones et al. (1992) Jones, R. V., Carney, B. W., Storm, J., & Latham, D. W. 1992, ApJ, 386, 646
- Jurcsik & Kovacs (1996) Jurcsik, J. & Kovacs, G. 1996, A&A, 312, 111
- Kaluzny et al. (1997) Kaluzny, J., Krzeminski, W., & Nalezyty, M. 1997, A&AS, 125, 337
- Katz et al. (2022) Katz et al. 2022, A&A in prep.
- Kervella et al. (2019) Kervella, P., Gallenne, A., Remage Evans, N., et al. 2019, A&A, 623, A116
- Kunder et al. (2008) Kunder, A., Popowski, P., Cook, K. H., & Chaboyer, B. 2008, AJ, 135, 631
- Lambert et al. (1996) Lambert, D. L., Heath, J. E., Lemke, M., & Drake, J. 1996, ApJS, 103, 183
- Layden & Sarajedini (2003) Layden, A. C. & Sarajedini, A. 2003, AJ, 125, 208
- Liu & Janes (1989) Liu, T. & Janes, K. A. 1989, ApJS, 69, 593
- Liu & Janes (1990) Liu, T. & Janes, K. A. 1990, ApJ, 360, 561
- Lomb (1976) Lomb, N. R. 1976, Ap&SS, 39, 447
- Marconi et al. (2015) Marconi, M., Coppola, G., Bono, G., et al. 2015, ApJ, 808, 50
- Martínez-Vázquez et al. (2016) Martínez-Vázquez, C. E., Stetson, P. B., Monelli, M., et al. 2016, MNRAS, 462, 4349
- Martínez-Vázquez et al. (2019) Martínez-Vázquez, C. E., Vivas, A. K., Gurevich, M., et al. 2019, MNRAS, 490, 2183
- Meylan et al. (1986) Meylan, G., Burki, G., Rufener, F., et al. 1986, A&AS, 64, 25
- Molnár et al. (2018) Molnár, L., Plachy, E., Juhász, Á. L., & Rimoldini, L. 2018, A&A, 620, A127
- Mowlavi et al. (2022) Mowlavi et al. 2022, A&A in prep.
- Mullen et al. (2021) Mullen, J. P., Marengo, M., Martínez-Vázquez, C. E., et al. 2021, ApJ, 912, 144
- Muraveva et al. (2020) Muraveva, T., Clementini, G., Garofalo, A., & Cusano, F. 2020, MNRAS, 499, 4040
- Muraveva et al. (2018) Muraveva, T., Delgado, H. E., Clementini, G., Sarro, L. M., & Garofalo, A. 2018, MNRAS, 481, 1195
- Nemec et al. (2013) Nemec, J. M., Cohen, J. G., Ripepi, V., et al. 2013, ApJ, 773, 181
- Nemec et al. (1988) Nemec, J. M., Wehlau, A., & Mendes de Oliveira, C. 1988, AJ, 96, 528
- Oosterhoff (1939) Oosterhoff, P. T. 1939, The Observatory, 62, 104
- Osuna et al. (2008) Osuna, P., Ortiz, I., Lusted, J., et al. 2008, IVOA Astronomical Data Query Language Version 2.00, IVOA Recommendation 30 October 2008
- Palaversa et al. (2013) Palaversa, L., Ivezić, Ž., Eyer, L., et al. 2013, AJ, 146, 101
- Pancino et al. (2015) Pancino, E., Britavskiy, N., Romano, D., et al. 2015, MNRAS, 447, 2404
- Piersimoni et al. (2002) Piersimoni, A. M., Bono, G., & Ripepi, V. 2002, AJ, 124, 1528
- Pigulski et al. (2009) Pigulski, A., Pojmański, G., Pilecki, B., & Szczygieł, D. M. 2009, Acta Astron., 59, 33
- Pojmanski (2000) Pojmanski, G. 2000, Acta Astron., 50, 177
- Pojmanski (2002) Pojmanski, G. 2002, Acta Astron., 52, 397
- Recio-Blanco et al. (2022) Recio-Blanco et al. 2022, A&A in prep.
- Riello et al. (2021) Riello, M., De Angeli, F., Evans, D. W., et al. 2021, A&A, 649, A3
- Rimoldini et al. (2022a) Rimoldini et al. 2022a, A&A in prep.
- Rimoldini et al. (2022b) Rimoldini et al. 2022b, Gaia DR3 documentation Chapter 10: Variability, Gaia DR3 documentation
- Ripepi et al. (1997) Ripepi, V., Barone, F., Milano, L., & Russo, G. 1997, A&A, 318, 797
- Ripepi et al. (2022) Ripepi et al. 2022, A&A in prep.
- Salinas et al. (2016) Salinas, R., Contreras Ramos, R., Strader, J., et al. 2016, AJ, 152, 55
- Samus’ et al. (2017) Samus’, N. N., Kazarovets, E. V., Durlevich, O. V., Kireeva, N. N., & Pastukhova, E. N. 2017, Astronomy Reports, 61, 80
- Sartoretti et al. (2022) Sartoretti, P., Blomme, R., David, M., & Seabroke, G. 2022, Gaia DR3 documentation Chapter 6: Spectroscopy, Gaia DR3 documentation
- Sartoretti et al. (2018) Sartoretti, P., Katz, D., Cropper, M., et al. 2018, A&A, 616, A6
- Scargle (1982) Scargle, J. D. 1982, ApJ, 263, 835
- Sesar et al. (2014) Sesar, B., Banholzer, S. R., Cohen, J. G., et al. 2014, ApJ, 793, 135
- Sesar et al. (2017) Sesar, B., Hernitschek, N., Mitrović, S., et al. 2017, AJ, 153, 204
- Sesar et al. (2013) Sesar, B., Ivezić, Ž., Stuart, J. S., et al. 2013, AJ, 146, 21
- Siegel & Majewski (2000) Siegel, M. H. & Majewski, S. R. 2000, AJ, 120, 284
- Skillen et al. (1989) Skillen, I., Fernley, J. A., Jameson, R. F., Lynas-Gray, A. E., & Longmore, A. J. 1989, MNRAS, 241, 281
- Skillen et al. (1993) Skillen, I., Fernley, J. A., Stobie, R. S., & Jameson, R. F. 1993, MNRAS, 265, 301
- Smith (1995) Smith, H. A. 1995, Cambridge Astrophysics Series, 27
- Soszyński et al. (2014) Soszyński, I., Udalski, A., Szymański, M. K., et al. 2014, Acta Astron., 64, 177
- Soszyński et al. (2019) Soszyński, I., Udalski, A., Szymański, M. K., et al. 2019, Acta Astron., 69, 87
- Stetson et al. (2014) Stetson, P. B., Fiorentino, G., Bono, G., et al. 2014, PASP, 126, 616
- Torrealba et al. (2015) Torrealba, G., Catelan, M., Drake, A. J., et al. 2015, MNRAS, 446, 2251
- Vivas et al. (2019) Vivas, A. K., Alonso-García, J., Mateo, M., Walker, A., & Howard, B. 2019, AJ, 157, 35
- Vivas et al. (2020) Vivas, A. K., Martínez-Vázquez, C., & Walker, A. R. 2020, ApJS, 247, 35
- Walker (1998) Walker, A. R. 1998, AJ, 116, 220
- Walker & Nemec (1996) Walker, A. R. & Nemec, J. M. 1996, AJ, 112, 2026
- Wenger et al. (2000) Wenger, M., Ochsenbein, F., Egret, D., et al. 2000, A&AS, 143, 9
Appendix A RVS radial velocities
A.1 Tables with the source-level parameters of 51 Cepheids and 45 RR Lyrae stars for which this information is lacking in the gaia_source table of the Gaia DR3 archive.
| Gaia sourceid | rv_template_teff | rv_template_logg | rv_template_feh | rv_atm_param_origin | grvs_mag | grvs_mag_error | radvelinvalidreason |
|---|---|---|---|---|---|---|---|
| 5351161399793209984 | 5 000 | 1.5 | 0.25 | 222 | 6.281 | 0.043 | D |
| 5329352998951582976 | 6 000 | 1 | 0.25 | 222 | 6.492 | 0.056 | D |
| 5355057622307185280 | 5 500 | 3.5 | 0 | 333 | 6.607 | 0.038 | D |
| 5338036117182452096 | 6 250 | 2 | 0.25 | 222 | 6.815 | 0.070 | D |
| 473043922712140928 | 5 500 | 4.5 | 0 | 333 | 6.834 | 0.047 | D |
| Gaia sourceid | rv_template_teff | rv_template_logg | rv_template_feh | rv_atm_param_origin | grvs_mag | grvs_mag_error | radvelinvalidreason |
|---|---|---|---|---|---|---|---|
| 2857456211775108480 | 6 500 | 3 | 0 | 222 | 9.076 | 0.127 | D |
| 2142052889490819328 | 6 250 | 3 | 0.5 | 444 | 9.324 | 0.083 | T |
| 234108363683247616 | 6 500 | 3 | 0.25 | 555 | 9.411 | 0.091 | D |
| 6686289122295812736 | 6 250 | 3.5 | 0.5 | 444 | 9.534 | 0.051 | D |
| 1858568795812429056 | 6 000 | 3 | 0.5 | 444 | 10.242 | 0.059 | D |
| Source_id | Name | Mode | Period | NRVS | Amp(RV) | Ref1 | Ref2 | Notes | Ins. | ||||||
|---|---|---|---|---|---|---|---|---|---|---|---|---|---|---|---|
| days | mag | km/s | km/s | km/s | dex | K | km/s | ||||||||
| (1) | (2) | (3) | (4) | (5) | (6) | (7) | (8) | (9) | (10) | (11) | (12) | (13) | (14) | (15) | (16) |
| 1286188056265485952 | RS Boo | RRab | 0.3773523 | 10.34 | 28 | 67.38 | (2.57) | 3.7 | 0.50 | 6 795 | 3.261(a,b) | 8 | 8 | Blaz. | b |
| 1492230556717187456 | TV Boo | RRc | 0.312551 | 10.91 | 34 | 27.07 | (5.00) | 104.0 | 2.200.15 | 7 057 | 2.90 | 1 | 1 | - | b |
| 6884361748289023488 | YZ Cap | RRc | 0.2734508 | 11.22 | 27 | 26.19 | (2.29) | 1.25 | 7 280100 | 3.000.10 | 2 | 10 | - | a | |
| 2558296724402139392 | RR Cet | RRab | 0.5530296 | 9.61 | 30 | 62.79 | (2.50) | 74.6/75.1 | 1.250.10 | 6 434 | 2.71 | 1,6 | 1 | - | b |
| 2414817603803476864 | UU Cet | RRab | 0.6060755 | 11.94 | 21 | 55.71 | (3.10) | 0.87 | 6 290 | 2.75(c,b) | 3 | 13 | - | a | |
| 3546458301374134528 | W Crt | RRab | 0.4120288 | 11.45 | 31 | 75.76 | 59.87 (3.64) | 58.8 | 0.70 | 6 715 | 2.70(c) | 4 | 4 | - | c |
| 1760981190300823808 | DX Del | RRab | 0.4726188 | 9.81 | 26 | 55.48 | (2.80) | 55.1 | 0.25 | 6 512 | 2.70.2(d,b) | 5,6 | 12 | - | d,a |
| 1058066262817534336 | SU Dra | RRab | 0.6604232 | 9.68 | 13 | 60.63 | (1.87) | 1.600.20 | 6 433 | 2.72 | 1 | 1 | - | b | |
| 1683444631038133248 | SW Dra | RRab | 0.5696720 | 10.38 | 20 | 62.04 | (2.57) | 0.80/1.40 | 6 38050e | 2.780.10 | 2,7 | 11,8 | - | a,b | |
| 2981136563934324224 | RX Eri | RRab | 0.5872470 | 9.56 | 26 | 67.15 | 67.72 (3.89) | 66.4 | 1.400.20 | 6 326 | 2.67 | 1 | 1 | - | b |
| 5117708899055276416 | SS For | RRab | 0.49544999 | 10.10 | 28 | 62.81 | 109.93 (4.92) | 111.7 | 1.50 | 6 71050 | 2.850.10 | 2 | 11 | Blaz. | a |
| 4596935593202765184 | TW Her | RRab | 0.3996157 | 11.22 | 27 | 72.90 | 3.31 (2.66) | 4.5 | 0.50 | 6 770 | 3.424(a,b) | 8 | 8 | - | b |
| 6483680332235888896 | V Ind | RRab | 0.4796017 | 9.86 | 12 | 52.83 | 202.71 (1.74) | 202.5 | 1.51 | - | - | 3 | - | - | a |
| 1793460115244988800 | AV Peg | RRab | 0.3903809 | 10.39 | 16 | 65.68 | 58.22 (1.70) | 58.7 | 0.000.10 | 6 603 | 2.99 | 1 | 1 | - | b |
| 6526559499016401408 | RV Phe | RRab | 0.5963778 | 11.81 | 37 | 59.72 | 99.72 (6.65) | 99.1 | 1.50 | 6 37050/6 290 | 2.760.10 | 2 | 10,13 | Blaz.? | a |
| 6771307454464848768 | V440 Sgr(f) | RRab | 0.4774854 | 10.23 | 10 | 76.61 | 60.92 (2.95) | 61.6 | 1.40 | 6 81050 | 2.870.10 | 2 | 10 | - | a |
| 4709830423483623808 | W Tuc | RRab | 0.6422386 | 11.34 | 18 | 69.22 | 64.69 (1.90) | 64.60 | 1.35 | 6 440 | 2.75(c,b) | 3 | 13 | - | a |
| 3698725337376560512 | UU Vir | RRab | 0.4756085 | 10.52 | 14 | 72.32 | (2.07) | / | 0.400.10/0.7 | 6 520/6 570 | 2.84/3.279(a,b) | 1,5,8 | 1,8 | Bin.? | b |
| 6045485228725626752 | M4-V32(g) | RRab | 0.5791070 | 12.90 | 34 | 63.50 | 67.93 (5.31) | 66.4 | 1.3 0.2 | 6 324 | 2.67 | 9 | 9 | - | b |
; (8) Centre of mass RV () of the curve obtained by combining RVS and literature RV data, with in parentheses the rms scatter of the modeled RV curve; (9) Literature values for ;
(10) Iron abundance; (11) Mean effective temperature; (12)
Mean gravity; (13) References for the
literature RV; (14) References for the stellar parameters; (15) Notes: Binary (Bin) and/or Blazhko (Blaz.).; (16) Instrument type: a=CORAVEL; b=spectra; c=image-tube spectrograph;
d=photoelectric RV meter.
The meaning of the numbers in columns (13) and (14) is as follows: 1=Liu & Janes (1989); 2=Cacciari et al. (1987);3=Clementini et al. (1990);4=Skillen et al. (1993);5=Barnes et al. (1988);6=Meylan et al. (1986);7=Jones et al. (1987);8=Jones et al. (1988);9=Liu & Janes (1990);10=Cacciari et al. (1989a);11=Cacciari et al. (1989b);12=Skillen et al. (1989);13=Cacciari et al. (1992);The binarity information is taken from Kervella et al. (2019).
aGravity value at =0.0.
bCacciari et al. (1992) derived a mean gravity of 2.830.11 dex by averaging the gravity values inferred from the radii and masses
published by
Jones et al. (1992), which were derived from the B-W analysis of 18 RRab and 2 RRc stars. This mean gravity value can be used in place of (a), (c) and (d) or when a value is missing.
cConstant gravity value adopted in Cacciari et al. (1992) B-W analysis of UU Cet, RV Phe and W Tuc, and in Skillen et al. (1993) analysis of W Crt.
d2.70.2 is the ‘static’ gravity, that is the gravity of an RR Lyrae star were it not pulsating (Fernley et al. 1989).
e=6460 K estimated from the colour by (Jones et al. 1988) .
fThe period derived by the SOS pipeline for this star (=0.428933547 d) is incorrect, we provide in the table the correct period (=0.4774854 d). The , Amp(RV) and values of V440 Sgr listed in the table were computed using the correct period.
g Two RV measurements from RVS around the curve maximum are outliers with large errors. They were discarded when computing the Amp(RV) and values in columns (7) and (8).
A.2 Comparison of literature and Gaia RV curves for 13 of the 19 RR Lyrae stars with high accuracy RVs available in the literature (see Sect. 4.3).
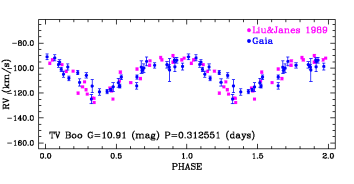
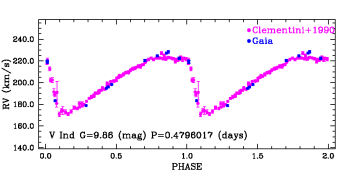
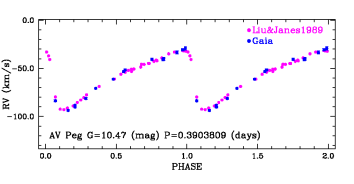
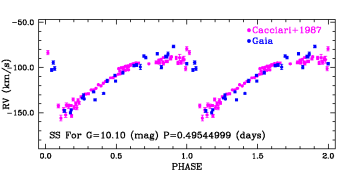
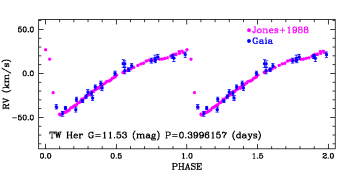
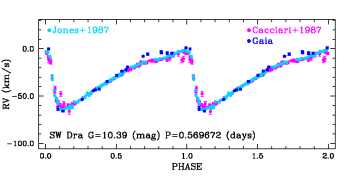
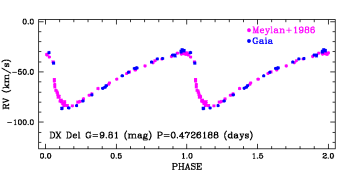
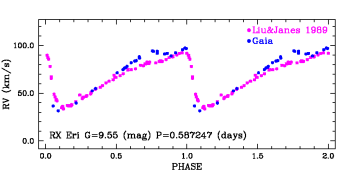
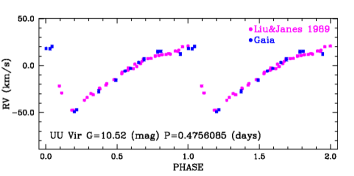
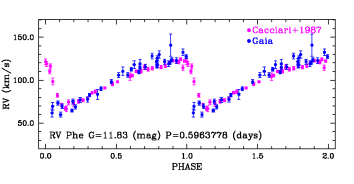
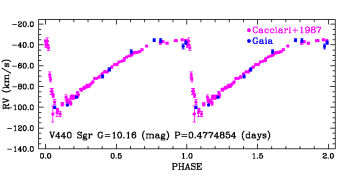
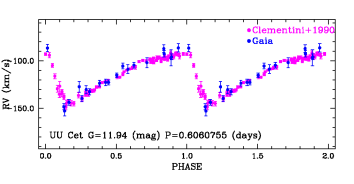
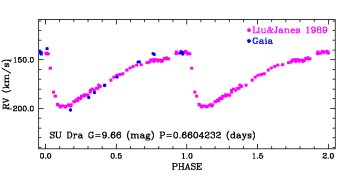
A.3 Atlas of the light and radial velocity curves for the RR Lyrae stars with RVS time series data published in DR3.
We show , , light and RV curves for a total sample of 1 100 sources for which RVS time series RVs are released in DR3. The sample includes 1 096 bona fide RR Lyrae stars and 4 sources that during validation were re-classified as different variable types. Specifically, source 53376268583351180 was re-classified as DCEP_1O (see Sect. 6.5), and the sources: 4130380472726484608, 3062985235999231104, 573418300979785817 were re-classified as ECLs (see Sect 6.9).
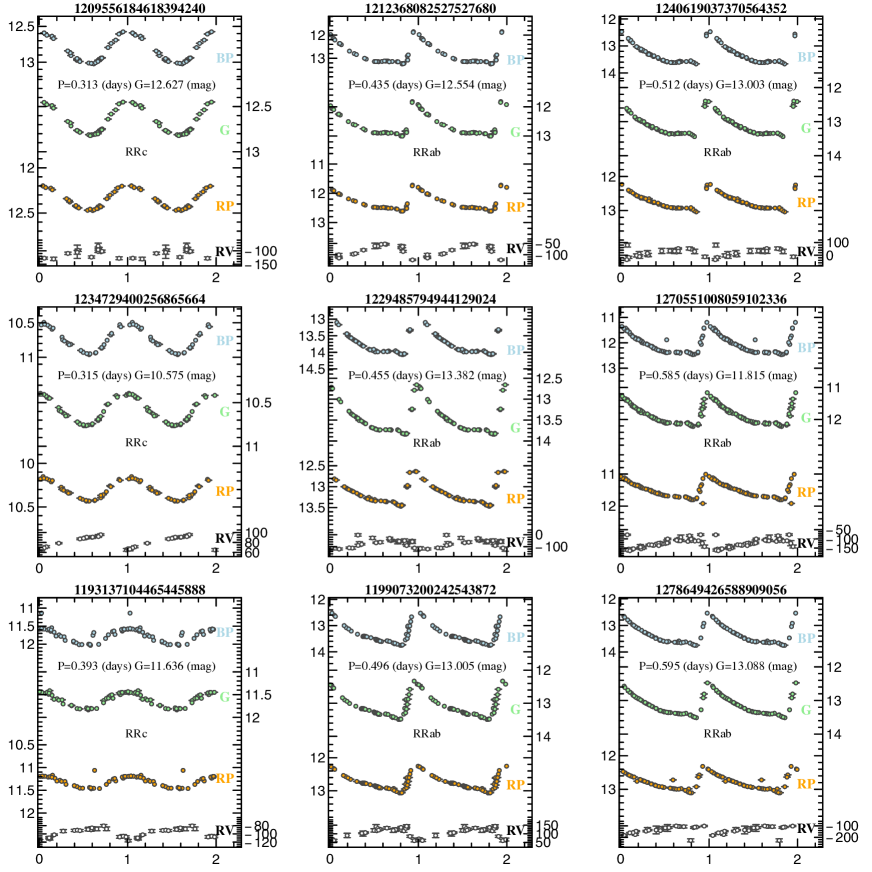
Appendix B Tests on the astrophysical parameters for RR Lyrae stars
B.1 Metallicities
In this section we present comparisons of the SOS Cep&RRL photometric metallicities with metal abundances from high resolution spectra of RR Lyrae stars in Clementini et al. (1995), Lambert et al. (1996), Pancino et al. (2015), and with the metal abundances reported in column 10 of Table 15 for the 19 RR Lyrae stars used to validate the RV curves from the RVS.
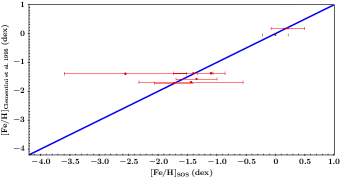
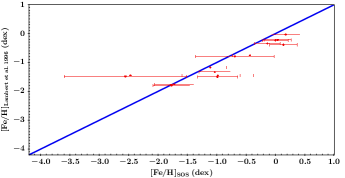
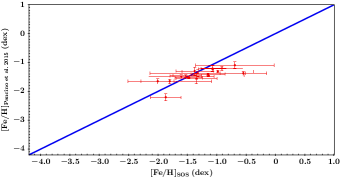
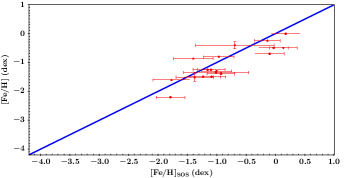
B.2 Absorption and metallicity values from the GSP_Phot module of Apsis
RR Lyrae stars have unusually large flux errors in their time-averaged spectra, compared to non-variable sources. This is because when computing the mean spectra, the amplitude of the light variation, that in the band can range from 0.2 mag for RRc to more than 1 magnitude for RRab stars, enters as an extra flux error in the computed time-averaged spectra. This is clearly shown by the comparison between the signal-to-noise ratios (median of each sample in each pixel) of the continuous spectra of a sample of 1 000 RR Lyrae stars with extracted from the vari_rrlyrae table and the continuous spectra of a comparison sample composed by 1 000 random sources again within presented in Fig. 41.
The larger flux uncertainties cause larger uncertainties in the temperatures derived for RR Lyrae stars, thus opening the room for temperature-extinction degeneracies in the GSP_Phot absorption estimates for RR Lyrae stars as well as causing large uncertainties and systematic offsets in the GSP_Phot metallicities for these variable stars.
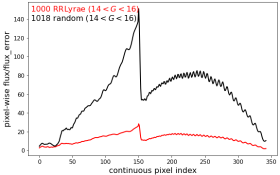
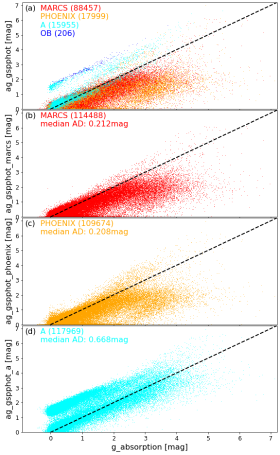
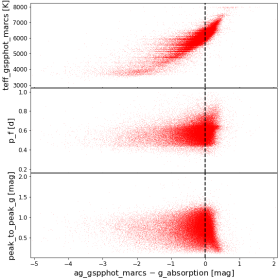
Appendix C Parameters for 14 RR Lyrae missing in the vari_rrlyrae table.
We provide in Table 16 parameters computed by the SOS Cep&RRL pipeline for 14 bona fide RR Lyrae stars that were not published in the DR3 vari_rrlyrae table (see Sect. 6.6).
| Main parameters computed by the SOS Cep&RRL pipeline | |||||||||||||
|---|---|---|---|---|---|---|---|---|---|---|---|---|---|
| Source ID | Type | E(a)a\rm(a)(a)a\rm(a)footnotemark: () | // | Amp// | (b)b\rm(b)(b)b\rm(b)footnotemark: | A()(c)c\rm(c)(c)c\rm(c)footnotemark: | |||||||
| [Fe/H] | A() | ||||||||||||
| 4092009204924599040 | RRc | - | 0.2581538 | 1716.555440 | 15.4824/15.9069/14.866 | 0.126/0.156/0.085 | 4.806 | 0.070 | - | - | - | - | 24/22/23 |
| - | x10-7 | x10-4/0.0023/0.0033 | 0.002/0.007/0.006 | 0.232 | 0.012 | - | - | - | - | ||||
| 4120414435009794048 | RRc | - | 0.256715 | 1748.953931 | 17.317/18.136/16.401 | 0.380/0.385/0.303 | 4.687 | 0.174 | - | - | - | - | 24/12/13 |
| - | x10-6 | 0.006/0.018/0.012 | 0.019/0.040/0.019 | 0.173 | 0.042 | - | - | - | - | ||||
| 4144246349481643392 | RRab | 0.81001 | - | 1713.903329 | 17.216/18.149/16.119 | 0.225/0.251/0.200 | 4.859 | 0.281 | - | - | - | 2.827 | 25/24/23 |
| x10-5 | - | 0.003/0.026/0.018 | 0.013/0.076/0.064 | 0.130 | 0.045 | - | - | - | 0.100 | ||||
| 5797652730842515968 | RRc | - | 0.2167765 | 1700.798893 | 16.3430/16.5870/15.8778 | 0.158/0.197/0.107 | 4.511 | 0.067 | - | - | - | - | 56/53/54 |
| - | x10-7 | x10-4/0.0056/0.0030 | 0.002/0.017/0.008 | 0.182 | 0.012 | - | - | - | - | ||||
| 5797917193442176640 | RRc | - | 0.2637340 | 1701.161373 | 15.6366/15.8718/15.2366 | 0.147/0.170/0.101 | 4.707 | 0.083 | - | - | - | - | 57/48/47 |
| - | x10-7 | 0.0005/0.00196/0.00245 | 0.001/0.009/0.010 | 0.130 | 0.010 | - | - | - | - | ||||
| 5846086424210395520 | RRc | - | 0.2933843 | 1700.684493 | 16.6451/16.8922/16.2396 | 0.156/0.186/0.118 | 5.00 | 0.080 | - | - | - | - | 52/47/46 |
| - | x10-7 | 0.0008/0.0036/0.0035 | 0.002/0.011/0.010 | 0.178 | 0.015 | - | - | - | - | ||||
| 5917239841741208576 | RRab | 0.638600 | - | 1705.946735 | 16.3224/16.6628/15.8031 | 0.147/0.188/0.116 | 4.422 | 0.189 | 2.937 | 0.040 | 0.25 | 0.415 | 81/80/76 |
| 2x10⁻⁶ | - | 0.0005/0.0026/0.0024 | 0.001/0.009/0.006 | 0.050 | 0.007 | 0.229 | 0.011 | 0.344 | 0.051 | ||||
| 5991733644318583424 | RRc | - | 0.258867 | 1707.080357 | 16.444/17.10244/15.636 | 0.135/0.178/0.123 | 4.378 | 0.074 | - | - | - | - | 53/53/50 |
| - | 1x10⁻⁶ | 0.013/0.004/0.004 | 0.003/0.014/0.012 | 0.483 | 0.015 | - | - | - | - | ||||
| 6017924835910361344 | RRc | - | 0.268742 | 1708.808652 | 17.762/18.319/17.037 | 0.214/0.294/0.183 | 4.847 | 0.178 | - | - | - | - | 32/32/30 |
| - | 2x10⁻⁶ | 0.002/0.011/0.006 | 0.007/0.023/0.013 | 0.184 | 0.046 | - | - | - | - | ||||
| 6069336998880602240 | RRab | 0.73337 | - | 1699.822497 | 16.3183/16.6855/15.7082 | 0.181/0.265/0.152 | 4.516 | 0.242 | - | - | - | 0.712 | 37/35/36 |
| 5x10⁻⁶ | - | 0.0008/0.0157/0.0057 | 0.004/0.052/0.019 | 0.087 | 0.020 | - | - | - | - | ||||
| 6707009423228603904 | RRc | - | 0.306965 | 1709.373150 | 16.16385/16.3367/15.7239 | 0.154/0.138/0.245 | 4.778 | 0.048 | - | - | - | - | 27/25/26 |
| - | 1x10⁻⁶ | 0.0009/0.0155/0.0261 | 0.022/0.043/0.086 | 0.320 | 0.012 | - | - | - | - | ||||
| 5935214760885709440 | RRc | - | 0.340823 | 1706.070130 | 19.0373/20.624/17.757 | 0.158/0.819/0.113 | 5.373 | 0.193 | - | - | - | - | 40/24/27 |
| - | 4x10⁻⁶ | 0.004/0.092/0.011 | 0.018/0.301/0.044 | 0.495 | 0.065 | - | - | - | - | ||||
| 4362766825101261952 | RRc | - | 0.2631889 | 1716.317264 | 16.3937/16.9315/15.6715 | 0.140/0.153/0.115 | 4.849 | 0.0518 | - | - | - | - | 43/40/41 |
| - | 5x10⁻⁷ | 0.0008/0.0071/0.0036 | 0.002/0.027/0.011 | 0.380 | 0.019 | - | - | - | - | ||||
| 5967334102579505664 | RRab | 0.62513 | - | 1707.700232 | 18.426/19.999/17.229 | 0.130/0.372/0.124 | - | - | - | - | - | 3.429 | 37/38/37 |
| 2x10⁻⁵ | - | 0.005/0.040/0.012 | 0.013/0.310/0.059 | - | - | - | - | - | 0.090 | ||||
Appendix D OGLE-IV, ASAS-SN and CATALINA control samples
Figures 44, 45 and 46 show the footprints of RR Lyrae control samples drawn from the OGLE-IV, ASAS-SN and CATALINA catalogues, respectively, that were used to estimate the completeness (and contamination, only OGLE) of the final clean catalogue of 270 905 RR Lyrae stars that are released in DR3.
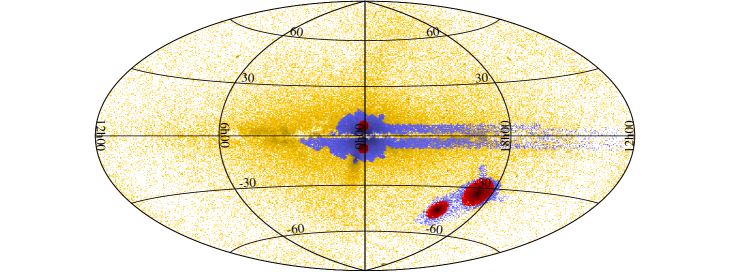
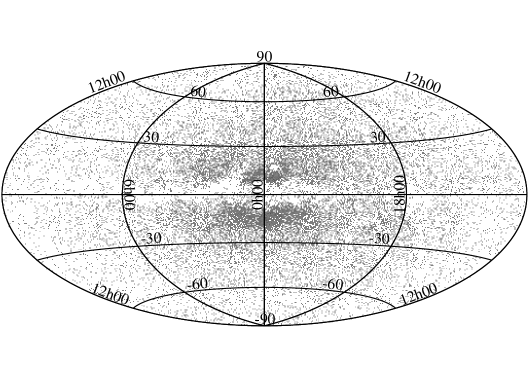
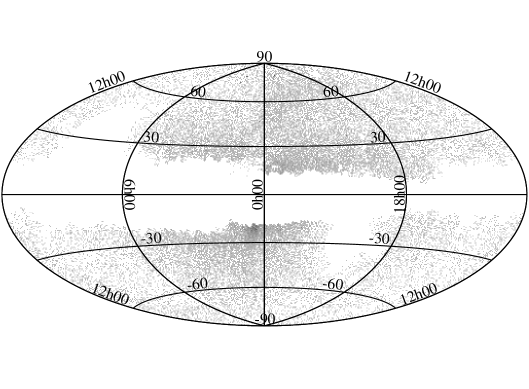
Appendix E Examples of Gaia archive queries
The names of the tables in the queries will change, this will be updated at the final submission of the paper. Also, functions might be added to the time series query to group results
Query to retrieve time series of all RR Lyrae stars confirmed by the SOS Cep&RRL pipeline in the Gaia DR3.
 select gaia.source_id, epoch_photometry_url from gaiadr3.gaia_source as gaia
      inner join gaiadr3.vari_rrlyrae as rrl on gaia.source_id=rrl.source_id
|
Query to retrieve the number of processed observations and SOS Cep&RRL-computed parameters of all RR Lyrae in the Gaia DR3.
      select rrl.*,tsr.num_selected_g_fov,tsr.num_selected_bp,tsr.num_selected_rp
           from gaiadr3.vari_rrlyrae rrl
              inner join gaiadr3.vari_time_series_statistics tsr on rrl.source_id=tsr.source_id
|
Appendix F Acronyms
| Acronym | Description |
|---|---|
| ACEP | Anomalous Cepheid |
| Absorption in the band | |
| AGN | Active Galactic Nuclei |
| All_Sky | The celestial region excluding the LMC, SMC, M31 and M33 regions |
| Amp() | Amplitude of the light variation in the band |
| Amp() | Amplitude of the light variation in the band |
| Amp() | Amplitude of the light variation in the band |
| Amp() | Amplitude of the RVS radial velocity variation |
| B-W | Baade-Wesselink |
| CMD | Colour Magnitude Diagram |
| DCEP | Classical Cepheid (Population I) |
| DPAC | Data Processing and Analysis Consortium |
| dSph | Dwarf spheroidal galaxy |
| DR | Data Release |
| EDR3 | Early Data Release 3 |
| ECL | Eclipsing binary |
| ELL | Ellipsoidal variable |
| F | Fundamental mode of pulsation |
| Fe/H | Iron abundance |
| FO or 1O | First overtone mode of pulsation |
| Gaia photometric -band | |
| Gaia photometric band | |
| Gaia photometric band | |
| Gaia photometric band | |
| GC | Globular cluster |
| LMC | Large Magellanic Cloud |
| LZ | Luminosity–Metallicity |
| M31 | Andromeda galaxy |
| M33 | Triangulum galaxy |
| MAD | Median Absolute Deviation |
| M | Absolute G magnitude |
| M/H | Total metal abundance |
| MORO | MultibandOutlierRemovalOperator |
| MW | Milky Way |
| PA | Period–Amplitude |
| Paper I | Clementini et al. (2016) |
| Paper II | Clementini et al. (2019) |
| PL | Period–Luminosity |
| PLZ | Period–Luminosity–Metallicity |
| PW | Period–Wesenheit |
| QSO | Quasi Stellar Object |
| ROFABO | RemoveOutliersFaintAndBrightOperator |
| RRab | RR Lyrae star of ab type |
| RRc | RR Lyrae star of c type |
| RRd | double-mode RR Lyrae star |
| RV | Radial Velocity |
| RVS | Radial Velocity Spectrometer |
| SEAPipe | Source Environment Analysis Pipeline |
| SMC | Small Magellanic Cloud |
| SOS | Specific Object Study |
| T2CEP | Type II Cepheid (Population II) |
| UFD | Ultra-faint dwarf galaxy |