An Unsupervised Deep-Learning Method for Bone Age Assessment
Abstract
The bone age, reflecting the degree of development of the bones, can be used to predict the adult height and detect endocrine diseases of children. Both examinations of radiologists and variability of operators have a significant impact on bone age assessment. To decrease human intervention , machine learning algorithms are used to assess the bone age automatically. However, conventional supervised deep-learning methods need pre-labeled data. In this paper, based on the convolutional auto-encoder with constraints (CCAE), an unsupervised deep-learning model proposed in the classification of the fingerprint, we propose this model for the classification of the bone age and baptize it BA-CCAE. In the proposed BA-CCAE model, the key regions of the raw X-ray images of the bone age are encoded, yielding the latent vectors. The K-means clustering algorithm is used to obtain the final classifications by grouping the latent vectors of the bone images. A set of experiments on the Radiological Society of North America pediatric bone age dataset (RSNA) show that the accuracy of classifications at -month intervals is . Although the accuracy now is lower than most of the existing supervised models, the proposed BA-CCAE model can establish the classification of bone age without any pre-labeled data, and to the best of our knowledge, the proposed BA-CCAE is one of the few trails using the unsupervised deep-learning method for the bone age assessment.
1 Introduction
Bone age is a scale for assessing developmental maturity and detecting the extent of skeletal development. It offers vital information in many areas, such as selecting artistic talents [1] and the forensic determination of the age of a specific individual as a basis for a conviction [2]. Usually, the X-rays of the left hand can better reflect the growth, development level, and maturity of an individual [3].
There are many conventional methods including the counting method [4], the Greulich and Pyle (GP) atlas method [5], the Tanner-Whitehouse (TW) method [6], and etc. The counting method evaluates bone age by counting the numbers of the ossification center [4]. The GP atlas method compares the X-ray Images of the bone with the standard bone to obtain the bone age [5]. The TW method is based on the comparison between the specific target bone and the score table to obtain the bone age [7]. The conventional methods vary from each other due to the differences in races and regions [8]. For example, in China, the Chinese Carpal Bone Development Standard-CHN Method method [9] is developed based on the TW method, where the main changes are removing the ulna bones and adding the cephalic and uncinate bones.
Beyond the conventional method, supervised machine learning methods, including deep-learning method, are used in the bone age assessment. In those approaches, pre-labeled X-ray Images are required for the training set. They are used to train the algorithms and then the trained models are utilized to gain the bone ages from X-ray Images of the test set. In the classification tasks, the model gives an interval of the bone age, say from th to th months, and the accuracy (ACC) is used to evaluate the performance of the model. In the regression task, the mean absolute error (MAE) is used. For example, three supervised models, C19-SVM, C19-Res, and C19-ST-Res, are used to categorize the bone age. The experiments on DICOM data (the training set contrains images and the validation set contains images) collected by the orthopedic picture archive and communication system (PACS) of Shengjing Hospital of China Medical University show that the top1 matching accuracies are , , and [10] respectively. A deep convolutional neural network (CNN) based on fine-grained image classification for automatic bone age assessment is proposed in Ref. [11] and achieves an accuracy of for males and for females, and the MAE are and months for males and females, respectively. By using the convolutional neural network (CNN), Ref. [12] reports the MAE of the bone age assessment months with the whole hand, and months with the index finger. In , Chen Chao et al. propose an attention-guided approach to automatically localize the discriminative regions for bone age assessment achieving the MAE months [13]. In , Zhang Y et al. extracted skeletal features based on the inception V neural network, and use the adversarial regression learning network (ARLNet) to obtain an MAE of months [14]. Currently, there is a system for bone age assessment based on the CHN method achieving an accuracy of on the Chinese children data set [15].
In this paper, instead of the supervised deep-learning method, we proposed an unsupervised deep-learning method for the bone age assessment. The main method is based on the previous work [16], where a convolutional auto-encoder with constraints (CCAE), an unsupervised deep-learning model, is proposed in the classification of the fingerprint. The propose unsupervised deep-learning model for the classification of the bone age is named BA-CCAE for short. In this approach, each key regions of the raw X-ray images of the bone age are encoded by a specified CCAE, yielding a collection of the latent vectors. And then the K-means clustering algorithm is used to obtain the final classifications by grouping the latent vectors of the bone images. A set of experiments on the Radiological Society of North America pediatric bone age dataset (RSNA) show that the accuracy of classifications at -month intervals is . It suggests that the BA-CCAE is more accurate than CCAE in bone age classification. Although the accuracy now is lower than most of the existing supervised models, the proposed BA-CCAE model can establish the classification of bone age without any pre-labeled data.
2 The Dataset and Data Preprocessing
In this section, we give an introduction of the dataset and the data preprocessing. The data preprocessing is important for the proposed method.
2.1 The Dataset: the Data Selection and the Classification
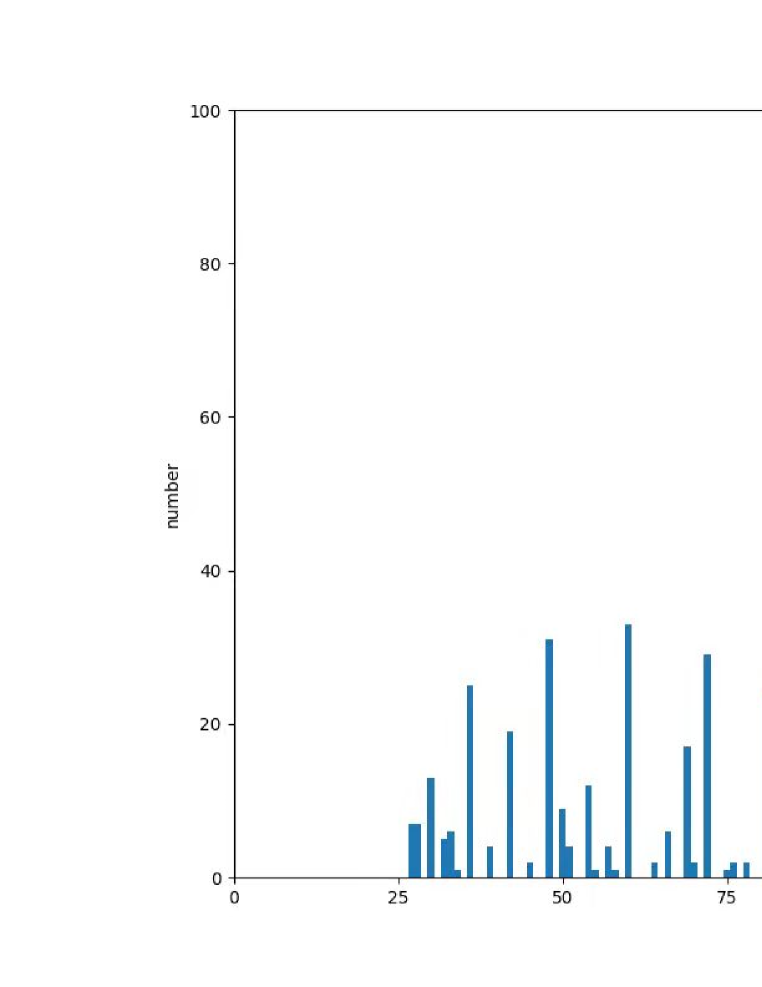
Given that in the existing supervised machine learning methods of bone age assessment, the test sets are usually consisted of about subsamples. For example, the test sets in Refs. [12, 13, 14, 15] are with sizes , , , and respectively. In this work, without loss of generality, we use only a portion of the bone age data selected from the RSNA in order to show the effectiveness of the proposed unsupervised deep-learning method. As a result, X-ray Images of the bone ranging from months to months are selected. Here, the task of bone age assessment is converted into a classification task. We take months as an interval yielding a dataset with labels. For example, the first classes consisting of bones with bone age whithn th to th months. An overview of the selected data is given in Fig. (1) where the distribution of the bone age is given. The data is available at RSNA Pediatric Bone Age Challenge (2017).
2.2 The Data Preprocessing: the Clipping of Key Regions and Other Treatments
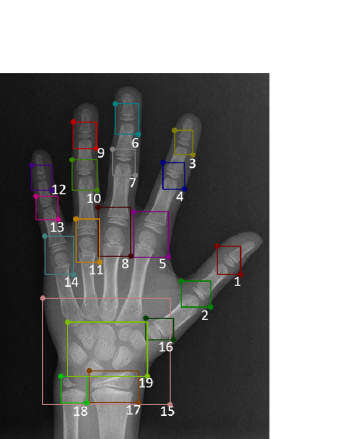
The main ideal of the proposed BA-CCAE is to encode each key regions by an independent CCAE. In this section, we manually crop out the key regions of the X-ray Images. In the following section, selected key regions are encoded by the CCAE, in order to establish the classification automatically. As shown in Fig. (2), the key regions are joints and are labeled by index from to . For example, the joint of thumb is labeled by and the carpal bone position without background is labeled by . The clipping will be replaced by machine learning method in the following research.
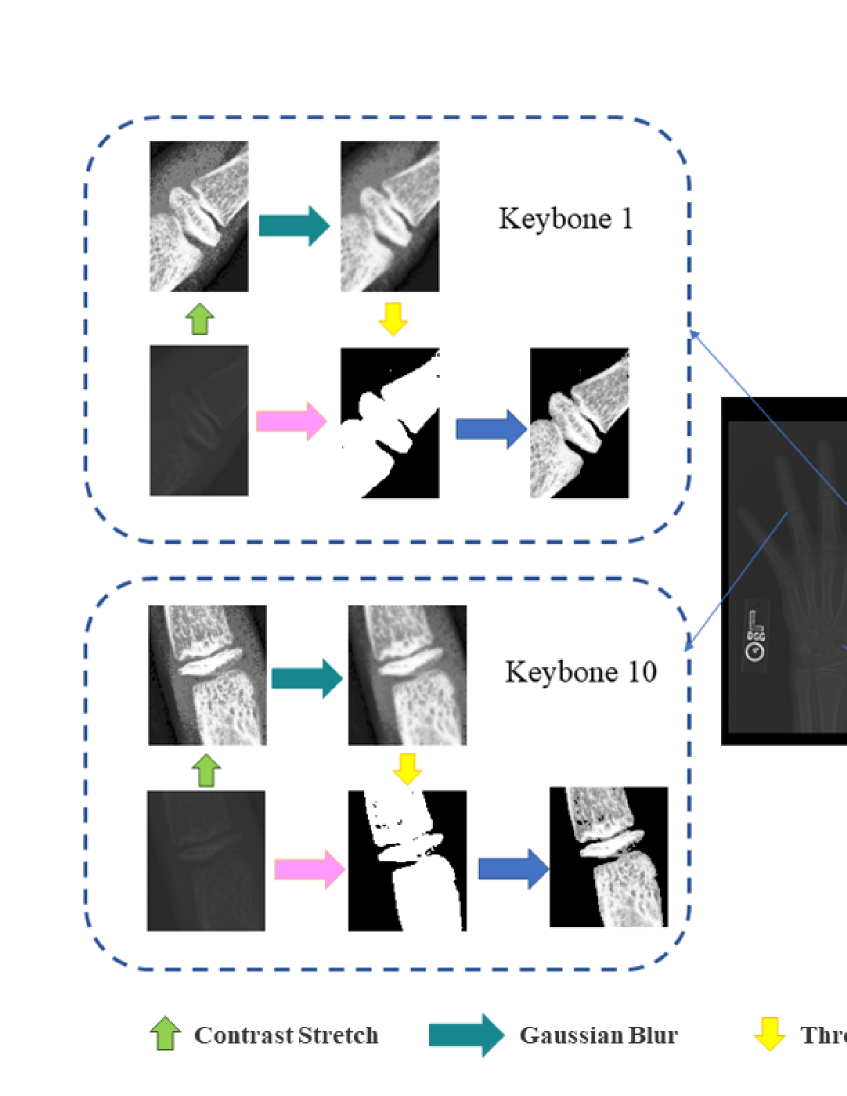
Then, the preprocess of contrast equalization, Gaussian blurring, and adaptive threshold segmentation are applied, in order to obtain data with high quality. In the contrast equalization, the histogram equalization [17] is applied where an nonlinear transformation is used to transform the distribution of pixels into an uniform distribution. The purpose of Gaussian blurring is to reduce the noise [18]. Finally, adaptive threshold segmentation transforms the X-ray Images into a binarized image, in order to separate the bones from the background. It shows in Fig. (3) that the interference from background and annotation information is effectively eliminated.
3 The Main Method
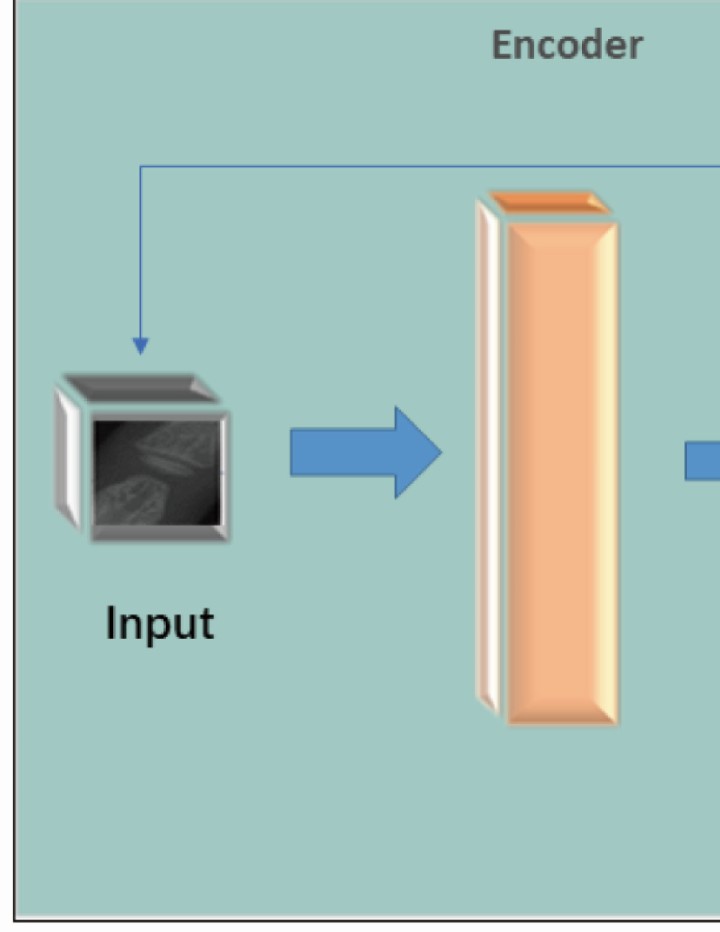
In this section, we introduce the proposed BA-CCAE model. It is based on the CCAE proposed in the previous work [16]. The CCAE is an effective model that can extract key features from a given images and compress the dimension of the raw images by giving the encoded vectors, as shown in Fig. (4). In the CCAE, an L2 constraint of the latent vector is added to the mean square error function between the decoded and raw images giving the final loss function. More details of the CCAE can be found in the previous work [16].
The main ideal of the BA-CCAE is to learn the key features of key regions independently by using CCAE with different hyper parameters to encode selected images of key regions. In the BA-CCAE model, each CCAEs have the convolutional layers with kernel size . Due to the different image sizes, such as images of the knuckles and carpal bones, the hyper parameters of each CCAEs are differently chosen to fit the X-ray Images of the bone. As shown in Fig. (5), selected key regions are encoded by independent CCAEs resulting in a collection of encoded latent vectors.
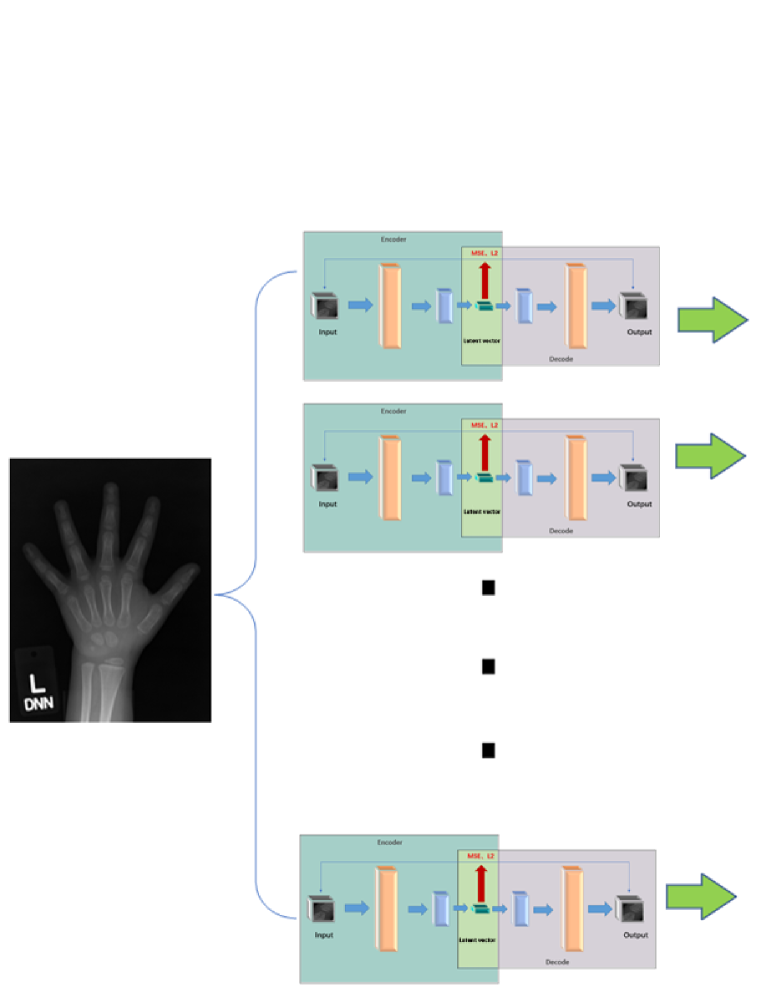
Finally, the K-means algorithm [19] is used to obtain the final cluster, or classification, based on the encoded latent vectors.
4 Results and Analyses
In this section, the results and the analyses of the BA-CCAE is given.
4.1 Results: the Accuracies
By using the combination of key regions with index , , , , , , and , the K-means gives best classification accuracy at interval months. In this approach, the K-means are used to group the samples into groups. In each group, we count the distribution of real labels and obtain the the dominated label. The dominated label is chosen to be the label given by the proposed method. As a result, an overall accuracy of on the samples taking months as interval is obtained. The detail of the clustering result is given in Tab. (1)
| Group | th to | Dominated | Accuracy | |||
|---|---|---|---|---|---|---|
| labels | th months | 119 | 167 | 216 | label | |
| Overall accuracy |
Here, we use a t-SNE visualization graph [20], an effective method that maps the high dimensional data into a two-dimensional plain and can provide a clear view of the clustering result, to show the result of the BA-CCAE, as shown in Fig. (6).
4.2 Analyses: the Contribution of Different Key Region
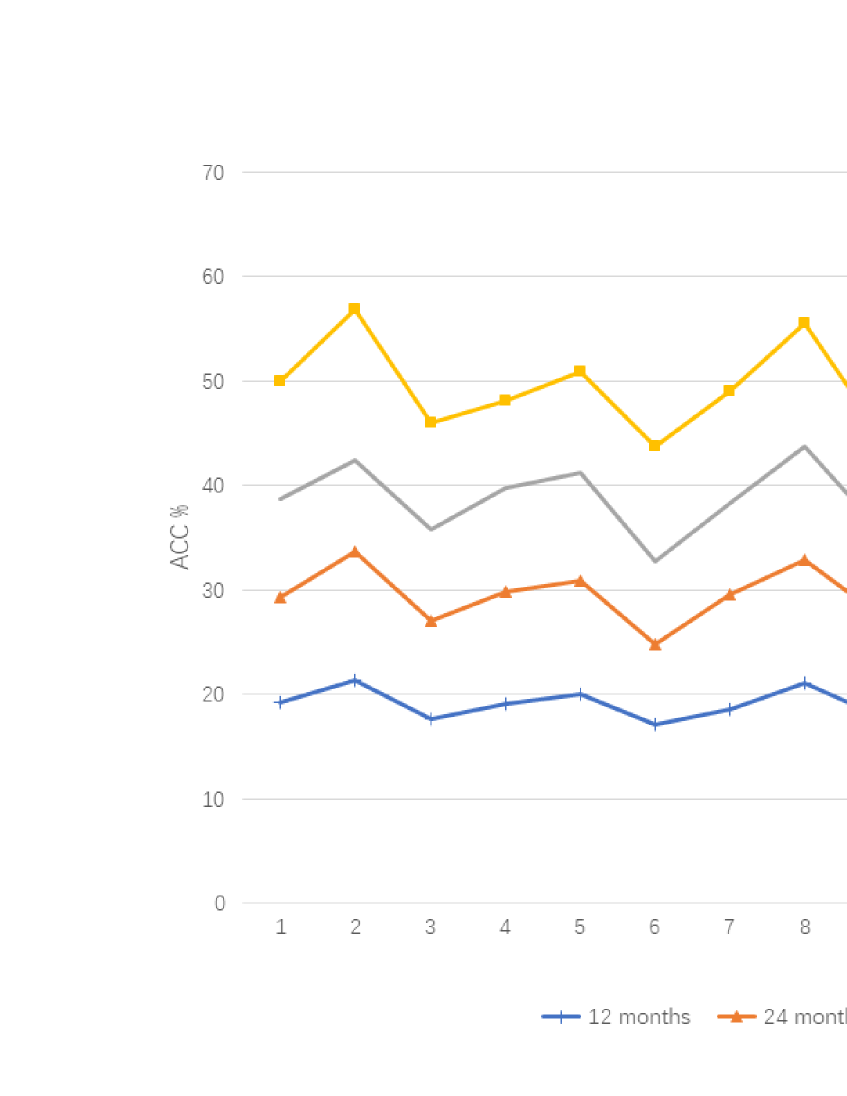
We manually crop out key regions from the raw X-ray Images. And it shows that the best result, the accuracy is , is the combination of key regions indexed by , , , , , , and . In this section, the contribution of each key region is evaluated by showing the accuracy of result of using only one key region. The result is shown in Fig. (7), where an line chart showing the accuracies using different key regions and different intervals. The highest accuracy of is of key region indexed by and the positions of key regions indexed by , , , , , give local peaks. This explains the combination of key regions indexed by , , , , , , and is the optimal choice of the key regions.
4.3 Analyses: the Different Combinations of Key Regions
In this section, we give the result of the BA-CCAE by using different combination of the key regions. Among those combinations, some are chosen according to the literature. For example, the key region indexed by in the left hand X-ray Images is proved to be effective [21], and the key regions from a single finger is also proved to be effective [12]. The results are shown in Tab. (2).
4.4 Analyses: the Influence of Target Group Numbers of the K-means
In this section, we give the result of the BA-CCAE with different target group numbers in the K-means algorithm. The results are shown in Tab. (3) where the target group numbers of , , , , , and are considered. The ACC and the MAE are given to evaluate the influence of target group numbers. It shows that the larger the number of clusters, the higher accuracy rate. However, to cluster the bones into more groups will not help the doctors in bone age assessment. Because the doctor needs to check more groups of data. Therefore, we chose the target group numbers .
| Number of cluster classes | -group | -group | -group | -group | -group | -group |
|---|---|---|---|---|---|---|
| month ACC | ||||||
| month MAE |
4.5 Analyses: Comparison between the Variational Auto-Encoder (VAE) and the BA-CCAE
The CCAE is an variation of auto-encoder (AE). The VAE is another variation of the AE and is an important generative model [22]. In this section, we give a comparison between the variational auto-encoder (VAE) and the BA-CCAE. The VAE model The results are shown in Tab. (4). It shows that the BA-CCAE out performs the VAE.
| Key bone | VAE ACC | BA-CCAE ACC | Key bone | VAE ACC | BA-CCAE ACC |
|---|---|---|---|---|---|
| % | |||||
4.6 The Result of the BA-CCAE on Dataset with Different Sizes
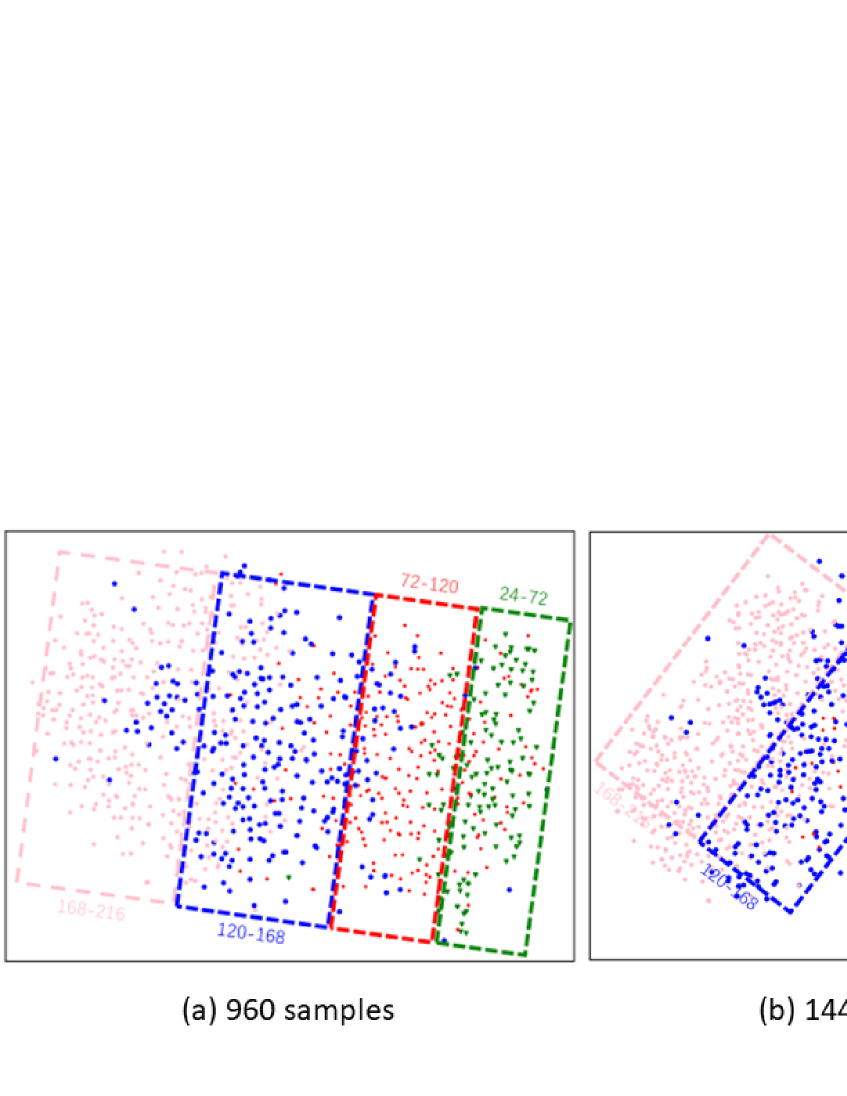
In this section, we give the result of the BA-CCAE on dataset with sizes and , in order to verify the robustness of the model. It shows in Fig. (8) that all the accuracies increase with the target group numbers.
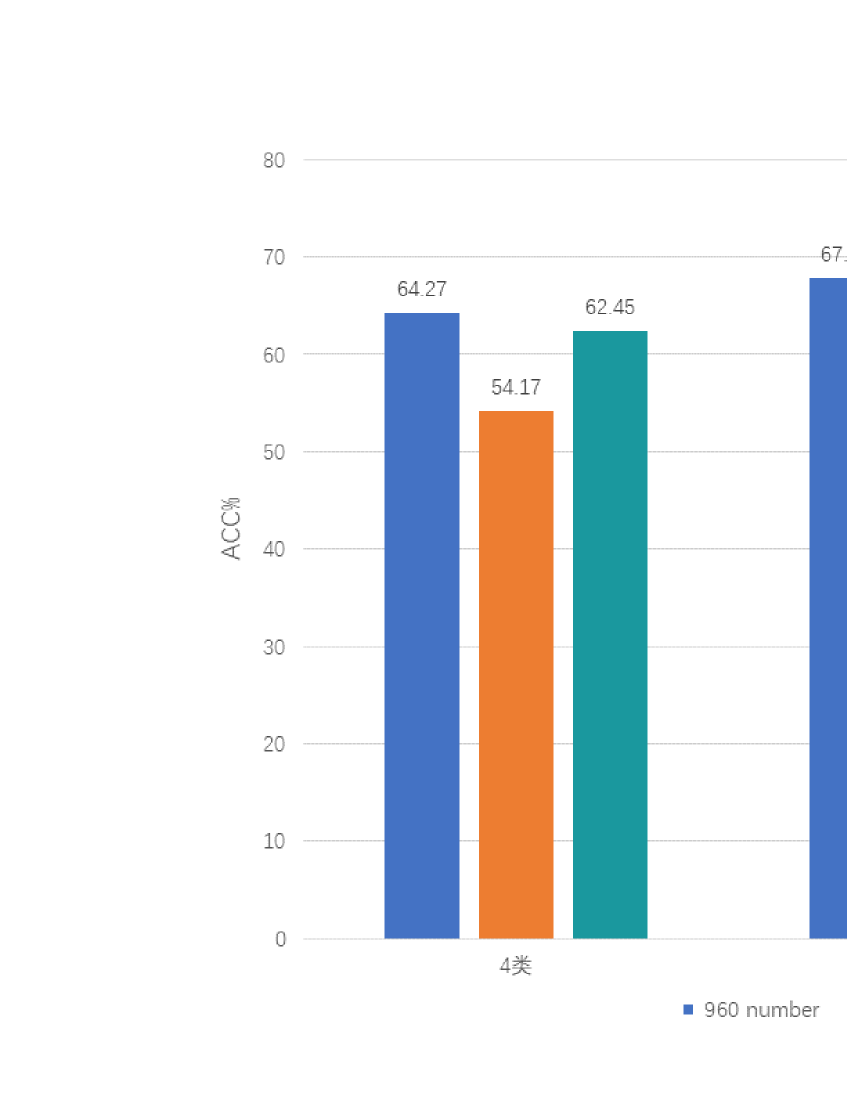
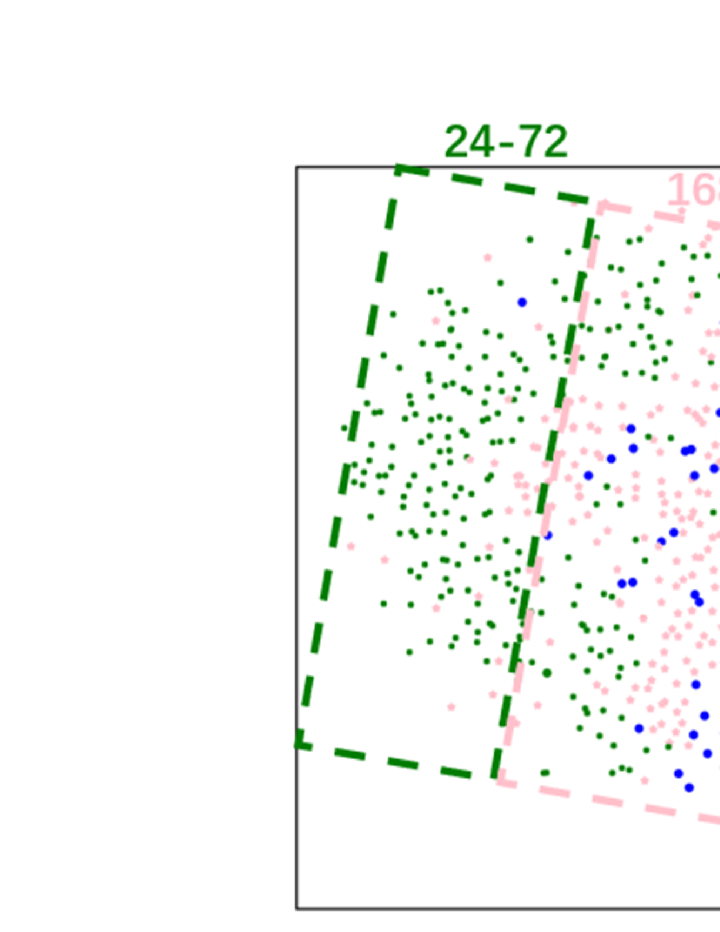
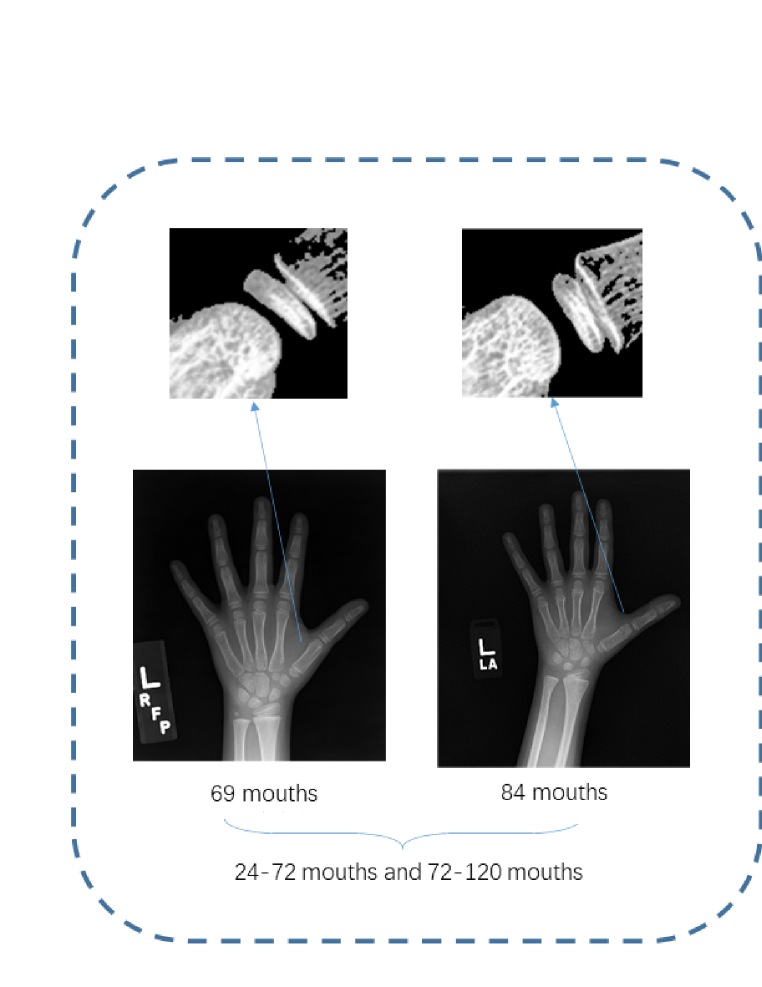
However at target group numbers , the accuracies decrease with the data sizes. To show the reason, the t-SNE visualization graphs with different data sizes are given in Fig. (9). It shows that as the data sizes increase, the boundary between different classes becomes blurred. By searching and analyzing the original bone age data that fail to cluster, it is found that the bone age data onto different months has similar key bone features, as shown in Fig. (10). The results show that the some bone age images are highly similar, and it is difficult to distinguish it by manual observation.
5 Conclusion and Discussions
In this paper, instead of the supervised machine learning method, we propose an unsupervised deep-learning method, the BA-CCAE model, for the bone age assessment. The result on samples selected from the RSNA dataset show that the combination of the key regions indexed by , , , , , , and gives the accuracy of with the target cluster number .
Although the proposed unsupervised method gives classification accuracy lower than those existing supervised method, it needs no pre-labeled data as the training set. To the best of our knowledge, this work is one of the few trials using of the unsupervised method for the bone age assessment. In the following research, we will development the unsupervised method.
6 Acknowledgments
We are very indebted to Prof. Wu-Sheng Dai for his enlightenment and encouragement. We are very indebted to Profs. Guan-Wen Fang and Yong Xie for his encouragement. This work is supported by National Natural Science Funds of China (Grant No. 62106033), Yunnan Youth Basic Research Projects (202001AU070020), and Doctoral Programs of Dali University (KYBS201910).
References
- [1] Z. Mao, G. Xu, and T. Song, Application of skeletal age based on x-ray in selecting sports talents, in 2012 International Workshop on Image Processing and Optical Engineering, vol. 8335, p. 833507, International Society for Optics and Photonics, 2011.
- [2] S. Raja, B. Stuart, P. Thomas, and C. O’Brien, Pyrolysis gas chromatography-mass spectrometry analysis for the estimation of pig bone age for forensic application, Acta Medicinae Legalis et Socialis (2010).
- [3] V. Gilsanz and O. Ratib, Hand bone age: a digital atlas of skeletal maturity. Springer, 2005.
- [4] E. Vogt and V. S. Vickers, Osseous growth and development, Radiology 31 (1938), no. 4 441–444.
- [5] M. Anderson, Use of the greulich-pyle “atlas of skeletal development of the hand and wrist” in a clinical context, American Journal of Physical Anthropology 35 (1971), no. 3 347–351.
- [6] R. M. Malina and G. P. Beunen, Assessment of skeletal maturity and prediction of adult height (tw3 method), 2002.
- [7] A. M. Mughal, N. Hassan, and A. Ahmed, Bone age assessment methods: a critical review, Pakistan journal of medical sciences 30 (2014), no. 1 211.
- [8] F. Ontell, M. Ivanovic, D. S. Ablin, and T. Barlow, Bone age in children of diverse ethnicity., AJR. American journal of roentgenology 167 (1996), no. 6 1395–1398.
- [9] S.-Y. Zhang, L.-J. Liu, Z.-L. Wu, G. Liu, Z.-G. Ma, X.-Z. Shen, and R.-L. Xu, Standards of tw3 skeletal maturity for chinese children, Annals of human biology 35 (2008), no. 3 349–354.
- [10] X. Chen, J. Li, Y. Zhang, Y. Lu, and S. Liu, Automatic feature extraction in x-ray image based on deep learning approach for determination of bone age, Future Generation Computer Systems 110 (2020) 795–801.
- [11] K. Li, J. Zhang, Y. Sun, X. Huang, C. Sun, Q. Xie, and S. Cong, Automatic bone age assessment of adolescents based on weakly-supervised deep convolutional neural networks, IEEE Access 9 (2021) 120078–120087.
- [12] N. E. Reddy, J. C. Rayan, A. V. Annapragada, N. F. Mahmood, A. E. Scheslinger, W. Zhang, and J. H. Kan, Bone age determination using only the index finger: a novel approach using a convolutional neural network compared with human radiologists, Pediatric radiology 50 (2020), no. 4 516–523.
- [13] C. Chen, Z. Chen, X. Jin, L. Li, W. F. Speier, and C. Arnold, Attention-guided discriminative region localization and label distribution learning for bone age assessment, IEEE Journal of Biomedical and Health Informatics (2021).
- [14] Y. Zhang and B. D. Davison, Adversarial regression learning for bone age estimation, in International Conference on Information Processing in Medical Imaging, pp. 742–754, Springer, 2021.
- [15] C. Yin, M. Zhang, C. Wang, H. Lin, G. Li, L. Zhu, W. Fei, and X. Wang, Computerized bone age estimation system based on china-05 standard, Advances in nano research 12 (2022), no. 2 197–212.
- [16] Y.-J. Hou, Z.-X. Xie, C.-C. Zhou, et al., An unsupervised deep-learning method for fingerprint classification: the ccae network and the hybrid clustering strategy, arXiv preprint arXiv:2109.05526 (2021).
- [17] S. M. Pizer, E. P. Amburn, J. D. Austin, R. Cromartie, A. Geselowitz, T. Greer, B. ter Haar Romeny, J. B. Zimmerman, and K. Zuiderveld, Adaptive histogram equalization and its variations, Computer vision, graphics, and image processing 39 (1987), no. 3 355–368.
- [18] J. Li, F. Xue, and T. Blu, Gaussian blur estimation for photon-limited images, in 2017 IEEE International Conference on Image Processing (ICIP), pp. 495–499, IEEE, 2017.
- [19] J. MacQueen et al., Some methods for classification and analysis of multivariate observations, in Proceedings of the fifth Berkeley symposium on mathematical statistics and probability, vol. 1, pp. 281–297, Oakland, CA, USA, 1967.
- [20] G. E. Hinton and S. Roweis, Stochastic neighbor embedding, Advances in neural information processing systems 15 (2002).
- [21] M.-Q. LIU, Bone age assessment model based on multi-dimensional feature fusion using deep learning, Academic journal of second military medical university (2018) 909–916.
- [22] D. P. Kingma and M. Welling, Auto-encoding variational bayes, arXiv preprint arXiv:1312.6114 (2013).