Spectral analysis of ultra-cool white dwarfs polluted by planetary debris
Abstract
We identify two ultra-cool ( K) metal-polluted (DZ) white dwarfs WD J21474035 and WD J19220233 as the coolest and second coolest DZ stars known to date with K and K, respectively. Strong atmospheric collision-induced absorption (CIA) causes the suppression of red optical and infra-red flux in WD J19220233, resulting in an unusually blue colour given its low temperature. WD J21474035 has moderate infra-red CIA yet has the reddest optical colours known for a DZ white dwarf. Microphysics improvements to the non-ideal effects and CIA opacities in our model atmosphere code yields reasonable solutions to observations of these ultra-cool stars. WD J21474035 has a cooling age of over 10 Gyr which is the largest known for a DZ white dwarf, whereas WD J19220233 is slightly younger with a cooling age of 9 Gyr. Galactic kinematics calculations from precise Gaia EDR3 astrometry reveal these ultra-cool DZ stars as likely members of the Galactic disc thus they could be pivotal objects in future studies constraining an upper age limit for the disc of the Milky Way. We present intermediate-resolution spectroscopy for both objects, which provides the first spectroscopic observations of WD J21474035. Detections of sodium and potassium are made in both white dwarfs, in addition to calcium in WD J19220233 and lithium in WD J21474035. We identify the magnetic nature of WD J21474035 from Zeeman splitting in the lithium line and also make a tentative detection of carbon, so we classify this star as DZQH. WD J19220233 likely accreted planetary crust debris, while the debris composition that polluted WD J21474035 remains unconstrained.
keywords:
white dwarfs – stars: atmospheres – stars: abundances – methods: data analysis – methods: analytical1 Introduction
Over 97 per cent of main-sequence stars ( 8) in the Milky Way galaxy will end their stellar evolution as white dwarfs, making these the most common type of stellar remnant. Typical white dwarfs consist of a dense carbon-oxygen (C/O) degenerate core of comparable radius to the Earth, surrounded by a thin envelope of residual hydrogen and helium left over from the progenitor’s post-main-sequence evolution. The degenerate core creates an efficient environment for electron conduction which makes it almost isothermal.
Throughout their lives, white dwarfs slowly cool by radiating their residual internal thermal energy away through their thin non-degenerate envelopes (Mestel, 1952; Althaus et al., 2010). Thus the coolest white dwarfs, with ultra-cool effective temperatures () K, tend to have the largest cooling ages depending on their atmospheric composition and radius (mass). Studying white dwarfs within the Milky Way allows us to calibrate stellar ages (Fouesneau et al., 2019; Rebassa-Mansergas et al., 2021) and probe the formation and evolution of the Galactic neighbourhood (Winget et al., 1987; Rowell, 2013; Tremblay et al., 2014; Kilic et al., 2017; Fantin et al., 2019; Fantin et al., 2020), with the analysis of cool remnants being particularly important as these provide constraints on its oldest stars (Bergeron et al., 1997; Gianninas et al., 2015; Lam et al., 2020).
Spectroscopy reveals the atmospheric composition of white dwarfs and allows us to separate them into spectral types. White dwarfs should only have hydrogen or helium present in their atmospheres due to high surface gravities () and fast diffusion timescales causing heavy elements to sink below the photosphere (Paquette et al., 1986; Koester, 2009), yet metals are found to pollute 25 – 50 per cent of all white dwarfs (Zuckerman et al., 2003, 2010; Koester et al., 2014). It is now well established that these metals contaminate white dwarfs through the accretion of tidally disrupted rocky bodies which survived the final evolutionary stages of its host star (Graham et al., 1990; Jura, 2003; Farihi et al., 2010; Gänsicke et al., 2012; Veras et al., 2014; Cunningham et al., 2022).
White dwarfs with K generally have featureless spectra as they are too cool to display hydrogen or helium absorption lines (DC spectral type), but can show strong metal lines (DZ spectral type) if polluted by planetary debris (Sion et al., 1983). The metal lines in these cool DZ white dwarfs can provide invaluable information on the physical conditions present in these dense, cool atmospheres in a way that is not possible with their featureless DC counterparts (Blouin et al., 2019a). However, the extreme high density () in the atmosphere of these remnants affects their observed photometry and spectroscopy which complicates assessments of their , mass and age.
The atmospheric collision induced absorption (CIA) of H2-H2, H2-He, H-He, H2-H and He-He-He in cool white dwarfs can greatly alter their spectral energy distributions (SEDs), leading them to display optical and near-infrared (NIR) colours that can be much bluer than a blackbody (Bergeron et al., 1994; Hansen, 1998; Blouin et al., 2017). CIA opacities and the treatment of charged and neutral particle interactions must therefore be carefully considered within cool white dwarf model atmosphere codes. As the physics of these extreme conditions is not yet fully understood, uncertainties remain on mass and age estimates (Bergeron & Leggett, 2002; Gianninas et al., 2015; Kilic et al., 2020; Hollands et al., 2021; Kaiser et al., 2021; Bergeron et al., 2022). Regardless of , white dwarfs with strong CIA opacity are designated as infrared-faint (IR-faint; Kilic et al., 2020).
The spacecraft Gaia (Gaia Collaboration et al., 2016) measures the precise astrometric and photometric quantities of stars in the Milky Way and has allowed the recent identification of more than 300 000 new white dwarf candidates (Gentile Fusillo et al., 2019, 2021). Spectroscopic follow-ups (Tremblay et al., 2020; Kaiser et al., 2021) have revealed several new cool DZ stars, which led to the first detections of lithium and potassium in the atmosphere of white dwarfs and different propositions to explain the intriguingly high abundances of these elements compared to calcium and sodium, including the accretion of planetary crusts and lithium-enhanced primordial gas (Hollands et al., 2021; Kaiser et al., 2021). Distinguishing between these two scenarios now requires an enlarged sample of cool DZ white dwarfs as well as a more accurate characterisation of their ages.
This work focuses on spectroscopic observations and analysis of two ultra-cool DZ white dwarfs WD J214756.59403527.79 (hereafter WD J21474035) and WD J192206.20023313.29 (hereafter WD J19220233). These were first identified as white dwarf candidates from Gaia (Gentile Fusillo et al., 2019, 2021). Apps et al. (2021) re-identified WD J21474035 as a nearby star with unusual colours and speculated that it is an extremely cool white dwarf. WD J19220233 was previously confirmed as a DZ in Tremblay et al. (2020) while WD J21474035 is spectroscopically identified as a DZQH in this work – we broadly refer to this star as a member of the DZ class throughout this paper.
In Section 2, we present spectroscopic and photometric observations of WD J21474035 and WD J19220233. These are put into the context of a sample of Gaia white dwarfs within 100 pc, including a subsample of DZ white dwarfs with K, in Section 3. We describe the microphysics improvements to our model atmospheres which allow us to derive the , , mass, cooling age and chemical abundances of WD J21474035 and WD J19220233 in Sections 4–6. In Section 7 we discuss our results and conclude in Section 8.
2 Observations
| RA | Dec | Distance | ||||||||
|---|---|---|---|---|---|---|---|---|---|---|
| (mas) | (pc) | (mas yr-1) | (mas yr-1) | (km s-1) | (km s-1) | (km s-1) | (km s-1) | |||
| WD J21474035 | 21:47:56.59 | 40:35:27.78 | 35.79 0.49 | 27.94 0.38 | 84.11 0.42 | 112.39 0.42 | 18.59 0.26 | 9.80 | 13.65 | 7.96 |
| WD J19220233 | 19:22:06.20 | +02:33:13.29 | 25.36 0.27 | 39.43 0.41 | 69.66 0.25 | 29.16 0.24 | 14.11 0.15 | 1.83 | 0.07 | 14.00 |
| WD J18241213 | 18:24:58.44 | +12:13:06.82 | 25.00 0.18 | 40.00 0.29 | 280.11 0.18 | 1078.43 0.17 | 211.27 1.54 | 141.95 | 151.35 | 39.74 |
| WD J13306435 | 13:30:01.16 | +64:35:23.71 | 11.52 0.78 | 86.79 5.51 | 110.63 1.51 | 23.30 1.38 | 46.51 3.02 | 30.45 | 32.86 | 12.51 |
| WD J16440449 | 16:44:17.01 | 04:49:47.71 | 12.65 0.87 | 79.07 5.07 | 80.58 0.95 | 45.40 0.75 | 34.67 2.25 | 13.98 | 5.44 | 31.25 |
| WD J23562054 | 23:56:44.76 | 20:54:53.77 | 15.28 0.58 | 65.46 2.50 | 295.49 0.57 | 239.37 0.42 | 118.01 4.33 | 114.85 | 24.96 | 10.58 |
| WD J23171830 | 23:17:26.73 | +18:30:52.75 | 26.40 0.31 | 37.89 0.44 | 33.85 0.32 | 452.81 0.26 | 81.55 0.94 | 45.36 | 40.84 | 54.08 |
| WD J12140234 | 12:14:56.38 | 02:34:02.83 | 26.26 0.12 | 38.09 0.17 | 358.65 0.14 | 419.28 0.09 | 99.61 0.44 | 92.41 | 24.09 | 28.33 |
The Gaia Early Data Release 3 (EDR3; Gaia Collaboration et al., 2021) astrometry of WD J21474035 and WD J19220233 is given in Table 1. We have corrected the parallax values for all objects to account for the zero point offset following Lindegren et al. (2021).
Tremblay et al. (2020) conducted the first spectroscopic observations of WD J19220233 with the Gran Telescopio Canarias (GTC) Optical System for Imaging and low-Intermediate-Resolution Integrated Spectroscopy (OSIRIS; Cepa et al., 2000, 2003) spectrograph. Tremblay et al. (2020) speculated that WD J19220233 is the first detected ultra-cool DZ white dwarf that exhibits strong optical CIA111Blouin et al. (2018b) have previously identified a cool DZ white dwarf SDSS J0804+2239 with strong near-IR CIA.. Given the limited wavelength coverage of the observations, the sodium D-line was the only line detected. The first spectroscopic observations of WD J21474035 are presented in this work. It was selected as a high-confidence white dwarf candidate from Gentile Fusillo et al. (2021) as part of a spectroscopic survey of the southern 40 pc sample (O’Brien et al., in preparation).
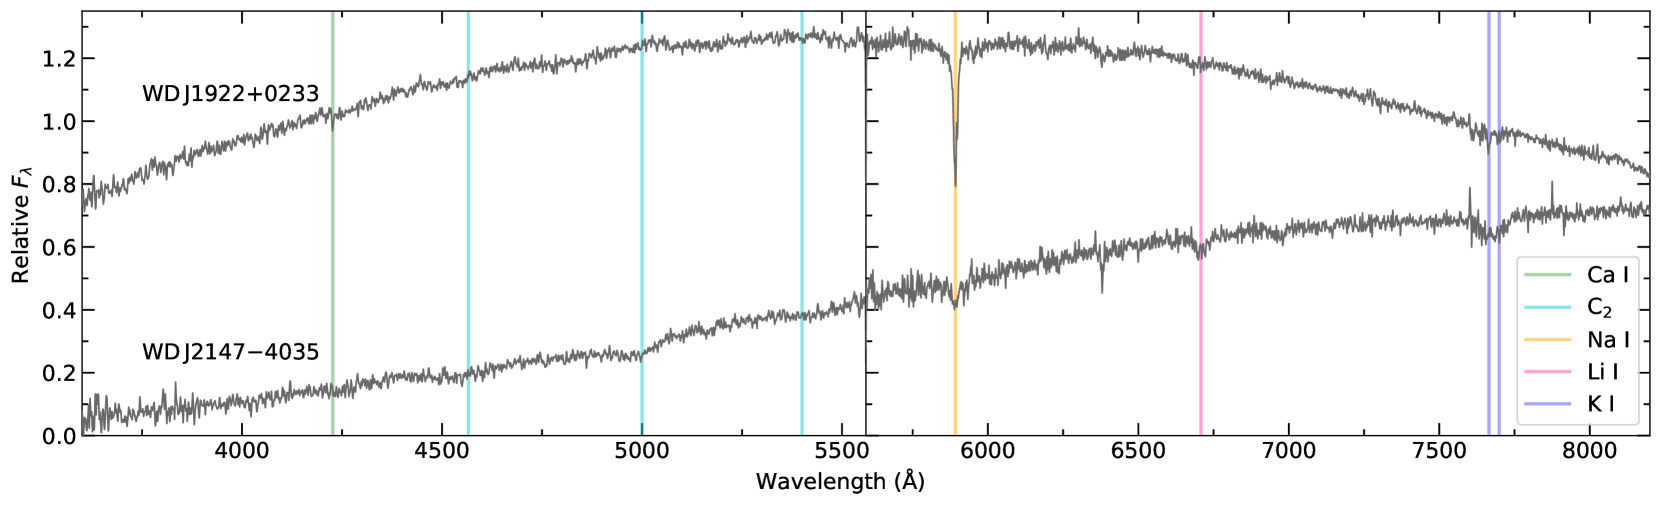
We observed WD J21474035 and WD J19220233 on 2021 June 5-7 with X-shooter (Vernet et al., 2011) on the Very Large Telescope (VLT) of the European Southern Observatory. We used slit widths of , , and arcsec in the blue (UVB, – Å, ), visual (VIS, – Å, ) and NIR ( – Å, ) arms, respectively. The exposure times in the UVB, VIS, and NIR arms were , , and s. The data were reduced following standard practices and using the Reflex pipeline (Freudling et al., 2013). The flux calibration was carried out using observations of the pure-hydrogen white dwarf LTT 7987, obtained with the identical instrument setup as the science spectroscopy, and telluric correction was performed using molecfit (Smette et al., 2015; Kausch et al., 2015). The X-Shooter spectra for WD J21474035 and WD J19220233 are shown in Figure 1, where we have highlighted spectral lines of metals detected in one or both spectra (see Section 6) with coloured vertical bars: calcium, sodium and potassium are detected in WD J19220233; sodium, lithium, potassium, and tentatively carbon, are detected in WD J21474035. The spectra obtained from the NIR arms of X-shooter for both stars are not used in this paper as they had insufficient flux for any scientific application.
Tables 2 and 3 display the available survey photometric data of WD J21474035 and WD J19220233, respectively. Corrections to the Gaia EDR3 magnitude measurements were applied following the procedure from Lindegren et al. (2021), with the corrected values shown in the tables. WD J19220233 has Panoramic Survey Telescope and Rapid Response System (Pan-STARRS; Chambers et al., 2016; Flewelling et al., 2020) DR2 photometry whereas WD J21474035 does not; instead, we used photometry from the Dark Energy Camera (DECam; Flaugher et al., 2015) from DR1 of the Dark Energy Survey (DES; Dark Energy Survey Collaboration et al., 2016; Abbott et al., 2018) located at the Cerro Tololo Inter-American Observatory (CTIO), as this has similar bandpasses to Pan-STARRS. WD J21474035 also has NIR photometry from DR6 of the Visible and Infrared Survey Telescope for Astronomy (VISTA) Hemisphere Survey (VHS; McMahon et al., 2013) and the Wide-field Infrared Survey Explorer (WISE; Wright et al., 2010) CatWISE2020 catalogue (Marocco et al., 2021).
| Survey | Filter | Magnitude |
| (mag) | ||
| Gaia | 19.959 0.008 | |
| 20.949 0.089 | ||
| 19.024 0.046 | ||
| DES | 21.400 0.020 | |
| 19.858 0.007 | ||
| 19.298 0.007 | ||
| 19.106 0.010 | ||
| 18.901 0.027 | ||
| VHS | 17.581 0.015 | |
| 17.625 0.091 | ||
| WISE | 16.965 0.050 | |
| 16.717 0.095 |
| Survey | Filter | Magnitude |
| (mag) | ||
| Gaia | 19.120 0.004 | |
| 19.407 0.036 | ||
| 18.654 0.032 | ||
| Pan-STARRS | 19.588 0.013 | |
| 19.056 0.011 | ||
| 18.937 0.023 | ||
| 19.099 0.038 | ||
| 19.467 0.020 |
3 Sample of cool DZ white dwarfs
Several other metal-polluted white dwarfs with K are found in the literature, from which we selected a subsample to use as a comparison to WD J21474035 and WD J19220233 in terms of astrometric, photometric and atmospheric parameters. We limited our subsample to include spectroscopically confirmed DZ stars with: K and lithium and/or potassium detections; or, K within error bars. This selection criteria yielded WD J235645.10205449.94 (hereafter WD J23562054222Also known as WD J2356209 in Blouin et al. (2019a).) from Blouin et al. (2019a), WD J164417.02044947.71 (hereafter WD J16440449) from Kaiser et al. (2021) and four white dwarfs from Hollands et al. (2021): WD J182458.45121316.82, WD J133001.17643523.69, WD J231726.74183052.75 and WD J121456.38023402.84 (hereafter WD J18241213, WD J13306435, WD J23171830 and WD J12140234, respectively). Together with WD J21474035 and WD J19220233, these eight white dwarfs comprise our subsample and their astrometry is given in Table 1.
3.1 Gaia white dwarfs within 100 pc
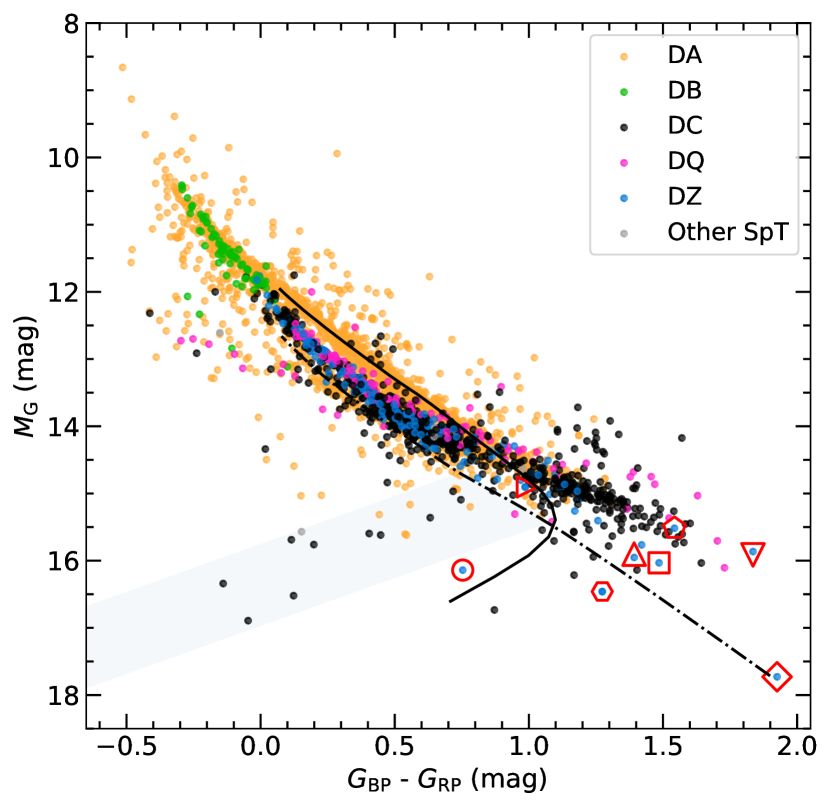
To determine the unique nature of WD J21474035 and WD J19220233, we employed Hertzsprung–Russell diagrams (HRDs) to compare them to the Gaia EDR3 white dwarf sample within 100 pc of the Sun and Sloan Digital Sky Survey (SDSS; York et al., 2000) footprint from Gentile Fusillo et al. (2021). We imposed selection criteria to only return objects which have SDSS photometry and are within 100 pc, which resulted in a sample of 5613 objects. We found 2865 (51.0 per cent)333The total number of objects with a spectrum in the 100 pc sample and SDSS footprint is 2917 (52.0 per cent). The total number of confirmed white dwarfs (including main white dwarf spectral types, ‘Other SpT’, all binaries and CVs) in the 100 pc sample and SDSS footprint is 2887 (51.4 per cent). of these 5613 stars have published spectral classifications of white dwarf spectral types (Sion et al., 1983). All binary spectral types are excluded from the sample of 2865 white dwarfs. All spectral classifications were obtained from the Gentile Fusillo et al. (2021) GaiaSDSS spectroscopic catalogue, the literature (Kilic et al., 2006, 2010; Kilic et al., 2020) or the Montreal White Dwarf Database (MWDD; Dufour et al., 2017).
Narrow-band photometry from Pan-STARRS was subsequently obtained for the white dwarf sample within 100 pc and the SDSS footprint, which complimented the broad bandpass photometry from Gaia EDR3 in our analysis. The sample is displayed in the HRDs in Figure 2, which is representative of the white dwarf cooling sequence. Absolute magnitudes are computed using Gaia EDR3 parallaxes. Pan-STARRS photometry is used in Figure 2 whereas Gaia photometry is employed in Figure 2.
The DZ subsample stars were added to the main sample, except WD J12140234 and WD J23171830 as they are in the SDSS footprint, which increased our sample to 2871 white dwarfs within 100 pc with spectral classifications; a breakdown of the number of white dwarfs with each spectral type is shown in Table 4. The eight subsample DZ white dwarfs are plotted in Figure 2 and indicated with red open markers. WD J21474035 does not have Pan-STARRS photometry so we used DECam photometry instead.
| Spectral Type | Total Number |
|---|---|
| DA | 1861 |
| DB | 74 |
| DC | 667 |
| DQ | 117 |
| DZ | 138 |
| Other SpT | 8 |
| Subsample DZ | 6 |
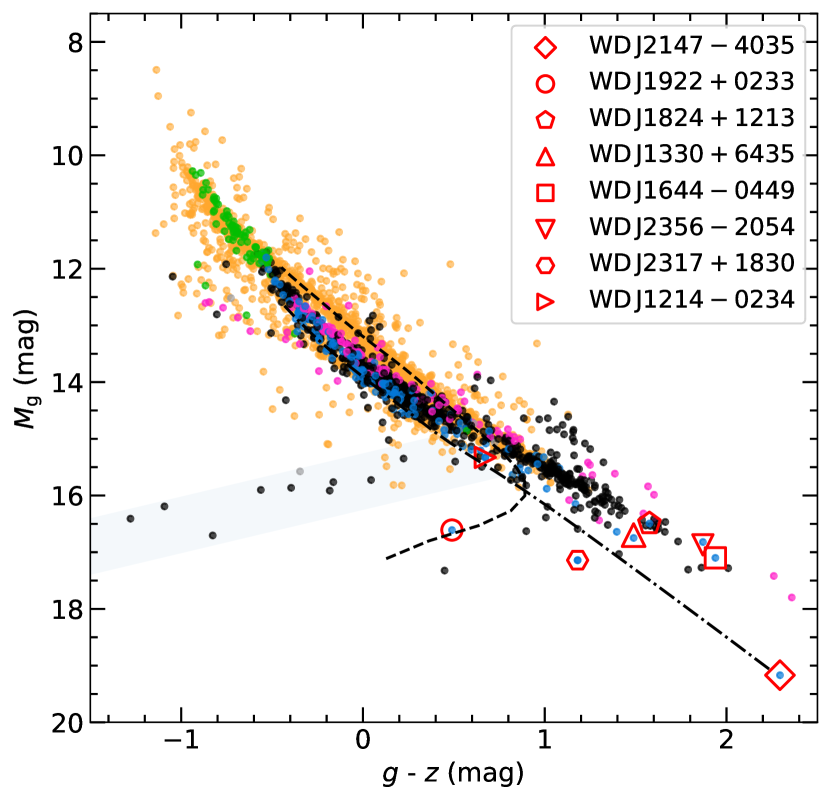
WD J21474035 and WD J19220233 occupy relatively isolated positions on the HRDs, suggesting they have unusual parameters and extreme natures (see Section 7.2 for further discussion). WD J19220233 has an unusually blue colour relative to its dim absolute magnitude and therefore could have strong CIA opacity, as suggested by the unusual spectral shape and red flux deficit in Figure 1 (see also Tremblay et al., 2020). WD J21474035 is an obvious outlier to the main white dwarf cooling sequence as it is the dimmest and reddest object out of the sample, which suggests it is an old remnant. Comparison with the local 40 pc Gaia sample reveals WD J21474035 as the intrinsically faintest spectroscopically confirmed white dwarf in the optical (O’Brien et al., in preparation). Also, the extreme red colour of WD J21474035 indicates it has more moderate CIA.
WD J12140234 lies on the main white dwarf cooling sequence. WD J16440449, WD J18241213, WD J13306435 and WD J23171830 are dimmer and redder than the majority of objects in the sample, thus reside in the tail of the main white dwarf cooling sequence. The cool DZ WD J23562054 is an outlier in Figure 2 as it has an extremely red colour of mag; this quantity is only slightly smaller compared to WD J21474035. A larger photometric difference is measured using Pan-STARRS between the two stars, which have measurements of mag for WD J23562054 and mag for WD J21474035. WD J23562054 has an absolute magnitude with Pan-STARRS and Gaia photometry comparable to the DZ stars in our subsample which cluster at the end of the main white dwarf cooling sequence, and is notably brighter than WD J21474035 in by mag and by mag. The combination of its absolute magnitude and slightly bluer colour compared to its colour makes WD J23562054 occupy a less unusual position in Figure 2 than Figure 2.
Given the narrow Pan-STARRS bandpasses, metal lines in the DZ subsample and WD J23562054 could impact their positions in the HRD. However, we note that most warmer DZ white dwarfs sit on the main white dwarf cooling track. This suggests that it is the cool nature of these DZ white dwarfs that make them outliers in the HRD, rather than metal lines. This is confirmed by looking at the HRD of Figure 2 using the much broader Gaia filters.
3.1.1 Ultra-blue sequence
A clear ultra-blue sequence consisting of mainly DC stars is seen in Figure 2 and indicated by the shaded blue region in both panels. This sequence was first extensively studied in Kilic et al. (2020). White dwarfs on the ultra-blue sequence are designated as IR-faint as they have optical and NIR flux deficits and thus present strong CIA opacity, with models suggesting mixed H/He atmospheric compositions (see Section 7.3).
The white dwarfs populating the ultra-blue sequence in Figure 2 have published and are modelled to be as cool as K (Kilic et al., 2020), although a more recent analysis by Bergeron et al. (2022) found a warmer lower limit of K. WD J003908.38303539.76 is the bluest DC white dwarf on the ultra-blue sequence with and K (Bergeron et al., 2022).
No white dwarf from our DZ subsample reside on the ultra-blue sequence. However, WD J19220233 resides parallel to the ultra-blue sequence so it could have turned off the main white dwarf cooling sequence later than the other objects in this population, possibly due to it having a slightly different atmospheric abundance.
4 Model atmospheres
The model atmosphere code of Koester (2010), with microphysics improvements explained in this section, was used to determine the parameters of WD J21474035 and WD J19220233.
The atmospheric density of cool white dwarfs can become so high () that it must be considered as a dense fluid rather than an ideal gas (Kowalski & Saumon, 2004; Kowalski, 2006, 2014; Blouin et al., 2017, 2018a). Deviations from the simple ideal equation-of-state (EOS) become important at these temperatures, especially for helium-rich models. Since the absorption coefficient of pure neutral helium is very small, these atmosphere models reach very high densities. We therefore utilised a non-ideal EOS taking into account the interaction of charged and neutral particles. For the description of the interaction between charged particles we followed Chabrier & Potekhin (1998); Potekhin & Chabrier (2000), but used only the ion-ion interaction as described by the one-component-Coulomb plasma. The model of neutral interactions is based on the classical excluded volume model with hard spheres (see e.g. Hummer & Mihalas, 1988), but modified arbitrarily to obtain the desired result of total ionisation in the density regime of about 3-8 g cm-3 (Saumon et al., 1995). Together the charged and neutral particle interactions lead to a lowering of the energy for the ionisation of individual atoms and the dissociation of molecules. The non-ideal effects also have a contribution to the pressure and to other thermodynamic quantities like the adiabatic gradient.
We employed CIA opacities for H2-H2 (Abel et al., 2011; Borysow et al., 2001), H2-He (Abel et al. 2012 with scaling factor from Blouin et al. 2017), H-He (Gustafsson & Frommhold, 2001) and H2-H (Gustafsson & Frommhold, 2003). In principle there should also be a He-He-He CIA contribution (Kowalski, 2014). We implemented the numerical fit given by Kowalski (2014) and find such a strong IR absorption in WD J21474035 that it is impossible to fit the photometry. A likely reason for this is that the maximum density Kowalski (2014) used in the derivation of the numerical fit was , and in the models shown the He-He-He CIA produces only a fairly minor change. However, in the photospheres of our models the densities reach ( cm-3), which is approximately the photospheric density in WD J21474035. As the absorption is proportional to the cube of the density, the extrapolation of the He-He-He opacity to the very high densities in our models is very likely not reliable. We have therefore switched off the effect from He-He-He CIA absorption in our models. For WD J19220233, the He-He-He contribution is negligible because of the much stronger contributions involving hydrogen.
5 Stellar parameters
| (K) | (cm s-2) | (10-5 R⊙) | (M⊙) | (Gyr) | ||
|---|---|---|---|---|---|---|
| WD J21474035 | 3048 35 | 8.195 0.042 | < 5.66 | 1100 32 | 0.69 0.02 | 10.2 0.2 |
| WD J19220233 | 3343 54 | 8.000 0.055 | 2.69 0.17 | 1247 26 | 0.57 0.03 | 9.0 0.2 |
| WD J18241213 | 3350 50 | 7.41 0.07 | 0.07 0.10 | 1741 55 | 0.28 0.03 | 5.5 0.4 |
| WD J13306435a | 3660 50 | 7.65 0.14 | < 4.0 | 1524 115 | 0.38 0.07 | 6.0 1.0 |
| WD J16440449 | 3830 230 | 7.77 0.23 | < 2.0 | 1404 174 | 0.45 0.12 | 6.8 0.2 |
| WD J23562054 | 4040 110 | 7.98 0.07 | 1.5 0.2 | 1263 52 | 0.56 0.04 | 8.0 0.8 |
| WD J23171830 | 4210 50 | 8.64 0.03 | 0.09 0.09 | 793 21 | 1.00 0.02 | 9.5 0.2 |
| WD J12140234 | 4780 50 | 7.97 0.04 | 3.19 0.18 | 1269 29 | 0.55 0.02 | 5.8 0.2 |
Representative cooling sequences which indicate approximate and for WD J21474035 and WD J19220233 are shown in Figure 2 with the dashed, solid or dashed-dotted lines. The best-fitting cooling sequence for WD J21474035 is given in both HRDs by and . The cooling sequences with indicate the best-fit to WD J19220233 when using mixed atmospheres of with Pan-STARRS photometry and with Gaia photometry. These cooling sequences serve as an indicative tool for deriving the atmospheric parameters of WD J21474035 and WD J19220233 using a model grid, as described in Section 4, and the full photometric data sets.
Our model grid was used to predict synthetic photometry for both objects, which depends on the atmospheric parameters , and abundance. We relied on the mass-radius relation of Bédard et al. (2020) to predict absolute magnitudes. We used an iterative procedure utilising the photometric (Tables 2 and 3) and spectroscopic data sets to find the best-fitting atmospheric parameters and individual metal abundances of WD J21474035 and WD J19220233. We initially estimated atmospheric parameters using the photometric technique, where we fit the observed photometry to our grid of synthetic photometry which included metals over all bandpasses to minimise chi-square (). Our minimisation technique utilised the non-linear least-squares Levenberg-Marquardt algorithm (Press et al., 1986) and considered , and as free parameters. We produced synthetic spectra at those fixed atmospheric parameters, then analysed the fit between the metal absorption lines in the synthetic and observed spectra. The metal abundances were adjusted to optimise the fit. Keeping these new metal abundances fixed, we produced a new grid of synthetic photometry and repeated the photometric fitting. This process was iterated until the best-fitting atmospheric parameters and metal abundances were found. The uncertainties of the best-fitting atmospheric parameters are dependent on one another and are computed from the covariance matrix of the model atmosphere fit, therefore they are statistical in nature and do not account for systematic uncertainty.
Our iterative procedure was most important for WD J21474035 as the metal abundances had a non-negligible effect on its atmospheric parameters. The reason for this effect is most likely due to the low atmospheric hydrogen content in the star, hence the metals provide additional free electrons and impact the photospheric structure. Alternatively, the inclusion of metals in the fit of WD J19220233 changed the synthetic photometry by less than 0.01 mag, which is within and therefore not significant.
A lower limit of 0.05 mag for photometric uncertainties was imposed in the fit of WD J21474035. This treatment prevented it from being dominated by the very small observed photometric uncertainties at optical wavelengths which may be underestimated considering the star’s extremely dim magnitude, compared to the moderately large IR photometric uncertainties (see Table 2). The best-fitting model atmosphere for WD J21474035 included optimised fixed metal abundances (see Section 6) with K, and . Since a further decrease in the hydrogen content led only to minimal changes of the models, we would not exclude the possibility that our best-fitting abundance is an upper limit instead of a real determination.
The Gaia EDR3 magnitude uncertainties is an order of magnitude smaller than all other optical photometric uncertainties for WD J19220233 (see Table 3), therefore we added a common systematic uncertainty of 0.01 mag to all measured photometric uncertainties for the fit. Despite the WD J19220233 Gaia EDR3 parallax and uncertainty having a relative precision of 1.05 per cent, we also included the parallax as a free parameter in the fit to propagate extra freedom into , and , resulting in their uncertainties being more realistic. The best-fitting model atmosphere for WD J19220233 has K, and . The best-fitting parallax is , which has a percentage difference to the measured Gaia parallax of only 0.126 per cent.
After the completion of this work, a paper by Bergeron et al. (2022) found significant differences in the atmospheric parameters of WD J19220233, notably K, and . However, the physics involved in our atmospheric models (see Section 4) and the ones used in Bergeron et al. (2022) differ slightly. Our models included the more recent H2-He CIA calculations by Abel et al. (2012), which should be superior to Jørgensen et al. (2000) used by Bergeron et al. (2022). We also included non-ideal effects in the EOS. With our models, we found a satisfactory fit to the photometry of WD J19220233 for parameters significantly different from Bergeron et al. (2022). A more detailed discussion is beyond the scope of this paper.
The best-fitting atmospheric parameters for our subsample are shown in Table 5. Note that the small uncertainties given for our parameters only include the statistical errors from our fits and no systematic errors from e.g. model uncertainties, so the real errors are likely larger.
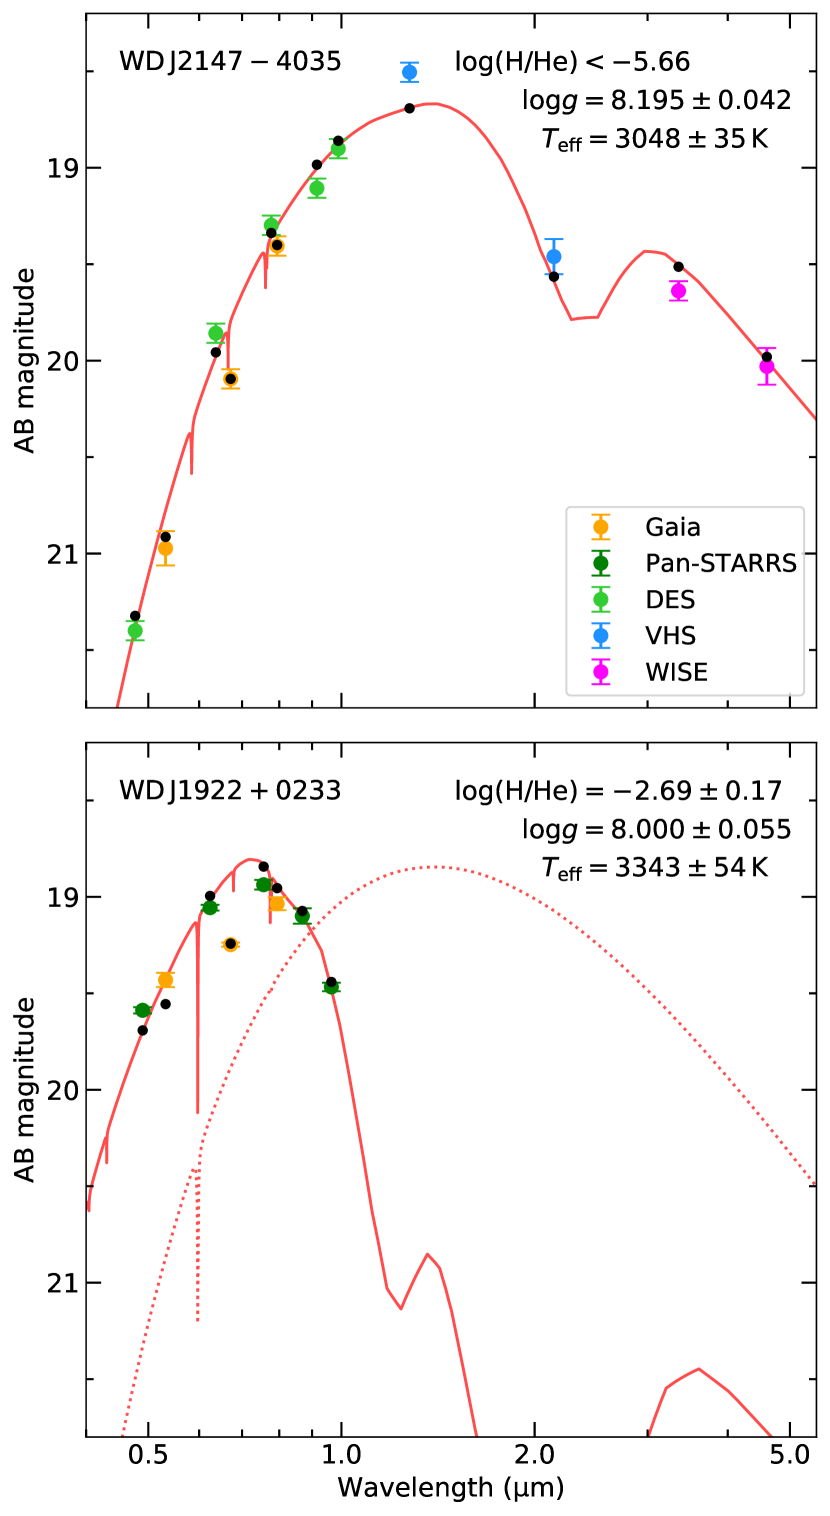
Monochromatic model fluxes were calculated with the best-fitting models including metals in the atmospheric structure calculations for WD J21474035 and WD J19220233. The best-fitting monochromatic model fluxes and synthetic photometry for both stars were converted to AB magnitudes and are shown in Figure 3 as a comparison to all available optical and NIR observed photometry. A reasonable fit is achieved between the observed and synthetic photometry for both objects. A visual offset is seen between the synthetic Gaia EDR3 , and to a lesser extent and , magnitudes and our best-fitting models due to the very broad Gaia bandpasses. We note the CIA opacities included in the model atmosphere code (see Section 4) have a strong effect on the quality of fit of the best-fitting model for WD J19220233 to observed photometry, where Figure 3 shows the best-fitting model (solid red line) compared to the identical model with all CIA opacities removed (dotted red line). The effect from CIA opacities in WD J19220233 is also clear from the blueward shifted peak of its SED to optical wavelengths, near in this case, compared to when CIA opacities are removed. This shift represents the extreme deficit of IR flux due to CIA in this ultra-cool star, despite us lacking observational data in the IR. The SED peak of WD J21474035 is near and is comparable to the SED peak of the best-fitting model of WD J19220233 when CIA opacities are removed, which suggests there are only mild effects from CIA opacity in this remnant.
The white dwarf mass () and cooling age () of WD J21474035 and WD J19220233 were derived using model evolutionary sequences with thin hydrogen layers (small total hydrogen masses of , where is the hydrogen mass), and C/O cores (Bédard et al., 2020), and are presented in Table 5 with the rest of our subsample. WD J21474035 is relatively massive compared to other cool and ultra-cool remnants with and has the largest cooling age known for a DZ white dwarf of Gyr. We find for WD J19220233 and Gyr, making it a relatively old white dwarf in terms of cooling age. These white dwarfs have a very low temperature compared to the so-called truncation of the luminosity function at K, which is thought to correspond to Gyr and thus the oldest white dwarfs in the local Galactic disc (Winget et al., 1987; Kilic et al., 2017). White dwarfs with helium-rich atmospheres are thought to cool more rapidly than ones with hydrogen-rich atmospheres due to the early event of convective coupling (Oppenheimer et al., 2001b; Fontaine et al., 2001), i.e. they will have a lower for the same cooling age. In addition, more massive white dwarfs, and therefore those with smaller radii according to the mass-radius relation of degenerate stars, cool faster than stars of more moderate mass, as they develop a crystallized core earlier so they reach the state of very small specific heat capacity values quicker thus have a rapid final cooling phase (Fontaine et al., 2001). The combination of these effects can help to explain the ultra-cool nature of both stars.
6 Metal abundances
The intermediate-resolution optical spectra from our VLT X-Shooter observations of WD J21474035 and WD J19220233 are shown in Figure 1. Strong lines of the Na i D doublet (5893 Å) and K i (7665 Å and 7699 Å) are seen in both spectra. We also detected Ca i (4227 Å) in WD J19220233 and Li i (6708 Å) in WD J21474035. We made a tentative detection of C2 in WD J21474035 at Å, 5000 Å and 5400 Å.

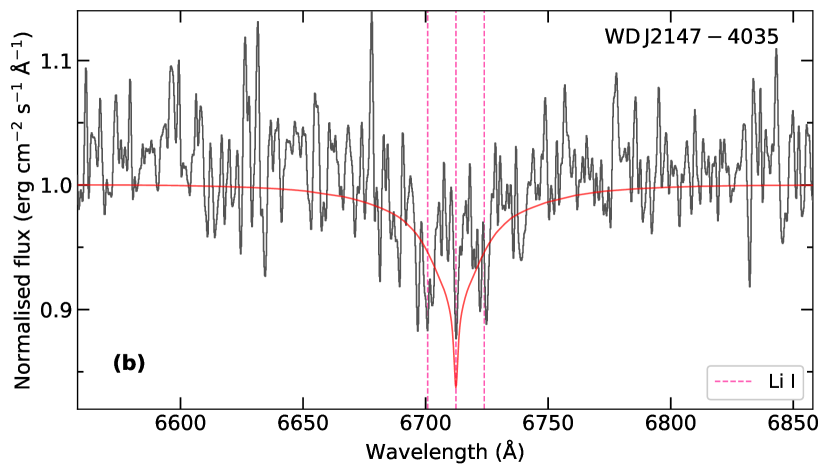
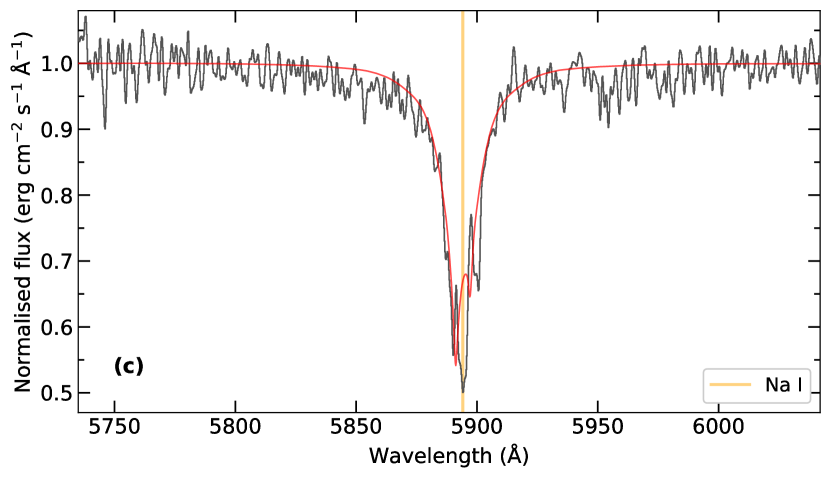
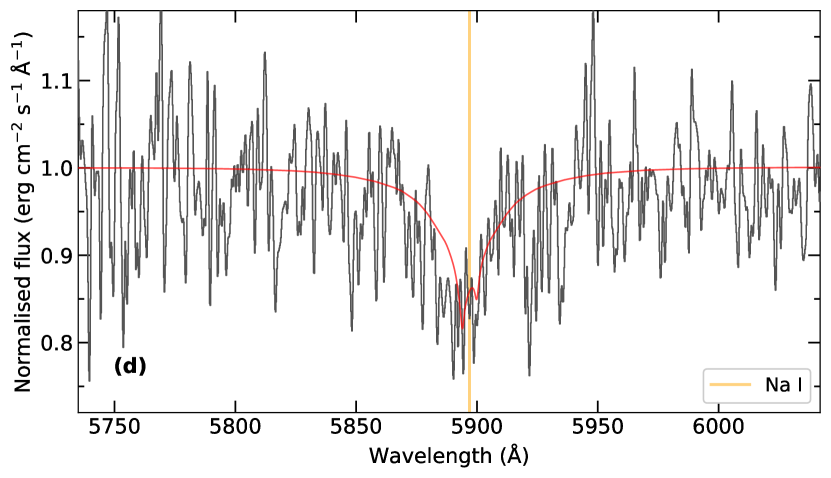
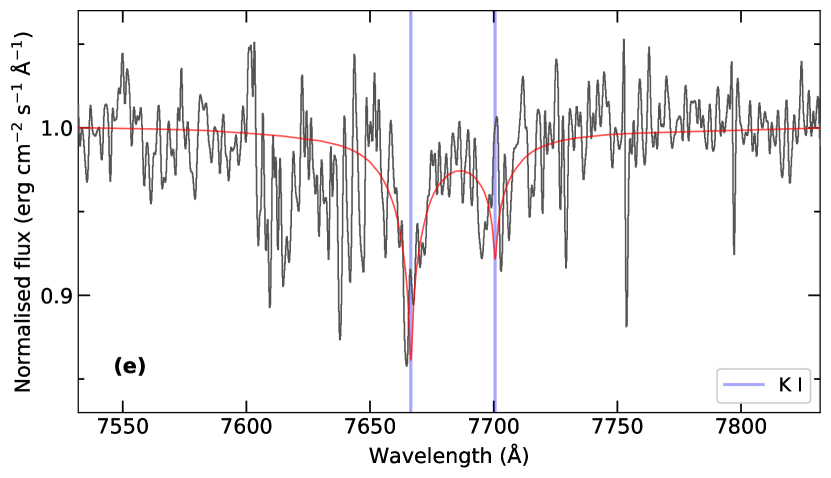
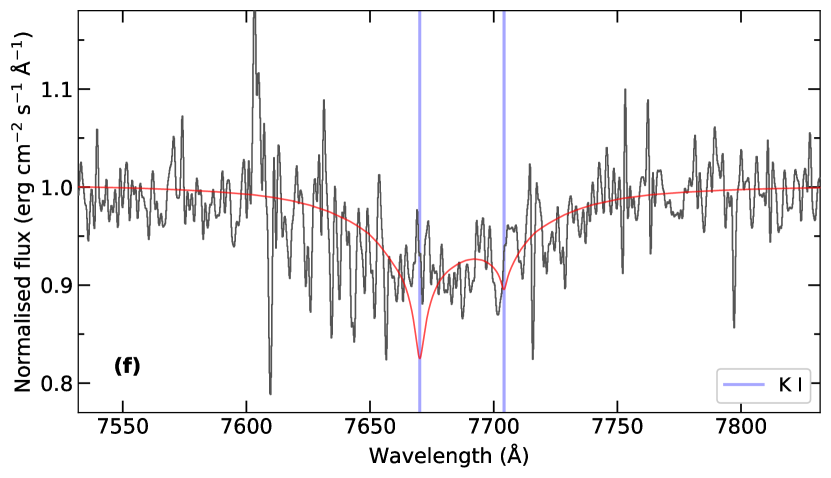
We used an iterative procedure to fit the observed spectra of WD J21474035 and WD J19220233, using model atmospheres including metals in the atmospheric structure calculations, with the best-fitting atmospheric parameters (, log , ; Table 5) derived in Section 5 to constrain the abundances of detected metals in each star. The individual metal abundances in the models were iterated until a reduced was reached. Figure 4 shows the best-fitting model spectra for WD J21474035 and WD J19220233 in red, overlaid on the observed spectra which are zoomed-in on the the metal detections.
The metal abundance measurements of WD J21474035 and WD J19220233 are presented in Table 6 and can be put into the context of metal abundances of other cool DZ white dwarfs found in the literature. The detection and subsequent abundance measurements of K i were possible only after telluric line removal of the atmospheric O2 absorption band near Å was performed. However, we do not discount the possibility of the K i line shape and strength being affected by the telluric removal as it is an imperfect process. We do not detect Li i in WD J19220233 nor Ca i in WD J21474035, so we constrained the observational upper limits of these metals by finding the abundance that produced the best-fitting model spectral line just within the noise level of the observed spectra. In Section 7.5.1, we discuss the accretion inferences made from the abundances of the detected metals and observational upper limits for both stars.
C, O, Mg, Si, Al and Fe are not detected in WD J21474035 nor WD J19220233 but are commonly found in rocky exoplanetesimals and asteroids, and thus in the atmospheres of other DZ white dwarfs (Zuckerman et al., 2007; Klein et al., 2010; Gänsicke et al., 2012; Jura & Young, 2014; Raddi et al., 2015). Therefore, we also included these undetected metals in our model atmospheres and set them to Earth crust (Rudnick & Gao, 2003) abundances relative to sodium (see Section 7.5.1 for further explanation). However, these abundance ratios of Al and Fe for WD J19220233 produced absorption lines that were too strong by 0.64 dex and 0.03 dex, respectively, revealing their observational upper limits as and which we used in the model instead. Table 7 displays the values used for all metals included in the model atmospheres of WD J21474035 and WD J19220233, including the measured abundances of detected metals, observational upper limits and the fixed abundances used for undetected metals.
| WD J21474035 | < 5.66 | < 13.20 | 13.10 0.20 | 13.20 0.20 | 12.90 0.20 | < 0.10 | 0.10 0.28 | 0.20 0.28 |
|---|---|---|---|---|---|---|---|---|
| WD J19220233 | 2.69 0.17 | 13.96 0.20 | 12.60 0.20 | < 13.60 | 13.10 0.20 | 1.36 0.28 | < 1.00 | 0.50 0.28 |
| WD J18241213 | 0.07 0.10 | 10.28 0.14 | 10.19 0.07 | 11.95 0.08 | – | 0.21 0.16 | 1.76 0.11 | – |
| WD J13306435 | < 4.00 | 10.94 0.36 | 10.35 0.12 | 11.96 0.29 | – | 0.59 0.38 | 1.61 0.31 | – |
| WD J16440449 | < 2.00 | 9.5 0.20 | 9.5 0.20 | 11.2 0.20 | 10.9 0.20 | 0.00 0.28 | 1.70 0.28 | 1.40 0.28 |
| WD J23562054 | 1.5 0.2 | 9.4 0.1b | 8.3 0.2 | < 11.7c | < 10.4c | 1.10 0.22 | < 3.40 | < 2.10 |
| WD J23171830 | 0.09 0.09 | 10.79 0.12 | 9.96 0.07 | 11.19 0.08 | < 10.50 | 0.83 0.14 | 1.23 0.11 | < 0.54 |
| WD J12140234 | 3.19 0.18 | 10.08 0.11 | 9.53 0.06 | 11.83 0.08 | 10.16 0.08 | 0.55 0.13 | 2.30 0.10 | 0.63 0.10 |
| Bulk Earth | – | – | – | – | – | 0.74 | 2.69 | 1.28 |
| Continental crust | – | – | – | – | – | 0.22 | 2.48 | 0.25 |
| CI chondrites | 6.96 0.05 | 5.00 0.03 | 4.98 0.03 | 1.96 0.06 | 3.77 0.05 | 0.02 0.04 | 3.02 0.07 | 1.21 0.06 |
| Solar | 1.10 0.01 | 4.54 0.02 | 4.60 0.03 | 9.80 0.10 | 5.78 0.05 | 0.06 0.04 | 5.20 0.10 | 1.18 0.06 |
6.1 Magnetic nature of WD J21474035
The cool magnetic white dwarf WD J12140234 was detected to have the first Zeeman split lithium line in Hollands et al. (2021), where the magnetic field was measured to be 2.1 MG. The Li i spectral line in the X-Shooter spectrum of WD J21474035 indicates this star is also magnetic due to it being split into three components from Zeeman splitting. We found a best-fitting magnetic field strength of MG as a result of fitting a constant magnetic field to the Zeeman split Li i line; the three line components produced from this magnetic field are shown in Figure 4 by the vertical dashed pink lines. We do not analyse sodium or potassium spectral line splitting in WD J21474035 because these elements have much larger fine-structure splitting than lithium, hence the pattern is much more complicated than the triplet observed with the lithium line.
6.2 A 13 h photometric period
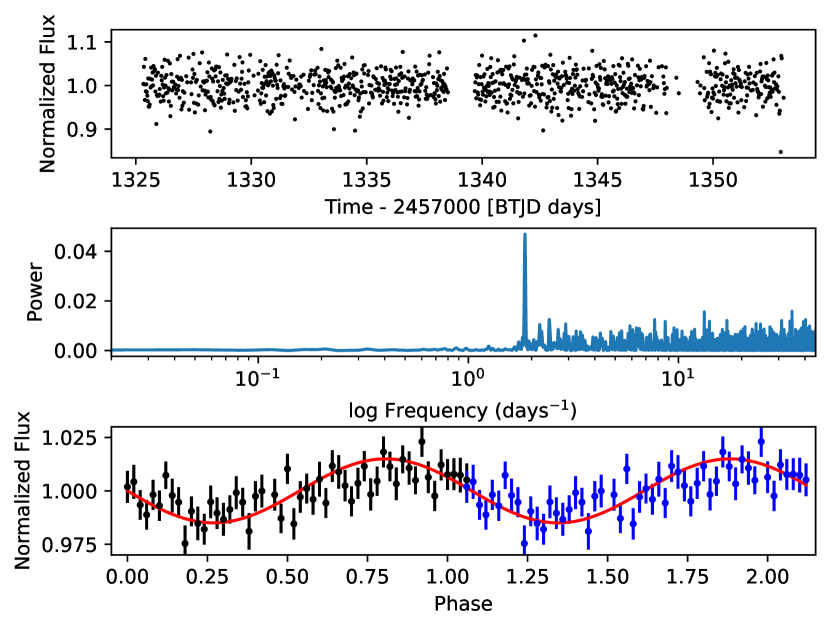
Magnetism can result in inhomogeneous brightness distributions across the surface of the white dwarf, which in turn leads to photometric variability on the white dwarf spin period (e.g. Brinkworth et al., 2013). We investigated the photometric variability of WD J21474035 by inspecting the full-frame images (FFI) of the Transiting Exoplanet Survey Satellite (TESS; Ricker et al., 2014), which observed the star in sectors one and 28. We split the TESS full frame image light curves into two segments per sector, before and after the gap occurring during the data downlink. We clipped three days at the end of each segment of the Cycle 28 data, where the light curves displayed large-amplitude structures that most likely result from the data reduction (given that WD J21474035 has a TESS magnitude of , extracting a light curve is challenging). We then computed discrete Fourier transforms for the four individual light curves using the TSA context within MIDAS (Figure 5). All four periodograms contain a strong signal at , corresponding to a period of h. We determined periods of , , , h from the four segments by fitting a sine curve to the data, with amplitudes of per cent. We suggest that this consistently detected photometric signal represents the spin period of the white dwarf, which is compatible both in amplitude of the modulation and in period with the rotation variability commonly observed in magnetic white dwarfs.
6.3 Carbon detection in WD J21474035
We made a tentative detection of C2 in WD J21474035 due to the very broad, rounded absorption features centred at Å, 5000 Å and 5400 Å being consistent with the three strongest C2 Swan band systems (progressions; Johnson, 1927) when broadened and empirically blueshifted from their nominal wavelengths. These absorption features are similar to those found in cool DQpec white dwarfs, which have distorted carbon features in their optical spectra presenting rounded profiles and centroid wavelengths blueshifted by Å (Hall & Maxwell, 2008). Studies have found that the high atmospheric pressure in cool DQpec stars drives this distortion (Kowalski, 2010), however it is thought that a more complex combination of high atmospheric pressure, chemical composition and magnetic field strength is responsible for the varying distortions observed in individual stars, but the specific mechanisms are currently not fully understood (Liebert et al., 1978; Bergeron et al., 1994; Schmidt et al., 1995; Schmidt et al., 1999; Hall & Maxwell, 2008; Blouin et al., 2019c).
One DQpecP and four DQpec stars are found in the MWDD with K (in increasing temperature order): LP 35142, SDSS J1803202.57+232043.3, SDSS J082955.77+183532.6, GJ 3614 and PM J12476+0646. LP 35142 and GJ 3614 have strong magnetic fields of 100 MG and 50 MG, respectively, in addition to LP 35142 having detectable polarisation hence its classification of DQpecP (McCook & Sion, 1999). The other three white dwarfs do not have detected magnetic fields and none of the stars have published atmospheric abundances. The C2 progressions in all five white dwarfs are blueshifted with respect to the nominal wavelengths, with the largest distortions evident in GJ and LP 35142. The C2 progressions observed in LP 35142 are in excellent agreement with the broad absorption features in WD J21474035 and are shown in Figure 1 with aqua vertical lines. LP 35142 is K warmer than WD J21474035 and has a significantly stronger magnetic field so the reason for this agreement is unclear. An empirical blueshift of Å to the progressions in SDSS J1803202.57232043.3, which is K warmer than WD J21474035, also provides excellent agreement to the absorption features in WD J21474035. The other three DQpec stars require larger blueshifts to their observed progressions to fit the features of WD J21474035.
We do not attempt to fit the distorted C2 progressions in WD J21474035 using our model atmospheres as the high atmospheric density, relatively weak bands and low signal-to-noise of the X-Shooter spectrum make a quantitative analysis particularly challenging. However, we still assign the spectral type DZQH to this star. The combination of metals polluting WD J21474035, including sodium, lithium, potassium and tentatively carbon, in addition to its ultra-cool temperature and magnetic nature, makes this an extremely rare white dwarf.
7 Discussion
7.1 Neutral line broadening
Hollands et al. (2021) used an empirically determined factor of ten to reduce the neutral-broadening constant of lithium in their models to extract a good fit to the observations. We found that a reduction factor of 100 gave the best-fitting model to the equivalent width and shapes of observed absorption lines in WD J21474035 and WD J19220233. Our ad-hoc treatment of the neutral-broadening constant was applied for all observed metals.
The standard neutral-broadening constants for WD J21474035 and WD J19220233 were calculated using the impact approximation, which is the standard theory of line broadening (Kolb & Griem, 1958; Griem, 1960, 1974). The condition for this application is that the time of effective interaction between two particles, deemed the emitter and perturber, is much shorter than the time between interactions. In our model, the mean distance between emitter and perturber in the photosphere is Å therefore this is definitely not the case – the emitter is constantly affected by interactions with the perturbers. Alternative approaches include the quasistatic theory (Mozer & Baranger, 1960; Baranger, 1962), which traditionally assumes van der Waals interactions, or the unified theories (Voslamber, 1969; Smith et al., 1969). However, none of these are applicable at Å distances.
A study performed by Nur et al. (2015) with high density argon corona plasma at very low temperatures found that with increasing hydrostatic pressure the line broadening of gaseous Ar i follows a positive linear relation with particle density, yet when transitioning to a fluid this relation ceases and the line width appears significantly narrower than expected from extrapolation and even decreases at higher densities (see Fig. 5 of Nur et al. 2015). Nur et al. (2015) used a maximum particle density an order of magnitude lower than the density in the photosphere of WD J21474035 and WD J19220233, so the use of an empirical broadening constant on metal lines within models for ultra-cool DZ white dwarfs may have a plausible justification. Even so, the dense fluid physics involved within the extremely high-pressure photospheres of these stars requires further study so an appropriate theory of line broadening at these densities can be created.
7.2 Nature of WDJ 21474035 and WDJ 19220233
The observations of WD J21474035 suggest much milder atmospheric CIA compared to WD J19220233 because it is very red, with mag. There could be two overlapping explanations for the nature of WD J21474035: a vastly different ratio to WD J19220233, resulting in a much lower H2 abundance and CIA opacity; or a significant change in non-ideal effects, resulting in the dissociation of H2 molecules. The presence of metal lines is helpful to break this degeneracy, although the empirical broadening factor needed to fit them in both objects is a significant impairment to extract atmospheric conditions from the metal lines. The main evidence that can be gathered from the metal lines is that hydrogen-dominated atmospheres can be excluded for both objects, making a strong case that cool white dwarfs with unusually strong CIA have mixed atmospheres, as previously accepted from indirect evidence (Kilic et al., 2020). Furthermore, strong non-ideal effects that could ionise more H2 and therefore force the model fluxes to redder wavelengths, would also ionise alkali metals with low ionisation potentials compared to the H2 molecule. Therefore, metal line observations also put an upper limit on the strength of non-ideal effects.
The unusual position of WD J19220233 on the HRD (Figure 2) suggests its nature can be explained by two scenarios: either it is relatively massive which caused it to have a higher absolute magnitude than stars of more moderate mass, hence it is placed vertically below the main white dwarf cooling sequence; or, flux suppression in the red optical and IR due to CIA caused the star to have a peak flux emission at bluer wavelengths, resulting in a horizontal placement blueward of the main white dwarf cooling sequence. We conclude the latter is true as we derived a moderate mass for WD J19220233 in Section 5 and found its SED is indicative of strong CIA opacity due to an extreme IR flux deficit in Section 6. Also, cool white dwarfs typically have dense photospheres compared to their warmer counterparts; however, an increasingly higher atmospheric composition of decreases the density. The complex interplay between photospheric density, non-ideal EOS effects and the abundance of H2 controls the intensity of CIA (Blouin et al., 2017, 2018a). The maximum intensity of the H2-He CIA corresponds to an atmospheric abundance of (Kilic et al., 2020), which is close to our best-fitting abundance of for WD J19220233. This is consistent with observations of strong CIA opacity in the relatively blue WD J19220233.
Given available information, the best explanation for the colour differences between WD J21474035 and WD J19220233 is that the former has a much lower ratio and only mildly enhanced non-ideal effects compared to WD J19220233, resulting in much milder CIA.
7.3 Nature of IR-faint white dwarfs
We note that our grid of models is able to provide reasonable solutions for the spectroscopy and photometry of both WD J21474035 and WD J19220233 with the same microphysics, despite their vastly different positions in the HRD. Yet, tests using our grid of models with K, and proved unable to explain the ultra-blue sequence of DC white dwarfs observed in Figure 2 and previously identified in Kilic et al. (2020); Bergeron et al. (2022). The most likely explanation for this behaviour is that the intricate balance between CIA and non-ideal effects is not yet fully accurate in our models for these stars.
Nevertheless, the discovery of WD J19220233, the first IR-faint DZ white dwarf with flux suppression in the red optical and IR from strong CIA, and its comparison with other ultra-cool DZ stars, opens a new window to understand the atmospheric composition of IR-faint white dwarfs. These observations suggest that they form a small sub-sample of all cool stellar remnants that have a rather narrow range of around , with the exact value subject to significant modelling uncertainties. This is supported by the finding that all other ultra-cool DZ white dwarfs, with a ratio that is either small () or large () according to Table 5, reside closer to the main cooling sequence in the various HRDs. WD J12140234 has so could be a future member of the ultra-blue sequence, as its current is too high to allow this transition.
The spectral evolution of white dwarfs, i.e. the evolution of the ratio of He- to H-dominated atmospheres, has been extensively studied in recent years (Blouin et al., 2019c; Cunningham et al., 2020; McCleery et al., 2020; Bédard et al., 2020; López-Sanjuan et al., 2022). These studies suggest that the ratio of He- to H-dominated atmospheres is 0.3 in the range K, where it is possible to constrain atmospheric composition from the presence or absence of the H line. However, Gentile Fusillo et al. (2020) have demonstrated from optical and IR HRDs that the vast majority of cool ( K) DC white dwarfs, residing near the main cooling sequence, could have either H- or He-rich atmospheres. In other words, there is no clear separation in colour space between these two atmospheric classes, preventing any robust constrain on the spectral evolution of very cool white dwarfs. This is consistent with both He- and H-rich ultra-cool DZ white dwarfs residing at the end of the main white dwarf cooling track in the different HRDs. We disagree with the suggestion of Kilic et al. (2020); Bergeron et al. (2022) that the observations provide evidence of spectral evolution towards strong H-atmosphere dominance for cool DC white dwarfs ( K).
7.4 Total age, mass and population membership
Using the we derived (Table 5) and the initial-to-final-mass relation (IFMR) from Cummings et al. (2018), we calculated the progenitor mass of WD J21474035 to be M⊙ with a main-sequence lifetime of 0.5 Gyr, with asymmetric error bars ranging from Gyr. We therefore found the total age to be Gyr which is Gyr above WD J23171830 (Hollands et al., 2021), the most massive object in our DZ subsample (Table 5).
Following the same procedure as for WD J21474035, we calculated an approximately solar progenitor mass of M⊙ for WD J19220233. The main-sequence lifetime of WD J19220233 for solar metallicity therefore has a median of 10.5 Gyr, ranging from 3.8 Gyr to surpassing the age of the universe (Hurley et al., 2000). Together with the cooling age (Table 5), we found the total age of WD J19220233 to be over 13.8 Gyr which is incompatible with the age of the Milky Way. We conclude that our current model underestimates the mass of WD J19220233, likely due to the physics of strong CIA not being fully understood and the uncertainties from our fits only being of a statistical nature, hence its total age remains unknown.
The of remnants with K are systematically lower444The average for the local 40 pc white dwarf volume sample is 0.66 M⊙ for K and 0.52 M⊙ for K (Gentile Fusillo et al., 2021). than those of warmer white dwarfs (Bergeron et al., 2019; McCleery et al., 2020; Tremblay et al., 2020), which is inconsistent with the Galactic model prediction of white dwarfs cooling at constant mass (Tremblay et al., 2016). This is also the case where strong CIA is present, and likely associated with the physical uncertainties that render their atmospheres notoriously challenging to model (e.g. Gianninas et al., 2015; Bergeron et al., 2022, and see Sections 4 and 7.1).
The stars in our DZ subsample also suggest underestimations. Three subsample stars have which is not possible from single stellar evolution so these masses must be underestimated (Cummings et al., 2018). Combined with the uncertainties from our fits and existing published ones being of a statistical nature so the real uncertainties are likely larger, it is probable the derived masses of our DZ subsample are low estimates. Although, even if the of WD J21474035 was underestimated by , this would only make the total age smaller by Gyr, given the large cooling age and short main-sequence lifetime. Therefore, WD J21474035 is unambiguously one of the oldest known metal-polluted white dwarfs.
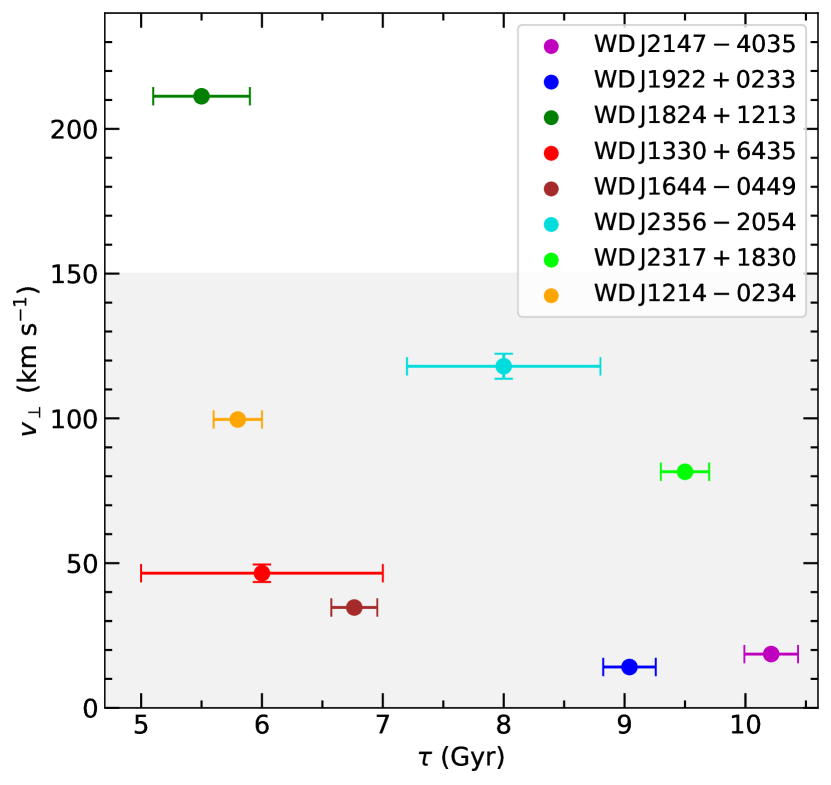
To understand the population membership of the DZ subsample, we calculated the tangential velocity () of each white dwarf using the method described in McCleery et al. (2020) and show the results in Table 1 and Figure 6 as a function of cooling age (). WD J21474035 has km s-1 and WD J19220233 has km s-1. All but one remnant have km s-1 suggesting they are Galactic disc candidates (Gianninas et al., 2015). We do not differentiate between thick and thin disc membership in this work, we instead treat them as one Galactic disc population. WD J18241213 has a significantly higher than the other objects and, together with its relatively small of Gyr, is our only Galactic halo candidate – this conclusion was also drawn by Hollands et al. (2021) and Kilic et al. (2019). Assuming that halo membership makes it the oldest object in the subsample, it requires a large main-sequence lifetime. This is consistent with WD J18241213 having the lowest in Table 5.
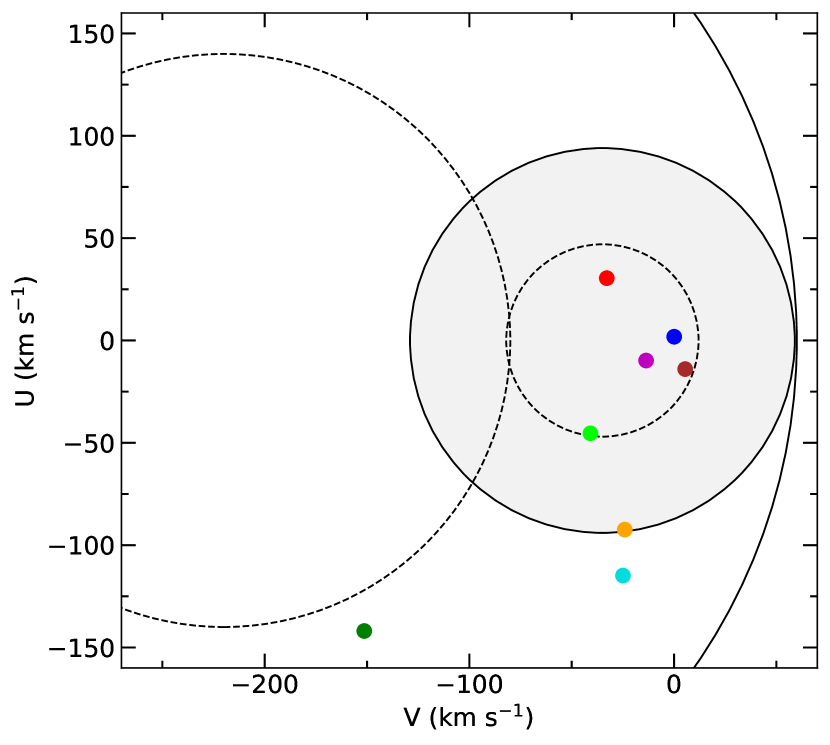
To further analyse the population membership of our DZ subsample, we transformed their into Galactic velocity components , and , which indicate motion radially away from the Galactic center, in the direction of the Galaxy’s rotation and perpendicular to the disc, respectively, using Gaia EDR3 astrometry and corrected parallaxes from Table 1; we present the velocity component values there also. These velocity components are computed in Hollands et al. (2021) for WD J18241213, WD J13306435, WD J12140234 and WD J23171830 using Gaia DR2 astrometry so updated measurements are reported here. We assumed zero radial velocity in our calculations following standard practices (Hollands et al., 2021; Kaiser et al., 2021) and due to uncertainties in the gravitational redshift corrections from the mass uncertainties. We rely on the previous study of Oppenheimer et al. (2001a) to analyse the velocity dispersions of our subsample and assess their or disc or halo membership. We plot our results in Figure 6, where the largest dashed and solid ellipses encapsulate the velocity dispersions consistent with the Galaxy’s halo up to and , respectively. The shaded region represents velocity dispersions consistent with the Galaxy’s disc up to (dashed ellipsis) and (solid ellipsis). WD J18241213 is a likely halo candidate as it has velocity components consistent with velocity dispersions of the Galaxy’s halo. WD J21474035, WD J19220233, WD J13306435, WD J16440449 and WD J23171830 have velocity components consistent with at least of the Galaxy’s disc hence likely have disc membership. The membership conclusions for the above five subsample objects are consistent with those drawn from their . WD J23562054 and WD J12140234 both have an uncertain disc or halo membership allocation in vs. space, yet their indicates disc membership.
We measured the wavelength shift of the lithium spectral line central component in WD J21474035 and the sodium spectral line in WD J19220233 compared to rest wavelengths and calculated the line velocities of each star as km s-1 and km s-1, respectively. Despite uncertainties in the calculations, we corrected for each star’s gravitational redshift to determine radial velocities, , of km s-1 for WD J21474035 and km s-1 for WD J19220233. Accounting for in the calculations of , and for WD J21474035 and WD J19220233, both stars still indicate Galactic disc membership.
We do not include the total ages of WD J21474035 and WD J19220233 in our membership assessment because previous estimates of the Galactic disc age from white dwarfs (Winget et al., 1987; Kilic et al., 2017) are thought to be underestimated due to 22Ne dilution cooling delays (Tremblay et al., 2019; Blouin et al., 2020; Kilic et al., 2020) being omitted from earlier crystallisation calculations. Nevertheless, both white dwarfs could be utilised in future studies for constraining an upper age limit for the disc of the Milky Way.
7.5 Accreted planetary debris
| WD J21474035 | WD J19220233 | |||||
| Z | ||||||
| Li | 13.20 0.20 | 4.14 | 0.699 | < 13.60 | 9.21 | 0.55 |
| C | 14.69 | 3.84 | 0.04 | 14.58 | 8.73 | 0.10 |
| O | 11.63 | 2.76 | 59.94 | 11.38 | 6.38 | 209.34 |
| Na | 13.10 0.20 | 1.70 | 2.92 | 12.60 0.20 | 4.01 | 18.11 |
| Mg | 12.00 | 1.68 | 38.79 | 12.73 | 3.97 | 14.19 |
| Al | 12.61 | 1.44 | 10.59 | < 12.65 | 3.43 | 18.92 |
| Si | 12.10 | 1.44 | 35.63 | 11.61 | 3.44 | 216.20 |
| K | 12.90 0.20 | 0.97 | 7.87 | 13.10 0.20 | 2.35 | 9.75 |
| Ca | < 13.20 | 0.97 | 4.04 | 13.96 0.20 | 2.35 | 1.38 |
| Fe | 13.14 | 0.64 | 6.47 | < 12.23 | 1.57 | 103.01 |
| log() | 5.32 | 4.95 | ||||
| g | g | |||||
| g | g | |||||
Relative metal abundances measured in the atmospheres of metal-polluted white dwarfs using spectral fitting (Section 6) inform us of the bulk compositions of debris accreted from planetary systems. However, atmospheric abundance ratios change over time due to atomic diffusion causing metals to settle from the bottom of the convection zone (CVZ) to the interior. The abundance evolution history of DZ stars can be traced backwards in time by taking into account the diffusion (sinking) timescales () of individual elements, which each have different rates of diffusion. Cool DZ stars have long which is the primary mechanism responsible for the long-term evolution of atmospheric abundances, yet the of all elements are many orders of magnitude shorter than white dwarf cooling ages (Koester, 2009). Therefore, the observation of metal lines in the atmospheres of white dwarfs requires recent or active accretion (Vauclair et al., 1979).
Accretion episodes are typically described as three simplified phases (Koester, 2009): the increasing state, where material is actively accreted into the white dwarf photosphere so its atmospheric composition initially resembles that of the debris as it is instantaneously mixed throughout the CVZ, then the composition diverges as metals diffuse at their individual diffusion velocities through the bottom of the CVZ; steady-state, or accretion-diffusion equilibrium, which is reached if the duration of the accretion event extends over several diffusion timescales; and the decreasing state, where accretion has stopped and the atmospheric abundances exponentially decrease according to the individual diffusion time scales of each metal.
Based on our abundance analysis (see Section 7.5.1), we assume that WD J21474035 and WD J19220233 are not currently accreting but have instead retained debris from an earlier accretion event. Therefore, we proceed with our analysis on the assumption that both white dwarfs have stopped accreting (i.e. are in the decreasing phase).
A lower limit of the accreted parent body mass () can be constrained by the sum over all individual metal masses () currently contained in the CVZ, as this measurement is independent of the accretion state (Izquierdo et al., 2021). We used the envelope code described in Koester et al. (2020) to compute , the fractional CVZ mass () and the mass fraction of each metal included in the model atmospheres of WD J21474035 and WD J19220233 according to the photospheric abundance, and included convective overshoot (Cunningham et al., 2019) with a pressure scale height () of one. Details on the physics and methods used in the envelope code can be found in Koester et al. (2020), but most important to note for this work is that the boundary conditions for the envelope integration were taken from the atmosphere models at a Rosseland optical depth of . At this depth, the ionisation is significantly higher than in the photosphere () and CIA opacity is much less important. Therefore the diffusion timescales and fluxes in our final model atmosphere, as well as for our atmosphere model without any CIA absorption, differed very little. Uncertainties in the CIA treatment were hence negligible for these diffusion data.
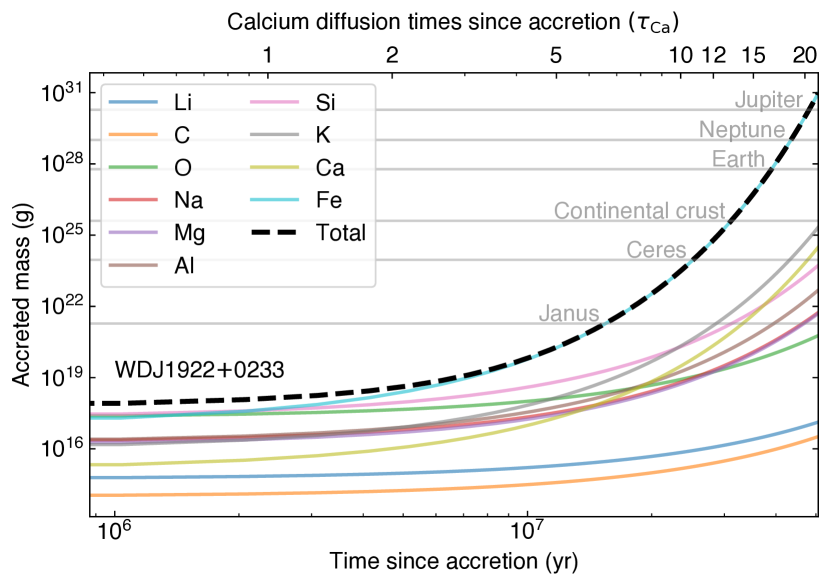
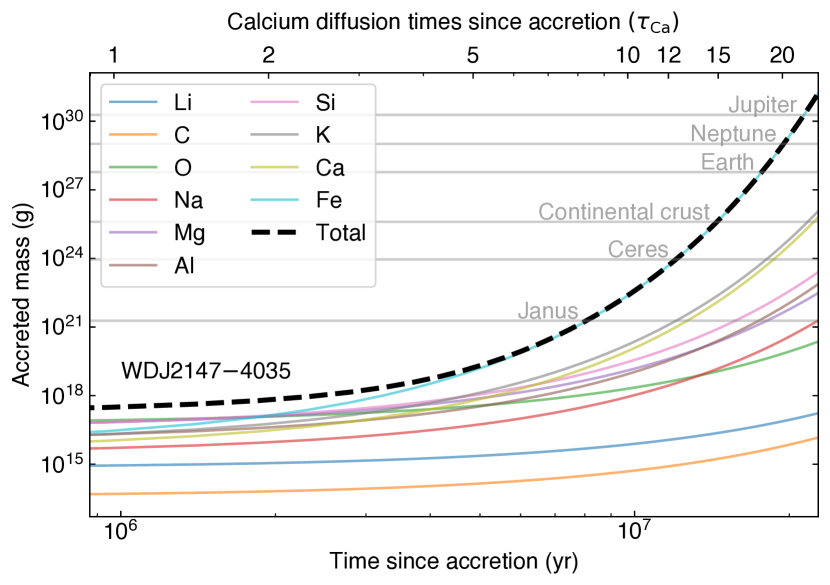
The resulting parameters computed with our envelope code are listed in Table 7. For metals with observationally determined upper limits (see Table 7), we computed at the abundance of their upper limits. The evolution of for each metal is shown by the coloured solid lines in Figure 7 as a function of time and calcium diffusion times () since accretion ceased.
is shown by the black dashed line in Figure 7 for each white dwarf. Based on the current atmospheric abundances in both stars, we estimated WD J21474035 has g and WD J19220233 has g at the present time. The mass of the accreted parent body increases exponentially with time elapsed since accretion stopped so this imposes an upper limit on the amount of diffusion times we can go back for each white dwarf; the bigger total mass the parent body has, the less likely it becomes that it could have been accreted. Therefore, it is unlikely that Neptune or Jupiter mass debris accreted onto WD J21474035 or WD J19220233. Also, the elemental abundances found in the atmospheres of these two stars (Table 6) are inconsistent with those of gas planets. We placed upper limits on , and therefore , on WD J21474035 of approximately Earth mass () and WD J19220233 of approximately continental crust mass (), due to the atmospheric chemical abundance ratios found in this star being most consistent with the Earth crust when considering the cessation of accretion (see Section 7.5.1).
We also determined the mass of hydrogen in the CVZ () for both DZ stars, however the fraction of hydrogen mass accreted from planetary debris compared to that of a primordial origin from cannot be unambiguously assigned. Thus, the mass of accreted hydrogen is not considered in . Instead, is reported for both DZ stars in Table 7, in addition to and .
7.5.1 Atmospheric chemical abundance ratios
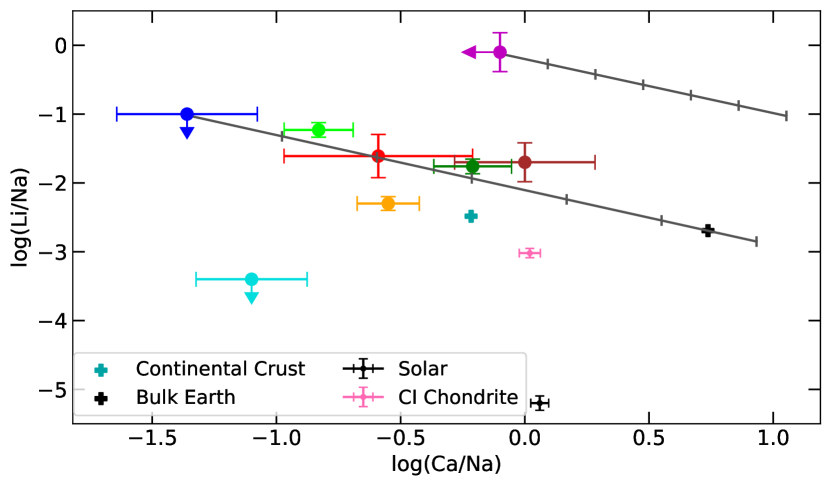
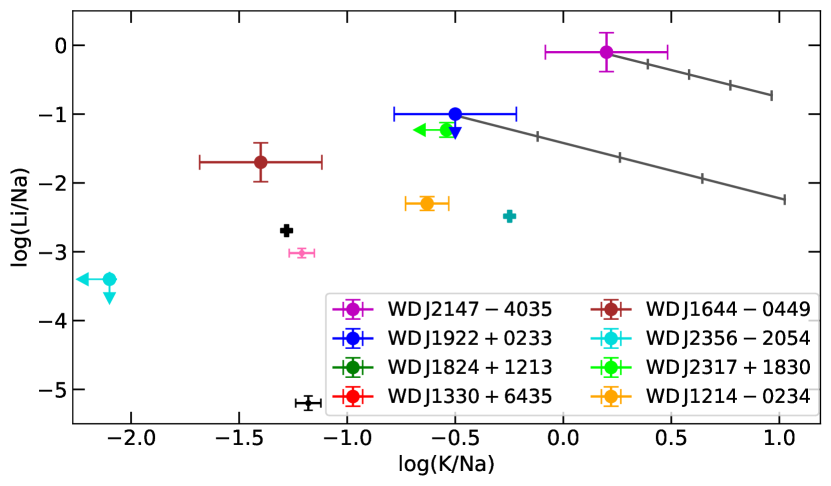
To determine the elemental composition of the planetary debris which accreted onto WD J21474035 and WD J19220233, we calculated the current atmospheric abundance ratios (or observational upper limits) of , and (see Section 6) and compared them with Solar System benchmarks of bulk Earth (McDonough, 2000), the continental crust (Rudnick & Gao, 2003), CI chondrites (Lodders, 2003) and solar abundances (Lodders, 2003) in Figure 8. The other DZ stars in our subsample are included for context in Figure 8 with their published values shown in Table 6.
Our envelope code computed (see Section 7.5) for each metal in the CVZ of WD J21474035 and WD J19220233 (Table 7). Using the method outlined in Hollands et al. (2018), we calculated the abundance histories for , and of both stars to analyse their past abundance evolutions. These evolutionary tracks are indicated by diagonal grey lines in Figure 8 and are marked in intervals of 1 Myr for WD J21474035 and 5 Myr for WD J19220233, due to its much slower diffusion times. Since the relative metal abundances currently observed in the atmospheres of WD J21474035 and WD J19220233 are exotic in comparison to Solar System benchmarks (see Figure 8), and the fact it is not possible to know how long ago accretion ceased, we followed the evolutionary tracks of both stars to determine if their past atmospheric chemical abundance ratios represented parent bodies similar to the abundances of Solar System benchmarks after some elapsed diffusion times, while precluding to exceed the upper limits on we imposed on each star in Section 7.5. The abundance histories are not plotted for the other five published objects in our subsample (Hollands et al., 2021; Kaiser et al., 2021) but are comparable to the evolutionary tracks for WD J21474035 and WD J19220233.
Sodium produces the strongest absorption line in WD J21474035 and WD J19220233, yet these objects have the lowest abundances out of our DZ subsample (Table 6). The abundances for all white dwarfs in the subsample are similar or depleted compared to the Solar System benchmarks, with calcium not even being detected in WD J21474035. Solar System asteroids tend to have calcium to sodium ratios similar to unity or be slightly calcium-rich (e.g. Schramm et al., 1989; Zuckerman et al., 2007). The atmospheric diffusion of calcium out of the CVZ is more rapid than sodium, therefore to explain these abundances the accretion events must have occurred a long time ago for a large fraction of calcium to have diffused towards the white dwarf core and be currently undetectable. For WD J19220233 to have a abundance comparable to the crust, accretion must have ceased some diffusion times ago due to its significantly depleted current ratio.
Lithium is not detected in WD J19220233, though we derived a observational upper limit higher than Solar System benchmarks; however, its true value could be several 0.1 dex lower which would make the and abundances broadly consistent with the continental crust (Rudnick & Gao, 2003) if accretion ceased Myr ago. Providing the true ratio inside the star is similar to our derived upper limit, WD J19220233 has an extremely similar composition to bulk Earth if accretion stopped Myr ago (Figure 8). If debris with bulk Earth composition polluted WD J19220233 then its would have a comparable mass to the dwarf planet Ceres (Figure 7; McCord & Sotin, 2005). On the other hand, if a parent body with crust composition accreted Myr ago, it would have comparable to Saturn’s natural satellite Janus (Jacobson et al., 2008), which is orders of magnitude less massive than Ceres (Figure 7). The latter scenario is more likely as the recent accretion of smaller parent bodies is more probable than those of more massive bodies further in the past (Hollands et al., 2021). The accretion of a very small fraction of crust from an Earth-like planet is also probable as Earth’s continental crust has a mass g (Rudnick & Gao, 2003). WD J19220233 has a much higher abundance than bulk Earth which only enhances with diffusion timescales, yet approaches the region of continental crust abundance Myr ago, especially if the true lithium abundance is lower than the upper limit we derived. This decreases to orders of magnitude less massive than Janus and corresponds to an extremely small fraction of crust from an Earth-like planet. From the detected metals and corresponding past abundances in WD J19220233, we conclude it is probable that planetary bodies with crust-like compositions and consistent with, or orders of magnitude less than, Janus accreted Myr () ago onto WD J19220233. This conclusion motivated us to set the undetected metals in our model atmospheres to Earth crust (Rudnick & Gao, 2003) abundances relative to sodium (see Section 6). We note that this star has a observational upper limit 0.64 dex lower than the abundance found in the continental crust however this ratio increases to the continental crust value with elapsed diffusion timescales when considering accretion ceased in the past. Our atmospheric abundance assessment of WD J19220233 is based on current observations, yet additional follow-up spectroscopy could allow the calculation of more accurate observational upper limits and hence lead to a more conclusive debris analysis.
We also calculated the diffusion timescales of WD J19220233 using the , , and parameters computed by Bergeron et al. (2022) (see Section 5) to quantify the impact of this change on our accreted planetary debris conclusion. The interpretation of the abundance histories remains very similar, i.e. that planetary debris with a composition similar to the continental crust likely accreted onto WD J19220233 in the past. However, of each metal significantly decreased when using the Bergeron et al. (2022) atmospheric parameters, resulting in a much more recent accretion event by orders of magnitude.
Calcium is not detected in WD J21474035, yet the observational upper limit of we derived is slightly higher than continental crust (Rudnick & Gao, 2003) and could reduce to very similar values to the crust considering the true calcium abundance could be lower by several 0.1 dex. The current and abundances in WD J21474035 are significantly larger than the ratios found in Solar System benchmarks but are closest to continental crust composition. Accretion needed to have ceased Myr ago to deplete the lithium abundance in WD J21474035 to the approximate continental crust value, which would require a consistent with Earth’s continental crust (Figure 7). However, this would enhance to 3.31 dex higher than the ratio found in the crust. We also consider pollution via planetary debris enriched by primordial lithium, as in the Kaiser et al. (2021) scenario, in Section 7.5.2 to explain the high lithium abundance in WD J21474035, but we are not convinced this explains the high potassium abundance. The origin of carbon in this DZQH star is difficult to distinguish between accretion from external debris and convective dredge-up of core-carbon within the white dwarf, thus we omit carbon from our debris abundance analysis. We conclude the nature of planetary debris accreted by WD J21474035 remains elusive and more observations may be needed, including better limits on , to provide more clarity on how long ago the accretion event occurred. However, we do not discount the possibility of multiple accretion events with parent bodies of varying calcium, lithium and potassium abundances at different times in its history.
7.5.2 Primordial lithium enhancement in WDJ 21474035?
High abundances of lithium are predicted to have been produced during Big Bang Nucleosynthesis (BBN), which occurred minutes after the Big Bang (Hou et al., 2017). According to the Kaiser et al. (2021) scenario, the oldest stars and exoplanets would therefore be enriched by primordial lithium, which is then evident in the planetary debris observed in the atmospheres of the oldest white dwarfs.
WD J21474035 has a large total age of Gyr and we measured an extremely enhanced current atmospheric lithium abundance in this star, with a ratio 2.38 dex higher than the continental crust. However, WD J18241213 is a Galactic halo candidate with a likely large total age yet has a ratio 1.66 dex lower than WD J21474035. It is also unclear how this scenario could explain the extremely large ratio observed in WD J21474035 as potassium is not predicted to have been produced during BBN, but instead created in the cores of stars through stellar nucleosynthesis and dispersed throughout the Universe by supernovae (Audouze & Silk, 1995; Tominaga et al., 2007; Iliadis et al., 2016).
Observational detection limits and telluric lines from O2 absorption by the Earth’s atmosphere causes challenges and false-positives in the potassium detection of metal-poor stars with stellar spectroscopy (Takeda et al., 2002, 2009; Abohalima & Frebel, 2018). Stellar model predictions of in metal-poor stars thus tend to under-predict this ratio compared to stellar observations (e.g. Takeda et al., 2009), though studies have found relations between metallicity () and potassium abundance relative to the solar abundance (Gratton & Sneden, 1987a, b; Chen et al., 2000; Takeda et al., 2002; Cayrel et al., 2004; Beers & Christlieb, 2005; Tominaga et al., 2007; Takeda et al., 2009): an enhancement between dex from dex to dex for Galactic disc stars; then an approximately constant ratio at lower metallicities between dex consistent with halo stars; and a slight decrease in for the oldest, hence extremely metal-poor (EMP; dex) stars. Tominaga et al. (2007) report similar trends in the abundance relative to the solar abundance, but with an approximately constant abundance of dex for metallicities consistent with disc stars, a slight enhancement of dex for metallicities consistent with halo stars, then a decrease to dex in EMP stars.
Therefore, the largest enhancement of compared to the solar abundance is observed in EMP stars, although there are uncertainties in these studies. The enhancement of for EMP stars is still not high enough to explain the extreme ratio currently seen in WD J21474035, plus the kinematics of WD J21474035 are inconsistent with EMP stars. The only other stellar population with a abundance enhancement relative to the solar abundance is old disc stars ( dex), although this enhancement is dex too small to explain the abundance currently observed in WD J21474035.
8 Conclusions
We have presented new spectroscopic observations of the ultra-cool DZ white dwarfs WD J21474035 and WD J19220233. These two stars occupy unusual positions on HRDs compared to objects in the Gaia EDR3 white dwarf sample within 100 pc of the Sun and the SDSS footprint (Gentile Fusillo et al., 2021) and the cool DZ subsample. WD J21474035 presents very red photometry as it has a depleted atmospheric hydrogen content compared to WD J19220233 and therefore has much milder CIA. Conversely, WD J19220233 exhibits unusually blue colours relative to its magnitude in Pan-STARRS and Gaia EDR3 photometry for an ultra-cool star, due to strong atmospheric CIA causing the suppression of flux in the red optical and IR.
Our model atmosphere code used to fit WD J21474035 and WD J19220233 includes microphysics improvements in the non-ideal effects and treatment of CIA opacities, in addition to incorporating a reduction of the neutral line broadening of visible metals by an empirical factor of 100, compared to that of Koester (2010). This produced models that gave reasonable solutions for the observed spectroscopy and photometry of WD J21474035 and WD J19220233. Additional work still needs to be done to address uncertainties in the model atmospheres, such as understanding the behaviour of atoms and molecules at extreme atmospheric densities of to improve understanding of neutral line broadening and He-He-He CIA opacity, which would therefore improve future model atmospheres of ultra-cool DZ white dwarfs.
We found K for WD J21474035 and K for WD J19220233, revealing them as the coolest and second coolest DZ white dwarfs known to date, respectively. WD J21474035 is also the intrinsically faintest confirmed white dwarf in the optical within the 40 pc Gaia sample (O’Brien et al., in preparation). The best-fitting abundance ratio of WD J19220233 is close to the maximum intensity of H2-He CIA which is consistent with observations of strong atmospheric CIA opacity in this white dwarf. The cooling age of WD J19220233 is Gyr however its total age remains unknown because our model likely underestimated its mass, resulting in an unrealistically large main-sequence lifetime. WD J21474035 has a cooling age of Gyr which is the largest known for a metal-polluted white dwarf. As this star does not show evidence of strong CIA, we were able to derive a total age for WD J21474035 of Gyr. The kinematics of WD J21474035 and WD J19220233 suggest they are both Galactic disc candidates.
Strong sodium absorption lines are detected in WD J21474035 and WD J19220233, similar to the other white dwarfs in our DZ subsample. We also have firm detections of calcium in WD J19220233, lithium in WD J21474035 and potassium in both objects. We found WD J21474035 is magnetic due to the observed lithium spectral line being Zeeman split into three components and found a best-fitting magnetic field strength of MG. Furthermore, we detected a photometric period of h in the TESS FFI light curves of this star. Carbon is tentatively detected in WD J21474035 due to an excellent fit of the three strongest C2 Swan band systems when distorted to the centroid wavelengths measured in the DQpecP star LP 35142, but further observations are needed to constrain the atmospheric carbon abundance. We assigned the spectral type DZQH to WD J21474035.
The current abundance in WD J19220233 is extremely low compared to Solar System benchmarks of continental crust, bulk Earth, solar and CI chondrites. However, considering the possibility that the accretion of debris onto this star has ceased, the past and compositions approach similar values to Earth’s continental crust Myr ago – especially if the true abundance of is lower than the relatively high observational upper limit we derived. This is also true for the and abundances in WD J19220233 from the accretion of a planetary body Myr ago. The cessation of accretion Myr ago corresponds to an accreted minimum parent body mass consistent with, or orders of magnitude less than, Janus, or an extremely small mass fraction of continental crust from an Earth-like planet. The detected metals and minimum parent body mass suggest this star was likely polluted by the accretion of planetary debris with a crust-like composition Myr ago.
We find WD J21474035 has extremely enhanced and abundances compared to Solar System benchmarks. Tracing the abundance evolution history of this star reveals many diffusion times are required to deplete the abundance of to broadly approach the continental crust ratio, however would consequently increase to currently inexplicable values. Follow-up spectroscopy of WD J21474035 is required to further constrain the accretion history of this old, ultra-cool, magnetic, metal- and carbon-polluted white dwarf.
Acknowledgements
This research received funding from the European Research Council under the European Union’s Horizon 2020 research and innovation programme number 101002408 (MOS100PC), the Leverhulme Trust Grant (ID RPG-2020-366) and the UK STFC consolidated grant ST/T000406/1. Based on observations collected at the European Southern Observatory under ESO programme 105.20ET.001. This work has made use of data from the European Space Agency (ESA) mission Gaia (https://www.cosmos.esa.int/gaia), processed by the Gaia Data Processing and Analysis Consortium (DPAC, https://www.cosmos.esa.int/web/gaia/dpac/consortium). Funding for the DPAC has been provided by national institutions, in particular the institutions participating in the Gaia Multilateral Agreement. The Pan-STARRS1 Surveys (PS1) and the PS1 public science archive have been made possible through contributions by the Institute for Astronomy, the University of Hawaii, the Pan-STARRS Project Office, the Max-Planck Society and its participating institutes, the Max Planck Institute for Astronomy, Heidelberg and the Max Planck Institute for Extraterrestrial Physics, Garching, The Johns Hopkins University, Durham University, the University of Edinburgh, the Queen’s University Belfast, the Harvard-Smithsonian Center for Astrophysics, the Las Cumbres Observatory Global Telescope Network Incorporated, the National Central University of Taiwan, the Space Telescope Science Institute, the National Aeronautics and Space Administration under Grant No. NNX08AR22G issued through the Planetary Science Division of the NASA Science Mission Directorate, the National Science Foundation Grant No. AST-1238877, the University of Maryland, Eotvos Lorand University (ELTE), the Los Alamos National Laboratory, and the Gordon and Betty Moore Foundation. This paper includes data collected by the TESS mission. Funding for the TESS mission is provided by the NASA’s Science Mission Directorate.
Data Availability
All data underlying this paper are publicly available from the relevant survey archives. The model atmospheres used in this paper are available upon reasonable request of the author, however the Koester model atmosphere codes and envelope codes are not publicly available.
References
- Abbott et al. (2018) Abbott T. M. C., et al., 2018, ApJS, 239, 18
- Abel et al. (2011) Abel M., Frommhold L., Li X., Hunt K. L. C., 2011, Journal of Physical Chemistry A, 115, 6805
- Abel et al. (2012) Abel M., Frommhold L., Li X., Hunt K. L. C., 2012, J. Chem. Phys., 136, 044319
- Abohalima & Frebel (2018) Abohalima A., Frebel A., 2018, ApJS, 238, 36
- Althaus et al. (2010) Althaus L. G., Córsico A. H., Isern J., García-Berro E., 2010, A&ARv, 18, 471
- Apps et al. (2021) Apps K., Smart R. L., Silvotti R., 2021, Research Notes of the American Astronomical Society, 5, 229
- Audouze & Silk (1995) Audouze J., Silk J., 1995, ApJ, 451, L49
- Baranger (1962) Baranger M., 1962, edited by DR Bates, Academic Press, New York
- Bédard et al. (2020) Bédard A., Bergeron P., Brassard P., Fontaine G., 2020, ApJ, 901, 93
- Beers & Christlieb (2005) Beers T. C., Christlieb N., 2005, ARA&A, 43, 531
- Bergeron & Leggett (2002) Bergeron P., Leggett S. K., 2002, ApJ, 580, 1070
- Bergeron et al. (1994) Bergeron P., Ruiz M.-T., Leggett S. K., Saumon D., Wesemael F., 1994, ApJ, 423, 456
- Bergeron et al. (1997) Bergeron P., Ruiz M. T., Leggett S. K., 1997, ApJS, 108, 339
- Bergeron et al. (2019) Bergeron P., Dufour P., Fontaine G., Coutu S., Blouin S., Genest-Beaulieu C., Bédard A., Rolland B., 2019, ApJ, 876, 67
- Bergeron et al. (2022) Bergeron P., Kilic M., Blouin S., Bédard A., Leggett S. K., Brown W. R., 2022, ApJ, 934, 36
- Blouin et al. (2017) Blouin S., Kowalski P. M., Dufour P., 2017, ApJ, 848, 36
- Blouin et al. (2018a) Blouin S., Dufour P., Allard N. F., 2018a, ApJ, 863, 184
- Blouin et al. (2018b) Blouin S., Dufour P., Allard N. F., Kilic M., 2018b, ApJ, 867, 161
- Blouin et al. (2019a) Blouin S., Dufour P., Allard N. F., Salim S., Rich R. M., Koopmans L. V. E., 2019a, ApJ, 872, 188
- Blouin et al. (2019b) Blouin S., Allard N. F., Leininger T., Gadéa F. X., Dufour P., 2019b, ApJ, 875, 137
- Blouin et al. (2019c) Blouin S., Dufour P., Thibeault C., Allard N. F., 2019c, ApJ, 878, 63
- Blouin et al. (2020) Blouin S., Daligault J., Saumon D., Bédard A., Brassard P., 2020, A&A, 640, L11
- Borysow et al. (2001) Borysow A., Jorgensen U. G., Fu Y., 2001, J. Quant. Spectrosc. Radiative Transfer, 68, 235
- Brinkworth et al. (2013) Brinkworth C. S., Burleigh M. R., Lawrie K., Marsh T. R., Knigge C., 2013, ApJ, 773, 47
- Cayrel et al. (2004) Cayrel R., et al., 2004, A&A, 416, 1117
- Cepa et al. (2000) Cepa J., et al., 2000, in Iye M., Moorwood A. F., eds, Society of Photo-Optical Instrumentation Engineers (SPIE) Conference Series Vol. 4008, Optical and IR Telescope Instrumentation and Detectors. pp 623–631, doi:10.1117/12.395520
- Cepa et al. (2003) Cepa J., et al., 2003, in Iye M., Moorwood A. F. M., eds, Society of Photo-Optical Instrumentation Engineers (SPIE) Conference Series Vol. 4841, Instrument Design and Performance for Optical/Infrared Ground-based Telescopes. pp 1739–1749, doi:10.1117/12.460913
- Chabrier & Potekhin (1998) Chabrier G., Potekhin A. Y., 1998, Phys. Rev. E, 58, 4941
- Chambers et al. (2016) Chambers K. C., et al., 2016, arXiv e-prints, p. arXiv:1612.05560
- Chen et al. (2000) Chen Y. Q., Nissen P. E., Zhao G., Zhang H. W., Benoni T., 2000, A&AS, 141, 491
- Cummings et al. (2018) Cummings J. D., Kalirai J. S., Tremblay P. E., Ramirez-Ruiz E., Choi J., 2018, ApJ, 866, 21
- Cunningham et al. (2019) Cunningham T., Tremblay P.-E., Freytag B., Ludwig H.-G., Koester D., 2019, MNRAS, 488, 2503
- Cunningham et al. (2020) Cunningham T., Tremblay P.-E., Gentile Fusillo N. P., Hollands M., Cukanovaite E., 2020, MNRAS, 492, 3540
- Cunningham et al. (2022) Cunningham T., Wheatley P. J., Tremblay P.-E., Gänsicke B. T., King G. W., Toloza O., Veras D., 2022, Nature, 602, 219
- Dark Energy Survey Collaboration et al. (2016) Dark Energy Survey Collaboration et al., 2016, MNRAS, 460, 1270
- Dufour et al. (2017) Dufour P., Blouin S., Coutu S., Fortin-Archambault M., Thibeault C., Bergeron P., Fontaine G., 2017, in Tremblay P. E., Gaensicke B., Marsh T., eds, Astronomical Society of the Pacific Conference Series Vol. 509, 20th European White Dwarf Workshop. p. 3 (arXiv:1610.00986)
- Fantin et al. (2019) Fantin N. J., et al., 2019, ApJ, 887, 148
- Fantin et al. (2020) Fantin N. J., Côté P., McConnachie A. W., 2020, ApJ, 900, 139
- Farihi et al. (2010) Farihi J., Barstow M. A., Redfield S., Dufour P., Hambly N. C., 2010, MNRAS, 404, 2123
- Flaugher et al. (2015) Flaugher B., et al., 2015, AJ, 150, 150
- Flewelling et al. (2020) Flewelling H. A., et al., 2020, ApJS, 251, 7
- Fontaine et al. (2001) Fontaine G., Brassard P., Bergeron P., 2001, PASP, 113, 409
- Fouesneau et al. (2019) Fouesneau M., Rix H.-W., von Hippel T., Hogg D. W., Tian H., 2019, ApJ, 870, 9
- Freudling et al. (2013) Freudling W., Romaniello M., Bramich D. M., Ballester P., Forchi V., García-Dabló C. E., Moehler S., Neeser M. J., 2013, A&A, 559, A96
- Gaia Collaboration et al. (2016) Gaia Collaboration et al., 2016, A&A, 595, A1
- Gaia Collaboration et al. (2021) Gaia Collaboration et al., 2021, A&A, 649, A1
- Gänsicke et al. (2012) Gänsicke B. T., Koester D., Farihi J., Girven J., Parsons S. G., Breedt E., 2012, MNRAS, 424, 333
- Gentile Fusillo et al. (2019) Gentile Fusillo N. P., et al., 2019, MNRAS, 482, 4570
- Gentile Fusillo et al. (2020) Gentile Fusillo N. P., Tremblay P.-E., Bohlin R. C., Deustua S. E., Kalirai J. S., 2020, MNRAS, 491, 3613
- Gentile Fusillo et al. (2021) Gentile Fusillo N. P., et al., 2021, MNRAS, 508, 3877
- Gianninas et al. (2015) Gianninas A., Curd B., Thorstensen J. R., Kilic M., Bergeron P., Andrews J. J., Canton P., Agüeros M. A., 2015, MNRAS, 449, 3966
- Graham et al. (1990) Graham J. R., Matthews K., Neugebauer G., Soifer B. T., 1990, ApJ, 357, 216
- Gratton & Sneden (1987a) Gratton R. G., Sneden C., 1987a, A&AS, 68, 193
- Gratton & Sneden (1987b) Gratton R. G., Sneden C., 1987b, A&A, 178, 179
- Griem (1960) Griem H. R., 1960, ApJ, 132, 883
- Griem (1974) Griem H. R., 1974, Spectral line broadening by plasmas. Academic Press
- Gustafsson & Frommhold (2001) Gustafsson M., Frommhold L., 2001, ApJ, 546, 1168
- Gustafsson & Frommhold (2003) Gustafsson M., Frommhold L., 2003, A&A, 400, 1161
- Hall & Maxwell (2008) Hall P. B., Maxwell A. J., 2008, ApJ, 678, 1292
- Hansen (1998) Hansen B. M. S., 1998, Nature, 394, 860
- Hollands et al. (2018) Hollands M. A., Gänsicke B. T., Koester D., 2018, MNRAS, 477, 93
- Hollands et al. (2021) Hollands M. A., Tremblay P.-E., Gänsicke B. T., Koester D., Gentile-Fusillo N. P., 2021, Nature Astronomy, 5, 451
- Hou et al. (2017) Hou S. Q., He J. J., Parikh A., Kahl D., Bertulani C. A., Kajino T., Mathews G. J., Zhao G., 2017, ApJ, 834, 165
- Hummer & Mihalas (1988) Hummer D. G., Mihalas D., 1988, ApJ, 331, 794
- Hurley et al. (2000) Hurley J. R., Pols O. R., Tout C. A., 2000, MNRAS, 315, 543
- Iliadis et al. (2016) Iliadis C., Karakas A. I., Prantzos N., Lattanzio J. C., Doherty C. L., 2016, ApJ, 818, 98
- Izquierdo et al. (2021) Izquierdo P., Toloza O., Gänsicke B. T., Rodríguez-Gil P., Farihi J., Koester D., Guo J., Redfield S., 2021, MNRAS, 501, 4276
- Jacobson et al. (2008) Jacobson R. A., Spitale J., Porco C. C., Beurle K., Cooper N. J., Evans M. W., Murray C. D., 2008, AJ, 135, 261
- Johnson (1927) Johnson R. C., 1927, Philosophical Transactions of the Royal Society of London Series A, 226, 157
- Jørgensen et al. (2000) Jørgensen U. G., Hammer D., Borysow A., Falkesgaard J., 2000, A&A, 361, 283
- Jura (2003) Jura M., 2003, ApJ, 584, L91
- Jura & Young (2014) Jura M., Young E. D., 2014, Annual Review of Earth and Planetary Sciences, 42, 45
- Kaiser et al. (2021) Kaiser B. C., Clemens J. C., Blouin S., Dufour P., Hegedus R. J., Reding J. S., Bédard A., 2021, Science, 371, 168
- Kausch et al. (2015) Kausch W., et al., 2015, A&A, 576, A78
- Kilic et al. (2006) Kilic M., et al., 2006, AJ, 131, 582
- Kilic et al. (2010) Kilic M., et al., 2010, ApJS, 190, 77
- Kilic et al. (2017) Kilic M., Munn J. A., Harris H. C., von Hippel T., Liebert J. W., Williams K. A., Jeffery E., DeGennaro S., 2017, ApJ, 837, 162
- Kilic et al. (2019) Kilic M., Bergeron P., Dame K., Hambly N. C., Rowell N., Crawford C. L., 2019, MNRAS, 482, 965
- Kilic et al. (2020) Kilic M., Bergeron P., Kosakowski A., Brown W. R., Agüeros M. A., Blouin S., 2020, ApJ, 898, 84
- Klein et al. (2010) Klein B., Jura M., Koester D., Zuckerman B., Melis C., 2010, ApJ, 709, 950
- Koester (2009) Koester D., 2009, A&A, 498, 517
- Koester (2010) Koester D., 2010, Mem. Soc. Astron. Italiana, 81, 921
- Koester et al. (2014) Koester D., Gänsicke B. T., Farihi J., 2014, A&A, 566, A34
- Koester et al. (2020) Koester D., Kepler S. O., Irwin A. W., 2020, A&A, 635, A103
- Kolb & Griem (1958) Kolb A. C., Griem H., 1958, Phys. Rev., 111, 514
- Kowalski (2006) Kowalski P. M., 2006, ApJ, 641, 488
- Kowalski (2010) Kowalski P. M., 2010, A&A, 519, L8
- Kowalski (2014) Kowalski P. M., 2014, A&A, 566, L8
- Kowalski & Saumon (2004) Kowalski P. M., Saumon D., 2004, ApJ, 607, 970
- Lam et al. (2020) Lam M. C., Hambly N. C., Lodieu N., Blouin S., Harvey E. J., Smith R. J., Gálvez-Ortiz M. C., Zhang Z. H., 2020, MNRAS, 493, 6001
- Liebert et al. (1978) Liebert J., Angel J. R. P., Stockman H. S., Beaver E. A., 1978, ApJ, 225, 181
- Lindegren et al. (2021) Lindegren L., et al., 2021, A&A, 649, A2
- Lodders (2003) Lodders K., 2003, ApJ, 591, 1220
- López-Sanjuan et al. (2022) López-Sanjuan C., et al., 2022, A&A, 658, A79
- Marocco et al. (2021) Marocco F., et al., 2021, ApJS, 253, 8
- McCleery et al. (2020) McCleery J., et al., 2020, MNRAS, 499, 1890
- McCook & Sion (1999) McCook G. P., Sion E. M., 1999, ApJS, 121, 1
- McCord & Sotin (2005) McCord T. B., Sotin C., 2005, Journal of Geophysical Research: Planets, 110
- McDonough (2000) McDonough W., 2000, in Teisseyre R. & Majewski E., ed., International Geophysics, Earthquake Thermodynamics and Phase Transformation in the Earth’s Interior, 1st edn, Elsevier Science Academic Press, Chapt. 1 - The Composition of the Earth, pp 5–24
- McMahon et al. (2013) McMahon R. G., Banerji M., Gonzalez E., Koposov S. E., Bejar V. J., Lodieu N., Rebolo R., VHS Collaboration 2013, The Messenger, 154, 35
- Mestel (1952) Mestel L., 1952, MNRAS, 112, 583
- Mozer & Baranger (1960) Mozer B., Baranger M., 1960, Phys. Rev., 118, 626
- Nur et al. (2015) Nur M., Bonifaci N., Denat A., Atrazhev V. M., 2015, in Journal of Physics Conference Series. p. 012055, doi:10.1088/1742-6596/622/1/012055
- Oppenheimer et al. (2001a) Oppenheimer B. R., Hambly N. C., Digby A. P., Hodgkin S. T., Saumon D., 2001a, Science, 292, 698
- Oppenheimer et al. (2001b) Oppenheimer B. R., et al., 2001b, ApJ, 550, 448
- Paquette et al. (1986) Paquette C., Pelletier C., Fontaine G., Michaud G., 1986, ApJS, 61, 197
- Potekhin & Chabrier (2000) Potekhin A. Y., Chabrier G., 2000, Phys. Rev. E, 62, 8554
- Press et al. (1986) Press W. H., Flannery B. P., Teukolsky S. A., 1986, Numerical recipes. The art of scientific computing. Cambridge University Press
- Raddi et al. (2015) Raddi R., Gänsicke B. T., Koester D., Farihi J., Hermes J. J., Scaringi S., Breedt E., Girven J., 2015, MNRAS, 450, 2083
- Rebassa-Mansergas et al. (2021) Rebassa-Mansergas A., et al., 2021, MNRAS, 505, 3165
- Ricker et al. (2014) Ricker G. R., et al., 2014, in Oschmann Jacobus M. J., Clampin M., Fazio G. G., MacEwen H. A., eds, Society of Photo-Optical Instrumentation Engineers (SPIE) Conference Series Vol. 9143, Space Telescopes and Instrumentation 2014: Optical, Infrared, and Millimeter Wave. p. 914320 (arXiv:1406.0151), doi:10.1117/12.2063489
- Rowell (2013) Rowell N., 2013, MNRAS, 434, 1549
- Rudnick & Gao (2003) Rudnick R. L., Gao S., 2003, Treatise on Geochemistry, 3, 659
- Saumon et al. (1995) Saumon D., Chabrier G., van Horn H. M., 1995, ApJS, 99, 713
- Schmidt et al. (1995) Schmidt G. D., Bergeron P., Fegley B., 1995, ApJ, 443, 274
- Schmidt et al. (1999) Schmidt G. D., Liebert J., Harris H. C., Dahn C. C., Leggett S. K., 1999, ApJ, 512, 916
- Schramm et al. (1989) Schramm L. S., Brownlee D. E., Wheelock M. M., 1989, Meteoritics, 24, 99
- Sion et al. (1983) Sion E. M., Greenstein J. L., Landstreet J. D., Liebert J., Shipman H. L., Wegner G. A., 1983, ApJ, 269, 253
- Smette et al. (2015) Smette A., et al., 2015, A&A, 576, A77
- Smith et al. (1969) Smith E. W., Cooper J., Vidal C. R., 1969, Physical Review, 185, 140
- Takeda et al. (2002) Takeda Y., Zhao G., Chen Y.-Q., Qiu H.-M., Takada-Hidai M., 2002, PASJ, 54, 275
- Takeda et al. (2009) Takeda Y., Kaneko H., Matsumoto N., Oshino S., Ito H., Shibuya T., 2009, PASJ, 61, 563
- Tominaga et al. (2007) Tominaga N., Umeda H., Nomoto K., 2007, ApJ, 660, 516
- Tremblay et al. (2014) Tremblay P. E., Kalirai J. S., Soderblom D. R., Cignoni M., Cummings J., 2014, ApJ, 791, 92
- Tremblay et al. (2016) Tremblay P. E., Cummings J., Kalirai J. S., Gänsicke B. T., Gentile-Fusillo N., Raddi R., 2016, MNRAS, 461, 2100
- Tremblay et al. (2019) Tremblay P.-E., et al., 2019, Nature, 565, 202
- Tremblay et al. (2020) Tremblay P. E., et al., 2020, MNRAS, 497, 130
- Vauclair et al. (1979) Vauclair G., Vauclair S., Greenstein J. L., 1979, A&A, 80, 79
- Veras et al. (2014) Veras D., Leinhardt Z. M., Bonsor A., Gänsicke B. T., 2014, MNRAS, 445, 2244
- Vernet et al. (2011) Vernet J., et al., 2011, A&A, 536, A105
- Voslamber (1969) Voslamber D., 1969, Zeitschrift für Naturforschung A, 24, 1458
- Winget et al. (1987) Winget D. E., Hansen C. J., Liebert J., van Horn H. M., Fontaine G., Nather R. E., Kepler S. O., Lamb D. Q., 1987, ApJ, 315, L77
- Wright et al. (2010) Wright E. L., et al., 2010, AJ, 140, 1868
- York et al. (2000) York D. G., et al., 2000, AJ, 120, 1579
- Zuckerman et al. (2003) Zuckerman B., Koester D., Reid I. N., Hünsch M., 2003, ApJ, 596, 477
- Zuckerman et al. (2007) Zuckerman B., Koester D., Melis C., Hansen B. M., Jura M., 2007, ApJ, 671, 872
- Zuckerman et al. (2010) Zuckerman B., Melis C., Klein B., Koester D., Jura M., 2010, ApJ, 722, 725