Nucleation of cadherin clusters on cell-cell interfaces
Abstract
Cadherins mediate cell-cell adhesion and help the cell determine its shape and function. Here we study collective cadherin organization and interactions within cell-cell contact areas, and find the cadherin density at which a ‘gas-liquid’ phase transition occurs, when cadherin monomers begin to aggregate into dense clusters. We use a 2D lattice model of a cell-cell contact area, and coarse-grain to the continuous number density of cadherin to map the model onto the Cahn-Hilliard coarsening theory. This predicts the density required for nucleation, the characteristic length scale of the process, and the number density of clusters. The analytical predictions of the model are in good agreement with experimental observations of cadherin clustering in epithelial tissues.
Introduction
Many eukaryotic cells use membrane-bound integrin adhesion clusters [1] to tether themselves to the extra-cellular matrix surrounding them (ECM). Similarly, these cells use membrane-bound cadherin adhesion clusters [2, 3, 4] to bind to their neighbouring cells directly. Adhesion molecules mediate mechanical signalling between the cell and its exterior by participating in important intracellular signalling pathways [5, 6, 7, 8]. Clusters of adhesion molecules also help determine the structure of the cell; these shape changes are essential if the cell is to topologically fit into a tissue (e.g. in dividing epithelia [9]), to change its function (fibroblasts differentiating into myofibroblasts when placed on stiff media [10, 11]), or to move (during wound healing [12, 13] or cancer metastasis [14, 15]). In order to understand why any of these processes occur, we must first understand why there are clusters of adhesion molecules at all – in physical terms, how their nucleation from a uniform distribution of sensors occurs.
Density-dependent nucleation is ubiquitous in soft matter. Changes in the concentration of attractively coupled molecules can help form large-scale symmetry-breaking structures. Computational studies have investigated the clustering of both integrin [16, 17] and cadherin [18, 19]. The classical theory of aggregation on fluctuating membranes [20, 21, 22] explains the unstable growth of nuclei into large-scale receptor domains (evident in low-resolution experiments), notably including the case of large cadherin domains on vesicles [23]. These effects are driven by the weak long-range forces mediated by membrane fluctuations, and cannot account for the stability of small nanometer-scale clusters of the kind recently identified in high-resolution cadherin imaging [24, 25]. We recently analytically investigated the nucleation of integrins in the high-concentration limit on the edge of a spreading cell [26]. Here, we extend this approach to the nucleation of such small punctate cadherin clusters on a generic cell-cell contact surface, stabilized by the strong short-range bonding between monomers.
We will first review background literature to examine the parallels between the aggregation of the types of adhesion molecules. Next, we build a lattice gas model to obtain the Ginzburg-Landau free energy for fluctuations in the density of cadherin molecules on the realistic 2D contact plane between cells. We consider whether our model correctly predicts the size and spacing of punctate adherens junctions seen in experiment.
Integrin/Cadherin analogy. The cell needs to develop adhesion clusters in order to correctly remodel its shape in response to external substrates and mechanical cues [27, 28]. The large clusters visible under microscope (called focal adhesions for integrins [10, 29], and zonula adherens for cadherin [30, 31]) are the end-product of many smaller clusters aggregating over minutes or hours.
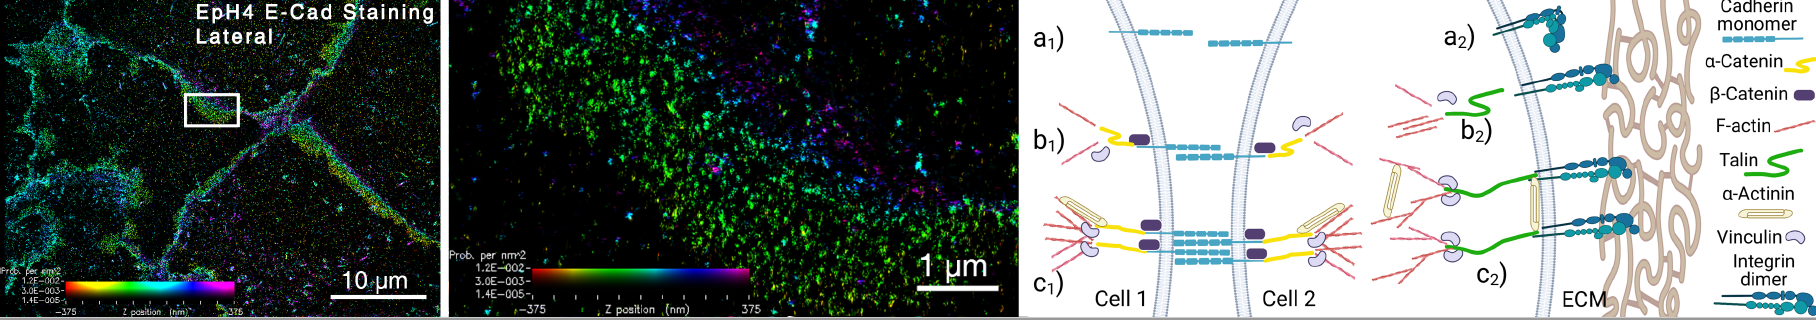
In order to be stabilized, both integrins [34] and cadherins [35] rely on ‘catch bonds’ [36], which strengthen under load. These bonds can help activate both molecules and are often preceded by the formation of a larger cytoplasmic protein complex which links an individual adhesion molecule to the cytoskeleton (see Fig. 1). Integrin uses talin and vinculin to bind to F-actin [37, 38], while cadherin primarily relies on catenins [39, 40]. After the protein complex is fully assembled, the acto-myosin cytoskeleton exerts pulling force on the adhesion molecule, strengthening the catch bond. Individual complexes can then aggregate into growing clusters, and link the cytoskeleton with the outside of the cell over a larger area, spreading the force applied by the actomyosin cortex [41, 42]. Provided that adhesion molecules cluster together in sufficient numbers to withstand the load, the cytoskeleton can develop increasingly large pulling forces and distort the shape of the cell [43].
Cadherins differ most notably from integrins in their ability to multimerise. Cadherins can form two types of bonds with other cadherins: trans bonds that link cadherins from two different cells [44, 45], which effectively mimic the integrin binding to extra-cellular matrix, and cis bonds that link neighbouring cadherins within the same cell, in the plane of the membrane. While integrins and cadherins might develop a very similar force-chain with the cytoskeleton in the direction normal to the cell membrane, their interactions within the plane of the cell membrane are fundamentally different. Whereas integrins appear to use secondary molecules to link to each other (possibly -actinin [46, 47, 48, 49]), cadherins bind directly to each other [50].
The distance between cadherin monomers in a loosely packed cadherin lattice is ca. nm [51, 52, 53], but can be as small as nm in very tightly packed junctions [54]; both of these figures are much smaller than the separation than between neighbouring integrins: ca. nm [55]. The cis bond strength can be estimated by extrapolating from measurements of cadherin trans bond strength and the dissociation rates of these bonds, as well as numerical simulations of cadherin clustering. Note that it is much faster than the dissociation of cadherins in well-developed adhesion junctions with many such bonds established [56].
Over the last ten years, the classical view has shifted from the idea that cis-dimerisation preceded trans-dimerisation [57]. The discovery of an intermediate crossed-dimer, called the X-dimer, which precedes a more stable swapped trans-dimerisation suggests that cis-dimerisation is not necessary for cadherins to form stable cross-membrane bonds [50, 51]. More recent work [58] suggests that cadherin cross-membrane dimers form before cis clustering occurs. This can be further quantified by examining recent work on the development of large adherent regions in giant unilamellar vesicles (GUVs). In particular, Fenz et al. [23] showed that cadherin trans-bonding, a characteristic of the extended adhesive region, spread from nucleation sites if membrane fluctuations were sufficiently small. In Supplementary Part A, we show that the size of membrane fluctuations within an adhesive region in a cell is much smaller than that required for adhesive regions to separate into separate domains in this model, based on the data from [59, 60]. This means that within an adhesive region, a large portion of cadherins are indeed within trans-bonded dimers (with on-rates s, given an intrinsic lifetime of s [35]). Lateral interactions between cadherin trans-bonded pairs are small in this model (a few at most), relying on membrane fluctuations to slowly and randomly bring cadherin pairs together. In contrast, small crystalline clusters of cadherin have been recently found [24, 25] (see Fig. 1), and these disappear if the cis-abolishing V81D/V175D mutation is introduced [51]. This means that while cadherin trans-interaction mediated by membrane fluctuations does lead to the development of the larger adhesive area, it is insufficient to help develop individual punctate cadherin adhesions.
Cadherin trans-bond strength has been suggested to be in the range -, substantially greater than the suggested for cis-bond [24]. The on-rates of trans bonds should therefore be - times greater than those of cis bonds, and we expect, as in much of the literature, for trans bonds to form before cis bonds. The problem then no longer needs to be resolved separately in both cells; rather, we need only look at the cis (in plane) clustering of the cadherin trans-dimers on the adhesion surface. Recent computational work by Yu et al. [61] (see their Figure 3.B) gives yet more credence to the idea that at both trans and cis-bonds are required to form punctate adherens junctions with substantial numbers of cadherins of the kind seen by Wu et al. [50], and that there is an optimum cis-bond strength for cluster formation of -. We take as a compromise value, given previous research suggesting that cis bond strength is smaller than trans [50].
The effective binding strength of the each cadherin trans-dimer unit to its neighbours is then twice as strong as the monomer value: . The remainder of this work will assume that all cadherins that will form clusters have trans-dimerised, and that the other cadherins do not impede the pair interaction.
To simplify terminology and to make the comparison with the aggregation of integrin complexes more apparent, we will henceforth use the term “adhesion complex” to denote a transmembrane cadherin trans-dimer, bound to catenin and to the actin cytoskeleton insoide each cell (Fig. 1). We seek to examine the initial nucleation of cadherin clusters revealed in super-resolution microscopy [24]. This occurs before the aggregation coarsens into large adherens junctions [62].
The model and methods
We recently showed [26] how attractively coupled integrin adhesion complexes modelled on a 1D lattice undergo a density-dependent phase transition if their initially high concentration decreases past a critical value as the lattice length increases while their number is held constant. This was to model the development of nascent focal adhesions during cell spreading and correctly predicted the number of adhesion clusters.
The analogy between integrin and cadherin bonding suggests that a lattice gas model might be applicable to the nucleation of cadherin clusters. However, the cell-cell interface is fundamentally 2D (as opposed to integrins concentrated on the rim of the contact area), and we will find that the transition here happens as density increases, more in line with a gas-liquid condensation (again, different from the integrin transition). Accordingly, we model the contact plane between two cells as a 2D lattice with Neumann boundary conditions, with a total number of lattice sites , and total area , with the lattice spacing or the distance between cadherin trans dimers. Changes in the density of cadherins are introduced by the adiabatic change the area of the lattice.
The Hamiltonian of the attractively coupled cadherin trans-bonded pairs is an adaptation of the Ising model:
| (1) |
where the sum is over nearest-neighbor pairs. The variable keeps track of the occupation number of each site:
| (2) |
The binding energy between two trans-dimerised cadherin adhesion complexes is double the monomer binding energy . We show in the Supplementary Materials that a cytoskeletal pulling force, contributiong to the Hamiltonian with a linear term , does not effect the size or distance between clusters, or the concentration at which aggregation begins.
In order to examine the spatial clustering of cadherins, we need to derive the Ginzburg-Landau action of the density distribution of cadherin units. In addition, the diffusion time over the area of membrane that separates the punctate adhesions (50-100 nm) is ca. s, similar to the growth time of the cluster (see below). The onset of aggregation is faster still, so the number of cadherins within the area which collapses into a single adhesion (the local value) should not change substantially at this crucial point.
Over a sufficiently short time interval, the contact area can be assumed constant, and we need not worry about a changing expression for the partition function. The single-molecule partition function for the lattice gas model with Hamiltonian (1) is:
| (3) |
where the sum runs over all of the sites in the contact area. The full partition function is the product of all , subject to the constraint of the constant total number of individual cadherin units, . The Supplementary Part B gives the calculation of this partition function using the auxilliary fields method. There, we introduce a site-specific variable , whose expectation value is the average occupation of a site , and later transform this into a continuous density which depends on a the position in the contact area.
The calculation of is exact, but rather unwieldy. We need to make two strong assumptions if we want a manageable form for the effective action . First (discussed in Supplementary Part B), the concentration of sensors is assumed low, so that the probability of a single site being in the ‘empty’ state is much greater than that of being in the ‘filled’ state. Second (Supplementary Part C), we look at the nucleation of clusters, where non-uniformity amplitude is small, so we can work with the series expansion of in terms of density fluctuations .
Note that first order terms in the new variable average to zero, and only result in a constant shift in the action. This is why the strength of the cytoskeletal pulling force encapsulated in the field term does not change the kinetics of cadherin punctate adhesion aggregation.
In Supplementary Part D, we obtain the action , transform it into Fourier space, make it continuous, and finally transform back into real space (the last operation generating the spatial gradients). It has recognizable features of the Ginzburg-Landau theory, where we retain cubic and quartic terms in the order parameter expansion:
| (4) |
where all lengths are scaled by the size of the individual sensor , and the coefficients are listed in Supplementary Part D. Specifically, the two quadratic-order coefficients take the form, Eqn. (D.9):
| (5) |
with , from Eqn. (C.5).
The control parameter (replacing the temperature in the classical theory of phase transitions) is the ratio , which starts near 0 for an initially large contact plane, and then increases as the cell contact area contracts. The gradient coefficient remains positive, but the main ‘control’ coefficient could become negative at a critical value of (where ) and cause the cadherin distribution to become unstable. Note that near this transition point takes the value .
Results and comparison with experimental data
In our model, the gas-liquid condensation transition occurs when . Given this gives in a 2D lattice model of cadherin aggregation. This is our first key result, and it matches well with the in-vitro observation that cadherin clusters form when their surface density increases past [54] (this is different from the fraction ca. of the maximum cadherin surface density which they report, because they consider a much tighter packing of cadherins to within nm of their neighbours).
Spatial frequency of fluctuations. Near the transition point, the Ginzburg-Landau action (4) can be approximated by its quadratic terms. The time-dependence of the concentration fluctuation near the transition point can be described by the Cahn-Hilliard equation [63]:
| (6) |
where is the (not yet dimensional) cadherin diffusion coefficient in the plane. We impose Neumann boundary conditions on a 2D rectangular cell interface (a reasonable approximation for the lateral surfaces of epithelial cells for instance), which makes the time- and the spatial coordinates fully separable, and gives the Cahn-Hilliard solution:
| (7) |
where is the wavevector, directly related to the numbers of peaks along the two spatial directions in our contact plane: , where the sizes of the lattice in the x and y directions are and respectively, with .
The size of the fastest growing wavevector, which corresponds to the oscillation length scale that maximizes the exponential term above, are
| (8) |
A range of mode numbers satisfy the conditions above. Assuming, as experiments suggest in Fig. 1, that the punctate adherens junctions are roughly equidistant from each other in both directions, we find that the wavenumber of the fastest-growing mode satisfies:
| (9) |
The total number of clusters within the patch of cell-cell contact area is the product .
Mode destabilisation time. A mode cannot grow until it becomes unstable, that is, when the second-order terms in the Ginzburg-Landau action become negative for that value of . Lower wavevectors become unstable closer to the density at the transition point (), while at higher wavevectors the increasing interface energy requires a larger negative to destabilize the homogeneous density. Alternatively, large diffuse clusters form before smaller clusters. Assuming a steady rate change of the contact area, we find in Supplementary Part F that the largest number of clusters in the lattice, for which the combined second order Ginzburg-Landau term is negative, is proportional to the time that has elapsed since the cadherin density crossed the transition point . Reintroducing dimensional length scales, we find this linear relation:
| (10) |
where is the rate of decrease in the cell-cell contact area, and is a complicated function obtained from the series expansion, Eqn. (F.2).
Mode growth time. For the fastest growing mode, , Eqn. (8), so we find that the mode has a characteristic exponential growth time which dictates how fast the Ginzburg-Landau free energy is minimized. We find this time by substituting into the exponent in the Cahn-Hilliard solution (7):
| (11) |
Substituting the constants and , and recovering the proper dimensional length scales via the spacing , we find that the growth time of the mode becomes:
| (12) |
i.e. inversely proportional to , with a proportionality constant of order .
Density of punctate adherens junctions. The total time for a mode to first become unstable and then reach the minimum in the Ginzburg-Landau free energy landscape is of the order:
| (13) |
where and are the proportionality constants in Eqs. (10,12). The total time is minimized when the number of clusters across the contact area is:
| (14) |
We make the proportionality constants explicit and find that the number of adherens junctions per unit area of cell-cell interface is given by
| (15) |
This is the second main prediction of this paper.
| Parameter | Name | Value | Uncertainty | References |
| Cadherin lattice | ||||
| spacing | a | 7 nm | 1 nm | [64, 50, 51, 54] |
| Cadherin diffusion | ||||
| coefficient (macroscopic) | D | s | s | [65] |
| Cadherin diffusion | ||||
| coefficient (microscopic) | D | s | s | [65] |
| Cis interaction energy | J | [50, 61] | ||
| Fractional shrinkage of | ||||
| cell-cell contact area | Figure 2 [66] | |||
| Density at the phase transition | N/A | 0.05 | (see above and [54]) | |
| Arbitrary exponential growth parameter | 1-10 | NB |
To make an experimental comparison, we use the aggregated cadherin spacing = 6 nm [64, 50, 51] (slightly smaller than the crystal lattice size seen by [51] to account for the possible tighter packing observed by [54]), diffusion constant s [65], density at transition of (see above), , and proportionality constant for the sake of simplicity (see Table 1). The fractional shrinking rate of a patch of the cell-cell contact area depends on the cellular process and the type of cell.
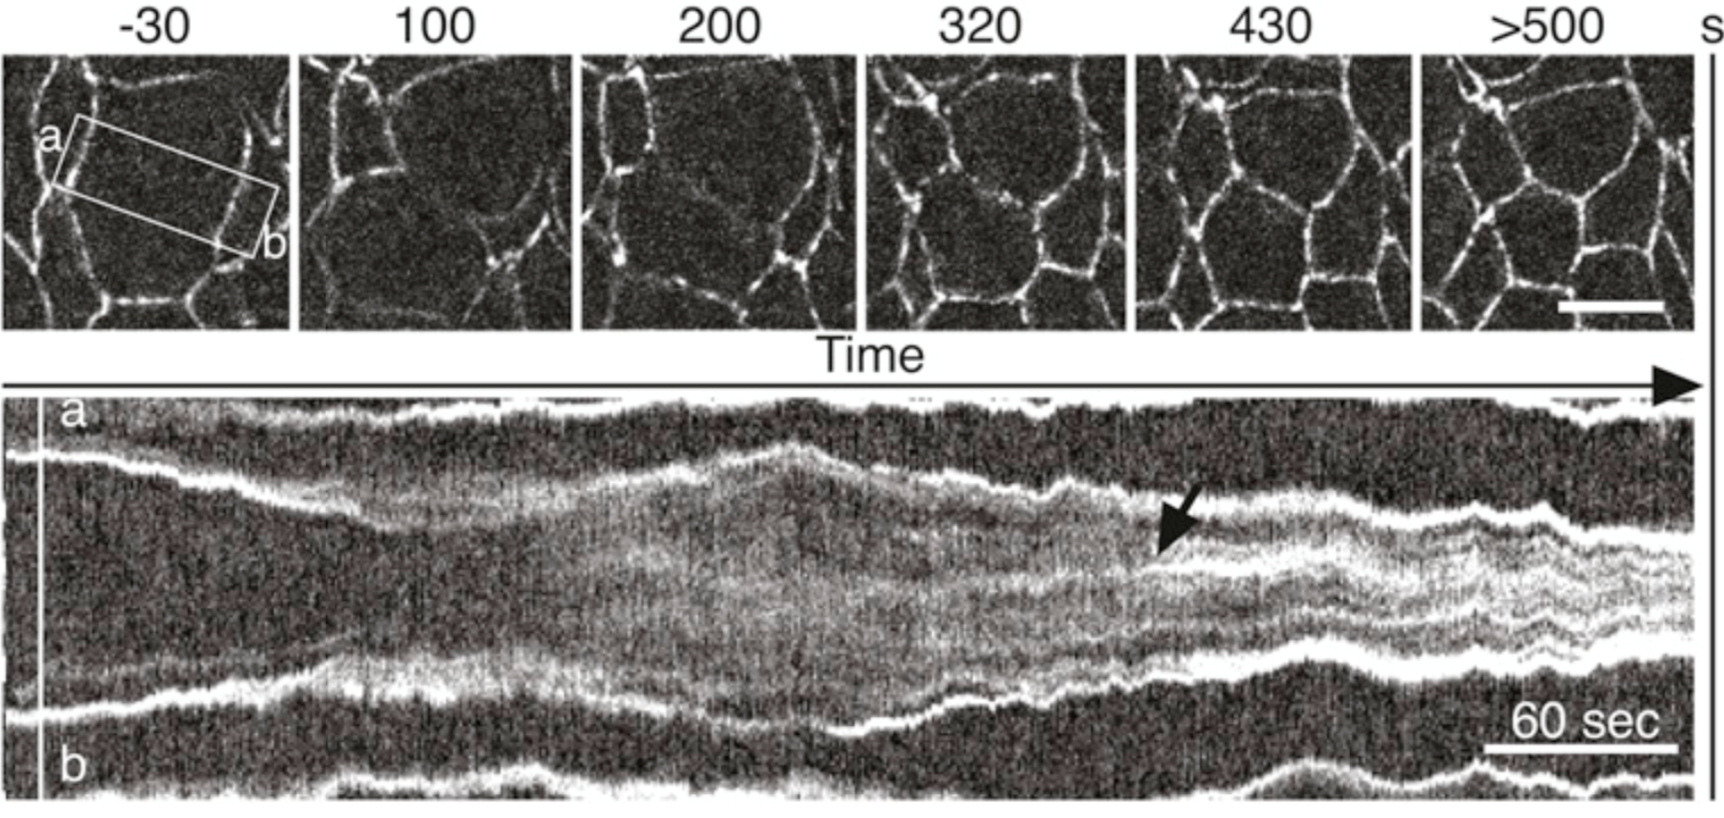
One classic example which requires cadherin clusters to form occurs during cytokinesis at the end of cell division [68]. Kymographs of the cross-section of the a dividing epithelial cell [66, 69], see Fig. 2, show that the fractional change in the area of the cell interface is per minute. For the case of epithelial cell division, therefore, we find , assuming a uncertainty for the cadherin diffusion coefficients (macroscopic uncertainty value in Table 1).. This appears to match well with the number density of punctate adhesions observed by [24] in epithelial tissues seen in Fig. 1. Both experimental and computational studies have also reported the characteristic cluster size values of cadherins [19], which gives the estimate of average cadherin of the correct order of ca. [54]. Even though there might be some uncertainty in the values of physiological constants used to evaluate Eqn. (15), the cube-root dependence of the number density on these constants makes a large error unlikely: any one parameter value would need to be off by a factor of for there to be times fewer or more punctate adhesions. Note that we can also use this figure to estimate the total growth and destabilisation time to be of the order of 5 seconds, once the cadherin distribution becomes unstable. This would account for the quite sharp transition to a higher cadherin instensity in the kymograph at the time indicated by the arrow.
Conclusions
In this paper, we built a 2D model for the aggregation of adhesion units with a short-distance attractive interaction, which is applicable to all cell contact areas if the problem is reduced down to a sufficiently small and uniform patch (locally, with zero curvature and applied force variation), so we expect our results to be more universally valid. The advantage of treating cadherin adhesion complexes as a specific example is that there is a large body of experimental and computational work from which to test our results. Our predictions for the transition density of cadherins above which clusters could form, as well as for the number density of cadherin clusters, were independent of each other. Together, they strongly suggest that cadherin density-depedent cluster nucleation initially occurs via a gas-liquid phase transition.
Previous studies have analytically explained how cadherin trans bonds can help set up large scale adherens junctions[23], and new work has computationally shown that cadherin cis-bonds help develop punctate adherens junctions[61]. In this work. we have laid out for the first time an analytical explanation for how punctate cadherin adherens junctions can form.
While we looked at the case of cadherin nucleation, more generally, any distribution of attractively-coupled cell membrane molecules in the low concentration limit can undergo a gas-liquid (condensation) phase transition in the form of density-dependent aggregation. Because of this, we could apply this method to the more general problem of the formation of membrane-bound organelles.
Data access
All data generated or analysed during this study are included in this published article [and its supplementary information files].
Author contribution
Both authors conceived the idea, carried out different elements of data analysis and wrote the paper.
Acknowledgements
We are grateful to R. Zaidel-Bar as well as to T. Lecuit for giving access to their experimental results. This work has been funded by BBRSC DTP Cambridge (grant no. EP/M508007/1).
References
- [1] Wozniak, M. A., Modzelewska, K., Kwong, L. & Keely, P. J. Focal adhesion regulation of cell behavior. Biochim. Biophys. Acta - Mol. Cell Res. 1692, 103–119 (2004). URL https://www.sciencedirect.com/science/article/pii/S0167488904000990.
- [2] van Roy, F. & Berx, G. The cell-cell adhesion molecule E-cadherin. Cell. Mol. Life Sci. 65, 3756–3788 (2008). URL http://link.springer.com/10.1007/s00018-008-8281-1.
- [3] Niessen, C. M. Tight Junctions/Adherens Junctions: Basic Structure and Function. J. Invest. Dermatol. 127, 2525–2532 (2007). URL https://linkinghub.elsevier.com/retrieve/pii/S0022202X15331833.
- [4] Harris, T. J. C. & Tepass, U. Adherens junctions: from molecules to morphogenesis. Nat. Rev. Mol. Cell Biol. 11, 502–514 (2010). URL http://www.nature.com/articles/nrm2927.
- [5] Burridge, K. & Chrzanowska-Wodnicka, M. Focal adhesions, contractility, and signaling. Annu. Rev. Cell Dev. Biol. 12, 463–519 (1996). URL https://pubmed.ncbi.nlm.nih.gov/8970735/.
- [6] Geiger, B., Spatz, J. P. & Bershadsky, A. D. Environmental sensing through focal adhesions. Nat. Rev. Mol. Cell Biol. 10, 21–33 (2009). URL https://www.nature.com/articles/nrm2593.
- [7] Yap, A. S. & Kovacs, E. M. Direct cadherin-activated cell signaling. J. Cell Biol. 160, 11–16 (2003). URL https://rupress.org/jcb/article/160/1/11/33118/Direct-cadherinactivated-cell-signaling-a-view.
- [8] Cavallaro, U. & Christofori, G. Cell adhesion and signalling by cadherins and Ig-CAMs in cancer. Nat. Rev. Cancer 4, 118–132 (2004). URL http://www.nature.com/articles/nrc1276.
- [9] Le Bras, S. & Le Borgne, R. Epithelial cell division - multiplying without losing touch. J. Cell Sci. 127, 5127–5137 (2014). URL http://jcs.biologists.org/cgi/doi/10.1242/jcs.151472.
- [10] Goffin, J. M. et al. Focal adhesion size controls tension-dependent recruitment of -smooth muscle actin to stress fibers. J. Cell Biol. 172, 259–268 (2006). URL https://pubmed.ncbi.nlm.nih.gov/16401722/.
- [11] Solon, J., Levental, I., Sengupta, K., Georges, P. C. & Janmey, P. A. Fibroblast Adaptation and Stiffness Matching to Soft Elastic Substrates. Biophys. J. 93, 4453–4461 (2007). URL https://linkinghub.elsevier.com/retrieve/pii/S000634950771696X.
- [12] Gates, R. E., King, L. E., Hanks, S. K. & Nanney, L. B. Potential role for focal adhesion kinase in migrating and proliferating keratinocytes near epidermal wounds and in culture. Cell Growth Differ. 5, 891–9 (1994). URL http://www.ncbi.nlm.nih.gov/pubmed/7986754.
- [13] Koivisto, L., Heino, J., Häkkinen, L. & Larjava, H. Integrins in Wound Healing. Adv. Wound Care 3, 762–783 (2014). URL http://www.liebertpub.com/doi/10.1089/wound.2013.0436.
- [14] Nagano, M., Hoshino, D., Koshikawa, N., Akizawa, T. & Seiki, M. Turnover of Focal Adhesions and Cancer Cell Migration. Int. J. Cell Biol. 2012, 1–10 (2012). URL https://pubmed.ncbi.nlm.nih.gov/22319531/.
- [15] Eke, I. & Cordes, N. Focal adhesion signaling and therapy resistance in cancer. Semin. Cancer Biol. 31, 65–75 (2015). URL https://linkinghub.elsevier.com/retrieve/pii/S1044579X14000984.
- [16] Gottschalk, K.-E. & Kessler, H. A Computational Model of Transmembrane Integrin Clustering. Structure 12, 1109–1116 (2004). URL https://linkinghub.elsevier.com/retrieve/pii/S0969212604001248.
- [17] Paszek, M. J., Boettiger, D., Weaver, V. M. & Hammer, D. A. Integrin Clustering Is Driven by Mechanical Resistance from the Glycocalyx and the Substrate. PLoS Comput. Biol. 5, e1000604 (2009). URL https://dx.plos.org/10.1371/journal.pcbi.1000604.
- [18] Chen, J., Newhall, J., Xie, Z.-R., Leckband, D. & Wu, Y. A Computational Model for Kinetic Studies of Cadherin Binding and Clustering. Biophys. J. 111, 1507–1518 (2016). URL https://linkinghub.elsevier.com/retrieve/pii/S0006349516307603.
- [19] Thompson, C. J. et al. Cadherin clusters stabilized by a combination of specific and nonspecific cis-interactions. Elife (2020). URL https://elifesciences.org/articles/59035.
- [20] Weikl, T. R., Andelman, D., Komura, S. & Lipowsky, R. Adhesion of membranes with competing specific and generic interactions. Eur. Phys. J. E 8, 59–66 (2002). URL https://pubmed.ncbi.nlm.nih.gov/15010982/.
- [21] Weikl, T. R., Asfaw, M., Krobath, H., Bartosz, R. O. & Lipowsky, R. Adhesion of membranes via receptor-ligand complexes: Domain formation, binding cooperativity, and active processes. Soft Mat. 5, 3213–3224 (2009). URL https://arxiv.org/pdf/0906.1675.pdf.
- [22] Speck, T., Reister, E. & Seifert, U. Specific adhesion of membranes: Mapping to an effective bond lattice gas. Phys. Rev. E 82, 021923 (2010). URL https://journals.aps.org/pre/abstract/10.1103/PhysRevE.82.021923.
- [23] Fenz, S. F. et al. Membrane fluctuations mediate lateral interaction between cadherin bonds. Nat. Physics 13, 906–913 (2017). URL https://www.nature.com/articles/nphys4138.
- [24] Wu, Y., Kanchanawong, P. & Zaidel-Bar, R. Actin-Delimited Adhesion-Independent Clustering of E-Cadherin Forms the Nanoscale Building Blocks of Adherens Junctions. Dev. Cell 32, 139–154 (2015). URL https://linkinghub.elsevier.com/retrieve/pii/S1534580714008004.
- [25] Indra, I. et al. Spatial and temporal organization of cadherin in punctate adherens junctions. Proc. Natl. Acad. Sci. USA 115, E4406–E4415 (2018). URL https://pubmed.ncbi.nlm.nih.gov/29691319/.
- [26] Ibata, N. & Terentjev, E. M. Development of Nascent Focal Adhesions in Spreading Cells. Biophys. J. 119, 2063–2073 (2020). URL https://linkinghub.elsevier.com/retrieve/pii/S000634952030775X.
- [27] Gumbiner, B. M. Cell Adhesion: The Molecular Basis of Tissue Architecture and Morphogenesis. Cell 84, 345–357 (1996). URL https://linkinghub.elsevier.com/retrieve/pii/S0092867400812799.
- [28] Parsons, J. T., Horwitz, A. R. & Schwartz, M. A. Cell adhesion: integrating cytoskeletal dynamics and cellular tension. Nat. Rev. Mol. Cell Biol. 11, 633–643 (2010). URL https://www.nature.com/articles/nrm2957.
- [29] Gov, N. S. Modeling the Size Distribution of Focal Adhesions. Biophys. J. 91, 2844–2847 (2006). URL https://linkinghub.elsevier.com/retrieve/pii/S0006349506719981.
- [30] Meng, W. & Takeichi, M. Adherens Junction: Molecular Architecture and Regulation. Cold Spring Harb. Perspect. Biol. 1, a002899–a002899 (2009). URL http://cshperspectives.cshlp.org/lookup/doi/10.1101/cshperspect.a002899.
- [31] Choi, W. et al. Remodeling the zonula adherens in response to tension and the role of afadin in this response. J. Cell Biol. 213, 243–260 (2016). URL https://rupress.org/jcb/article/213/2/243/38569/Remodeling-the-zonula-adherens-in-response-to.
- [32] Bajpai, S. et al. -catenin mediates initial e-cadherin-dependent cell- cell recognition and subsequent bond strengthening. Proceedings of the National Academy of Sciences of the United States of America 105 (2008). URL https://www.pnas.org/content/105/47/18331.
- [33] Liu, S., Calderwood, D. A. & Ginsberg, M. H. Integrin cytoplasmic domain-binding proteins. J. Cell Sci. 113 ( Pt 2, 3563–71 (2000). URL http://www.ncbi.nlm.nih.gov/pubmed/11017872.
- [34] Kong, F., García, A. J., Mould, A. P., Humphries, M. J. & Zhu, C. Demonstration of catch bonds between an integrin and its ligand. J. Cell Biol. 185, 1275–1284 (2009). URL https://rupress.org/jcb/article/185/7/1275/35445/Demonstration-of-catch-bonds-between-an-integrin.
- [35] Rakshit, S., Zhang, Y., Manibog, K., Shafraz, O. & Sivasankar, S. Ideal, catch, and slip bonds in cadherin adhesion. Proc. Natl. Acad. Sci. 109, 18815–18820 (2012). URL http://www.pnas.org/cgi/doi/10.1073/pnas.1208349109.
- [36] Thomas, W. E., Vogel, V. & Sokurenko, E. Biophysics of catch bonds. Annu. Rev. Biophys. 37, 399–416 (2008). URL https://pubmed.ncbi.nlm.nih.gov/18573088/.
- [37] Humphries, J. D. et al. Vinculin controls focal adhesion formation by direct interactions with talin and actin. J. Cell Biol. 179, 1043–1057 (2007). URL https://rupress.org/jcb/article/179/5/1043/45072/Vinculin-controls-focal-adhesion-formation-by.
- [38] Ziegler, W. H., Gingras, A. R., Critchley, D. R. & Emsley, J. Integrin connections to the cytoskeleton through talin and vinculin. Biochem. Soc. Trans. 36, 235–239 (2008). URL https://portlandpress.com/biochemsoctrans/article/36/2/235/83791/Integrin-connections-to-the-cytoskeleton-through.
- [39] Hartsock, A. & Nelson, W. J. Adherens and tight junctions: Structure, function and connections to the actin cytoskeleton. Biochim. Biophys. Acta - Biomembr. 1778, 660–669 (2008). URL https://pubmed.ncbi.nlm.nih.gov/17854762/.
- [40] Niessen, C. M. & Gottardi, C. J. Molecular components of the adherens junction. Biochim. Biophys. Acta - Biomembr. 1778, 562–571 (2008). URL https://linkinghub.elsevier.com/retrieve/pii/S0005273607004749.
- [41] Balaban, N. Q. et al. Force and focal adhesion assembly. Nat. Cell Biol. 3, 466–472 (2001). URL https://www.nature.com/articles/ncb0501_466.
- [42] Shemesh, T., Geiger, B., Bershadsky, A. D. & Kozlov, M. M. Focal adhesions as mechanosensors: A physical mechanism. Proc. Natl. Acad. Sci. 102, 12383–12388 (2005). URL http://www.pnas.org/cgi/doi/10.1073/pnas.0500254102.
- [43] Burridge, K. & Guilluy, C. Focal adhesions, stress fibers and mechanical tension. Exp. Cell Res. 343, 14–20 (2016). URL https://pubmed.ncbi.nlm.nih.gov/26519907/.
- [44] Chitaev, N. A. & Troyanovsky, S. M. Adhesive But Not Lateral E-cadherin Complexes Require Calcium and Catenins for Their Formation. J. Cell Biol. 142, 837–846 (1998). URL https://rupress.org/jcb/article/142/3/837/15827/Adhesive-But-Not-Lateral-Ecadherin-Complexes.
- [45] Ozawa, M. Lateral Dimerization of the E-cadherin Extracellular Domain Is Necessary but Not Sufficient for Adhesive Activity. J. Biol. Chem. 277, 19600–19608 (2002). URL https://linkinghub.elsevier.com/retrieve/pii/S0021925820850224.
- [46] Otey, C. A., Vasquez, G. B., Burridge, K. & Erickson, B. W. Mapping of the alpha-actinin binding site within the beta 1 integrin cytoplasmic domain. J. Biol. Chem. 268, 21193–7 (1993). URL http://www.ncbi.nlm.nih.gov/pubmed/7691808.
- [47] Sampath, R., Gallagher, P. J. & Pavalko, F. M. Cytoskeletal Interactions with the Leukocyte Integrin 2 Cytoplasmic Tail. J. Biol. Chem. 273, 33588–33594 (1998). URL https://linkinghub.elsevier.com/retrieve/pii/S0021925819885745.
- [48] Kelly, D. F. & Taylor, K. A. Identification of the 1-integrin binding site on -actinin by cryoelectron microscopy. J. Struct. Biol. 149, 290–302 (2005). URL https://linkinghub.elsevier.com/retrieve/pii/S1047847704002229.
- [49] Roca-Cusachs, P. et al. Integrin-dependent force transmission to the extracellular matrix by -actinin triggers adhesion maturation. Proc. Natl. Acad. Sci. U. S. A. (2013). URL https://www.pnas.org/content/110/15/E1361.
- [50] Wu, Y. et al. Cooperativity between trans and cis interactions in cadherin-mediated junction formation. Proc. Natl. Acad. Sci. 107, 17592–17597 (2010). URL http://www.pnas.org/lookup/doi/10.1073/pnas.1011247107.
- [51] Harrison, O. J. et al. The extracellular architecture of adherens junctions revealed by crystal structures of type i cadherins. Structure (2011). URL https://www.ncbi.nlm.nih.gov/pmc/articles/PMC3070544/.
- [52] Nagar, B., Overduin, M., Ikura, M. & Rini, J. M. Structural basis of calcium-induced E-cadherin rigidification and dimerization. Nature 380, 360–364 (1996). URL https://www.nature.com/articles/380360a0.
- [53] Lambert, O. et al. The basic framework of VE-cadherin junctions revealed by cryo-EM. J. Mol. Biol. 346, 1193–1196 (2005). URL https://pubmed.ncbi.nlm.nih.gov/15713473/.
- [54] Thompson, C. J., Vu, V. H., Leckband, D. E. & Schwartz, D. K. Cadherin Extracellular Domain Clustering in the Absence of Trans -Interactions. J. Phys. Chem. Lett. 10, 4528–4534 (2019). URL https://pubs.acs.org/doi/10.1021/acs.jpclett.9b01500.
- [55] Xu, X. P. et al. Three-Dimensional Structures of Full-Length, Membrane-Embedded Human iIb3 Integrin Complexes. Biophys. J. (2016). URL https://pubmed.ncbi.nlm.nih.gov/26910421/.
- [56] Li, Y. et al. Mechanism of E-cadherin dimerization probed by NMR relaxation dispersion. Proc. Natl. Acad. Sci. U. S. A. (2013). URL https://pubmed.ncbi.nlm.nih.gov/23242168/.
- [57] Fichtner, D. et al. Covalent and Density-Controlled Surface Immobilization of E-Cadherin for Adhesion Force Spectroscopy. PLoS One 9, e93123 (2014). URL https://dx.plos.org/10.1371/journal.pone.0093123.
- [58] Pontani, L.-L., Jorjadze, I. & Brujic, J. Cis and Trans Cooperativity of E-Cadherin Mediates Adhesion in Biomimetic Lipid Droplets. Biophys. J. 110, 391–399 (2016). URL https://linkinghub.elsevier.com/retrieve/pii/S0006349515046986.
- [59] Biswas, A., Alex, A. & Sinha, B. Mapping cell membrane fluctuations reveals their active regulation and transient heterogeneities. Biophysical Journal 113 (2017). URL https://pubmed.ncbi.nlm.nih.gov/29045871/.
- [60] Santos, M. C. D., Déturche, R., Vézy, C. & Jaffiol, R. Topography of cells revealed by variable-angle total internal reflection fluorescence microscopy. Biophysical Journal 111 (2016). URL https://pubmed.ncbi.nlm.nih.gov/27653490/.
- [61] Yu, Q., Holmes, W. R., Thiery, J. P., Luwor, R. B. & Rajagopal, V. Cortical tension initiates the positive feedback loop between cadherin and f-actin. Biophysical Journal 121 (2022).
- [62] Truong Quang, B.-A., Mani, M., Markova, O., Lecuit, T. & Lenne, P.-F. Principles of E-Cadherin Supramolecular Organization In Vivo. Curr. Biol. 23, 2197–2207 (2013). URL https://linkinghub.elsevier.com/retrieve/pii/S0960982213011317.
- [63] Cahn, J. W. On spinodal decomposition. Acta Metall. 9, 795–801 (1961). URL https://www.sciencedirect.com/science/article/abs/pii/0001616061901821.
- [64] Patel, S. D. et al. Type II Cadherin Ectodomain Structures: Implications for Classical Cadherin Specificity. Cell (2006). URL https://pubmed.ncbi.nlm.nih.gov/16564015/.
- [65] Kusumi, A., Sako, Y. & Yamamoto, M. Confined lateral diffusion of membrane receptors as studied by single particle tracking (nanovid microscopy). Effects of calcium-induced differentiation in cultured epithelial cells. Biophys. J. 65, 2021–2040 (1993). URL https://linkinghub.elsevier.com/retrieve/pii/S0006349593812530.
- [66] Guillot, C. & Lecuit, T. Adhesion Disengagement Uncouples Intrinsic and Extrinsic Forces to Drive Cytokinesis in Epithelial Tissues. Dev. Cell 24, 227–241 (2013). URL https://pubmed.ncbi.nlm.nih.gov/23410938/.
- [67] König, B., Ronsin, O. J. & Harting, J. Two-dimensional cahn-hilliard simulations for coarsening kinetics of spinodal decomposition in binary mixtures. Physical Chemistry Chemical Physics 23 (2021).
- [68] Barr, F. A. & Gruneberg, U. Cytokinesis: Placing and Making the Final Cut. Cell 131, 847–860 (2007). URL https://linkinghub.elsevier.com/retrieve/pii/S0092867407014638.
- [69] Herszterg, S., Leibfried, A., Bosveld, F., Martin, C. & Bellaiche, Y. Interplay between the Dividing Cell and Its Neighbors Regulates Adherens Junction Formation during Cytokinesis in Epithelial Tissue. Dev. Cell 24, 256–270 (2013). URL https://linkinghub.elsevier.com/retrieve/pii/S1534580712005394.