as a Two-Step Graph Generative Models for Retrosynthesis Prediction
Abstract
Retrosynthesis is a procedure where a target molecule is transformed into potential reactants and thus the synthesis routes can be identified. Recently, computational approaches have been developed to accelerate the design of synthesis routes. In this paper, we develop a generative framework for one-step retrosynthesis prediction. imitates the reversed logic of synthetic reactions. It first predicts the reaction centers in the target molecules (products), identifies the synthons needed to assemble the products, and transforms these synthons into reactants. defines a comprehensive set of reaction center types, and learns from the molecular graphs of the products to predict potential reaction centers. To complete synthons into reactants, considers all the involved synthon structures and the product structures to identify the optimal completion paths, and accordingly attaches small substructures sequentially to the synthons. Here we show that is able to better predict the reactants for given products in the benchmark dataset than the state-of-the-art methods.
Introduction
Retrosynthesis is a procedure where a target molecule is transformed into potential reactants and thus the synthesis routes can be identified. One-step retrosynthesis, which transforms a molecule into the possible direct reactants that can be used to synthesize the molecule, serves as the foundation of multi-step synthesis planning [1, 2] that identifies a full synthesis route in which the target molecule can be made through a series of one-step synthesis reactions. In drug discovery, identifying feasible synthesis routes for drug-like molecules remains a factor that substantially challenges medicinal chemists in making the desired molecules experimentally [3]. An extensive, diverse library of high-quality synthesis routes for a given molecule has the potential to enable more feasible reaction solutions starting from commercially available, chemical building blocks, and to provide more options for operationally simple, high-yielding transformations using widely accessible reactants.
Current retrosynthesis planning is primarily conducted by synthetic and medicinal chemists based on their knowledge and experience. It has been long known that there exists substantial disagreement among chemists in assessing synthesisbilty and designing synthesis routes [4, 5, 6, 7]. In addition, an ever-increasing number of new chemical reactions makes it highly challenging for a chemist to keep up to date. Therefore, a data-driven model that predicts synthetic reactions could provide a useful complement to chemist evaluations, and could provide a large pool of potential reactions that the chemists can consider. There exist proprietary synthesis reaction databases manually curated from the literature, including Reaxys [8] and SciFinder [9]. Unfortunately, the high prices of these databases act to limit their accessibility in some academic and small biotech settings. Open-sourced synthesis reaction databases such as the Open Reaction Database [10] are limited in the reactions they cover (e.g., majorities are United States Patent and Trademark Office (USPTO) public reactions [11]) and their search functionalities (e.g., via SMILES strings). Even with the aid of these databases, the development of new reactions and synthetic pathways for the preparation of challenging molecules remains non-trivial. In addition, database searches can be time-consuming with low throughput, particularly when without extensive domain knowledge to guide the process. Recent in silico retrosynthesis prediction methods using deep learning [12, 13, 14, 15, 16, 17, 18, 19, 20, 21, 22, 23, 24, 25, 26, 27, 28, 29, 30, 31, 32] have enabled alternative computationally generative processes to accelerate the conventional paradigm. These deep-learning methods learn from string-based representations (SMILES) or graph representations of given molecules, and generate possible reactant structures that can be used to synthesize these molecules, leveraging the advancement of natural language processing [33], graph neural networks [34], variational auto-encoders [35] and other techniques in deep learning. They have demonstrated strong potential to substantially accelerate and advance retrosynthesis analysis [36]. In this manuscript, we focus on the one-step retrosynthesis prediction, which predicts the possible direct reactants for the synthesis of the target molecules, and acts as the foundation of multi-step retrosynthesis analysis [1].
We develop a semi-template-based method via deep learning for one-step retrosynthesis prediction, denoted as . imitates the reversed logic of synthetic reactions: it first predicts the reaction centers in the target molecules, identifies the synthons needed to assemble the final products, and transforms these synthons into reactants. Therefore, follows the semi-template-based frame, as in the previous methods [28, 27, 29, 30]. To predict reaction centers, learns from the molecular graphs of the products via a customized graph representation learning [37] and embedding approach (in “Molecule Representation Learning” Section), and uses the graph structures to predict potential reaction centers. defines a comprehensive set of reaction center types, and for each reaction center type, uses the graph structures that are most relevant to that reaction center type (in “Reaction Center Identification” Section). - integrates information of synthetically accessible fragments in its molecule graph representation learning (in Supplementary Note 1).
The predicted reaction centers by split the products into synthons. To complete synthons into reactants, considers all the involved synthon structures and the product structures to identify the optimal completion paths (in “Attachment Continuity Prediction ()” Section), and accordingly attaches small substructures (i.e., bonds or rings) sequentially to the synthons until the extended synthon structures are predicted as possible reactants (in “Attachment Type Prediction ()” Section). All the involved predictions in and - are done via tailored neural networks. Note that and - allow multiple reaction centers and multiple completion paths for each product to increase diversity in its predicted reactions. That is, the top predicted reaction centers (according to predicted likelihoods) are all tested in synthon completion to produce different reactions. Meanwhile, to avoid the exhaustive generation of all possible reactions from the top reaction centers, prioritizes the most possible completion paths via a new beam search strategy (in “Inference” Section). An ensemble of was also developed, denoted as -, an ensemble of , increases the pool of generated reactions by combining multiple models and their predictions. Figure 1 presents an overview of . A comprehensive review of existing retrosynthesis prediction methods and related fragment-based molecular generation methods is available in “Related Work” Section.
As a summary, has the following advantages:
-
•
follows a semi-template-based framework, predicts reaction centers of different types in products first, and then transforms the resulting synthons into reactants by adding substructures to the synthons. This process imitates the reversed logic of synthetic reactions and enables necessary interpretability as to which reaction centers are predicted by , which reactants are generated from the reaction centers and the corresponding step-by-step generation process.
-
•
defines a comprehensive set of reaction center types, covering 97.5% of the test data and conforming to synthetic chemistry knowledge. New customized neural networks are developed to predict each type of the reaction centers as well as their associated atom changes. Multiple reaction center candidates are considered for each product to enable diverse reactions generated from different reaction centers in the predicted reactions.
-
•
develops a new fragment-based generation strategy compared to the previous semi-template-based methods [28, 27, 29, 30], to complete synthons into reactants by sequentially attaching substructures (i.e., bonds and rings) starting from the predicted reaction centers (in “Synthon Completion” Section). The prediction of these substructure attachments utilizes a holistic view of the most updated structures of the synthon to be completed, and the structures of the final product and other synthons.
-
•
employs a new, effective beam search strategy compared to the previous semi-template-based methods [28, 27, 29, 30], that prioritizes the most possible reactants and the corresponding completion actions along the synthon completion paths. The beam search also allows multiple different reaction centers, enabling diversity in the completed reactants.
-
•
and - are compared with nineteen baseline methods and demonstrate the state-of-the-art performance over the benchmark data (in “Overall Comparison” Section). Case studies show that could propose diverse and reasonable synthesis routes with high predicted likelihoods that are not included in the benchmark data (in “Case Study” Section).
-
•
- is an ensemble of models and demonstrates strong performance on the benchmark data compared to two baseline methods with data augmentation (in “Performance of Ensemble-based Methods” Section).
Results
Overall Comparison
| Method type | Method | Coverage(%) | Reaction type known | Reaction type unknown | |||||||
|---|---|---|---|---|---|---|---|---|---|---|---|
| 1 | 3 | 5 | 10 | 1 | 3 | 5 | 10 | ||||
| TB | [12] | 100.0 | 52.9 | 73.8 | 81.2 | 88.1 | 37.3 | 54.7 | 63.3 | 74.1 | |
| [13] | 100.0 | 55.3 | 76.0 | 81.4 | 85.1 | 44.4 | 65.3 | 72.4 | 78.9 | ||
| [14] | 93.3 | 64.2 | 79.1 | 85.2 | 90.0 | 52.5 | 69.0 | 75.6 | 83.7 | ||
| [15] | 100.0 | - | - | - | - | 50.5 | 73.9 | 81.0 | 87.9 | ||
| [16] | 98.1 | 63.9 | 86.8 | 92.4 | 96.3 | 53.4 | 77.5 | 85.9 | 92.4 | ||
| TF | [17] | 100.0 | 59.0 | 74.8 | 78.1 | 81.1 | 43.7 | 60.0 | 65.2 | 68.7 | |
| -[18] | - | - | - | - | 40.5 | 65.1 | 72.8 | 79.4 | |||
| [19] | 57.4 | 71.3 | 74.8 | 77.4 | 44.9 | 58.8 | 62.4 | 65.9 | |||
| [20] | - | - | - | - | 54.3 | - | 62.3 | 63.0 | |||
| [21] | - | - | - | - | 51.2 | 66.3 | 70.4 | 73.9 | |||
| [22] | - | - | - | - | 47.1 | 67.1 | 73.1 | 76.3 | |||
| [23] | - | - | - | - | 51.1 | 67.6 | 74.8 | 81.6 | |||
| [24] | 65.7 | 81.9 | 84.7 | 85.9 | 53.6 | 70.7 | 74.6 | 77.0 | |||
| [25] | 64.0 | 82.5 | 86.7 | 90.2 | 53.2 | 71.1 | 76.6 | 82.1 | |||
| [26] | 60.7 | 82.0 | 87.5 | 91.6 | 48.1 | 70.7 | 78.4 | 86.1 | |||
| Semi-TB | [27] | 100.0 | 62.1 | 75.8 | 78.5 | 80.9 | 50.4 | 61.1 | 62.3 | 63.4 | |
| [28] | 97.9 | 61.0 | 81.3 | 86.0 | 88.7 | 48.9 | 67.6 | 72.5 | 75.5 | ||
| [29] | 95.0 | 63.9 | 81.5 | 85.2 | 88.1 | 53.7 | 68.3 | 72.2 | 75.5 | ||
| [30] | 100.0 | 64.8 | 81.6 | 85.0 | 86.9 | 51.4 | 70.8 | 74.0 | 76.1 | ||
| 97.5 | 63.1 | 84.2 | 88.5 | 91.7 | 53.9 | 74.6 | 80.7 | 86.6 | |||
| - | 97.5 | 63.6 | 83.6 | 88.4 | 91.5 | 54.1 | 74.1 | 81.2 | 86.7 | ||
-
•
Columns with 1, 3, 5 and 10 present top-1, top-3, top-5 and top-10 accuracies, respectively. Column “Coverage(%)” represents the percentage of test reactions that the methods can be applied to. Best top- accuracy values among the methods of each type are in bold. Top- accuracy values of and - are underlined if they are not the best but still better than all the baselines of the respective type. All the baseline results are reported in their original papers, where “-” represents that the corresponding results are not reported.
Table 1 presents the overall comparison between , - and the baseline methods on one-step retrosynthesis under two conditions, following the standard protocol in literature [12, 13, 14, 19, 24, 30, 27, 28, 29, 26]: (1) when the reaction type is given a priori for both model training and inference (i.e., “Reaction type known”); and (2) when the reaction type is always unknown (i.e., “Reaction type unknown”). When the reaction type is known, uses a one-hot encoder as an additional feature for each atom in product molecules indicating the reaction type. Particularly, for Semi-TB methods, the performance in Table 1 corresponds to the predictions out of the two steps, that is, the synthon completion is done according to a reaction center that is predicted from the reaction center prediction step. Following the prior work [12, 14, 28, 29], we used the top- (=1,3,5,10) accuracy to evaluate the overall performance of all the methods. Top- accuracy is the ratio of test products that have their ground truth correctly predicted among their top- predictions. Higher top- accuracy indicates better performance. Note that ground truth reactions are those included in the benchmark data. While there is always one ground-truth reaction for each product in the benchmark data, there may exist actually numerous feasible reactions for each product that are not included in the benchmark data. Therefore, reactants that are considered incorrect based on the benchmark data might still be plausible and included in other larger databases. Also, note that the top- accuracies of all the baseline methods are the reported results in their original papers (issues related to the comparison among methods are discussed later). Details of baseline methods are available in “Baselines” Section.
Comparison with semi-template-based (Semi-TB) methods
When the reaction type is known, compared to other Semi-TB methods, achieves the best performance on top-3 (84.2%), top-5 (88.5%) and top-10 (91.7%) accuracies, corresponding to 3.2%, 2.9%, and 3.4% improvement over those from the best baselines (81.6% for [30] on top-3, 86.0% and 88.7% for [28] on top-5 and top-10) on these three metrics. In terms of top-1 accuracy, - achieves the third-best performance (63.6%) compared to those of (64.8%) and (63.9%) on this metric. While underperforms on one metric, it is substantially better than on all the other metrics: outperforms on top-3 accuracy at 3.2%, on top-5 accuracy at 4.1%, and on top-10 accuracy at 5.6%.
When the reaction type is unknown, a similar trend is observed: - outperforms all the Semi-TB baseline methods on all the top accuracy metrics, with 0.7% improvement over the best baseline on top-1 accuracy, and 4.7%, 9.7% and 13.9% improvement over those from the best baseline on top-3, top-5 and top-10 accuracies. has a performance similar to that of -, with an even better top-3 performance 74.6% that is 5.4% improvement from that of .
Compared with the performance with known reaction types, all the methods including and - have worse performance when the reaction types are unknown. It is well-known in synthetic chemistry that there are several well-characterized reaction types. These types have distinct patterns in their reactions and reaction centers. For example, acylation reactions are very common approaches to creating amide and sulfonamide linkages. They are known for their efficiency and high yields, especially when they involve acyl/sulfonyl halides [38]. The improved performance with known reaction types integrated into retrosynthesis model training demonstrates that leveraging a priori reaction type information could benefit retrosynthesis prediction in general. However, in real applications, reaction types are typically not available in retrosynthesis when only the target molecule is presented. The superior performance of and - in “reaction type unknown” condition demonstrates their great utility in real applications.
As Table 1 shows, and - can cover (i.e., can be applied to) 97.5% of the test reactions, which determines the upper bound of accuracy values, due to the definition of reaction centers (the rest 2.5% correspond to reactions with multiple newly formed or changed bonds). Among other Semi-TB methods, and [29] also have limited coverage on test set (97.9% for and 95.0% for ). [27] has 100% coverage because its reactant SMILES generation from synthons recovers all possible reaction centers. [30] also has 100% coverage due to its very comprehensive set of reaction centers. Although and - cannot cover all possible cases in the test set, they still outperform other Semi-TB methods, measured over the entire test set. More discussion on the coverage of the two steps in Semi-TB methods is available in the Section “Individual Module Performance.”
and are two strong baselines. has good top-1 accuracies but much worse results on other top accuracy metrics. According to its authors [29], tends to bias its beam search to the most possible reaction center. Thus, it may prioritize the most possible reactants from the most possible reaction center at the very top of its predictions. However, if the most possible reaction centers are not the ground truth, would totally miss the ground truth in its beam search, resulting in poor performance on other top accuracy metrics. In addition, such focused beam search limits the diversity of identified synthons, and thus the completed reactants. achieves the best top-1 accuracy with reaction type known. It uses augmented SMILES strings (i.e., each product has multiple, equivalent, non-canonical SMILES strings) in training the two sequence-to-sequence transformers. It is likely that top results in correspond to the ground truth but in different, augmented SMILES strings, and thus high top-1 accuracy but low and similar other top accuracies. These three Semi-TB baseline methods only perform well on one certain metric (in one certain condition), but do not show consistent optimality across many metrics or across the two conditions.
Compared to these baselines, always achieves the best performance on all the top accuracy metrics (except on top-1 accuracy when reaction types are known). High top- accuracies at all different are desired as they indicate the holistically high ranking positions of the ground truth in the predicted reactions, and thus the capability of models in recovering knowledge from data. High top- accuracies with may signify plausible reactions not included in the dataset, as will be examined later in Section “Case Study”. This is because high top- () accuracy implies that there might be a few reactions different from the ground truth but are very possible and thus are ranked on top. Such results may enable the exploration of multiple synthesis routes and may be of synthetic value if specific coupling methods fail or if specific starting materials are unavailable. From the above two aspects, over all the metrics, and - achieve the overall best performance compared to the three strong Semi-TB methods.
- performs slightly better than when the reaction types are unknown, but worse than when the reaction types are known. - integrates synthetically accessible fragments in atom embeddings (Equation S3 in Supplementary Note 1). When the reaction types are unknown, the fragment information provides additional local contexts to atoms, which could facilitate better decisions on reaction center prediction and synthon completion. When the reaction types are known, atom embeddings directly integrate the reaction type information in , which may outweigh the contextual information provided by the fragments, and thus - does not achieve additional performance improvement from .
Comparison with template-free (TF) methods
and - also demonstrate superior or competitive performance compared to TF methods on all the top accuracies. With reaction types known, is the best on top-3, top-5 top-10 accuracies compared to all the template-free methods; with reaction types unknown, - is the best on top-3, top-5 and top-10 accuracies, and is the second best one on top-1 accuracy. For example, is 4.9% better than the best TF method on top-3 accuracy (i.e., [25]) with the reaction types unknown. Most TF methods such as [24] and [20] have the competitive performance on top-1 accuracy but relatively worse results on other top accuracy metrics. This could be due to that these TF methods with SMILES representations may fail to generate diverse or even many valid reactants with beam search [39], leading to limited variation in their predicted results, and thus low and similar top-, top- and top- accuracies. This lack of diversity and richness in the predictions, in addition to the lack of interpretability during the chemical sequence transformation process, could hinder the application of TF methods in retrosynthesis prediction. However, the prediction diversity and richness in is enabled by the multiple possible reaction centers predicted by and the corresponding completed reactants.
In terms of the coverage on the test set, all the SMILES-based TF methods can cover the entire test set, because all the reactions can be represented as SMILES string transformation. The graph-based TF method [26] also covers the entire test set due to its comprehensive set of graph edit actions. Compared to these TF methods, though without the full coverage on the test set, and - model reactions through a two-step process of reaction center identification and synthon completion, allowing for the interpretability of reaction centers in the predicted reactants. Overall, and - achieve even better performance than the methods with full coverage, measured on the entire test set.
Comparison with template-based (TB) methods
and - achieve competitive performance with that from the TB methods. With reaction types known, achieves either the second or the third on all the top accuracies; with reaction types unknown, - achieves the best performance on top-1 (54.1%), and either the second or the third on all the other top accuracies. For example, with reaction types unknown, - is the second best on top-3 accuracy, with 3.8% difference from the best performance of [16]; - slightly underperforms the second-best baseline [15] on top-10 (86.7% compared to 87.9% from ), but outperforms on all the other metrics. is a very strong TB method. It extracted 731 templates from the benchmark training data, whereas other TB methods have much more templates (11,647 for and 9,162 for ). Therefore, could achieve better template selection over a small template set compared to others over much larger template sets. However, may suffer from scalability issues on large datasets because it scores all the reaction templates on all the potential reaction centers (i.e., all atoms and all bonds) in the product molecules. In general, all TB methods may not generalize well to reactions that are not covered by the templates [29]. In terms of coverage on the test set, Table 1 shows that the templates used in , and can cover the entire test set, while the templates used in [14] and cannot (93.3% for and 98.1% for ). Unlike TB methods, does not use reaction templates, and only scores all the bonds and atoms once for reaction center identification, and thus is much more scalable in inference. It learns the patterns from training data and thus has a better chance to discover new patterns from the training data that are not covered by templates.
Individual Module Performance
| Module | Method | Coverage (%) | Reaction type known | Reaction type unknown | |||||||
|---|---|---|---|---|---|---|---|---|---|---|---|
| 1 | 2 | 3 | 5 | 1 | 2 | 3 | 5 | ||||
| Reaction center identification | 97.9 | 90.2 (92.1) | 94.5 (96.5) | 94.9 (96.9) | 95.0 (97.0) | 75.8 (77.4) | 83.9 (85.7) | 85.3 (87.1) | 85.6 (87.4) | ||
| 95.0 | 84.6 (89.1) | 92.2 (97.1) | 93.7 (98.6) | 94.5 (99.5) | 70.8 (74.5) | 85.1 (89.6) | 89.5 (94.2) | 92.7 (97.6) | |||
| 100.0 | 84.6 (84.6) | 94.0 (94.0) | 96.7 (96.7) | 97.9 (97.9) | 65.6 (65.6) | 81.3 (81.3) | 87.7 (87.7) | 92.0 (92.0) | |||
| 97.5 | 84.3 (86.5) | 94.6 (97.0) | 96.5 (99.0) | 97.0 (99.5) | 69.5 (71.3) | 85.6 (87.8) | 90.8 (93.1) | 94.8 (97.2) | |||
| - | 97.5 | 85.0 (87.2) | 94.1 (96.5) | 96.2 (98.7) | 97.3 (99.8) | 69.3 (71.1) | 85.4 (87.6) | 91.1 (93.4) | 94.7 (97.1) | ||
| Synthon completion | 100.0 | 66.8 | - | 87.2 | 91.5 | 61.1 | - | 81.5 | 86.7 | ||
| 99.7 | 77.4 (77.6) | 89.5 (89.8) | 94.2 (94.5) | 97.6 (97.9) | 75.6 (75.8) | 87.4 (87.7) | 92.5 (92.8) | 96.1 (96.4) | |||
| 100.0 | 75.0 | - | 88.9 | 90.6 | 73.4 | - | 87.9 | 89.8 | |||
| 100.0 | 72.8 | 85.6 | 90.2 | 93.0 | 73.3 | 84.6 | 89.6 | 92.8 | |||
-
•
Columns with 1, 3, 5 and 10 present top-1, top-3, top-5 and top-10 accuracies, respectively. Column “Coverage(%)” represents the percentage of test reactions that the modules of methods can be applied to. “()”: the accuracy within the covered reactions. All the baseline results are reported in their original papers, where “-” represents that the corresponding results are not reported.
Following the typical evaluation for Semi-TB methods as in literature [29], Table 2 presents the individual performance of the two modules - reaction center identification and synthon completion in Semi-TB methods. In Table 2, for the reaction center identification module, the top- accuracy measures the ratio of test products that have the ground-truth reaction center correctly predicted among the top- predictions. In the synthon completion module, the synthon completion is done according to the ground-truth reaction center, not the predicted reaction center; the top- accuracy measures the ratio of test products that have the ground-truth reactants correctly predicted among the top- predictions. Please note that here “ground-truth” reaction center means the reaction center as appears in the benchmark data per our reaction center definition.
Comparison on reaction center identification
Among all the Semi-TB methods, the definitions of reaction centers vary. In , reaction centers are referred to as the only one newly formed bond during the reaction, and reaction center identification predicts whether there is such a new bond (and its location) or not in the products as in a classification problem. This reaction center definition and classification can cover 97.9% of the test data (the rest 2.1% correspond to multiple newly formed bonds). defines the reaction center as the newly formed bond (- as defined in Section “Reaction Centers with New Bond Formation” but without induced bond changes), the changed bond (- as in “Reaction Centers with Bond Type Change”) and the single atom with changed hydrogen count (- as in “Reaction Centers with Single Atoms”), which in total covers 95.0% of the reactions in the test set. aims to identify all the atoms involved in the reactions as reaction centers, which covers all the reactions in the test set. extends the definition of the reaction center in with induced bond type change and atom charge changes, covering 97.5% of the test set.
Due to the data leakage issue as revealed by Yan et al. [27] (i.e., reaction center is given in both the training and test data), the reported reaction center identification performance as cited in Table 2 is overestimated, but the updated results have not been provided in their Github. uses two functions, one for bonds and one for atoms, to predict reaction centers. While these functions are able to predict well when such bonds and atoms are truly reaction centers (i.e., performance in parentheses in Table 2), ’s reaction center definition covers the least (95%) of the test set compared to the other methods, resulting in still low accuracies (i.e., performance outside parentheses) over the test set. has a very generic definition of reaction centers – any atoms involved in the reactions, and uses one unified model to predict these atoms. However, as these atoms may experience different changes (e.g., connected to or disconnected from other atoms), a unified model not customized to specific changes may not suffice, leading to overall relatively low accuracies compared to other methods, particularly when reaction types are unknown. and - have the most comprehensive definition of reaction centers (Section “Reaction Center Identification”) with high coverage (97.5%) on the test set. In addition, and - use a specific predictor for each of the reaction center types. Therefore, they achieve the best overall accuracy among the entire test set, as well as good performance over the reactions covered by its reaction center definition.
Comparison on synthon completion
To compare synthon completion performance, all the ground-truth reaction centers defined by different methods are given and used to start the completion processes. predicts only bond establishment in its reaction center identification and thus has to deal with any associated changes such as bond type change in its synthon completion process, which complicates the synthon completion prediction. Therefore, its performance on synthon completion is the worst among all the methods.
formulates the synthon completion as a classification problem over all the subgraphs that can realize the difference between the synthons and reactants. Therefore, its synthon completion is not guaranteed to work for all possible products (e.g., 99.7% coverage over the test set), particularly if the needed subgraph is not included in the pre-defined vocabulary. Among all the products that can handle, its synthon completion performance is the best, due to that classification can be much easier than generation as all the other methods do. However, since does not do well in reaction center identification, overall, it does not outperform other methods in retrosynthesis prediction as Table 1 demonstrates. In addition, the synthon completion module of may fail to accurately estimate the likelihoods of leaving groups, due to the ignorance of overall structures of predicted reactants. Such inaccurate likelihood estimation may aggravate the bias of beam search and reduce the diversity of predicted reactants as discussed in [29].
transforms the synthons to reactants using a Transformer, but similarly to , also needs to deal with additional predictions such as bond type change. ’s synthon completion performs reasonably well on top-1 accuracies. Together with its good top-1 accuracy on reaction center identification, achieves the best top-1 accuracy with reaction type known as demonstrated in Table 1. uses a rule to enumerate predicted reactants from the top-3 reaction centers, limiting the potential diversity of predicted reactants. On average, underperforms , particularly on top-3 and top-5 accuracies in synthon completion.
does not use BRICS fragments in synthon completion because the fragment information is not available for the substructures that will be attached to synthons. Compared to , leverages a generative process to add substructures to synthons in synthon completion, which is inherently more difficult than classification as in but could be generalizable to new products and reactants. Meanwhile, does not limit the number of reaction centers within the top-10 predicted reactants, and thus increases the diversity of predicted reactants.
Although does not outperform in the synthon completion module alone, its generative process allows to consider all the intermediate molecular structures and more accurately estimate the likelihood of each completion action, conditioned on the reaction centers and the corresponding synthons from its reaction center identification module (i.e., not the ground-truth reaction centers). Consequently, despite employing a beam search strategy similar to that of , the generative process of could alleviate the bias of beam search on most possible reaction centers by accurately estimating the likelihood of the completed reactants. In contrast, may not generalize well, particularly given that ’s reaction center identification does not perform well with respect to the ground-truth reaction centers (i.e., in the top panel of Table 2), but its synthon completion module is trained using the ground-truth reaction centers (i.e., in the bottom panel of Table 2).
Performance on Different Reaction Types
| Type Name | Percentage (%) | Reaction type known | Reaction type unknown | ||||||||
|---|---|---|---|---|---|---|---|---|---|---|---|
| 1 | 3 | 5 | 10 | 1 | 3 | 5 | 10 | ||||
| heteroatom alkylation and arylation | 30.3 | 62.3 | 84.1 | 90.2 | 94.4 | 56.1 | 77.2 | 84.4 | 91.3 | ||
| acylation and related processes | 23.8 | 76.1 | 93.9 | 96.7 | 97.6 | 67.0 | 87.3 | 92.3 | 95.4 | ||
| deprotections | 16.5 | 58.3 | 87.2 | 91.5 | 93.9 | 51.8 | 76.5 | 82.7 | 87.9 | ||
| C-C bond formation | 11.3 | 48.1 | 68.1 | 75.7 | 82.4 | 37.2 | 56.6 | 67.9 | 75.7 | ||
| reductions | 9.2 | 72.5 | 87.9 | 91.8 | 95.0 | 52.7 | 69.8 | 78.1 | 84.6 | ||
| functional group interconversion | 3.7 | 50.5 | 69.0 | 75.5 | 81.0 | 42.4 | 52.7 | 60.9 | 67.9 | ||
| heterocycle formation | 1.8 | - | - | - | - | - | - | - | - | ||
| oxidations | 1.6 | 86.6 | 91.5 | 92.7 | 95.1 | 62.2 | 80.5 | 85.4 | 91.5 | ||
| protections | 1.4 | 85.3 | 89.7 | 89.7 | 89.7 | 48.5 | 67.6 | 85.3 | 86.8 | ||
| functional group addition | 0.5 | 95.7 | 95.7 | 95.7 | 95.7 | 78.3 | 82.6 | 87.0 | 87.0 | ||
-
•
Columns with 1, 3, 5 and 10 present top-1, top-3, top-5 and top-10 accuracies, respectively. Column “Percentage(%)” represents the percentage of reactions in the test set belonging to the specific reaction type. “-” represents that the corresponding results are not available due to the lack of coverage.
Table 3 presents the top- accuracy (=1,3,5,10) of the reactions of different types. This method appears to predict certain reaction types more accurately than others as shown in Table 3. This is likely due to the relative structural diversity among potential reactants, particularly for substrates that can all provide the same products. For example, in the case of oxidations, only a very limited set of substrates can be utilized to generate a ketone, most commonly the oxidation of an alcohol, although ketones can certainly be accessed through other types of reactions as well. This leads to the relatively higher accuracies of on the reactions of oxidations (e.g., 62.2% top-1 accuracy with reaction type unknown). In terms of reductions, however, numerous substrates could be utilized to generate an amine, including reductions of amides, nitro groups, and nitriles to name a few. In addition, there are numerous methods to access the same amines through various structurally unique deprotection reactions. The number of methods available to access a specific functional group, therefore, may make it more difficult to accurately predict which method has been used for a specific molecule, leading to the lower accuracies on reactions of deprotections (e.g., 58.3% top-1 accuracy with reaction type known). This would certainly be the case in carbon-carbon bond forming reactions as well, which can be assembled in a number of ways from various substrates, potentially leading to a somewhat lower prediction success rate (e.g., 37.2% top-1 accuracy with reaction type unknown). In addition, as shown in our case studies, in molecules containing more than one functional group, there are often multiple ways in which that molecule can be assembled by targeting each individual functional group as the reaction center. This means that there are multiple valid reaction pathways which could be considered by synthetic chemists in order to most efficiently construct a molecule. Please note that is designed to predict reactions that involve three types of reaction centers: 1) a single newly formed bond with induced changes in bond types; 2) a single changed bond; 3) a single atom with a fragment removed. As a result, could not fully cover reaction types such as rearrangement, isomerization, cyclization and click reactions, which involve multiple changes in bond formation or atom detachment. This illustrates ’s limitation in handling all possible reaction types. It is worth noting that other semi-template-based methods such as and , also share this limitation. Therefore, developing an effective semi-template-based method that overcomes this limitation could be an interesting future research direction.
Performance of Ensemble-based Methods
We also compared the performance of an ensemble of , referred to as -, with [31] and [32], both of which test each target product multiple times and are strong baselines. and represent each target molecule using multiple non-canonical but equivalent SMILES strings, and use the multiple SMILES strings during model training and testing. By combining the predictions from the multiple SMILES strings of the same target product, these methods have the choice to explore a larger reaction subspace seeded by the SMILES strings, and thus achieve better prediction performance. Compared to the SMILES strings, uses molecular graph representations, and thus each molecule can only have a unique representation. Instead of augmenting molecule representations but still being able to explore a larger reaction subspace as and do, - tests each molecule multiple times using multiple models. Details of - are available in the supplementary Note 2.
| Dataset | Method type | Method | Reaction type unknown | |||
|---|---|---|---|---|---|---|
| 1 | 3 | 5 | 10 | |||
| All reactions | TF | [31] | 52.7 | 73.4 | 79.1 | 83.7 |
| [32] | 56.5 | 79.4 | 86.0 | 91.0 | ||
| Semi-TB | - | 56.4 | 78.8 | 85.2 | 90.5 | |
| Reactions covered by | TF | [31] | 54.1 | 75.5 | 81.4 | 85.8 |
| [32] | 56.8 | 79.7 | 86.2 | 91.3 | ||
| Semi-TB | - | 57.8 | 80.7 | 87.3 | 92.7 | |
-
•
Columns with 1, 3, 5 and 10 present top-1, top-3, top-5 and top-10 accuracies, respectively. Best top- accuracy values among the methods of each type are in bold.
Table 4 presents the comparison among -, and on top- accuracy (=1,3,5,10) over all the reactions and the reactions covered by , both with the reaction type unknown. Please note that the performance of and on reactions with known types is not available in the respective papers [31, 32], and the methods also cannot be easily extended to handle known reaction types. In Table 4, all the methods test each molecule 20 times, that is, and augment each target molecule with 20 SMILES strings, and - uses an ensemble of 20 models to test each molecule. The results of and are calculated using the source code and data available from the respective papers. Table 4 shows that - achieves competitive performance with the best baseline . Over all the reactions, - achieves almost the best performance on top-1 (56.4%, compared to 56.5% for ), and only slightly underperforms the best baseline on top-3, top-5 and top 10 (78.8% vs 79.2% on top-3; 85.2% vs 86.2% on top-5; 90.5% vs 91.0% on top-10). Over the reactions covered by , - outperforms the baseline on top-1 accuracy at 1.76%, on top-3 accuracy at 1.25%, on top-5 accuracy at 1.28%, and on top-10 accuracy at 1.53%. Compared to , which is an end-to-end black-box that directly transfers product SMILES string to reactant SMILES strings, provides certain interpretability of the predicted reaction centers, and what reactants are generated from them. More details about the comparison on different reaction types and on reactions covered by - are available in the supplementary Note 2.
Case Study
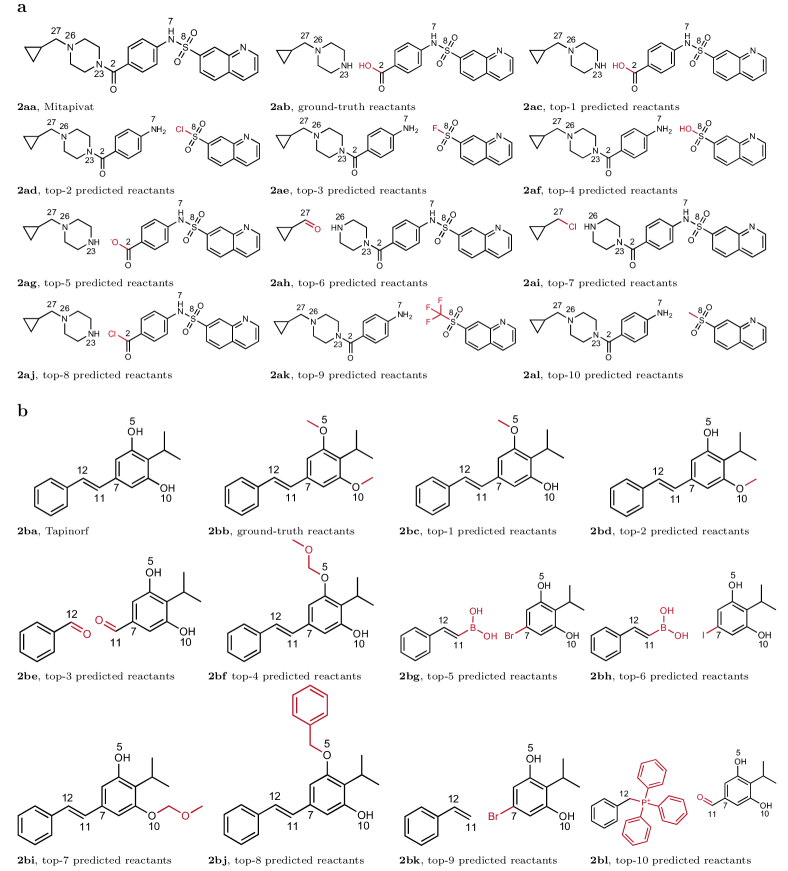
can predict multiple reactions for each product due to multiple predicted reaction centers. This variability could be useful for chemical synthesis in order to consider all possible reaction strategies. In order to illustrate the predictive power of , we have highlighted the top-10 predicted reactants by with reaction types unknown for four newly approved drug molecules in 2022, including Mitapivat, Tapinorf, Mavacamten, and Oteseconazole [40]. Among them, the predicted reactants for Mitapivat and Tapinorf are presented in Figure 2aa and 2ba which will be discussed later; the results and the discussions for Mavacamten and Oteseconazole are available in Supplementary Figure 1, Supplementary Figure 2 and Supplementary Note 3. Note that these drugs are not included in our training, validation, or testing data. Therefore, how works on these drugs truly indicates its predictive power for new molecules.
Mitapivat as in Figure 2aa is a drug approved for hereditary hemolytic anemias in 2022 [41]. The synthetic route within the patent [42] reporting the discovery of Mitapivat utilizes an amide coupling reaction to form the C2-N23 bond (Figure 2ab). This is correctly predicted by as the top-1 reaction (Figure 2ac). As indicated by the top-5 reaction (Figure 2ag), also predicts that the amide coupling reaction could be performed with the carboxylate salt of one of the reactants, a useful reactant under the right pH conditions. also predicts that the acyl chloride as the substrate in this transformation would also react with the amine group and produce the desired molecule (Figure 2aj), In addition, identifies the N7-S8 bond of sulfonamide linkage as the reaction center (e.g., Figure 2ad, 2ae, 2af, 2ak, 2al). Most impressively, predicts various S8 sulfonyl groups reacting with the N7 amine group, such as sulfonyl chloride (Figure 2ad), sulfonyl fluoride (Figure 2ae) and sulfonic acid (Figure 2af), which are theoretically feasible for the formation of the N7-S8 bond. also predicts that the N26-C27 bond could be the reaction center and formed by the N26 amine group reacting through a reductive amination with ketone in Figure 2ah or through a nucleophilic substitution with the chloride in Figure 2ai.
Tapinarof as in Figure 2ba is a drug approved for plaque psoriasis and atopic dermatits [43]. The reported synthesis in patent [44] constructs this drug by removing the protecting groups on O5 and O10 (Figure 2bb). correctly predicts the deprotection of the methyl groups on O5 (Figure 2bc) or O10 (Figure 2bd), which would work to produce the desired molecule, although the ground truth failed to be predicted due to the limitation of reaction centers. Similarly, generates possible reactants that contain different types of protected alcohols, as seen with the methoxymethyl groups on O5 and O10 in Figure 2bf and Figure 2bi and the benzyl-protected O5 in Figure 2bj. Most impressively, also identifies the alkene linkage between C11 and C12 (Figure 2be and 2bl) and the C-C bond between C7 and C11 (Figure 2bg, 2bh, ad 2bk) as reaction centers with various coupling reactions. These coupling reactions include McMurry coupling [45] (Figure 2be), Wittig coupling [46] (Figure 2bl) and Suzuki coupling [7] (Figure 2bg and 2bh).
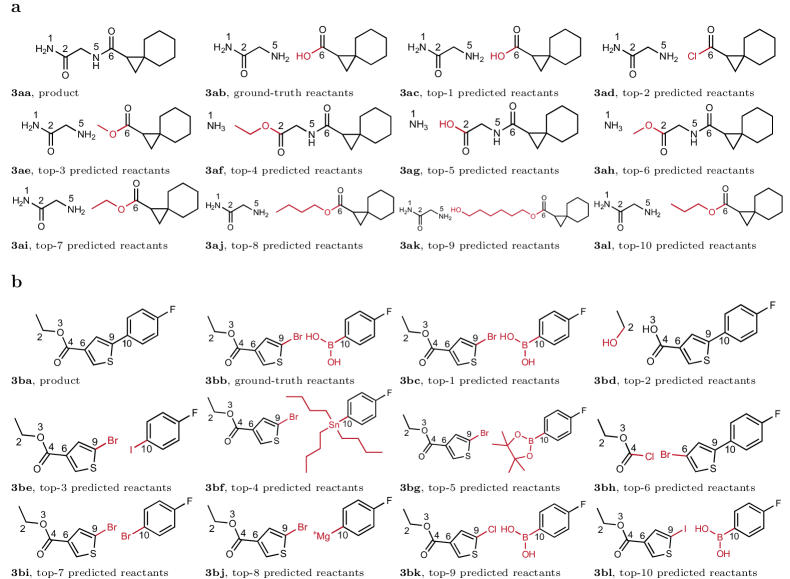
In addition, we also highlighted two molecules in the test set and their predicted reactions by with reaction types unknown in Figure 3a and 3b, respectively. The product in Figure 3aa contains amide linkages and was assembled in the patent literature utilizing amide coupling reactions (ground truth in Figure 3ab). correctly predicted this coupling as the top-1 reaction for the construction of this molecule (Figure 3ac). The other reactions predicted, however, are also very instructive into the strengths and limitations of . In Figure 3aa, the product has two amide groups in the side chain of the molecule. identified both of these linkages as potential reaction centers (e.g., in Figure 3ac between N5 and C6; in Figure 3ag between N1 and C2). Typically, chemists would disconnect the molecule at the C6 amide carbonyl rather than C2 so that a fully elaborated side chain can be introduced to complete the molecule. This approach would generally be considered more efficient since its reaction introduces more complexity into the molecule in a single step and would therefore be predicted to limit the total number of steps necessary to construct the molecule. In some limited cases, however, it may be necessary to introduce the nitrogen at N1 last (e.g., in Figure 3af-3ah), so this should also be considered a feasible reaction. In addition to the typical amide coupling strategy, which takes place between an amine and a carboxylic acid, also correctly identifies the reaction of the amine with an acid chloride to make the same bond (Figure 3ad). Although this was not the strategy utilized in the ground-truth study, this strategy would certainly be expected to work in this case for construction of this molecule. The other common reaction that was predicted for this example was the nucleophilic addition of the N5 (or N1) amine into the C6 (or C2) carbonyl of an ester (N5-C6 - Figure 3ae, 3ai, 3aj, 3ak, 3al and N1-C2 - Figure 3ag and 3ah). This type of reaction, which is essentially a transamidation reaction, should also work to provide the product. Interestingly, however, predicts several different esters as substrates for this transformation (Figure 3ac, 3ae, 3ai, 3aj, 3ak and 3al). While these are different substrates, the variation of the ester side chain in these cases would not typically be considered as greatly different by a synthetic chemist unless steric or electronic contributions affect the reactivity/electrophilicity of the ester carbonyl.
Retrosynthesis of the product in Figure 3b involves a C-C bond forming reaction between C9 and C10 (Figure 3ba). The disconnection of the carbon-carbon bond between the two aromatic rings, a heteroaromatic thiophene and a benzene ring in this case, represents the most obvious disconnection in the molecule. In this case, the top-1 reaction (Figure 3bc) predicted by for this transformation is a Suzuki coupling [7], a common metal-mediated coupling between a boronic acid reactant and a corresponding aryl halide. This common transformation is the same reaction observed in the ground truth (Figure 3bb). Interestingly, also identifies additional permutations of this Suzuki reaction through changing the nature of the aryl halide (Figure 3bk and 3bl). Traditionally, aryl chlorides (Figure 3bk) are less reactive than aryl bromides or iodides (Figure 3bc and 3bl) for coupling reactions and in the past were considered unreactive in these reactions. Newer methods [48] using specially designed ligands, however, have made the use of such chlorides possible. The other difference observed in the predicted Suzuki couplings is the use of a boronic ester (Figure 3bg) versus a boronic acid (Figure 3bc). Both boronic acids and boronic esters are common reagents for these transformations, with many being readily available from commercial sources. also predicts that an esterification reaction at the C4 carboxylic acid would also work to produce the desired molecule (Figure 3bd). While this is potentially not as synthetically useful for building the molecule, it is a reasonable transformation. Most impressively, also predicts other coupling reactions [49] for the biaryl coupling reaction. These other methods include an Ullmann-type coupling [8] (Figure 3be and 3bi) a Stille coupling [51] (Figure 3bf), and a Kumada coupling [52, 48] (Figure 3bj). This versatility predicted in the top-10 reactions may be of synthetic value for substrates if specific coupling methods fail or if the functionality necessary for one type of coupling reaction is not able to be easily prepared.
The above examples indicate that the predicted reactions from rather than the ground truth could be still possible and synthetically useful. Therefore, a more comprehensive evaluation strategy is needed not to miss those possible and potentially novel synthesis reactions.
Diversity on predicted reactions
Diversity in predicted reactions is always desired, as it has the potential to enable the exploration of multiple synthesis routes. has the mechanisms to facilitate diverse predictions: The beam search strategy in allows multiple reaction centers and multiple different attachments, and therefore potentially different scaffolds and structures in the predicted reactants.
To analyze the diversity of results, we analyzed the reaction centers among the top-predicted reactions. We identified a set of products such that their third or fifth predicted reactions are the ground truth, referred to as having a hit at 3 or 5, respectively. Please note each predicted reaction was scored using the sum of the log-likelihoods of all the predictions along the transformation paths from the product to its reactants (please refer to Section “Inference”), and then ranked based on the score. Thus, the predicted reactions ranked above the ground truth have a higher likelihood than the ground truth. Given that has demonstrated strong performance as in Table 1 in scoring and prioritizing the ground-truth reactions, we assume that its likelihood calculation is reliable and therefore, the reactions ranked above the ground truth might also be likely to occur.
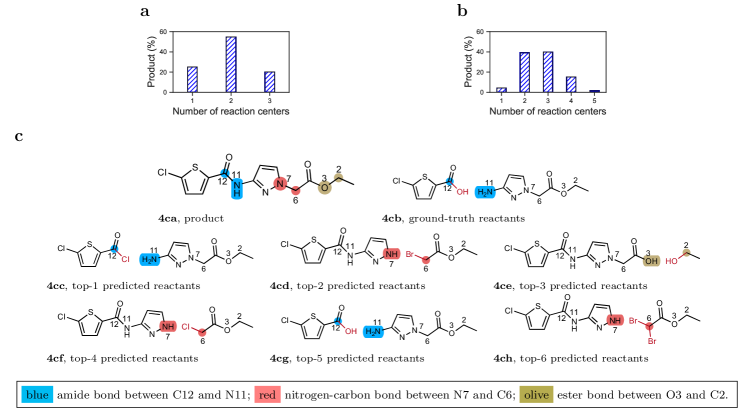
Figure 4a and 4b presents the distribution of products with hits at 3 or 5 over the number of reaction centers among predicted reactions ranked above the ground truth. Figure 4a shows that more than 50% of the products with a hit at 3 have their top-3 reactions from two different reaction centers; about 20% of the products have their top-3 reactions from three different reaction centers. Figure 4b shows that for products with a hit at 5, almost 40% have two reaction centers, and another 40% have three reaction centers, among their top-5 predicted reactions; more than 10% have four reaction centers. Thus, Figure 4a and 4b clearly demonstrate that the top predicted reactions were diverse, demonstrated by the different reaction centers they were derived from. Meanwhile, we acknowledge that the diverse, top predictions may still be errors and thus, more reliable wet-lab experimental validation is needed.
Figure 4c presents an example of very diverse reactions with diverse reaction centers predicted by . For the product in Figure 4ca, predicts three different reaction centers: an amide bond (between C12 and N11), a nitrogen-carbon bond (between N7 and C6) and ester (between O3 and C2). The patent reported that the target molecule was synthesized from a carboxylic acid derivative and an amine using amide coupling with a widely-used coupling reagent, EDC (Figure 4cb). predicted an acyl chloride-amine reactant pair as the top-1 result (Figure 4cc), a potentially viable and even high yielding synthetic approach. It also predicts three reactant pairs from the other two reaction centers as possible routes within the top 4 (Figure 4cd and 4cf at which involve alkylation reactions to form the C6-N7 bond; Figure 4ce at which forms the ester linkage between O3 and C2).
We also analyzed the reaction diversity by comparing the number of reaction centers in products with high reaction diversity and low reaction diversity. For each product, the diversity of its predicted reactions is represented by the distribution of all pairwise similarities of its predicted reactions, that is, lower reaction similarities indicate higher reaction diversity. Please note that the reaction similarity is only applicable to two reactions that share the same product. Therefore, the product is not considered in the similarity calculation. Formally, for reaction : and reaction : , the similarity between and was calculated as follows,
| (1) |
where is a similarity function over molecules, calculated using Tanimoto coefficient over 2,048-bit Morgan fingerprints of the molecules. For reaction : and reaction : , the similarity between them was calculated as follows,
| (2) |
where denotes the composite molecule consisting of two disconnected components and . For reaction : and reaction : , the similarity between them was calculated as follows,
| (3) |
We clustered the products according to their reaction similarity distributions using the K-means clustering algorithm in Euclidean distances. The clustering algorithm is presented in Supplementary Algorithm 1 in Supplementary Note 4. Figure 5a presents the clustering results for products that have their ground-truth reaction correctly predicted among the top-10 predictions. In Figure 5a, the first four clusters have on average lower reaction similarities (on average 0.46 among the four clusters; 0.41, 0.45, 0.45, 0.49 in each of the clusters, respectively), and thus are referred to as high-reaction-diversity clusters (); the other six clusters, referred to as low-reaction-diversity clusters (), have relatively higher reaction similarities (on average 0.58 for among the six clusters; 0.52, 0.53, 0.58, 0.62, 0.67, 0.67 in each of the clusters, respectively).
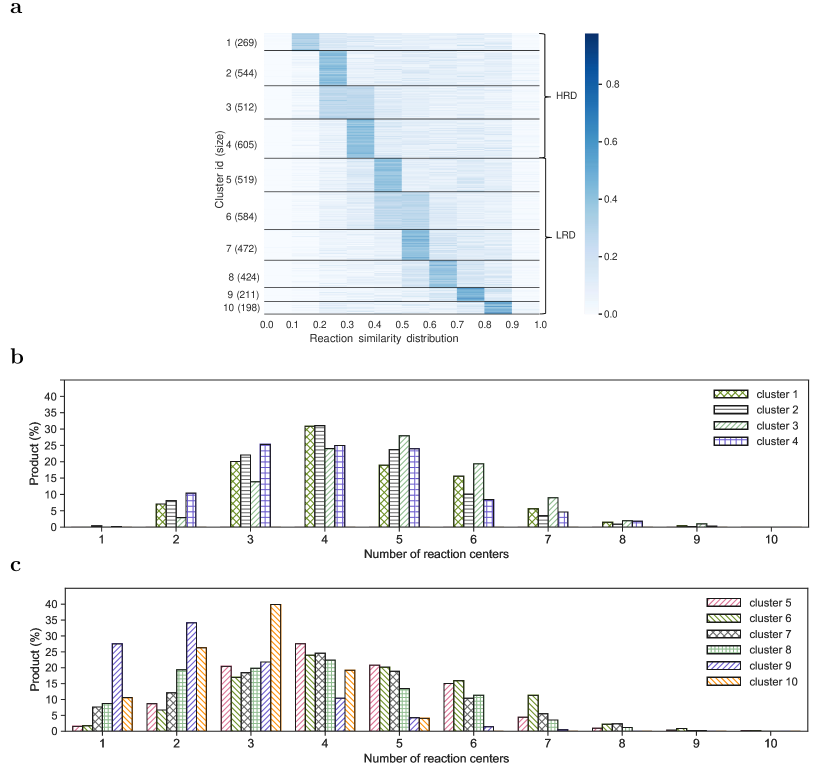
Figure 5b and 5c present the distributions of the number of reaction centers in the products of these two clusters. Comparing Figure 5b and Figure 5c, products tend to have more reaction centers in their predicted reactions than those in products, and the number of reaction centers correlates well with reaction diversity (-0.8486 between the average reaction similarities and the number of reaction centers). Particularly, the first cluster (in ), which has the highest reaction diversity (lowest reaction similarity), has on average 4.41 reaction centers in the top-10 predicted reactions of each product, compared to the average 3.92 reaction centers in the top-10 predicted reactions of each product in clusters. The ninth and tenth clusters, which have the lowest reaction diversity, have on average 2.57 reaction centers. These results clearly show the diversity of predictions.
Discussion
Comparison among template-based, template-free and semi-template-based methods
Template-based methods were first developed for retrosynthesis prediction. They match products into pre-defined templates that are extracted from training data or hand-crafted based on knowledge. A notable advantage of templates is that they can enable strong interpretability (e.g., each template may correspond to a certain reaction type, a chemical scaffold, or a reactivity pattern) and thus result in reactions that better conform to domain knowledge. They can also well fit the data if the templates are extracted from the data. However, they suffer from a lack of strong learning capabilities and a lack of generalizability, if the templates do not cover and cannot automatically discover novel reaction patterns.
Template-free methods largely leverage the technological advancement in Natural Language Processing (NLP), including large-scale language models such as Transformer and BART [53], and also many pre-training techniques. Most of them formulate a reaction as a SMILES string translation problem. Rather than enumerating pre-defined patterns (i.e., templates) as template-based methods do, template-free methods are equipped with much stronger learning capabilities from SMILES strings and can represent latent reaction transformation patterns in an operable manner. However, template-free methods sacrifice their interpretability as it is non-retrieval to decipher why an atom (analogous to a token in NLP) is generated next along the SMILES strings, or what chemical knowledge the actions correspond to. In addition, as SMILES strings are a ‘flattened’ representation of molecular graphs according to the atom orderings from a graph traversal, template-free methods using SMILES strings only cannot fully leverage molecular structures, which ultimately determine molecule synthesizability and reaction types. To mitigate this issue, some template-free methods either enrich the product SMILES representation with molecular graph information [19, 23, 25] or decode reactant SMILES strings from product molecular graphs [21], which, however, require additional learning of the mapping from molecular graphs to SMILES and thus increase the learning complexity.
Semi-template-based methods, typically over molecular graphs, represent the most recent and also in general the best performing retrosynthesis prediction methods. They utilize the powerful graph representation learning paradigm to better capture molecule structures. They also take advantage of graph (variational) auto-encoder frameworks or sequential predictions to empower the models with generative ability. More importantly, semi-template-based methods have the mechanism to enable diversity among predicted reactions, by allowing multiple samplings from the latent space. Meanwhile, semi-template-based methods have two steps: (1) reaction center identification, and (2) synthon completion, better complying with how chemical reactions are understood and enabling certain interpretability of predicted reaction centers and derived reactants. is a semi-template-based method and achieves superior performance to other methods, demonstrating it as a state-of-the-art method for retrosynthesis prediction.
Comparison issues among existing methods
In our study of the baseline methods, several issues were identified among existing methods that make comparison across different methods hard. In Table 1, ’s results are from its updated GitHub [54], as their results originally reported in their manuscript had a data leakage issue (all the reaction centers were implicitly given) and thus were overestimated [27]. may also suffer from the data leakage issue as discussed in its github [55], but ’s results were only available from its original paper, though likely overestimated. In addition, there have been some reproducibility issues with G2G [56], as we also observed in our study. All the methods except , -, and published their code and datasets. Among these methods, most template-free methods including , , , , and used the same data split, which is, however, different from the benchmark data split used in the other methods. For example, the training set of these template-free methods has 40,029 reactions, while the training set of the other methods including has 40,008 reactions. Even though all the methods adopted the same ratio (i.e., 80%/10%/10% for training/validation/test set) to split the benchmark dataset, their splits, particularly their test sets, are not identical, making it hard to compare these methods. In this manuscript, we adopted the data split used by the previous semi-template-based methods; for the template-free methods with different data splits, we still used the results reported by their authors. We believe reproducibility and unbiased comparison (e.g., on the same benchmark data and same splits, generating the same amount of results to compare) among all the retrosynthesis prediction methods are critical to moving this research forward. They require dedicated research, implementation and regulatory effort from the entire research community, for example, by following the Open Science Policy from the European Union [57] and the Data Sharing Policy from the United States National Institute of Health [58]. Unfortunately, it is out of the scope of this manuscript.
Conclusions
predicts reactions of given target molecules by predicting their reaction centers, and then completing the resulting synthons by attaching small substructures. Based on a comparison against twenty baseline methods over a benchmark dataset, achieves the state-of-the-art performance under most metrics. The case studies show that also enables diverse predictions. However, still has several limitations. First, the three types of reaction centers in still cannot cover all possible reaction center types (e.g., the reactions with multiple newly formed bonds). Therefore, a more comprehensive definition of reaction center types is still needed. cannot cover bonds or rings that are attached at the reaction centers but do not appear in the training data either, as the substructures that employs to complete synthons are extracted only from training data. In addition, the atom-mapping between products and reactants that is required by (and required by many existing methods) to complete synthons is not always available or of high quality (it is available in USPTO-50K). To identify such mappings, it requires to calculate graph isomorphism, which is an NP-hard problem. Moreover, the sum of log-likelihoods of all the involved predictions (i.e., reaction center prediction, attached atom type prediction) that uses to prioritize reactions, is not necessarily the same as the likelihood of the reactions, which could affect the quality of the prioritized reactions. We are also investigating a systemic evaluation and in vitro validation protocol, in addition to using top- accuracy, as we discussed earlier. Multiple-step retrosynthesis could be possible by applying multiple times iteratively, each time on a reactant as the target molecule. Connected after the deep generative models that have been developed to optimize small molecule structures and properties [59, 60] for lead optimization, has a great potential to generate synthetic reactions for these in silico generated drug-like molecules, and thus substantially speed up the drug development process.
Methods
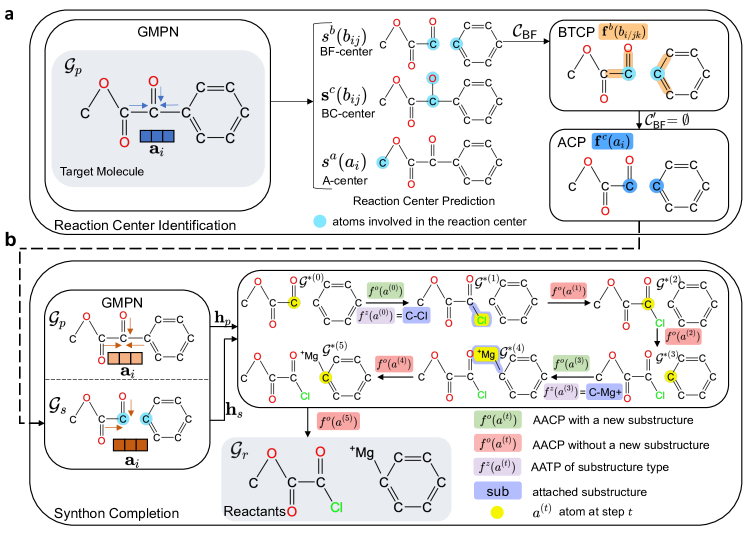
is developed for the one-step retrosynthesis prediction problem, that is, given the target molecule (i.e., product), identifies a set of reactants that can be used to synthesize the molecule through one synthetic reaction. Following the prior semi-template-based methods [28, 29], generates reactants from products in two steps. In the first step, identifies the reaction center from the target molecule using the center identification module. defines the reaction centers as the single bond that is either newly formed or has the bond type changed, or the single atom with changed hydrogen count during the reaction. also incorporates into the reaction center the bonds neighboring the reaction centers that have type changes induced by the newly formed bond, and the atoms with charge changes within the target molecule (more details in “Reaction Center Identification” Section). Given the reaction center, converts the target molecule into a set of intermediate molecular structures referred to as synthons, which are incomplete molecules and will be completed into reactants. In the second step, completes synthons into reactants by sequentially attaching bonds or rings in the synthon completion module. The intermediate molecular structures before being completed to reactants are referred to as updated synthons. Figure 1 presents the overall model architecture of . All the algorithms are presented in Supplementary Note 5.
Molecule Representations and Notations
Supplementary Table 3 in Supplementary Note 6 presents the key notations used in this manuscript. A synthetic reaction involves a set of reactants and a product molecule that is synthesized from the reactants. Please note that we do not consider reagents or catalysts in this study. Each reactant has a corresponding synthon , representing the substructures of that appear in . We represent the product molecule using a molecular graph , denoted as , where is the set of atoms in , and is the set of corresponding bonds , where connects atoms and . We also represent the set of the reactants or the set of synthons of using only one molecular graph or , respectively. Here, and could be disconnected with each connected component representing one reactant or one synthon.
For synthon completion, we define a substructure as a bond (i.e., ) or a ring structure (i.e., ) that is used to complete synthons into reactants. We construct a substructure vocabulary by comparing ’s and their corresponding ’s in the training data, and extracting all the possible substructures from their differences. In total, extracted 83 substructures, covering all the reactions in the test data. Details about these substructures are available in Supplementary Figure 3 and Supplementary Figure 4 in Supplementary Note 7. Note that different from templates used in TB methods, the substructures used are only bonds and rings, and multiple bonds and rings can be attached to complete a synthon. For simplicity, when no ambiguity arises, we omit the super/sub-scripts and use to represent .
Molecule Representation Learning
learns the atom representations over the molecular graph using the same message passing networks () as in Chen et al. [59] (Supplementary Algorithm 4 in Supplementary Note 5).
first learns atom embeddings to capture the atom types and their local neighborhood structures by passing the messages along the bonds in the molecular graphs. Each bond is associated with two message vectors and . The message at -th iteration encodes the messages passing from to , and is updated as follows,
| (4) |
where is the atom feature vector, including the atom type, valence, charge, the number of hydrogens, whether the atom is included in a ring and whether the ring is aromatic; is the bond feature vector, including the bond type, whether the bond is conjugated or aromatic, and whether the bond is in a ring; ’s (=1,2,3,4) are the learnable parameter matrices; is initialized with the zero vector; is the set with all the neighbors of (i.e., atoms connected with ); and ReLU is the activation function. The message captures the structure of -hop neighbors passing through the bond to , by iteratively aggregating the neighborhood messages . With the maximum iterations, derives the atom embedding as follows,
| (5) |
where denotes the concatenation of ; ’s (=1,2,3) are the learnable parameter matrices. The embedding of the molecular graph is calculated by summing over all the atom embeddings as follows,
| (6) |
For and , their embeddings calculated from their moleculear graphs as above are denoted as and , respectively.
Reaction Center Identification
Given a product , defines three types of reaction centers in (Supplementary Algorithm 3 in Supplementary Note 5).
-
1.
a new bond , referred to as bond formation center (-), that is formed across the reactants during the reaction but does not exist in any of the reactants;
-
2.
an existing bond in a reactant, referred to as bond type change center (-), whose type changes during the reaction due to the gain or loss of hydrogens, while no other changes (e.g., new bond formation) happen; and
-
3.
an atom in a reactant, referred to as atom reaction center (-), from which a fragment is removed during the reaction, without new bond formation or bond type changes.
The above three types of reaction centers cover 97.7% of the training set. The remaining 2.3% of the reactions in the training data involve multiple new bond formations or bond type changes, and will be left for future research. Note that with a single atom as the reaction center, the synthon is the product itself. We refer to all the transformations needed to change a product to synthons as product-synthon transformations, denoted as 2- (Supplementary Algorithm 5 in Supplementary Note 5).
Reaction Centers with New Bond Formation (-)
Following Somnath et al. [29], derives the bond representations as follows,
| (7) |
where represents the absolute difference; ’s (=1,2,3,4) are the learnable parameter matrices. uses the sum and the absolute difference of embeddings of the connected atoms to capture the local neighborhood structure of bond . Meanwhile, the two terms are both permutation-invariant to the order of and , and together can differentiate the information in and . With the bond representation, calculates a score for each bond as follows,
| (8) |
where is the representation of the product graph calculated as in Equation 6; is a learnable parameter vector and and are the learnable parameter matrices. measures how likely bond is a - using by looking at the bond itself (i.e., ) and the structure of the entire product graph (i.e., ). scores each bond in and selects the most possible - candidates with the highest scores. breaks each product at each possible - into synthons, and thus can generate multiple possible reactions.
In synthetic reactions, the formation of new bonds could induce the changes of neighbor bonds. Therefore, also predicts whether the types of bonds neighboring the - are changed during the reaction, referred to as the - induced bond type change prediction (). Given the - , the set of the bonds neighboring is referred to as the - neighbor bonds, denoted as , that is:
| (9) |
Thus, predicts a probability distribution for each neighboring bond in , denoted as , as follows,
| (10) |
where ’s (=1,2,3) are the learnable parameter matrices. The first element in represents how likely the type is changed during the reaction (It is determined as type change if is not the maximum in ), and the other three represent how likely the original in the reactant is single, double or triple bond, respectively (these three elements are reset to 0 if type is predicted unchanged). Here, measures neighbor bond type change by looking at the neighbor bond itself (i.e., ), the - (i.e., ) and the overall product (i.e., ). updates the synthons by changing the neighboring bonds of the - to their predicted original types. The predicted changed neighbor bonds are denoted as .
Reaction Centers with Bond Type Change (-)
If a reaction center is due to a bond type change without new bond formations, calculates a score vector for each bond in as follows,
| (11) |
where ’s (=1,2,3) are the learnable parameter matrices. Each element in , denoted as (), represents, if is the -, the score of ’s original type in being single, double, and triple bond, respectively. The element in corresponding to ’s type in is reset to 0 (i.e., ’s type has to be different in compared to that in ). Thus, the most possible - candidates and their possible original bond types scored by are selected. then changes the corresponding bond type to construct the synthons.
Reaction Centers with Single Atoms (-)
If a reaction center is only at a single atom with a fragment removed, predicts a center score for each atom in as follows,
| (12) |
where is a learnable parameter vector and and are the learnable parameter matrices. selects the atoms in with the highest scores as potential -’s. In synthon completion, new fragments will be attached at the atom reaction centers.
Atom Charge Prediction ()
For all the atoms involved in the reaction center or - changed neighbor bonds , also predicts whether the charge of remains unchanged in reactants. uses an embedding to represent all the involved bond formations and changes in 2-. If the reaction center is predicted as a - at , calculates the embedding as follows,
| (13) |
where is a subset of with all the bonds that changed types; is a 14 one-hot vector, in which if bond is the bond formation center (i.e., ), or (=1, 2, 3) if type is changed from single, double or triple bond in reactants, respectively, during the reaction (i.e., is in ); ’s () are the learnable parameter matrices.
If the reaction center is predicted as a - at , is calculated as follows,
| (14) |
where and (=1, 2, 3) if type is changed from single, double or triple bond in reactants, respectively, during the reaction. If the reaction center is an -, no 2- are needed and thus .
With the embedding for 2-, calculates the probabilities that will have charge changes during the reaction as follows,
| (15) |
where and are the learnable parameter matrices; is a vector representing the probabilities of accepting one electron, donating one electron or no electron change during the reaction. The option corresponding to the maximum value in is selected and will be applied to update synthon charges accordingly. considers at most one electron change since this is the case for all the reactions in the benchmark data.
Reaction Center Identification Module Training
With the scores for three types of reaction centers, minimizes the following cross entropy loss to learn the above scoring functions (i.e., Equation 8, 11 and 12),
| (16) |
where () is the label indicating whether the corresponding candidate is the ground-truth reaction center of type () or not (); is an indicator function ( if , 0 otherwise), and thus indicates whether the ground-truth bond type of is or not (=1, 2, 3 indicating single, double or triple bond); and ()/ is the probability calculated by normalizing the score /, that is, , where (). Similarly, also learns the predictor for neighbor bond changes (Equation 10) and for atom charge changes (Equation 15) by minimizing their respective cross entropy loss and . Therefore, the center identification module learns the predictors by solving the following optimization problem:
| (17) |
where is the set of all the parameters in the prediction functions. We used Adam algorithm to solve the optimization problem and do the same for the other training objectives.
Synthon Completion
Once the reaction centers are identified and all the product-synthon transformations (2-) are conducted to generate synthons from products, completes the synthons into the reactants by sequentially attaching substructures (Supplementary Algorithm 6 in Supplementary Note 5). All the actions involved in this process are referred to as synthon-reactant transformations. During the completion process, any intermediate molecules are represented as molecular graph . At step , we denote the atom in the intermediate molecular graph () that new substructures will be attached to as , and denote the substructure attached to as , resulting in .
Atom Attachment Prediction
The algorithm for atom attachment prediction is presented in Supplementary Algorithm 8 in Supplementary Note 5. first predicts whether further attachment should be added to or should stop at , referred to as the atom attachment continuity prediction (), with the probability calculated as follows,
| (18) |
where
| (19) |
In Equation 18, is the embedding of calculated over the graph (Equation 5); is the representation for all the synthons as in Equation 19; ’s (=1,2,3) are the learnable parameter matrices; is the sigmoid function. In Equation 19, calculates the representations by applying over the graph that could be disconnected, and the resulted representation is equivalent to applying over each ’s connected component independently and then summing over their representations. intuitively measures “how likely” the atom has a new substructure attached to it by looking at the atom itself (i.e., ), all the synthons (i.e., ), and the product (i.e., ). Note that in Equation 18, BRICS fragment information (i.e., as in Equation S3 in Supplementary Note 1) is not used because the fragments for the substructures that will be attached to will not be available until the substructures are determined.
If is predicted to attach with a new substructure, predicts the type of the new substructure, referred to as the atom attachment type prediction (), with the probabilities of all the substructure types in the vocabulary , calculated as follows,
| (20) |
where ’s (=1,2,3) are the learnable parameter matrices. Higher probability for a substructure type indicates that is more likely to be selected as . The atoms in the attached substructure are stored for further attachment, that is, they, together with any newly added atoms along the iterative process, will become () in a depth-first order in the retrospective reactant graphs. stops the entire synthon completion process after all the atoms in the reaction centers and the newly added atoms are predicted to have no more substructures to be attached.
Synthon Completion Model Training
trains the synthon completion module using the teacher forcing strategy, and attaches the ground-truth fragments instead of the prediction results to the intermediate molecules during training. learns the predictors (Equation 18) and (Equation 20) by minimizing their cross entropy losses and as follows:
| (21) |
where is the set of parameters.
Inference
The algorithm for inference is presented in Supplementary Algorithm 2 in Supplementary Note 5.
Top- Reaction Center Selection
During the inference, generates a ranked list of candidate reactant graphs (note that each reactant graph can be disconnected with multiple connected components each representing a reactant). With a beam size , for each product, first selects the top- most possible reaction centers from each reaction center type (-, - and -), and then selects the top- most possible reaction centers from all the 3 candidates based on their corresponding scores (i.e., as in Equation 8 for -, as in Equation 11 for -, and as in Equation 12 for -). Then converts the product graph into the top- synthon graphs accordingly. Different reaction centers lead to diverse synthons. For these synthon graphs, neighbor bond type change is predicted when necessary; atom charge change is predicted for all the atoms involved in reaction centers and their neighboring bonds for -’s. All the bond type changes and atom charge changes are predicted as those with the highest probabilities as in Equation 10 and Equation 15, respectively.
Top- Reactant Graph Generation
Once the top- reaction centers for each product are selected and their synthon graphs are generated, completes the synthon graphs into reactant graphs. During the completion, scores each possible reactant graph and uses their final scores to select the top- reactant graphs, and thus top- most possible synthetic reactions, for each product. Since during synthon completion, the attachment substructure type prediction (Equation 20) gives a distribution of all possible attachment substructures; by using top possible substructures, each synthon and its intermediate graphs can be extended to multiple different intermediate graphs, leading to exponentially many reactant graphs and diversity in the predicted reactions. The intermediate graphs are denoted as , where is for the -th possible intermediate graph of the -th synthon graph at step . However, to fully generate all the possible completed reactant graphs, excessive computation is demanded. Instead, applies a greedy beam search strategy (Supplementary Algorithm 7 in Supplementary Note 5) to only explore the most possible top reactant graph completion paths.
In the beam search strategy, scores each intermediate graph using a score , which is calculated as the sum over all the log-likelihoods of all the predictions along the completion path from up to ; is initialized as the sum of the log-likelihoods of all the predictions from to . At each step (), each intermediate graph is extended to at most + intermediate graph candidates. These + candidates include the one that is predicted to stop at the atom that new substructures could be attached to (i.e., as in Equation 18; this intermediate graph could be further completed at other atoms) in this step, and at most candidates with the top- predicted substructures attached (Equation 20). Among all the candidates generated from all the intermediate graphs at step , the top- scored ones will be further forwarded into the next completion step +. In case some of the top- graphs are fully completed, the remaining will go through the next steps. This process will be ended until the number of all the completed reactant graphs at different steps reaches or goes above . Then, among all the incomplete graphs at the last step, the intermediate graphs with log-likelihood values higher than the -th largest score in all the completed ones will continue to complete as above. The entire process will end until no more intermediate graphs are qualified to further completion. Among all the completed graphs, the top- graphs are selected as the generated reactants.
Related Work
Deep-learning-based retrosynthesis prediction methods are typically categorized into three classes: template based (TB), template free (TF) and semi-template based (Semi-TB).
Template-based methods
Template-based methods formulate the retrosynthesis problem as a selection problem over a set of reaction templates. These templates can be either hand-crafted by experts [61] or automatically extracted from known reactions in databases [12, 13, 14, 15, 16]. Szymkuc et al. [61] provided a review on using reaction templates coded by human experts for synthetic planning. However, these rules may not cover a large set of reactions due to the limitation of human annotation capacity. Recent template-based methods extract reaction templates automatically from databases. With the reaction templates available, Coley et al. [12] () selected the reaction templates that the corresponding reactions in the database have the products most similar with the target molecules, in order to synthesize the target molecules. Dai et al. [14] learned the joint probabilities of templates matched in the product molecules and all its possible reactants using two energy functions, one for reaction template scoring and the other for reactant scoring conditioned on templates. Seidl et al. [15] () learned to associate the target molecule with the relevant reaction templates using a modern Hopfield network. Chen et al. [16] () scored the suitability of all the reaction templates at all the potential reaction centers (atoms and bonds) in the target molecule. The use of templates provides interpretability towards the reasoning behind the generated reactions. However, these templates also limit the template-based methods to the reactions only covered by the templates.
Template-free methods
Template-free methods directly learn to transform the product into the reactants without using the reaction templates [17, 18, 19, 20, 21, 22, 24, 31, 25]. Most template-free methods utilize the sequence representations of molecules (SMILES) and formulate the transformation between the product and its corresponding reactants as a sequence-to-sequence problem. Many SMILES-based methods use Transformer [33], a language model with attention mechanisms to model the relationship across tokens. Transformer follows the encoder-decoder architecture, which encodes the product SMILES string into a latent vector and then decodes the vector into the reactant SMILES strings. For example, Kim et al. [22] () learned the transformation from a product to its reactants using two coupled Transformers with shared parameters, one for the forward product prediction (synthesis) and the other for the backward reactant prediction (retrosynthesis). During the inference, they leveraged both the forward and backward models to find the best reactions. Sun et al. [24] () transformed a product to its reactants using an energy-based framework. They also leveraged the duality of the forward and backward models by training them together and selected the best reactions with the highest energy value from the two models. Tetko et al. [31] () learned to transform a product into its reactants using a Transformer trained on a dataset augmented with various non-canonical SMILES representations of each molecule. In , each target molecule was tested multiple times using different SMILES string representations. Zhong et al. [32] () aligned the product and reactant SMILES strings to minimize their edit distance, and trained a transformer to decode the reactant SMILES strings from the products. They also augmented the training dataset and tested each target molecule multiple times as in . In addition to SMILES-based template-free methods, Sacha et al. [26] () formulated retrosynthesis as a graph editing process from a product to its reactants. These graph edits include the change in the atom properties or the bond types, or the addition of the new atoms or the benzene rings into the synthons. These template-free methods are independent of reaction templates, and thus they may have better generalizability to unknown reactions compared to template-based methods. However, template-free methods lack interpretability towards the reasoning behind their end-to-end predictions. SMILES-based template-free methods also suffer from the validity issue that the generated sequences may fail to follow the grammar of SMILES strings or violate chemical rules [17].
Semi-template-based methods
Semi-template-based methods [30, 27, 28, 29, 26] do not use reaction templates, or they do not directly transform a product into its reactants. Instead, semi-template-based methods follow a two-step workflow utilizing atom-mappings: (1) they first identify the reaction centers and transform the product into synthons (intermediate molecules) using the reaction centers; and then (2) they complete the synthons into the reactants. Shi et al. [28] () first predicted reaction centers as bonds that can be used to split the product into the synthons, and then utilized a variational autoencoder [35] to complete synthons into reactants by sequentially adding new bonds or new atoms. Somnath et al. [29] () predicted the bonds with changed bond types or the atoms with changed hydrogen count as the reaction centers, and then completed the synthons by selecting the pre-extracted subgraphs that realize the difference between synthons and reactants. Wang et al. [30] () formulated the reaction center identification and synthon completion problems as two sequence-to-sequence problems (i.e., product to synthon, and synthon to reactant), and trained two Transformers for these problems, respectively. The prediction of reaction centers first in the above methods allows better interpretability towards the reasoning behind the generation process. The two-step workflow also empowers these methods to diversify their generated reactants by allowing multiple different reaction center predictions forwarded into their synthon completion step.
also identifies the reaction centers and then completes the synthons into the reactants in a sequential way as does. However, is different from . can cover multiple types of reaction centers while takes only the newly formed bonds as the reaction center, which leads to lower coverage of on the dataset. During synthon completion, attaches substructures (e.g., rings and bonds) instead of single atoms as in , into synthons to simplify the completion process. In addition and more importantly, uses other synthons of the same reaction and also the product to complete a synthon, and thus the synthon completion is more contextualized for the product, while does not consider other synthons.
Fragment-based molecule generation
Following the idea of fragment-based drug design [62, 63], fragment-based molecule generation methods have been developed. For example, Jin et al. [64] first decomposed a molecular graph into a junction tree of chemical substructures, and then used a variational autoencoder over the junction trees and its chemical substructures to generate and assemble new molecules (-). Podda et al. [65] encoded and decoded a sequence of fragments via a variational autoencoder, and generated new molecules by connecting fragments generated from the autoencoder. Chen et al. [59] optimized a molecule by removing and attaching substructures in a starting molecule. generates reactants from synthons also by attaching new substructures. However, the generation strategy in is fundamentally different from that in the previous fragment-based molecule generation methods. During synthon completion, does not encode the synthons using their substructures as what - and do. It does not either encode or decode the substructures that are to be attached to the synthons. Instead, attaches the substructures to a specific, identified atom in the molecular graph of the synthons. Therefore, can directly attach a substructure to the predicted reaction centers.
Data Preprocessing and Experimental Settings
| Dataset | Statistics | |
| # training reactions | 40,008 | |
| # validation reactions | 5,001 | |
| # test reactions | 5,007 | |
| training reactions | average size of products | 26.0 |
| average size of larger reactants | 21.9 | |
| average size of smaller reactants | 9.0 | |
| average number of reactants | 1.7 | |
| validation reactions | average size of products | 25.9 |
| average size of larger reactants | 21.8 | |
| average size of smaller reactants | 9.1 | |
| average number of reactants | 1.7 | |
| test reactions | average size of products | 25.9 |
| average size of larger reactants | 21.7 | |
| average size of smaller reactants | 9.2 | |
| average number of reactants | 1.7 | |
We used the benchmark dataset provided by Yan et al. [27]. This dataset, also referred to as USPTO-50K, contains 50K chemical reactions that are randomly sampled from a large dataset collected by Lowe [11] from US patents published between 1976 and September 2016. Each reaction in the large dataset is atom-mapped so that each atom in the product is uniquely mapped to an atom in the reactants. The 50K reactions in USPTO-50K are classified into 10 reaction types by Schneider et al. [66]. To avoid the information leakage issue [27] (e.g., reaction center is given in both the training and test data), all the product SMILES strings in USPTO-50K are canonicalized. We used exactly the same training/validation/test data splits of USPTO-50K as in the previous methods [12, 27], which contain 40K/5K/5K reactions, respectively. Table 5 presents the data statistics. We trained models on the 40K training data, with parameters tuned on the 5K validation data, and tested on the 5K test data. For reproducibility purposes, details about model training and parameter tuning are provided in Supplementary Note 8.
Baselines
We compared with the state-of-the-art baseline methods for the one-step retrosynthesis problem, including five template-based (TB) methods, ten template-free (TF) methods and five semi-template-based (Semi-TB) methods. Inspired by the recent success of using fragments in other tasks [1], we further extended into - by incorporating the fragments generated from the breaking retrosynthetically interesting chemical substructures (BRICS) fragmentation algorithm [2]. Details of - are available in Supplementary Note 1. The experimental setting for - is identical to that of .
Template-based baseline methods
The five TB baseline methods include , , , and . These methods first mine reaction templates from training data and apply only these templates to construct reactants from the target molecule.
-
•
[12] selects the templates of reactions that produce molecules most similar to the target molecule.
-
•
[13] predicts suitable templates using product fingerprints through a multi-layer perceptron.
-
•
[14] predicts reactions using two energy functions, one for template scoring and the other for reactant scoring conditioned on templates.
-
•
[15] learns the associations between molecules and reaction templates using modern Hopfield networks, and selects templates based on the associations.
-
•
[16] selects templates against each atom and each bond using classifiers.
Template-free baseline methods
The ten TF baseline methods all use Transformer over SMILES string representations of products and/or reactants.
-
•
[17] maps the SMILES strings of products to the SMILES strings of reactants using a Transformer, and then corrects syntax errors (e.g., mismatch of parentheses in SMILES strings) to ensure valid reactant SMILES strings.
-
•
- [18] pre-trains a vanilla Transformer using reactions generated from templates, and then fine-tunes the Transformer with a multinomial latent variable representing reaction types.
-
•
[19] trains standard Transformer encoders and decoders using the combined atom representations learned from molecular graphs and from SMILES strings.
-
•
[20] translates product SMILES strings into reactant SMILES strings using Transformer, which is pre-trained on an independent dataset to recover masked SMILES strings (i.e., with some atoms masked out) or to normalize augmented SMILES strings (i.e., multiple, equivalent non-canonical SMILES strings for each SMILES string).
-
•
[21] encodes molecular graphs using graph neural networks with attention mechanisms, and decodes the reactant SMILES strings from the graph representations using a Transformer decoder.
-
•
[22] uses two Transformers with shared parameters to learn the transformation from products to reactants and vice versa, respectively, and selects the best reactions using the likelihood values from these two Transformers.
-
•
[23] enhances a Transformer with truncated attention connections regulated by molecular graph structures.
-
•
[24] uses an energy-based model with two Transformers to learn the transformation from product SMILES strings to reactants’ SMILES strings and vice versa, and selects the best reactions using the energy.
-
•
[25] predicts the reaction center region using a reaction center detection module, and uses the embedding of predicted centers as a condition to transform via Transformer the product into the reactants in SMILES. Although predicts the reaction center, it does not split products into synthons using the reaction center, and thus does not follow a two-step, semi-template-based framework.
-
•
[26] transforms the product molecular graphs into the corresponding reactant graphs using a sequence of graph edits (e.g., change atom charges, add a new bond) that are learned from products and their reactants in the training set.
Semi-template-based methods
The five Semi-TB baseline methods all use molecular graph representations. Most of them explicitly predict reaction centers first.
-
•
[30] trains two Transformers independently to predict the transformation from the product to its synthons and from the synthons to the reactants, respectively.
-
•
[27] predicts reaction centers on molecular graphs via a graph attention network, and transforms resulting synthons to reactants using a Transformer.
-
•
[28] predicts reaction centers on molecular graphs via a graph neural network, and completes synthons into reactants through sequential additions of new atoms or bonds using the latent variables sampled from the latent space of a variational graph autoencoder.
-
•
[29] predicts reaction centers via a message passing neural network over molecular graphs, and completes synthons by selecting the subgraphs in a vocabulary that realize the difference between the synthons and reactants.
Data Availability
The data used in this manuscript are available publicly [69] at the link https://doi.org/10.5281/zenodo.7839013 and the link https://github.com/ninglab/G2Retro.
Code Availability
The code for , - and - is available publicly [69] at the link https://doi.org/10.5281/zenodo.7839013 and the link https://github.com/ninglab/G2Retro. A web portal for is available at the link http://go.osu.edu/G2Retro.
References
- 1. Segler, M. H. S., Preuss, M. & Waller, M. P. Planning chemical syntheses with deep neural networks and symbolic AI. Nature 555, 604–610 (2018).
- 2. Chen, B., Li, C., Dai, H. & Song, L. Retro*: Learning retrosynthetic planning with neural guided A* search. In III, H. D. & Singh, A. (eds.) Proceedings of the 37th International Conference on Machine Learning, vol. 119, 1608–1616 (PMLR, 2020).
- 3. Blakemore, D. C. et al. Organic synthesis provides opportunities to transform drug discovery. Nat. Chem. 10, 383–394 (2018).
- 4. Lajiness, M. S., Maggiora, G. M. & Shanmugasundaram, V. Assessment of the consistency of medicinal chemists in reviewing sets of compounds. J. Med. Chem 47, 4891–4896 (2004).
- 5. Huang, Q., Li, L.-L. & Yang, S.-Y. RASA: A rapid retrosynthesis-based scoring method for the assessment of synthetic accessibility of drug-like molecules. J. Chem. Inf. Model. 51, 2768–2777 (2011).
- 6. Takaoka, Y. et al. Development of a method for evaluating drug-likeness and ease of synthesis using a data set in which compounds are assigned scores based on chemists' intuition. J. Chem. Inf. Comput. Sci. 43, 1269–1275 (2003).
- 7. Kutchukian, P. S. et al. Inside the mind of a medicinal chemist: The role of human bias in compound prioritization during drug discovery. PLoS ONE 7, e48476 (2012).
- 8. Reaxys. Reaxys is a registered trademark of relx intellectual properties sa used under license. Https://www.reaxys.com. Accessed: 2022-05-22.
- 9. Gabrielson, S. W. SciFinder. J. Med. Libr. Assoc. 106 (2018).
- 10. Kearnes, S. M. et al. The open reaction database. J. Am. Chem. Soc. 143, 18820–18826 (2021).
- 11. Lowe, D. M. Chemical reactions from us patents (1976-sep2016). https://doi.org/10.6084/m9.figshare.5104873.v1 Accessed: 2022-11-06.
- 12. Coley, C. W., Rogers, L., Green, W. H. & Jensen, K. F. Computer-assisted retrosynthesis based on molecular similarity. ACS Cent. Sci. 3, 1237–1245 (2017).
- 13. Segler, M. H. S. & Waller, M. P. Neural-symbolic machine learning for retrosynthesis and reaction prediction. Chem. Eur. J. 23, 5966–5971 (2017).
- 14. Dai, H., Li, C., Coley, C., Dai, B. & Song, L. Retrosynthesis prediction with conditional graph logic network. In Wallach, H. et al. (eds.) Advances in Neural Information Processing Systems, vol. 32, 8872–8882 (Curran Associates, Inc., 2019).
- 15. Seidl, P. et al. Improving few- and zero-shot reaction template prediction using modern hopfield networks. J. Chem. Inf. Model. 62, 2111–2120 (2022).
- 16. Chen, S. & Jung, Y. Deep retrosynthetic reaction prediction using local reactivity and global attention. JACS Au 1, 1612–1620 (2021).
- 17. Zheng, S., Rao, J., Zhang, Z., Xu, J. & Yang, Y. Predicting retrosynthetic reactions using self-corrected transformer neural networks. J. Chem. Inf. Model. 60, 47–55 (2019).
- 18. Chen, B., Shen, T., Jaakkola, T. S. & Barzilay, R. Learning to make generalizable and diverse predictions for retrosynthesis (2019). arXiv:1910.09688v1.
- 19. Mao, K. et al. Molecular graph enhanced transformer for retrosynthesis prediction. Neurocomputing 457, 193–202 (2021).
- 20. Irwin, R., Dimitriadis, S., He, J. & Bjerrum, E. J. Chemformer: a pre-trained transformer for computational chemistry. Mach. learn.: sci. technol. 3, 015022 (2022).
- 21. Tu, Z. & Coley, C. W. Permutation invariant graph-to-sequence model for template-free retrosynthesis and reaction prediction. J. Chem. Inf. Model. 62, 3503–3513 (2022).
- 22. Kim, E., Lee, D., Kwon, Y., Park, M. S. & Choi, Y.-S. Valid, plausible, and diverse retrosynthesis using tied two-way transformers with latent variables. J. Chem. Inf. Model. 61, 123–133 (2021).
- 23. Seo, S.-W. et al. GTA: Graph truncated attention for retrosynthesis. Proceedings of the AAAI Conference on Artificial Intelligence 35, 531–539 (2021).
- 24. Sun, R., Dai, H., Li, L., Kearnes, S. & Dai, B. Towards understanding retrosynthesis by energy-based models. In Ranzato, M., Beygelzimer, A., Dauphin, Y., Liang, P. & Vaughan, J. W. (eds.) Advances in Neural Information Processing Systems, vol. 34, 10186–10194 (Curran Associates, Inc., 2021).
- 25. Wan, Y., Hsieh, C.-Y., Liao, B. & Zhang, S. Retroformer: Pushing the limits of end-to-end retrosynthesis transformer. In Chaudhuri, K. et al. (eds.) Proceedings of the 39th International Conference on Machine Learning, vol. 162, 22475–22490 (PMLR, 2022).
- 26. Sacha, M. et al. Molecule edit graph attention network: Modeling chemical reactions as sequences of graph edits. J. Chem. Inf. Model. 61, 3273–3284 (2021).
- 27. Yan, C. et al. Retroxpert: Decompose retrosynthesis prediction like a chemist. In Larochelle, H., Ranzato, M., Hadsell, R., Balcan, M. F. & Lin, H. (eds.) Advances in Neural Information Processing Systems, vol. 33, 11248–11258 (Curran Associates, Inc., 2020).
- 28. Shi, C., Xu, M., Guo, H., Zhang, M. & Tang, J. A graph to graphs framework for retrosynthesis prediction. In III, H. D. & Singh, A. (eds.) Proceedings of the 37th International Conference on Machine Learning, vol. 119, 8818–8827 (PMLR, 2020).
- 29. Somnath, V. R., Bunne, C., Coley, C., Krause, A. & Barzilay, R. Learning graph models for retrosynthesis prediction. In Ranzato, M., Beygelzimer, A., Dauphin, Y., Liang, P. & Vaughan, J. W. (eds.) Advances in Neural Information Processing Systems, vol. 34, 9405–9415 (Curran Associates, Inc., 2021).
- 30. Wang, X. et al. RetroPrime: A diverse, plausible and transformer-based method for single-step retrosynthesis predictions. Chem. Eng. J. 420, 129845 (2021).
- 31. Tetko, I. V., Karpov, P., Deursen, R. V. & Godin, G. State-of-the-art augmented NLP transformer models for direct and single-step retrosynthesis. Nat. Commun. 11, 5575 (2020).
- 32. Zhong, Z. et al. Root-aligned SMILES: a tight representation for chemical reaction prediction. Chem. Sci. 13, 9023–9034 (2022).
- 33. Vaswani, A. et al. Attention is all you need. In Guyon, I. et al. (eds.) Advances in Neural Information Processing Systems, vol. 30 (Curran Associates, Inc., 2017).
- 34. Kipf, T. N. & Welling, M. Semi-supervised classification with graph convolutional networks. In International Conference on Learning Representations (OpenReview.net, 2017).
- 35. Kingma, D. P. & Welling, M. Auto-encoding variational bayes. In International Conference on Learning Representations (OpenReview.net, 2014).
- 36. Venkatasubramanian, V. & Mann, V. Artificial intelligence in reaction prediction and chemical synthesis. Curr. Opin. Chem. Eng. 36, 100749 (2022).
- 37. Chen, F., Wang, Y.-C., Wang, B. & Kuo, C.-C. J. Graph representation learning: a survey. APSIPA Trans. Signal Inf. Process. 9, e15 (2020).
- 38. Brown, D. G. & Bostrom, J. Analysis of past and present synthetic methodologies on medicinal chemistry: Where have all the new reactions gone? J. Med. Chem. 59, 4443–4458 (2015).
- 39. Vijayakumar, A. K. et al. Diverse beam search: Decoding diverse solutions from neural sequence models (2016). arXiv:1610.02424v2.
- 40. Novel drug approvals for 2022. https://www.fda.gov/drugs/new-drugs-fda-cders-new-molecular-entities-and-new-therapeutic-biological-products/novel-drug-approvals-2022 Accessed: 2023-04-28.
- 41. Al-Samkari, H. & van Beers, E. J. Mitapivat, a novel pyruvate kinase activator, for the treatment of hereditary hemolytic anemias. Ther. Adv. Hematol. 12, 204062072110660 (2021).
- 42. Sizemore, J. P., Guo, L., Mirmehrabi, M. & Su, Y. Crystalline forms of n-(4-(4-(cyclopropylmethyl) piperazine-1-carbonyl)phenyl)quinoline-8-sulfonamide. World Intellectual Property Organization WO/2019/104134A1 (2019).
- 43. Keam, S. J. Tapinarof cream 1%: First approval. Drugs 82, 1221–1228 (2022).
- 44. Chen, G., Webster, J., Li, J., Hu, K. & Zhu, J. Anti-inflammatory and psoriasis treatment and protein kinase inhibition by hydroxyltilbenes and novel stilbene derivatives and analogues. World Intellectual Property Organization WO/2001/042231A2 (2001).
- 45. Duan, X.-F., Zeng, J., Lü, J.-W. & Zhang, Z.-B. Insights into the general and efficient cross McMurry reactions between ketones. J. Org. Chem. 71, 9873–9876 (2006).
- 46. Robiette, R., Richardson, J., Aggarwal, V. K. & Harvey, J. N. Reactivity and selectivity in the wittig reaction: a computational study. J. Am. Chem. Soc. 128, 2394–2409 (2006).
- 47. Miyaura, N. & Suzuki, A. Palladium-catalyzed cross-coupling reactions of organoboron compounds. Chem. Rev. 95, 2457–2483 (1995).
- 48. LeBlond, C. R., Andrews, A. T., Sun, Y. & Sowa, J. R. Activation of aryl chlorides for suzuki cross-coupling by ligandless, heterogeneous palladium. Org. Lett. 3, 1555–1557 (2001).
- 49. Yin & Liebscher, J. Carbon-carbon coupling reactions catalyzed by heterogeneous palladium catalysts. Chem. Rev. 107, 133–173 (2006).
- 50. Fanta, P. E. The ullmann synthesis of biaryls. Synthesis 1974, 9–21 (1974).
- 51. Stille, J. K. The palladium-catalyzed cross-coupling reactions of organotin reagents with organic electrophiles[new synthetic methods(58)]. Angew. Chem., Int. Ed. Engl. 25, 508–524 (1986).
- 52. Tamao, K., Sumitani, K. & Kumada, M. Selective carbon-carbon bond formation by cross-coupling of grignard reagents with organic halides. catalysis by nickel-phosphine complexes. J. Am. Chem. Soc. 94, 4374–4376 (1972).
- 53. Lewis, M. et al. BART: Denoising sequence-to-sequence pre-training for natural language generation, translation, and comprehension. In Proceedings of the 58th Annual Meeting of the Association for Computational Linguistics (Association for Computational Linguistics, 2020).
- 54. Yan, C. et al. Retroxpert. https://github.com/uta-smile/RetroXpert Accessed: 2022-10-01.
- 55. Somnath, V. R. https://github.com/uta-smile/RetroXpert/issues/15#issuecomment-864845942 Accessed: 2022-06-01.
- 56. DimGorr. https://github.com/DeepGraphLearning/torchdrug/issues/131 Accessed: 2022-10-01.
- 57. Open science. https://research-and-innovation.ec.europa.eu/strategy/strategy-2020-2024/our-digital-future/open-science_en Accessed: 2023-04-28.
- 58. Data management. https://sharing.nih.gov/data-management-and-sharing-policy/data-management Accessed: 2023-04-28.
- 59. Chen, Z., Min, M. R., Parthasarathy, S. & Ning, X. A deep generative model for molecule optimization via one fragment modification. Nat. Mach. Intell. 3, 1040–1049 (2021).
- 60. Jin, W., Barzilay, D. & Jaakkola, T. Hierarchical generation of molecular graphs using structural motifs. In III, H. D. & Singh, A. (eds.) Proceedings of the 37th International Conference on Machine Learning, vol. 119, 4839–4848 (PMLR, 2020).
- 61. Szymkuć, S. et al. Computer-assisted synthetic planning: The end of the beginning. Angew. Chem., Int. Ed. Engl. 55, 5904–5937 (2016).
- 62. Murray, C. & Rees, D. The rise of fragment-based drug discovery. Nat. Chem. 1, 187–92 (2009).
- 63. Hajduk, P. J. & Greer, J. A decade of fragment-based drug design: strategic advances and lessons learned. Nat. Rev. Drug Discov. 6, 211–219 (2007).
- 64. Jin, W., Barzilay, R. & Jaakkola, T. Junction tree variational autoencoder for molecular graph generation. In Dy, J. & Krause, A. (eds.) Proceedings of the 35th International Conference on Machine Learning, vol. 80, 2323–2332 (PMLR, 2018).
- 65. Podda, M., Bacciu, D. & Micheli, A. A deep generative model for fragment-based molecule generation. In Chiappa, S. & Calandra, R. (eds.) Proceedings of the Twenty Third International Conference on Artificial Intelligence and Statistics, vol. 108, 2240–2250 (PMLR, 2020).
- 66. Schneider, N., Stiefl, N. & Landrum, G. A. What’s what: The (nearly) definitive guide to reaction role assignment. J. Chem. Inf. Model. 56, 2336–2346 (2016).
- 67. Zhang, Z., Liu, Q., Wang, H., Lu, C. & Lee, C.-K. Motif-based graph self-supervised learning for molecular property prediction. In Ranzato, M., Beygelzimer, A., Dauphin, Y., Liang, P. & Vaughan, J. W. (eds.) Advances in Neural Information Processing Systems, vol. 34, 15870–15882 (Curran Associates, Inc., 2021).
- 68. Degen, J., Wegscheid-Gerlach, C., Zaliani, A. & Rarey, M. On the art of compiling and using ‘drug-like’ chemical fragment spaces. ChemMedChem 3, 1503–1507 (2008).
- 69. Code for G2Retro as a two-step graph generative models for retrosynthesis prediction. https://doi.org/10.5281/zenodo.7839013 (2023).
Acknowledgements
This project was made possible, in part, by support from the National Science Foundation grant nos. IIS-2133650 (X.N.), and The Ohio State University President’s Research Excellence program (X.N., H.S.). Any opinions, findings and conclusions or recommendations expressed in this paper are those of the authors and do not necessarily reflect the views of the funding agency. We thank Dr. Michael A. Walters for his constructive comments.
Author Contributions
X.N. conceived the research. X.N. and H.S. obtained funding for the research. Z.C. and X.N. designed the research. Z.C. and X.N. conducted the research, including data curation, formal analysis, methodology design and implementation, result analysis and visualization. Z.C. and X.N. drafted the original manuscript. O.R.A. and J.R.F. provided comments on case studies. H.S. provided comments on the original manuscript. Z.C. and X.N. conducted the manuscript editing and revision. All authors reviewed the final manuscript.
Competing Interests
The authors declare no competing interests.
as a Two-Step Graph Generative Models for Retrosynthesis Prediction (Supplementary Information)
with fragments: -
Inspired by the recent success of using fragments in other tasks [1], we extended by incorporating the fragments generated from the breaking retrosynthetically interesting chemical substructures (BRICS) fragmentation algorithm [2], and denote the new method as -. BRICS breaks synthetically accessible bonds in a product , following a set of fragmentation rules. Thus, the fragments generated from BRICS encode prior knowledge related to synthesis. - integrates such knowledge by learning from the molecular graph constructed from the fragments. Specifically, for each , - constructs a BRICS graph , where each node represents a BRICS fragment with all the atoms and bonds belonging to it, and each edge corresponds to a bond that connects two BRICS fragments and . That is, the two atoms connected by belong to and , respectively (i.e., and ; In our dataset, two BRICS fragments are connected through only one bond). Thus, includes synthetically accessible bonds, which tend to be the reaction centers, and thus, incorporates fragment-level structures of . For simplicity, when no ambiguity arises, we omit the super/sub-scripts and use to represent .
- generates BRICS fragment embeddings by passing the messages along the connections over BRICS fragments in the BRICS graphs, in a similar way as for atom embeddings over molecular graphs. Specifically, each edge in is associated with two message vectors and . The message at -th iteration is updated as follows,
| (S1) |
where aggregates the embeddings of all the atoms within the fragment ; is the embedding of atom in that is included in the edge ; ’s (=1,2,3,4) are the learnable parameter matrices; is initialized with the zero vector. The message encodes the information passing through the edge to , and thus is used to further derive the embedding of as follows,
| (S2) |
where denotes the concatenation of ; ’s (=1,2,3) are the learnable parameter matrices. With , - enriches the representation of atom with the embedding of the fragment that belongs to. Note that in BRICS algorithm, each atom only belongs to one fragment. The enriched atom representation is calculated as follows,
| (S3) |
where is a learnable hyperparameter matrix; represents the concatenation operation.
The reaction center identification in - is done in the same way as in (Section “Reaction Center Identification” in the main manuscript), with all the enriched atom representations calculated as above, and bond embeddings (e.g., Equation 7 in the main manuscript) calculated using the enriched atom representations. Note that synthon completion in - does not use the BRICS graph and thus is identical to .
ensemble: -
To explore a large reaction space, we developed an ensemble approach for , denoted as -. - ensembles 20 models that are combined from the top-4 reaction center identification modules and the top-5 synthon completion modules, each selected based on the corresponding validation data (hyper-parameter space follows that in Supplementary Table 3 except for atom embedding dimensions in {32, 64}). For each target product, all the top-10 predicted reactions from the 20 models are combined based on their average ranking (different may predict the same reaction), and the final top-10 predicted reactions are considered as the results of -.
| Type Name | Percentage (%) | - | |||||||||
|---|---|---|---|---|---|---|---|---|---|---|---|
| 1 | 3 | 5 | 10 | 1 | 3 | 5 | 10 | ||||
| heteroatom alkylation and arylation | 30.3 | 56.5 | 80.7 | 88.5 | 94.4 | 56.5 | 81.3 | 88.1 | 93.5 | ||
| acylation and related processes | 23.8 | 69.7 | 91.1 | 95.4 | 98.2 | 68.7 | 89.8 | 93.9 | 96.4 | ||
| deprotections | 16.5 | 54.2 | 80.1 | 87.1 | 92.4 | 52.7 | 76.6 | 81.4 | 86.7 | ||
| C-C bond formation | 11.3 | 41.4 | 64.2 | 71.4 | 80.6 | 39.7 | 63.5 | 74.3 | 81.7 | ||
| reductions | 9.2 | 61.0 | 78.4 | 84.6 | 90.7 | 59.3 | 80.1 | 87.7 | 92.2 | ||
| functional group interconversion | 3.7 | 35.3 | 57.1 | 67.4 | 73.4 | 42.4 | 57.6 | 66.3 | 79.3 | ||
| heterocycle formation | 1.8 | 0.0 | 0.0 | 0.0 | 0.0 | 48.4 | 70.3 | 78.0 | 83.5 | ||
| oxidations | 1.6 | 68.3 | 86.6 | 90.2 | 93.9 | 54.9 | 82.9 | 92.7 | 97.6 | ||
| protections | 1.4 | 51.5 | 77.9 | 85.3 | 89.7 | 58.8 | 82.4 | 88.2 | 91.2 | ||
| functional group addition | 0.5 | 78.3 | 87.0 | 87.0 | 95.7 | 78.3 | 87.0 | 91.3 | 95.7 | ||
-
•
Columns with 1, 3, 5 and 10 present top-1, top-3, top-5 and top-10 accuracies, respectively. Column “Percentage(%)” represents the percentage of reactions in the test set belonging to the specific reaction type.
Supplementary Table 1 presents the performance comparison between - and on different reaction types. Among the 10 reaction types in the benchmark data, - outperforms at top-1 accuracy on 5 reaction types, and archives the same performance on 2 reaction types. On average, - outperforms on the most popular reaction types on higher-ranked predictions (i.e., corresponding to smaller in top- accuracy). For example, - substantially outperforms on deprotection reactions (54.2% vs 52.7% on top-1 accuracy).
Additional case study
For Mavacamten as in Supplementary Figure 1a, which was approved by FDA in 2022 to treat hypertrophic cardiomyopathy [3], the patent literature [4] reports the utilization of a nucleophilic aromatic substitution for the formation of the C8-N9 bond (ground truth in Supplementary Figure 1b). correctly predicts this coupling as the top-1 reaction (Supplementary Figure 1c), and also identifies its additional permutations by replacing the aryl chloride with the aryl bromide and the aryl fluoride, respectively (Supplementary Figure 1d and 1g). Aryl fluorides in Supplementary Figure 1g are not as typical as aryl chlorides and bromides, and ranks the substitution reaction involving the arly fluoride low. In addition to the amine coupling strategy with aryl halides, also identifies the reaction of the amine with trifluoro methyl sulfate to make the same bond (Supplementary Figure 1h), which would be expected to work as with aryl halides in Supplementary Figure 1c and 1d. However, the alcohol in Supplementary Figure 1i is not a good enough leaving group to make the bond (i.e., C8-N9). Interestingly, also identifies other amine linkages (e.g., in Supplementary Figure 1e between C2 and N4; in Supplementary Figure 1j between N9 and C10) as potential reaction centers. However, the proposed synthesis in Supplementary Figure 1e and 1f would most likely lead to the formation of undesired products as these reactant pairs would likely result in the alkylation of both N4 and N9. Therefore, the use of the aryl halides in Supplementary Figure 1c and 1d would be the more efficient way of obtaining the desired product.
Oteseconazole as in Supplementary Figure 2a is a drug approved for recurrent vulvovaginal candidiasis [5]. In the patent literature [6], this drug is constructed by the C-C bond forming reaction between C6 and C7 and is assembled with Suzuki coupling [7] between an aryl bromide group and a boronic ester (Supplementary Figure 2b). correctly predicts this coupling as the top-1 with the boronic acid (Supplementary Figure 2c), the top-3 which is the same as the patented reaction (Supplementary Figure 2e), and the top-9 reaction with a relatively uncommon boronic ester (Supplementary Figure 2k). Boronic acids in Supplementary Figure 2c would typically be considered by synthetic chemists as interchangeable with boronic esters, and thus should be considered a feasible reaction; while Boronic ester in Supplementary Figure 2k should react in the same way with the patented reaction, and thus could deliver the desired compound. Interestingly, also predicts the Ullmann-type coupling [8] with different aryl halides to construct the C6-C7 bond in Supplementary Figure 2d, 2f and 2g, all of which would be expected as feasible reactions. Although the reaction center is correctly identified in Supplementary Figure 2i, the proposed coupling of two boronic acids would not be effective. also identifies another C-N coupling of various aryl halides with imidazoles (C15-N16 - Supplementary Figure 2h and 2j), which hypothetically would also work as expected.
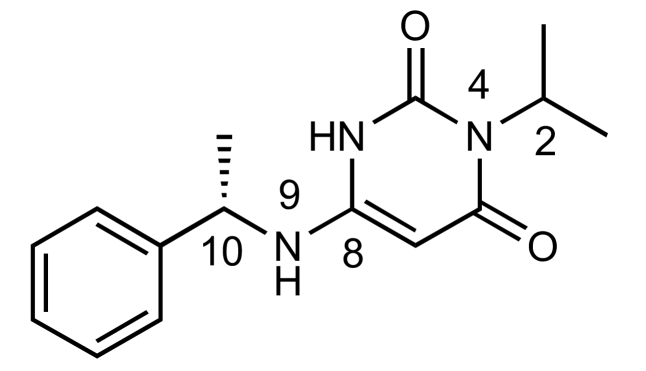

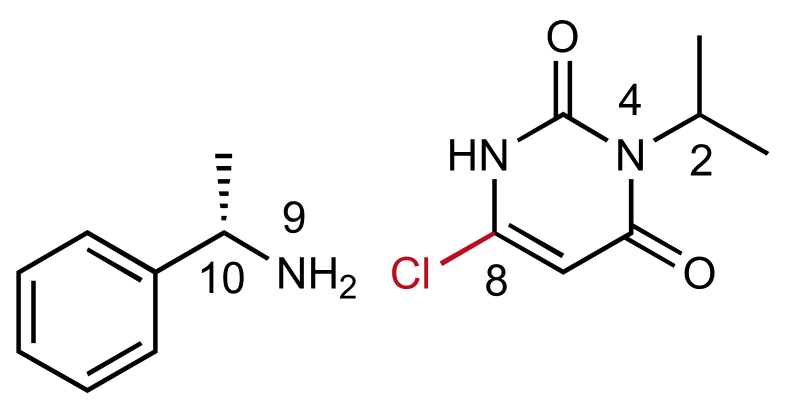
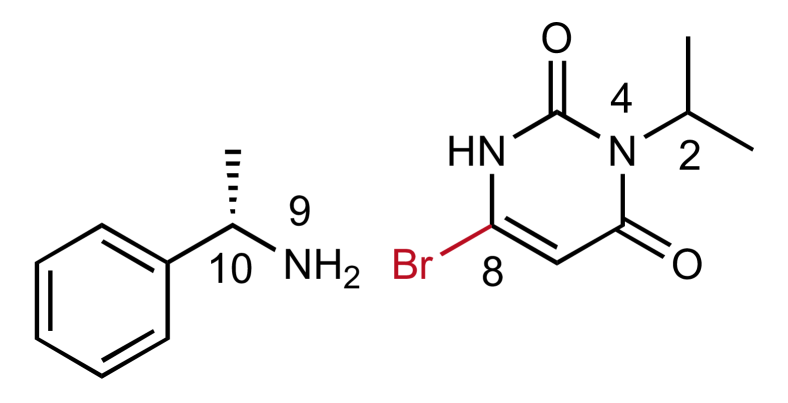
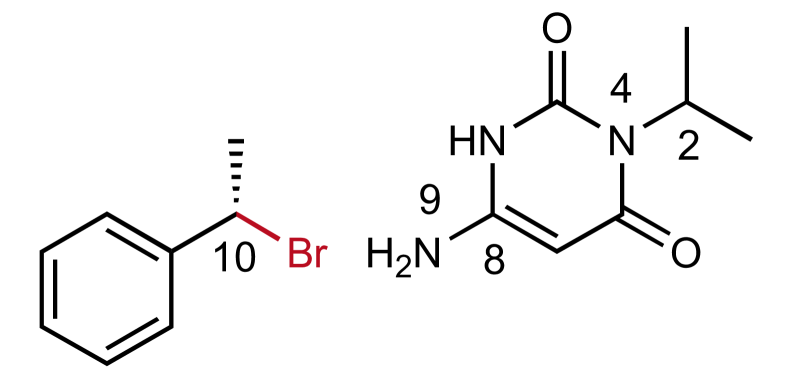
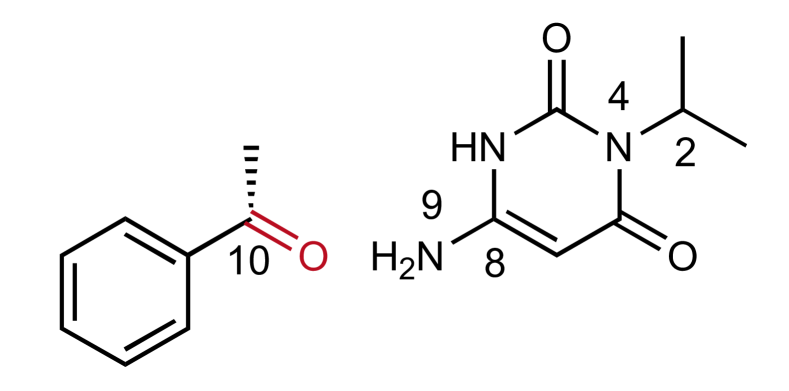
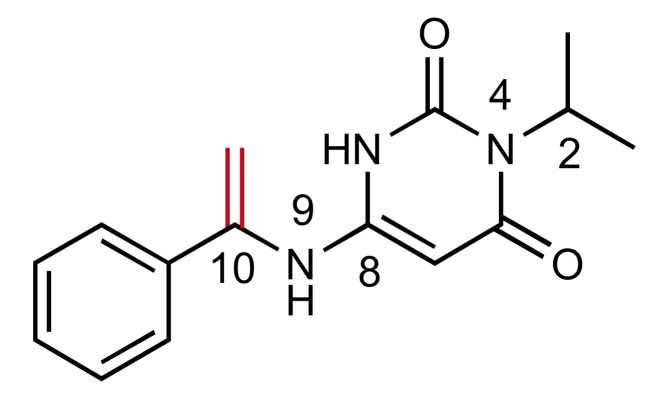
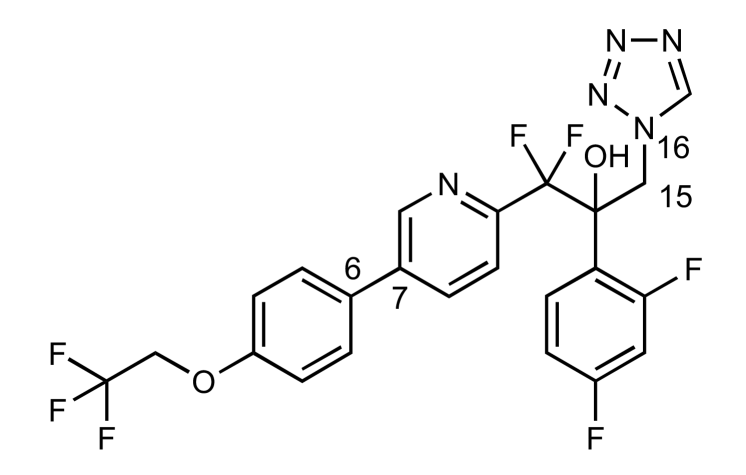
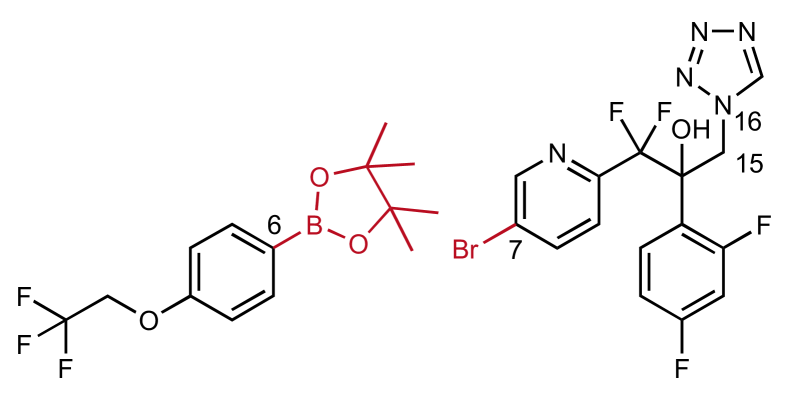
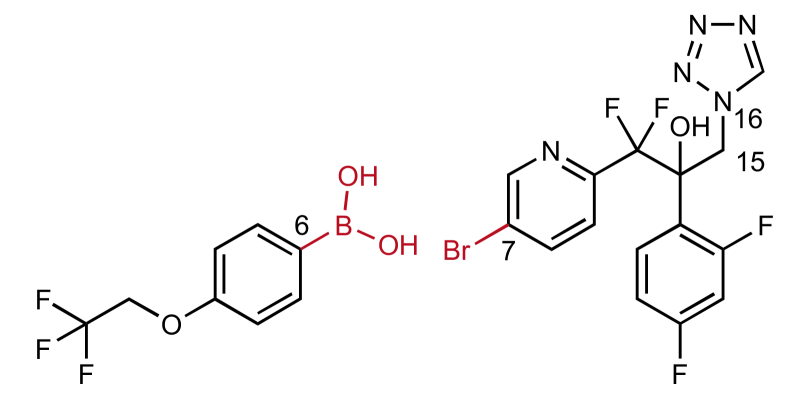
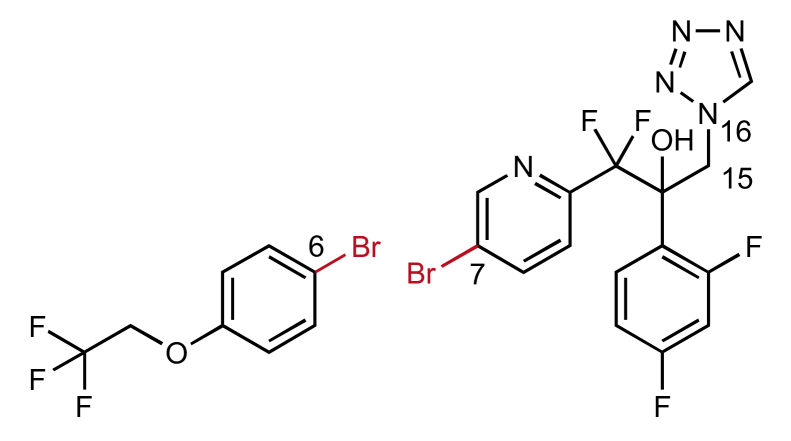

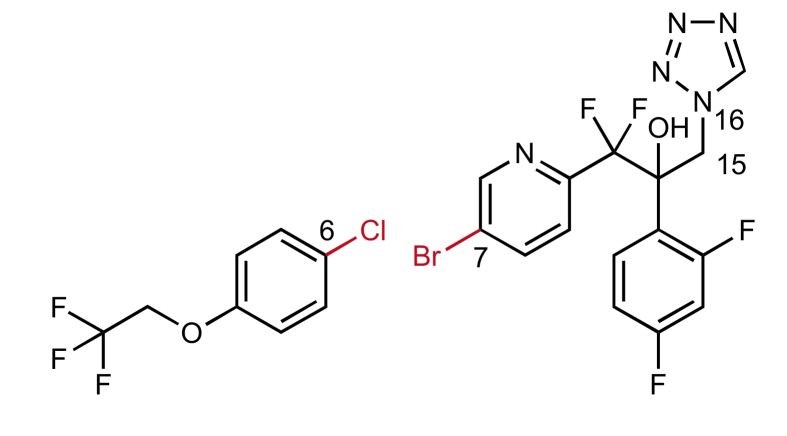
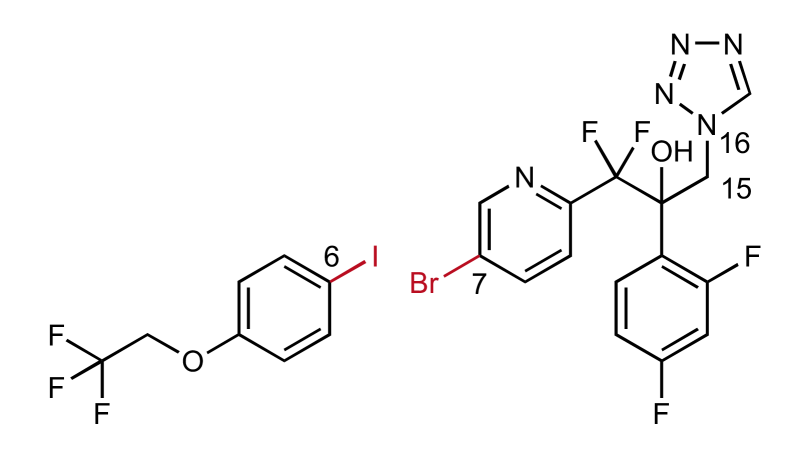
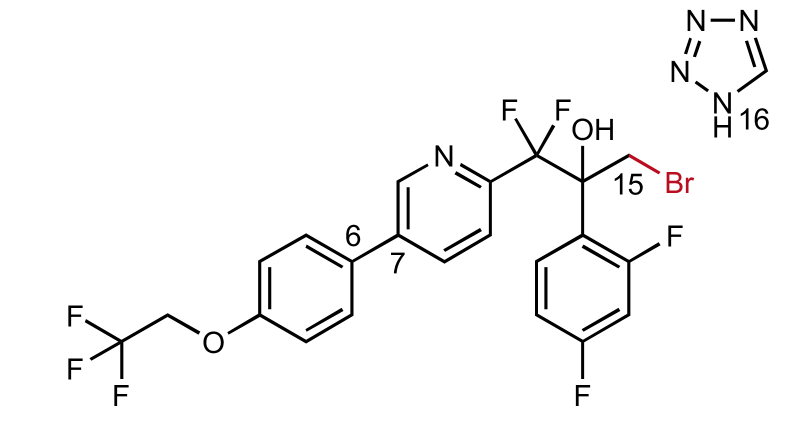
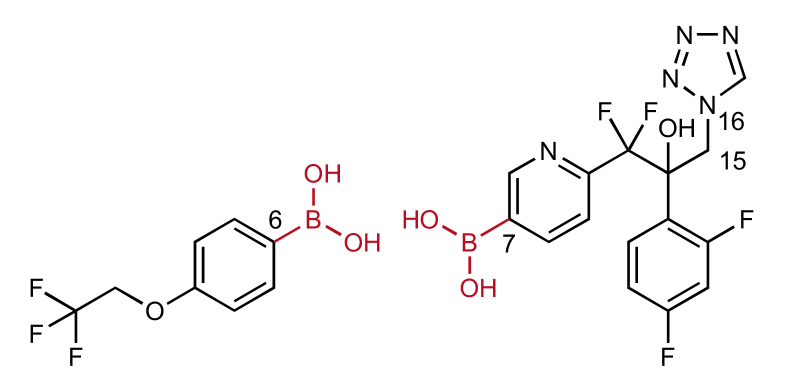
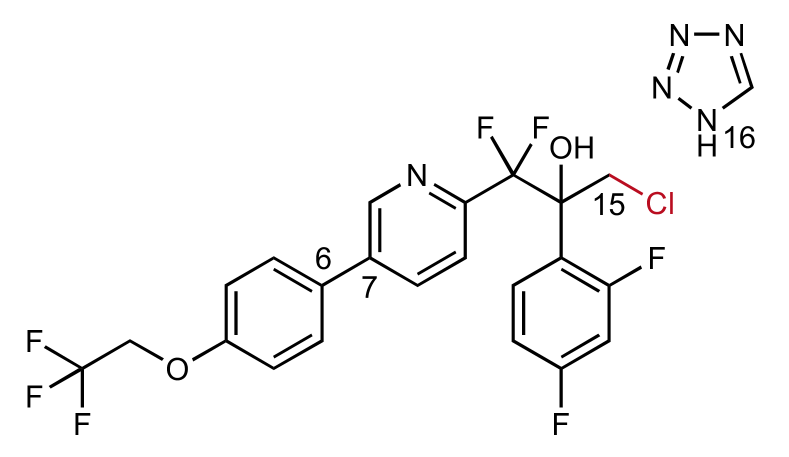
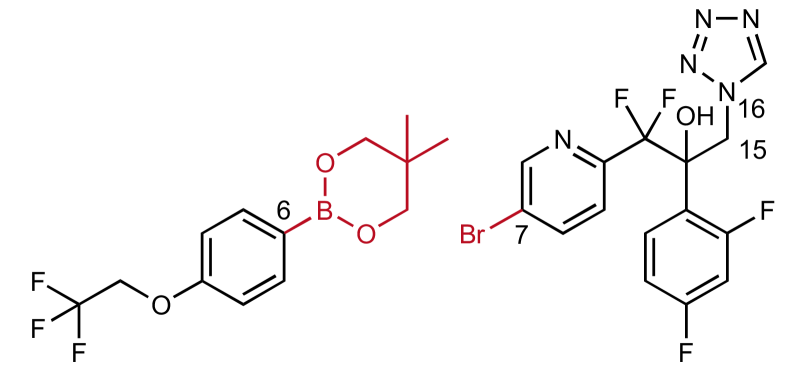
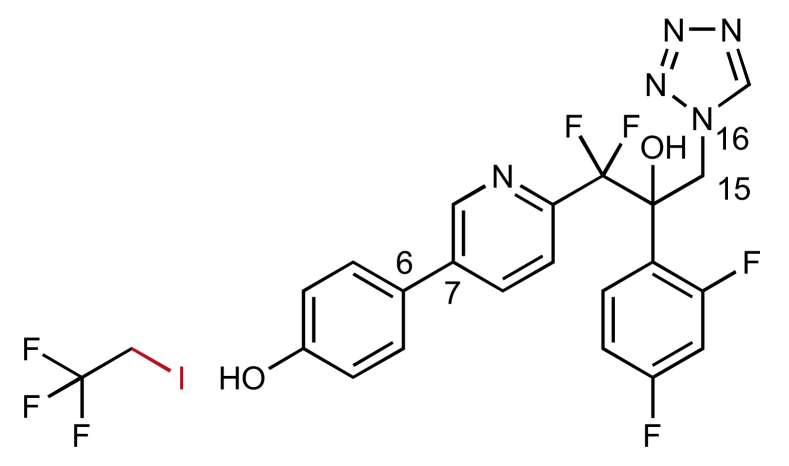
Clustering algorithms for diversity analysis
Supplementary Algorithm 1 describes the algorithm to cluster products for diversity analysis. Given products and their top-10 predicted reactions , we clustered products according to their reaction similarity distributions.
Algorithms of
Supplementary Algorithm 2 describes the reactant generation process of . Given a product, the maximum number of synthons , the beam size , and the maximum number of steps allowed maxSteps, generate a ranked list of reactants that can be used to synthesize the product. Supplementary Algorithm 3 describes how converts the product graph into top- synthon graphs. Given a product graph , its corresponding BRICS graph and , predicts the top- synthon graphs and calculates their log-likelihood scores , using the learned molecule representations from the encoder described in Supplementary Algorithm 4. Specifically, first selects the top- most possible reaction centers and calculates their log-likelihood scores . Then given the product graph, the top- reaction centers and their scores and the product molecule representation , transforms the product graph into top- synthon graphs as in Supplementary Algorithm 5. Supplementary Algorithm 6 describes how completes top- synthon graphs into top- reactant graphs. Given the product graph , the top- synthon graphs and their scores , the beam size , and the maximum number of completion steps maxSteps, uses a beam search strategy to complete the synthon graphs into the reactant graphs in a sequential way. Supplementary Algorithm 7 describes the beam search strategy. Given the queue of intermediate molecules , the queue of completed reactants , the representations of top- synthons , the product representation , and the beam size , extends each intermediate molecule in the queue by attaching different substructures at the attachment point, and saves the completed molecules into and the incomplete ones for the next completion step. Supplementary Algorithm 8 describes how to attach new substructures to an intermediate molecule using the Atom Attachment Continuity Prediction () and the Atom Attachment Type Prediction ().
Notations
| Notation | Meaning |
|---|---|
| // | reactant/synthon/product molecule |
| molecular graph with atoms and bonds | |
| an atom in | |
| a bond in connecting and | |
| a feature vector for an atom or a bond | |
| a set of bonds neighboring the bond formation center | |
| a set of atoms within the reaction center | |
| a substructure used to complete synthons into reactants | |
| a vocabulary with all the substructures in the dataset |
Substructures used to complete synthons

Parameters for Reproducibility
We tuned the hyper-parameters of the reaction center identification module and the synthon completion module for and - with the grid-search algorithm. We presented the parameter space in Supplementary Table 3. We determined the optimal hyper-parameters of the two modules for and - according to the corresponding top-1 accuracy over the validation molecules.
| Hyper-parameters | Values |
|---|---|
| hidden layer dimension | {128, 256, 512} |
| atom embedding dimension | {32} |
| # iterations of | {5, 7, 10} |
| # iterations of in - | {3, 5, 7} |
In the reaction center identification module, when reaction types are known, the optimal hidden dimension for and - is 512; the optimal iterations of for and - are 7 and 10, respectively; the optimal iteration of for - is 7. When reaction types are unknown, the optimal hidden dimension for and - is 512 and 256, respectively; the optimal iterations of for and - are 5 and 10, respectively; the optimal iteration of for - is 7. and - share the same synthon completion model. In the synthon completion module, when reaction types are known, the optimal hidden dimension is 512; the optimal iteration of for is 5. When reaction types are unknown, the optimal hidden dimension is 512; the optimal iterations of is 7.
We optimized the models with batch size 256, learning rate 0.001 and learning rate decay 0.9. For the reaction center module, we trained the models for 150 epochs and checked the validation accuracy at the end of each epoch. We reduced the learning rate by 0.9 if the validation accuracy does not increase by 0.01 for 10 epochs. We saved the model with the optimal top-3 accuracy on reaction center identification over the validation dataset. For the synthon completion module, we trained the models for 100 epochs and checked the validation accuracy at the end of each epoch over 2,000 reactions that are randomly sampled from the validation set. We reduced the learning rate by 0.9 if the validation accuracy does not increase by 0.01 for 5 epochs. We saved the model with the optimal top-1 accuracy on synthon completion over the sampled subset of the validation dataset.
We implemented our models using Python-3.6.9, Pytorch-1.3.1, RDKit-2019.03.4 and NetworkX-2.3. We trained our models on a Tesla P100 GPU and a CPU with 32 GB memory on Red Hat Enterprise 7.7. The training of our reaction center identification model took hours, while the training of our synthon completion model took hours.
Supplementary References
- 1. Zhang, Z., Liu, Q., Wang, H., Lu, C. & Lee, C.-K. Motif-based graph self-supervised learning for molecular property prediction. In Ranzato, M., Beygelzimer, A., Dauphin, Y., Liang, P. & Vaughan, J. W. (eds.) Advances in Neural Information Processing Systems, vol. 34, 15870–15882 (Curran Associates, Inc., 2021).
- 2. Degen, J., Wegscheid-Gerlach, C., Zaliani, A. & Rarey, M. On the art of compiling and using ‘drug-like’ chemical fragment spaces. ChemMedChem 3, 1503–1507 (2008).
- 3. Keam, S. J. Mavacamten: First approval. Drugs 82, 1127–1135 (2022).
- 4. Oslob, J. et al. Pyrimidinedione compounds. US20170281626A1 (2017).
- 5. Hoy, S. M. Oteseconazole: First approval. Drugs 82, 1017–1023 (2022).
- 6. Wirth, D. D., Yates, C. M. & Hoekstra, W. J. Antifungal compound process. WO2017049096A1 (2017).
- 7. Miyaura, N. & Suzuki, A. Palladium-catalyzed cross-coupling reactions of organoboron compounds. Chem. Rev. 95, 2457–2483 (1995).
- 8. Fanta, P. E. The ullmann synthesis of biaryls. Synthesis 1974, 9–21 (1974).