How Algorithms Shape the Distribution of Political Advertising: Case Studies of Facebook, Google, and TikTok
Abstract.
Online platforms play an increasingly important role in shaping democracy by influencing the distribution of political information to the electorate. In recent years, political campaigns have spent heavily on the platforms’ algorithmic tools to target voters with online advertising. While the public interest in understanding how platforms perform the task of shaping the political discourse has never been higher, the efforts of the major platforms to make the necessary disclosures to understand their practices falls woefully short. In this study, we collect and analyze a dataset containing over 800,000 ads and 2.5 million videos about the 2020 U.S. presidential election from Facebook, Google, and TikTok. We conduct the first large scale data analysis of public data to critically evaluate how these platforms amplified or moderated the distribution of political advertisements.111Our dataset and source code is available for public use under http://campaigndisclosures.princeton.edu/ We conclude with recommendations for how to improve the disclosures so that the public can hold the platforms and political advertisers accountable.
1. Introduction
As online advertising becomes a crucial part of political campaigns (Hersh, 2015; Kreiss, 2016a), the platforms’ control over their communication infrastructure makes them key political actors (Plantin et al., 2018) and gives them a power over the political discourse that goes beyond what the traditional definition of “platform” might denote (Gillespie, 2010). Importantly, these platforms are not neutral carriers of political ads, but play a more active role in amplifying or moderating the reach of those political messages. But the platforms have not disclosed data that would allow for meaningful public oversight of their actions. In 2018, in an attempt to stave off regulation, some platforms begun to voluntarily create libraries of political advertisements and moderation decisions (Fowler et al., 2020).
In this study, we evaluate the voluntary disclosures (Google, [n. d.]; Facebook, 2021) made by online platforms to understand how the platforms influence the distribution of the political ads. We conduct the first large scale data analysis of political ads in the 2020 U.S. presidential elections to investigate the practices of three platforms - Facebook, Google, and TikTok.
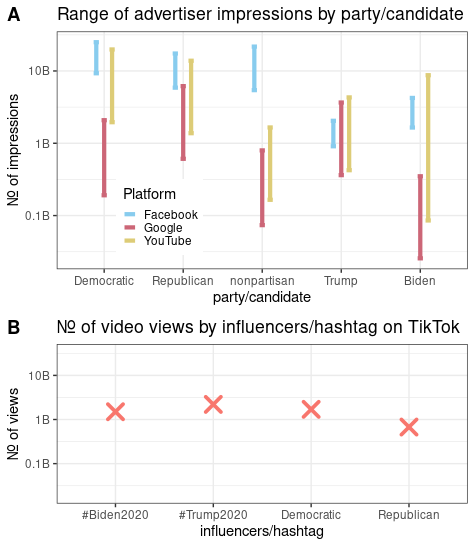
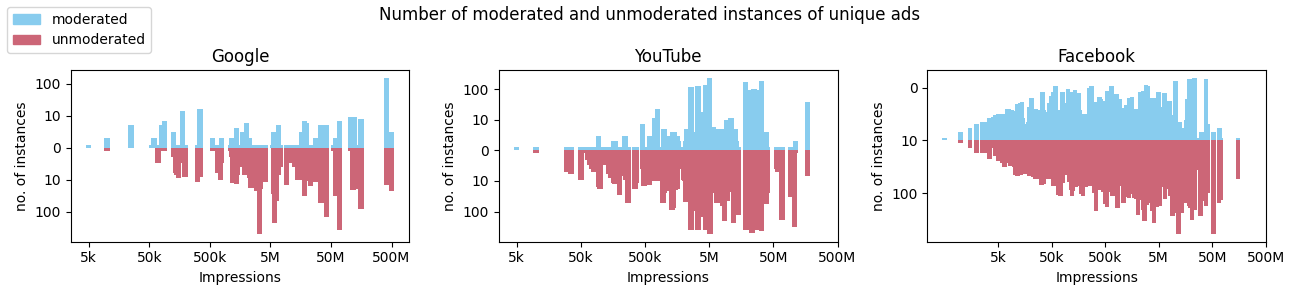
One clear indication of the importance of online platforms to political campaigns is to see how campaigns have shifted their spending to online advertising. In 2008, the first significant digital campaign spent roughly $20 million on online advertising, which amounted to 0.4% of the total money spent on campaigning (Erickson, 2016). In the 2020 election cycle, the campaigns spent more than $2.8 billion, or 20% of the campaign budget (by Statista Research Department and 14, 2021) on the major platforms. As shown in figure 1, this spending generated billions of impressions for political ads placed in the two months prior to the US 2020 elections.
Mindful of the risk of elevating transparency to become the supreme value in democratic politics (Schudson, 2020), we do not focus on transparency for its own sake. Instead, we develop a framework that identifies the desirable properties for these disclosures that serve broader democratic values, and measuring the effectiveness of the current platform disclosures against those properties. Two straightforward research questions lie at the heart of our inquiry:
- RQ1::
-
What do the ad libraries tell us about how the algorithmic tools were used to distribute political ads?
- RQ2::
-
Can we interpret how platforms applied their moderation policies to political ads?
1.1. Contributions
-
•
We develop and apply a three part evaluative framework for measuring the effectiveness of platform disclosures (section 3).
-
•
We attempt to reverse-engineer platforms’ ad targeting tools using the available data to assess how they influence the distribution of content (section 6.1).
-
•
Our statistical analysis suggests that the platforms charge different campaigns different rates for targeting specific regions and demographics (section 6.1.3).
-
•
As a whole, we demonstrate how the data provided by the platforms is noisy and incomplete so it is difficult to draw definitive conclusions about how they operate (section 6.1.4).
-
•
There are pervasive inconsistencies in how the platforms implement their ad moderation policies. We detected numerous instances where ads are moderated after already having generated millions of impressions, or where some ads are flagged for moderation when others with the same content are not (section 6.2).
2. Related Work
Online platforms such as Facebook, Google, and TikTok play an increasingly prominent role in shaping political discourse (Kreiss and McGregor, 2018). One widely studied aspect is the impact of the platform practices on user behavior (Corbyn, 2012; Persily and Tucker, 2020; Susser and Grimaldi, 2021). Another is how political actors utilize platforms in their political campaigns (Kreiss, 2016b). But the role of platforms’ algorithmic tools as intermediaries that shape the political discourse has not been studied as extensively as there is limited visibility into their practices (Edelson et al., 2019; Ghosh et al., 2019).
We build on the works from Kreiss, Mcgregor & Barrett (Kreiss and McGregor, 2018, 2019; Kreiss and Barrett, 2020), exploring the role of online platforms in shaping political communication, and the works of Fowler et al. (Fowler et al., 2018; Fowler, 2021; Fowler et al., 2021) and West(West, 2017), who provide historical information about political advertising and regulatory changes. We also draw on work by researchers who describe the content of ad libraries (E.g. Edelson et al. (Edelson et al., 2019) for the US, Dubois et al for Canada (Dubois et al., 2021) and Medina et al. for Germany (Medina Serrano et al., 2020)). Like (Andreou et al., 2018; Leerssen et al., 2021; Silva et al., 2020; Le Pochat et al., 2022), we assess the data quality of the libraries to uncover misleading, incomplete, or wrong information.
Notably, our work is different from and complementary to the attempts to understand the role of the platforms in democracy through direct agreements between researchers and platforms (Guess et al., 2021) that draw on the detailed user data available to the platform. Our study is deliberately limited to the data that the platforms make publicly accessible.
As we demonstrate in our analysis below, the platforms use complex, and opaque algorithms to price and distribute ads (e.g (Toubiana et al., 2010; Matias et al., 2021)). We build on prior research studies that show how these algorithmic tools can result in discriminatory and biased outcomes (Ali, 2021; Ali et al., 2021, 2019), and can have differential effects on the user population (Chen et al., 2015; Kruikemeier et al., 2016).
Finally, our recommendations for appropriate disclosures rely on design frameworks (e.g. (Finocchiaro et al., 2021; Benthall and Goldenfein, 2021; Simons and Ghosh, 2020)) that seek to give users the ability to evaluate and understand how algorithmic tools influence them (Milano et al., 2021; Neff, 2020; Vecchione et al., 2021).
3. Evaluative Criteria
Government regulations for online political advertising have stalled in the United States (Persily and Tucker, 2020). As a result, we do not have legal standards with which to evaluate the current disclosures by the platforms. Nevertheless, we extract three potential criteria to measure the effectiveness of the disclosures:
-
•
First, do the disclosures meet the platforms’ self-described objective of making political advertisers accountable?
-
•
Second, how do the platforms’ disclosures compare against what the law requires for radio and television broadcasters?
-
•
Third, do the platforms disclose all that they know about the ad targeting criteria, the audience for the ads, and how their algorithms distribute or moderate content?
3.1. Self-Imposed Standards
In 2018, facing potential regulation such as the proposed Honest Ads Act (Congress, [n. d.]), several online platforms chose to create ad libraries of political campaign materials. For Facebook, Google, and YouTube, these libraries provide some basic information about who placed ads, their content, how they were distributed, and whether they were moderated (table 1). TikTok recently created an ads library (TikTok, 2021), but the company disavows carrying ads about political issues and it does not disclose how it moderates political content.
|
|
|
|
|||||||||||||||||
| Definition | Actor, Subject | Actor, Issue |
|
||||||||||||||||
| Targeting | Full | Restricted | None | ||||||||||||||||
|
|
|
|
||||||||||||||||
| Moderation | Removal/ Label | Removal/Label | Label/Algorithm |
Facebook. Facebook’s Political Ad Policy restricts the ability to run electoral and issue ads to authorized advertisers only. Facebook states that the purpose of the ad library is to provide “advertising transparency by offering a comprehensive, searchable collection of all ads currently running from across Facebook apps and services, including Instagram.” Notably, as the policy explains, the advertising transparency is directed at “making political ads more transparent and advertisers more accountable” and not to hold the platform accountable for how it distributes or moderates the political content.
For ad moderation Facebook applies its general Advertising Policies and Community Standards. The Political Ads Policy falls under the Restricted Content section and consists of two policies: 9.a Ads About Social Issues, Elections or Politics, and 9.b Disclaimers for Ads About Social Issues, Elections or Politics. Article 9.a outlines that advertisers are required to complete Facebook’s authorization process, and failure to meet the reporting requirements may lead to restrictions such as the disabling of existing ads.
Google. Google also launched its political Ad Library during summer 2018 and requires advertisers to be verified to publish ads. Like Facebook, the library’s purpose is vaguely described as providing “greater transparency in political advertising,” without disclosing what the transparency is being compared against or who is the subject of the transparency goals. It is clear that the subject of transparency is the political campaign and not the platform. The Google ads archive, which includes ads placed on the Google network (search engine, third party websites that use google ad tools, and other google services) and on YouTube, shows the content of each instance of the political ad, the advertiser, its cost and related impressions. It also shows which user groups in terms of age, gender, and location (up the zip code), were targeted by the advertisers.
Google and YouTube’s ad moderation policies are set forth in the platform’s Advertising Policies. Google has a specific category on Political Content, which is listed under the Restricted Content and Features section of their policy. In case that an ad gets removed by the platform, the content of it is replaced by a red banner in the archive, stating that the ad violated the platform’s terms & conditions.
TikTok. TikTok does not have political ads in its library because it does not allow such ads on the platform. It explains that the “the nature of paid political ads is not something we believe fits the TikTok platform experience.” Nevertheless, from the content sample we analyze in this study (see section B.3) we document a significant amount of political content shared on the platform around the elections. We observe that a lot of that content is generated by a group of influencers, some of which directly linked to political organizations such as PACs. Political influencers are present on Facebook and Google as well. TikTok also recently published its updated community guidelines (TikTok, [n. d.]), but the guidelines do not mention how the platform moderates political content.
3.2. Broadcast Regulations
Federal law imposes disclosure requirements on political campaigns and broadcasters to ensure that the public can understand where campaigns spend money on reaching prospective voters and whether the broadcasters carry the ads in a non discriminatory manner. The rules for the broadcasters are set and administered by the Federal Communication Commission. In particular, the FCC’s Political Programming staff oversees whether a broadcaster is favoring one candidate at the expense of the other by charging different rates or limiting the reach of candidate-sponsored ads (Commission, 2022b). Specifically, the FCC’s staff resolves issues related to the prohibition on censorship of candidate-sponsored ads; the “Lowest Unit Charges” and “Comparable Rates” that broadcasters charge candidates for their advertisements; and the on-air sponsorship identification for political advertisements. The FCC’s staff also oversees the files that broadcasters must maintain for the public to easily access and inspect.
In 2022, the FCC updated its regulations to require stations to maintain a files that contain the following information: (1) whether the broadcaster accepted or rejected the request to purchase broadcast time; (2) the rate charged for the broadcast time; (3) the date and time on which the communication is aired; (4) the class of time that is purchased; (5) the name of the candidate to which the communication refers and the office to which the candidate is seeking election, the election to which the communication refers, or the issue to which the communication refers; (6) in the case of a request made by, or on behalf of, a candidate, the name of the entity making the request; and (7) in the case of any other request, the name of the person purchasing the time, the name, address, and phone number of a contact person for such person, and a list of the chief executive officers or members of the executive committee or of the board of directors of such person (Commission, 2022a).
We extract an analogous evaluative criteria for online ads from these regulations for broadcasters that requires, at minimum, that the public should be able to evaluate how campaigns are spending money to target audiences, and whether the platforms are carrying the content in a non-discriminatory manner.
3.3. Comprehensive Disclosures
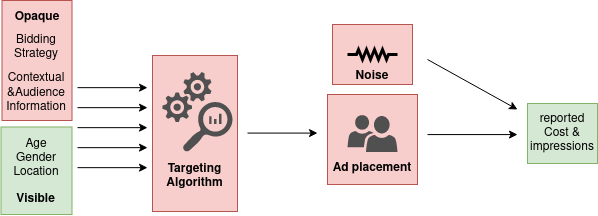
Platforms have unique data about the political campaign’s targeting parameters, how algorithms distribute or moderate content, and who actually saw the ads. But, as shown in figure 2, platforms only make a fraction of that information available for public scrutiny. Typically, an advertiser runs an ad on the platform by selecting from a variety of targeting parameters, including age, gender, location, as well as some available specific contextual and audience properties. Google allows political advertisers to target based on demographic properties and specific contextual features (ad placements, topics, keywords against sites, apps, pages and videos) (Google, [n. d.]). Facebook allows the use of demographic data for political ads, and also allows campaigns to use predefined lists of individuals or algorithmically generated “look-alike” audience lists (Facebook, 2021). After selecting targeting parameters, the advertiser chooses how it will pay for impressions, which the platform uses to calculate to whom the ad will be shown and at what cost. Given the advertiser’s choices, competing ads, and user properties, the platform uses complex algorithms to distribute the ad. It then creates reports for the advertiser about the number of impressions, as well as the total ad placement cost of the campaign.
But the platforms’ transparency libraries do not contain the information they provide to advertisers. As discussed below, the appropriate disclosures for platforms should include information how their algorithms function. But even if we put information about their algorithms to one side, they should disclose to the public, at minimum, all the information they make available to advertisers about costs, impressions, and targeting parameters. Accordingly, we assess the effectiveness of the platforms’ ad libraries by comparing what is disclosed currently against what could be made available to a hypothetical advertiser on that platform.
For a platform’s ad moderation practices there is little precedent to draw on to develop standards for appropriate disclosures. We examine whether the public can understand if the policy has been applied consistently and if the platform has provided an adequate explanation for its decision to moderate an advertisement.
4. Data
We create a large scale dataset of political ads and content for Facebook, Google (including YouTube), and TikTok. The dataset contains more than 850,000 ads on Facebook, Google, and YouTube and 2,7 million political videos on TikTok. We focus on content that was created up to two months prior to the US Elections. For ads, we collect who sponsored them, what specific targeting parameters & audience characteristics were used to distribute them, as well as their reach in terms of impressions and the corresponding cost. We also crawl the Facebook & Google ad libraries to locate moderated ads. For TikTok, we generate a list of political hashtags, which we use to crawl videos from the platform. We also use a list of political influencers & Hypehouses (40 democrats, 56 republicans), and download all their videos. For each video, we also collect the corresponding engagement metrics in terms of views, likes, shares, and its description. We also collect video creators’ metadata. Furthermore, we locate which TikTok videos were assigned an election-related warning by the platform, since the platform soft-moderated election related content, by placing a warning banner saying Get info on the U.S. elections, The banner was linking to a guide including authoritative information about the election process. An in-detail description about the collected dataset can be found in table 2 and in appendix B.
5. Methods
First, we quantify the prevalence of the political ads on the platforms. We quantify the number of impressions for political ads on Facebook, Google, and YouTube, and the cost to place this content. For TikTok, we document the number of views for videos produced by political influencers and of videos containing political hashtags gather in our dataset (Figure 1).
| Tiktok | |||||||||||||||||||||||
| Source | FB ad library | Google ad archive | Website | ||||||||||||||||||||
| Collection method | Ad library API | Crawled the ad archive | Crawled the website | ||||||||||||||||||||
| Scope |
|
|
|
||||||||||||||||||||
| Date range |
|
Sep 1 - Nov 4 (60 days preceding the election) |
|
||||||||||||||||||||
| Attributes |
|
|
|
||||||||||||||||||||
| Dataset size |
|
|
|
||||||||||||||||||||
|
|
|
|
||||||||||||||||||||
|
|
|
|
||||||||||||||||||||
|
|
|
|||||||||||||||||||||
Second, we analyze whether the data provided by the online platforms adequately explain the platforms’ decisions and algorithms using the three analytical criteria described in section 3. Table 3 provides an overview of the methodologies we describe in detail next, together with the corresponding evaluative criteria and the sections we report our related results.
| Method | Platform | Evaluative Criterion | Section in methods & results | ||||||||||||
|---|---|---|---|---|---|---|---|---|---|---|---|---|---|---|---|
|
|
|
Assessing information in the ad libraries | ||||||||||||
|
|
|
|
||||||||||||
|
|
|
|
||||||||||||
|
|
|
|
||||||||||||
|
|
|
|
||||||||||||
|
TikTok |
|
|
5.1. Distribution of political content
5.1.1. Assessing information in the ad libraries
For the platforms that have political ad libraries (Facebook, Google, & YouTube), we assess the platforms’ role in shaping the distribution strategy. Since platforms do not provide all targeting information associated with an ad, we explore what the limited data can tell us about how the platforms’ tools were used to target specific audiences. Specifically, we quantify the unique number of ads Biden’s and Trump’s campaigns placed in terms of content, location, age and gender demographics. We also locate how the same ads were distributed across different platforms, and we compare the distribution metrics provided by Facebook and Google to assess what information ad libraries can provide.
5.1.2. Reverse engineering the platforms’ targeting algorithms.
Next, we attempt to reverse engineer the platforms’ targeting algorithms. We do that by creating advertising accounts on Facebook and Google, and evaluating the cost and impression estimates for hypothetical ads that mimic the targeting criteria of original political ads that ran on the platforms. If the cost/impression estimates for the hypothetical ads deviate significantly from the reported ranges for the ads that did run, we assume that advertisers used additional targeting options.
Specifically, we create four different dummy ads to investigate the relationships in more detail. On Google, our dummy ad targets the whole of the United States and to all available genders and ages, and we calculate the upper and lower impressions it will generate for a budget varying from $10, to $1,000,000. We do the same for an ad on YouTube targeting Pennsylvania and females between 25-34. For Facebook we target one ad at the whole of the United States and all genders and ages. Lastly, our other dummy ad on Facebook targets California, and females of all ages. Based on the reported upper and lower values, we interpolate cost and impressions and calculate an area of plausibility. If an ad in the ad libraries with the same targeting options falls within this area, it suggests that the advertisers actually used these targeting options. In case that an ad falls outside the area, it suggests that ads might have used additional targeting options that platforms did not disclose. In this way we can assess information quality in the ad libraries. One notable limitation of this approach is that we ran these dummy ads at a different time period from the political ads we examined. As a result, the analysis is illustrative of the technique and should not be taken as definitive.
5.1.3. Connecting targeting & audience characteristics to ads’ cost per impression.
To further explore how algorithms distribute political content, we investigate the sensitivity of cost/impressions ratios to different audience characteristics and targeting properties. We create models that analyze ads generated by the Biden and Trump campaigns, and uncover how ad specific properties link to ads’ distribution. For Facebook, we create a linear regression model that has as dependent variable the cost/impressions ratio, and as independent the ratio of individuals for each state that viewed an ad, the ratio of individuals that were either male or female and belonged to the age buckets 18-24, 25-34, 35-44, 45-54, 55-65,65+, and whether the ad was placed by the Biden or Trump campaign. Since the Google Ad Archive aggregates cost and impression into intervals, we create an ordinal logistic regression model that has dependent variable the cost of an ad, and as independent the generated impressions, whether the ad was text (ad on google search), image (ad on third party affiliates), or video (YouTube ad), the targeted genders (male, female), different age groups (18-24, 25-34, 35-44, 45-54, 55-65, 65+), the magnitude of region targeting (USA, state level, county level, zipcode level), and whether the ad was placed by the Biden or Trump campaign. Based on located associations, we uncover factors that shape the algorithmic distribution of content.
5.1.4. Crossplatform comparison of targeting parameters & audience characteristics.
To understand what full disclosures can tell about the algorithms that distribute political advertisements, we use as data the cross-platform tactics of advertisers. Following the principles of personalized advertising, we make the strong assumption that advertisers would have targeted specific demographics with the same content across platforms, in order to maximize their influence potential. Therefore, we identify 35 unique image ad designs created by Biden & Trump that correspond to 12,448 unique ad placements on Facebook and 3,055 ad placements on Google. Similarly, we identify 72 unique video ad designs that correspond to 13,840 ad placements on Facebook and 4,383 ad placements on Google. We then identify ad instances that their targeting options on Google match with ad instances’ distributional information on Facebook, and assess how algorithms deliver ads based on specific targeting choices of the advertisers. We do so by focusing on two sets of ads, namely YouTube ads placed by the Biden campaign to all genders and image ads placed by the Trump campaign to all available age groups. In this way, we uncover how consistent is Facebook’s algorithmic distribution.
5.2. Moderation of Political advertising and content
We analyze platform tactics in algorithmic ad & content moderation based on each platform’s policies.
We use two methods to evaluate TikTok’s moderation of election related content.
5.2.1. Connecting TikTok video properties to their moderation
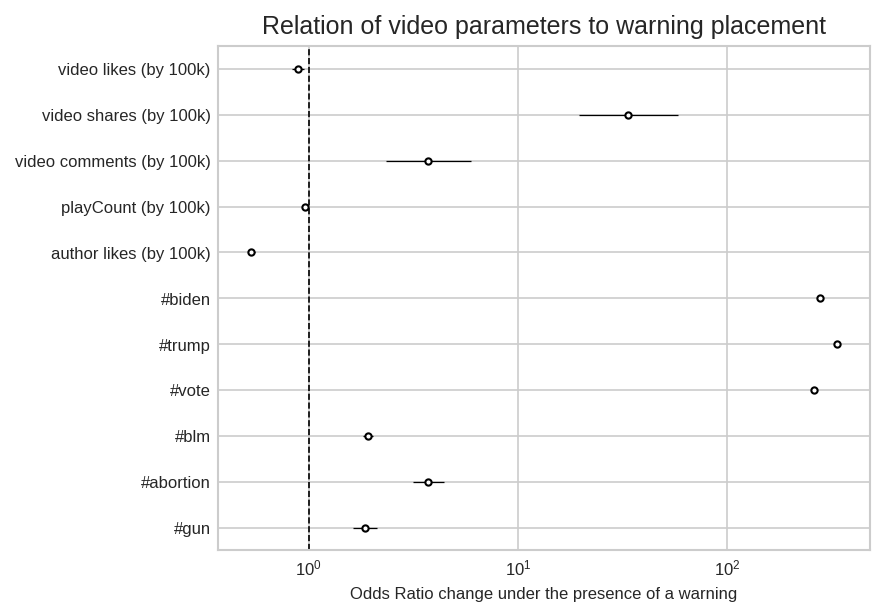
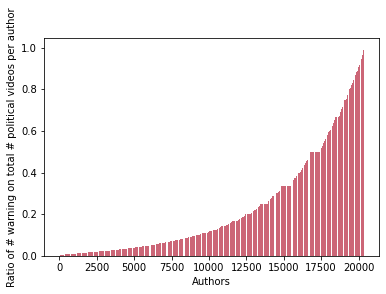
Our second technique investigates TikTok’s use of warning labels related to the U.S. elections that uses a logistic regression model to predict whether a video was flagged. We use as independent variables the likes, shares, comments, and views it generated, the average amount of likes the video’s author collected, as well as the presence of three election-related (#biden,#trump, #vote) and three non-election related (#blm, #abortion, #gun) hashtags. Furthermore, we calculate the ratio of political videos flagged for each user in our dataset. Based on the results of both analyses, we can uncover features that constituted algorithmic content moderation.
5.2.2. Characterizing the magnitude and effectiveness of moderation for Facebook & Google
For Facebook, Google, and YouTube, our investigation of moderation practices examines the ad libraries to document how many ads were moderated and how many individuals saw ads that were flagged. In addition, we manually reviewed a set of 200 moderated ads for each platform, which allows us to qualitatively understand features of the moderation process. Furthermore, based on the set of moderated ads in our sample, we locate other ads that contained the same content, but were not moderated. We quantify their distribution on the platforms, and assess the robustness and degree of explainability of the moderation process. These three steps allow us to uncover patterns about who was moderated, why, and how effective was this moderation.
6. Results
6.1. Political content distribution
6.1.1. Assessing information in the ad libraries: Platforms provide limited insights about how campaigns used their targeting tools.
Table 4 presents the demographic distribution of Biden and Trump ads on Google and Facebook. This superficial view seems to suggest that advertisers rarely resorted to micro-targeting, and instead applied broad criteria to target general segments of the society. For Google, which publishes targeting data, we see that both Biden and Trump appear to infrequently use the platform’s fine-grained demographic targeting (except for targeting by state). Facebook, provides audience characteristics of individuals who saw the ads, rather than targeting choices, but the pattern is similar.
| Distribution Strategy | Biden | Trump | Biden | Trump |
|---|---|---|---|---|
| Age | 3% | 0% | 34% | 31% |
| Gender | 1% | 0% | 6% | 7% |
| zip Code/County | 17% | 19% | - | - |
| State | 81% | 69% | 87% | 96% |
| Age & Gender & zip Code/County | 0% | 0% | - | - |
| Age & Gender & State | 1% | 0% | 6% | 7% |
Yet, a closer look of the actual content distributed on the platforms contradicts this superficial view. For example, we used algorithmic tools (Ooms, 2020) and manual coding, to detect all ads placed by Biden and Trump in the Spanish language. On Google, the majority of the 1724 ads we located that were in Spanish language had no demographic targeting and were sent to geographies that did not have large Hispanic populations. Even for zip code targeted ads, the percentage did not exceed on average 30% on Google and 12% on YouTube. In other words, the campaigns potentially used some undisclosed contextual targeting criteria to place the ads. On Facebook, we also located 626 ads in Spanish, but since the ad library provides distributional data only at the state level, we were not able to evaluate how they were targeted.
6.1.2. Reverse engineering the platforms’ targeting algorithms.
Similarly, our reverse engineering of the platforms’ tools evidence indicates that the campaigns used undisclosed targeting strategies. Figure 3 presents how the distribution of the actual ads in our sample falls within the retrieved cost-per-impression boundaries. We find that the reverse engineering data do not always correspond to the targeting/distributional information provided in the ad libraries. For Google, this discrepancy is small, when looking at ads distributed over the United States across all genders and ages, with only about 2% of the ads reported in the ad libraries following out our calculated boundaries. This discrepancy is significantly larger when comparing YouTube ads placed in Pennsylvania to Females between 25 and 34, with the disagreement reaching 13%. However, the true discrepancy may be much larger because Google uses very large reporting buckets for costs and impressions, as Figure 3 reveals. By way of illustration, an ad is assigned the same value of 10,000 impressions and $100 costs whether it is shown to 500 individuals at a cost of $5 or 9,000 individuals for $90.
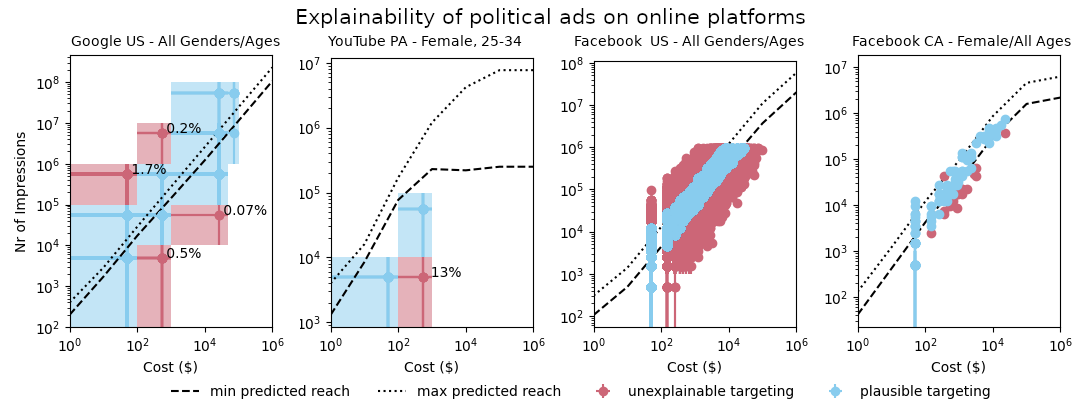
We locate similar discrepancies when reverse-engineering the information for Facebook. For ads placed to Females of all ages in California, the disagreement between cost/impression data from our analysis and from the ad libraries is 14%. For ads placed in the United States generally, across all genders and ages, the disagreement exceeds 27%. These results illustrate that the available information ad libraries provide is not sufficient to understand how political advertisers used the platform to distribute political messages. Even if the detected discrepancies are a result of specific undisclosed parameters that influence targeting (e.g. auction system, time of placed ad, etc.), the disclosures do not meet the platforms’ self-described objective of making political advertisers accountable. Although the ad libraries provide information about the content of ads, they do not allow the public to understand the exact segments of the society advertisers wanted to target, the price they paid, or how algorithms transformed these intentions to a specific content distribution.
6.1.3. Connecting targeting & audience characteristics to ads’ cost per impression: Disclosures and targeting algorithms fall short compared to existing broadcasting policies.
Our regression analysis results (tables 11 & 11, appendix) reveal specific shortcomings for algorithms and platform disclosures, both for Facebook and Google, since we discover that there was no parity in the cost of ads between advertisers. We also see that different demographic targeting and audience characteristics resulted in different ad placing cost.
For Facebook, there was no difference in the number of impressions per dollar an ad generated, regardless of the gender of individuals who saw them. Nevertheless, age was a factor associated with different amounts of generated impressions. Specifically, placing ads to older populations (¿ 55) and very young populations (18-24) was significantly more expensive than placing ads to individuals between 25 and 54. Furthermore, ads cost varied between different states. For example, the most expensive impressions were found in the states of Massachusetts, Rhodes Island, and Washington DC, while the cheapest impressions were generated in the states of Idaho, Kentucky, and Mississippi. Interestingly, ads that Trump placed were overall more expensive by impression compared to those of Biden.
On Google and YouTube, as with Facebook, there was a difference when targeting different age demographics. Targeting individuals between the ages of 18-24 was by far the cheapest, while the most expensive targeting groups were people aged between 25-34. The more location-specific the targeting, the more expensive was the ad placement, with zip code targeted ads being the most expensive and US-general ads being the cheapest. In contrast to Facebook, the ads that Trump placed were cheaper than those placed by Biden.
Comparing these results to the broadcast regulations we observe multiples instances of a lack of rate parity between campaigns and across different strategies. Of course, these rate differences can be attributed to multiple factors, such as additional contextual targeting criteria, which where not provided by Facebook or Google, as well as further information about how their algorithms distribute and price content. But it is worth noting that the potential for a broadcaster to favor one campaign over another led to the FCC rules on parity between campaigns and commercial advertisers, to ensure that the broadcaster was acting appropriately. Another issue is that the algorithmic promotion and demotion of content by the platforms runs into the concern that the intermediary might covertly limit the reach of candidate-sponsored ads. But our analysis shows that there are unexplained artifacts in the distribution that can be tied back to the algorithmic choices of the platforms.
6.1.4. Cross-platform comparison of targeting parameters & audience characteristics: Full disclosures reveal properties of algorithmic distribution
Building on our results from the prior sections, we evaluate what the cross-platform tactics of advertisers can reveal about how content was algorithmically distributed to the public. We do this by pairing ads that were shown on Google and Facebook so that we obtain data about targeting criteria from Google and the actual distribution from Facebook.
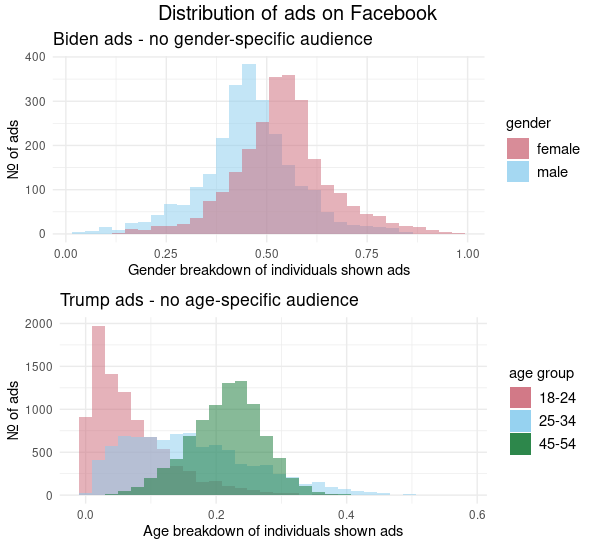
Figure 4 shows how two specific sets of ads on Facebook were distributed across genders and age-groups respectively, given that they were not targeted to specific gender or age subgroups on Google. For video ads placed by Biden, which were not gender targeted, we find that they were distributed unequally among males and females. On average, ads were shown 45% to males, and 53% to females, while the standard deviation of the distribution for each gender was 12%. This discrepancy about the ads can be potentially attributed to the gender demographics that used Facebook in the US in 2020, which was 54.5% for females and 43.5% for males (NapoleonCat, [n. d.]).
By analyzing image ads for Trump, that did not have any limitations in age targeting, we uncover similar patterns. Focusing on three age-groups, we find that on average an ad would be shown at a rate of 6% to individuals between 18-24, at a rate of 16% to individuals between 25-34, and at a rate of 21% to individuals between 45-54. In contrary to gender distribution, these values do not correspond to the Facebook user demographics in 2020, which were 8% for individuals between 18-24, 13% for individuals between 25-34, and 7% for individuals between 45-54. This means that algorithmic targeting resulted in a disparate distribution of ads across age groups. These findings provide additional support for the public interest in further understanding how the distribution of the campaigns ads was affected by the platforms’ algorithmic choices.
6.2. Moderation of political advertising and content
Focusing on moderation, we evaluate how platforms disclose their choices and practices when removing political ads (Facebook, Google, YouTube), and handling political content (TikTok).
6.2.1. Characterizing the magnitude and effectiveness of moderation for Facebook & Google: Unexplainable ad moderation practices.
Our study documents how difficult it is to understand how the platforms apply their moderation policies to political ads.
On Google and Facebook we see that a large number of ads across a wide range of advertisers were removed (table 8, appendix). Google removed 13.3% of the political ads from its network, YouTube removed 4.5%, while Facebook only 1.2%. Despite their removal, these ads generated a significant amount of user impressions. Furthermore, these decisions affected a significant number of advertisers. Google removed at least one ad from 256 advertisers (18% of all), YouTube at least one ad from 307 advertisers (22% of all), and Facebook from 266 advertisers (31% of all).
Figure 5 illustrates how different instances of the same ad design were moderated. For each platform we find a significant number of ads that contained some instances where the ad was removed, and some that were not. On Facebook, this appeared in 51% of the moderated ads. For Google, the amount of these ads was 75%, while for YouTube it was 65%. In total, we found 11,549 ad instances across platforms that were not moderated, although at least one identical to them was removed. In median for Google, non-moderated ad instances resulted in the generation of 1.1 billion impressions, compared to 700 million for the moderated ones. For YouTube, non-moderated ad instances generated 1.2 billion impressions, while moderated instances 900 million. For Facebook, these numbers were 440 million and 200 million respectively. These results suggest that inconsistent ad moderation had serious implications, since both moderated ads resulted in a significant amount of impressions, and also their unmoderated counterparts resulted in an even higher diffusion of problematic content. Furthermore, the platform ad libraries do not provide any explanation why and when an ad was removed, therefore, is not possible to assess the reasons for these discrepancies. Especially for Facebook, we find that even the classification of ads as removed was inconsistent. When manually reviewing a random sample of 200 moderated ads, we found that 35 were no longer labeled as removed. These results raise questions about the efficacy, robustness, and explainability of the moderation practices.
6.2.2. Connecting TikTok video properties to their moderation
Focusing on content moderation on TikTok, we find 505,062 videos that contained at least a hashtag from our curated hashtag list. From these, 243,440 videos (48.2%) were labeled with a U.S. election warning. We find that election related content was a driver for this moderation. Figure 6-Left (Appendix) shows the logistic regression results for predicting whether a TikTok video containing political hashtags has been labeled or not. We find that election related hashtags (Biden/Trump/Vote) were strong predictors for content moderation, while non-election related hashtags were not as much (e.g. BLM, abortion, gun). Similarly, video views and likes seem not to have been associated with the probability of a video being labeled, while both video creator popularity and sharing/commenting were. The more popular the content creator, the less likely that a video of theirs was going to be labeled. Furthermore, the more organic interactions a video gathered in terms of shares and comments, the more likely it was to be labeled. Analyzing the distribution of moderated videos by author (figure 6,right), we find a discrepancy in the videos labeled by user, with some videos containing election-related hashtags of a user being flagged, and some not. These results illustrate that although the content of videos was strongly associated with warning placement, there is a need for additional information about TikTok’s practices. For example, it would be important to know the exact definition of “election-related” on the platform, or whether features such as video description or author information were taken into consideration for labeling content.
6.3. Consequences of different definitions of ”political ads”
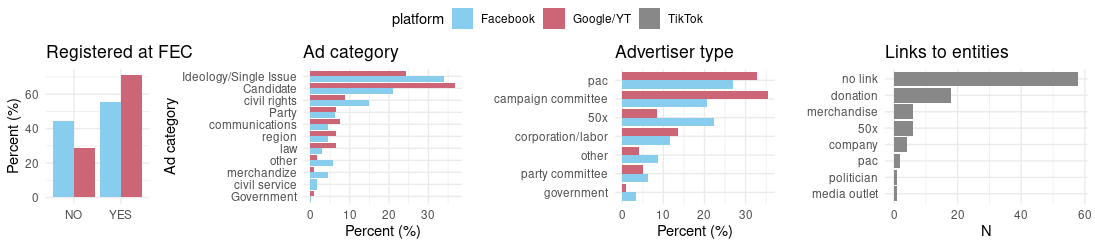
In evaluating what self-disclosures reveal about advertisers and algorithms, we found that each platform’s defined political ads differently, which made it difficult to make comparisons across platforms. As shown in Figure 7 (Appendix), each platform has a different definition of what is a political ad, which dictates whether and to what extent an advertiser will be allowed to use platforms’ targeting tools and whether their campaigning information will be included in the ad libraries. Google bases its definition solely on the identity of the advertiser, while Facebook takes a more expansive view that also captures advertisers running issue-based ads. As a result, we see that the Facebook ad library has a higher proportion of advertisers who are not registered with the FEC as compared to the Google Ad Archive (45% vs 25%). In contrast, the narrower definition of political ads on Google does not allow us to see the targeting activities of a broad set of advertisers, including a significant amount of NGOs (23% on Facebook vs 8% on Google). In Citizens United v. FEC, the United States Supreme Court upheld the disclosure requirements for issue-based ads on broadcast stations because ”[e]ven if the ads only pertain to a commercial transaction, the public has an interest in knowing who is speaking about a candidate shortly before an election.” That same public interest here should require disclosures about all ads involving “electioneering communications” (Committee, 2022). Platforms should not be allowed to strategically limit what information becomes available to the public.
In the case of TikTok, we see that while direct political advertising is prohibited, there are other forms of political campaigning on the platform. We looked more closely at the 96 influencers we identified to uncover links to political entities, especially those who had registered with the FEC. In our sample, we found six influencers directly linked to political NGOs, two to PACs, four to political merchandise, while 18 were asking for donations. Given the importance of this type of influencer advertising on of social media platforms, future work should investigate the funding mechanisms for influencer-driven political advertising in more detail (Mathur et al., 2020).
7. Policy recommendations
As our work demonstrates, there is an urgent need to standardize disclosures across platforms. In a white paper, Edelson et al. (Edelson et al., 2021), outline a useful technical standard for universal digital transparency. They propose the creation of a public repository and a technical standard that will make advertisers and platforms accountable for disclosing how they distribute content to the public. Our study builds on that work by demonstrating how the current voluntary disclosures about political ads by the platforms fall short of providing meaningful insights, and why such a standard is necessary for political advertising.
Specifically, we recommend that the FEC (or alternative federal agency) creates a cross-platform database that provides information about advertisers and platforms. Such a database should be accompanied by a standard that provides a universal identifier for each advertiser, so their campaign activities can be tracked across different platforms. In our study, the mapping of entities was a time consuming and complicated process. Furthermore, the standard should clearly define what is considered ”political,” so that there is an equal baseline for disclosures across the platforms. Such definition should be carefully chosen, given the complexity and non-triviality of the concept (Settle, 2018). The same applies for available targeted information. Platforms should disclose both the full and detailed targeting and distribution parameters (audience characteristics) of ads, since anything less than this results in an incomplete and inefficient evaluation of advertisers’ campaigns and platforms’ decisions. Finally, the full disclosures of targeting criteria can facilitate understanding the specific campaigning techniques attempted to influence voters.
We believe that the creation of a standard and repository should be accompanied with detailed regulations that protect the public and ensures fairness among political advertisers. Drawing from the broadcasting regulations, we observed an apparent difference in rates between different advertisers. Platforms should disclose how they algorithmically control the price and reach of content, whether platforms deliberately or unintentionally limit the reach of candidate-sponsored ads, how they ensure parity, and provide information that can reveal whether advertisers or platforms target segments of the society in a biased way. Similarly, since we discovered significant inconsistencies in ad moderation, we argue that platforms should be obligated to disclose when and why an ad was removed, and make the removed content available for review in a neutral repository. This can make platforms accountable for their decisions and algorithms, and can ensure the fair moderation of content among advertisers.
Lastly, the broad reach of the influencers that we document on TikTok highlights the need for regulations that require disclosures about their sources of funding and other activities. And such influencer-driven marketing is also present on Google and Facebook properties, but is not disclosed in their ad libraries. Because Federal Trade Commission’s endorsement guidelines are designed for commercial transactions and not political campaigning, this is an area where the Federal Election Commission would need to develop comprehensive disclosure requirements.
8. Conclusion
In this study, we evaluated what the platform disclosures could tell the public about their role in the distribution and moderation of political advertising. By taking the political ad libraries and platforms transparency mechanisms seriously, we undertook large scale data analysis of political ads on Facebook, Google, and TikTok. Our study demonstrated the existence of strong barriers to public understanding advertisers’ tactics. We also found evidence that platforms’ disclosures falls well short of what is required under the law for broadcasters. Finally, we showed why we meed more accurate and comprehensive disclosures to understand and robustly evaluating targeting tools and algorithmic moderation.
9. Acknowledgments
This study was supported by a Princeton Data Driven Social Science Initiative Grant. We thank Laura Edelson, Andy Guess, and Matt Salganik for constructive feedback on the final manuscript. We are also grateful for the early feedback from the research seminar run by Princeton’s Center for the Study of Democratic Politics and later feedback from the MPSA’22 panel on political marketing. We would also like to thank Eli Lucherini for support in data analysis, Ashley Gorham for conceptual contributions in the early stages of the project, Juan Carlos Medina for a part of the data collection, and Milica Maricic for support in classifying political ads and creating the website of the project.
References
- (1)
- Ali (2021) Muhammad Ali. 2021. Measuring and Mitigating Bias and Harm in Personalized Advertising. In Fifteenth ACM Conference on Recommender Systems. 869–872.
- Ali et al. (2019) Muhammad Ali, Piotr Sapiezynski, Miranda Bogen, Aleksandra Korolova, Alan Mislove, and Aaron Rieke. 2019. Discrimination through optimization: How Facebook’s Ad delivery can lead to biased outcomes. Proceedings of the ACM on Human-Computer Interaction 3, CSCW (2019), 1–30.
- Ali et al. (2021) Muhammad Ali, Piotr Sapiezynski, Aleksandra Korolova, Alan Mislove, and Aaron Rieke. 2021. Ad Delivery Algorithms: The Hidden Arbiters of Political Messaging. In Proceedings of the 14th ACM International Conference on Web Search and Data Mining. 13–21.
- Andreou et al. (2018) Athanasios Andreou, Giridhari Venkatadri, Oana Goga, Krishna Gummadi, Patrick Loiseau, and Alan Mislove. 2018. Investigating ad transparency mechanisms in social media: A case study of Facebook’s explanations. In NDSS 2018-Network and Distributed System Security Symposium. 1–15.
- Benthall and Goldenfein (2021) Sebastian Benthall and Jake Goldenfein. 2021. Artificial Intelligence and the Purpose of Social Systems. In Proceedings of the 2021 AAAI/ACM Conference on AI, Ethics, and Society. 3–12.
- by Statista Research Department and 14 (2021) Published by Statista Research Department and Jan 14. 2021. Digital political ad spend in the U.S. 2020. https://www.statista.com/statistics/309592/online-political-ad-spend-usa
- Chen et al. (2015) Jilin Chen, Eben Haber, Ruogu Kang, Gary Hsieh, and Jalal Mahmud. 2015. Making use of derived personality: The case of social media ad targeting. In Ninth International AAAI Conference on Web and Social Media.
- Commision (2022) Federal Election Commision. 2022. Campaign finance data. https://www.fec.gov/
- Commission (2022a) Federal Communications Commission. 2022a. FCC adopts updated political programming and record-keeping rules. https://www.fcc.gov/document/fcc-adopts-updated-political-programming-and-record-keeping-rules
- Commission (2022b) Federal Communications Commission. 2022b. Political programming. https://www.fcc.gov/media/policy/political-programming
- Committee (2022) Federal Election Committee. 2022. Making electioneering communications. https://www.fec.gov/help-candidates-and-committees/other-filers/making-electioneering-communications/
- Congress ([n. d.]) United States Congress. [n. d.]. Text - S.1989 - 115th congress (2017-2018): Honest ads act. https://www.congress.gov/bill/115th-congress/senate-bill/1989/text
- Corbyn (2012) Zoe Corbyn. 2012. Facebook experiment boosts US voter turnout. Nature News (2012).
- Dubois et al. (2021) Philippe R Dubois, Camille Arteau-Leclerc, and Thierry Giasson. 2021. Micro-Targeting, Social Media, and Third Party Advertising: Why the Facebook Ad Library Cannot Prevent Threats to Canadian Democracy. (2021).
- Edelson et al. (2021) Laura Edelson, Jason Chuang, Erika Franklin Fowler, Michael Franz, and Travis N Ridout. 2021. Universal Digital Ad Transparency. Available at SSRN 3898214 (2021).
- Edelson et al. (2019) Laura Edelson, Shikhar Sakhuja, Ratan Dey, and Damon McCoy. 2019. An analysis of united states online political advertising transparency. arXiv preprint arXiv:1902.04385 (2019).
- Erickson (2016) David Erickson. 2016. US political ad spending by format, 2008-2016. https://trends.e-strategyblog.com/2016/06/09/us-political-ad-spending-by-format/27038/
- Facebook ([n. d.]) Facebook. [n. d.]. Facebook open research and transparency home. https://fort.fb.com/
- Facebook (2021) Facebook. 2021. About Ads About Social Issues, Elections or Politics. https://www.facebook.com/business/help/167836590566506?id=288762101909005
- Finocchiaro et al. (2021) Jessie Finocchiaro, Roland Maio, Faidra Monachou, Gourab K Patro, Manish Raghavan, Ana-Andreea Stoica, and Stratis Tsirtsis. 2021. Bridging machine learning and mechanism design towards algorithmic fairness. In Proceedings of the 2021 ACM Conference on Fairness, Accountability, and Transparency. 489–503.
- Fowler et al. (2021) Erika Franklin Fowler, Michael M Franz, Gregory J Martin, Zachary Peskowitz, and Travis N Ridout. 2021. Political advertising online and offline. American Political Science Review 115, 1 (2021), 130–149.
- Fowler et al. (2018) Erika Franklin Fowler, Michael M Franz, and Travis N Ridout. 2018. Political Advertising in the United States. (2018).
- Fowler et al. (2020) Erika Franklin Fowler, Michael M Franz, and Travis N Ridout. 2020. Online political advertising in the United States. Social Media and Democracy: The State of the Field, Prospects for Reform (2020), 111–138.
- Fowler (2021) Geoffrey A. Fowler. 2021. How politicians target you: 3,000 data points on every voter, including your phone number. https://www.washingtonpost.com/technology/2020/10/27/political-campaign-data-targeting/
- Franzke et al. (2020) Aline Shakti Franzke, Anja Bechmann, Michael Zimmer, Charles Ess, et al. 2020. Internet research: Ethical guidelines 3.0. Association of Internet Researchers 4, 1 (2020), 2056305118763366.
- Ghosh et al. (2019) Avijit Ghosh, Giridhari Venkatadri, and Alan Mislove. 2019. Analyzing political advertisers’ use of Facebook’s targeting features. In IEEE workshop on technology and consumer protection (ConPro’19).
- Gillespie (2010) Tarleton Gillespie. 2010. The politics of ‘platforms’. New media & society 12, 3 (2010), 347–364.
- Google ([n. d.]) Google. [n. d.]. Political advertising on Google. https://transparencyreport.google.com/political-ads/region/US
- Guess et al. (2021) Andy Guess, Kevin Aslett, Joshua Tucker, Richard Bonneau, and Jonathan Nagler. 2021. Cracking open the news feed: Exploring what us Facebook users see and share with large-scale platform data. Journal of Quantitative Description: Digital Media 1 (2021).
- Hersh (2015) Eitan D Hersh. 2015. Hacking the electorate: How campaigns perceive voters. Cambridge University Press.
- Kovach (2020) Steve Kovach. 2020. Facebook to ban new political ads in week before presidential election. https://www.cnbc.com/2020/09/03/facebook-to-ban-political-ads-in-week-before-presidential-election.html
- Kreiss (2016a) Daniel Kreiss. 2016a. Prototype politics: Technology-intensive campaigning and the data of democracy. Oxford University Press.
- Kreiss (2016b) Daniel Kreiss. 2016b. Seizing the moment: The presidential campaigns’ use of Twitter during the 2012 electoral cycle. New media & society 18, 8 (2016), 1473–1490.
- Kreiss and Barrett (2020) Daniel Kreiss and Bridget Barrett. 2020. Democratic tradeoffs: Platforms and political advertising. Ohio St. Tech. LJ 16 (2020), 493.
- Kreiss and McGregor (2018) Daniel Kreiss and Shannon C McGregor. 2018. Technology firms shape political communication: The work of Microsoft, Facebook, Twitter, and Google with campaigns during the 2016 US presidential cycle. Political Communication 35, 2 (2018), 155–177.
- Kreiss and McGregor (2019) Daniel Kreiss and Shannon C McGregor. 2019. The “arbiters of what our voters see”: Facebook and Google’s struggle with policy, process, and enforcement around political advertising. Political Communication 36, 4 (2019), 499–522.
- Kruikemeier et al. (2016) Sanne Kruikemeier, Minem Sezgin, and Sophie C Boerman. 2016. Political microtargeting: relationship between personalized advertising on Facebook and voters’ responses. Cyberpsychology, Behavior, and Social Networking 19, 6 (2016), 367–372.
- Le Pochat et al. (2022) Victor Le Pochat, Laura Edelson, Tom Van Goethem, Wouter Joosen, Damon McCoy, and Tobias Lauinger. 2022. An Audit of Facebook’s Political Ad Policy Enforcement. In Proceedings of the 31st USENIX Security Symposium. USENIX Association.
- Leerssen et al. (2021) Paddy Leerssen, Tom Dobber, Natali Helberger, and Claes de Vreese. 2021. News from the ad archive: how journalists use the facebook ad library to hold online advertising accountable. Information, Communication & Society (2021), 1–20.
- Lorenz (2020) Taylor Lorenz. 2020. The political pundits of TikTok. https://www.nytimes.com/2020/02/27/style/tiktok-politics-bernie-trump.html
- Mathur et al. (2020) Arunesh Mathur, Angelina Wang, Carsten Schwemmer, Maia Hamin, Brandon M Stewart, and Arvind Narayanan. 2020. Manipulative tactics are the norm in political emails: Evidence from 100K emails from the 2020 US election cycle. Epub ahead of print 5 (2020).
- Matias et al. (2021) J Nathan Matias, Austin Hounsel, and Nick Feamster. 2021. Software-Supported Audits of Decision-Making Systems: Testing Google and Facebook’s Political Advertising Policies. arXiv preprint arXiv:2103.00064 (2021).
- Medina Serrano et al. (2020) Juan Carlos Medina Serrano, Orestis Papakyriakopoulos, and Simon Hegelich. 2020. Exploring political ad libraries for online advertising transparency: lessons from Germany and the 2019 European elections. In International conference on social media and society. 111–121.
- Milano et al. (2021) Silvia Milano, Brent Mittelstadt, Sandra Wachter, and Christopher Russell. 2021. Epistemic fragmentation poses a threat to the governance of online targeting. Nature Machine Intelligence 3, 6 (2021), 466–472.
- NapoleonCat ([n. d.]) NapoleonCat. [n. d.]. Facebook users in United States of America - december 2020. https://napoleoncat.com/stats/facebook-users-in-united_states_of_america/2020/12/
- Neff (2020) Gina Neff. 2020. From bad users and failed uses to responsible technologies: A call to expand the AI ethics toolkit. In Proceedings of the AAAI/ACM Conference on AI, Ethics, and Society. 5–6.
- Ooms (2020) Jeroen Ooms. 2020. cld2: Google’s Compact Language Detector 2. https://CRAN.R-project.org/package=cld2 R package version 1.2.1.
- OpenSecrets (2022) OpenSecrets. 2022. https://www.followthemoney.org/
- Persily and Tucker (2020) Nathaniel Persily and Joshua A Tucker. 2020. Social Media and Democracy: The State of the Field, Prospects for Reform. Cambridge University Press.
- Plantin et al. (2018) Jean-Christophe Plantin, Carl Lagoze, Paul N Edwards, and Christian Sandvig. 2018. Infrastructure studies meet platform studies in the age of Google and Facebook. New media & society 20, 1 (2018), 293–310.
- Schudson (2020) Michael Schudson. 2020. The shortcomings of transparency for democracy. American behavioral scientist 64, 11 (2020), 1670–1678.
- Settle (2018) Jaime E Settle. 2018. Frenemies: How social media polarizes America. Cambridge University Press.
- Silva et al. (2020) Márcio Silva, Lucas Santos de Oliveira, Athanasios Andreou, Pedro Olmo Vaz de Melo, Oana Goga, and Fabrício Benevenuto. 2020. Facebook ads monitor: An independent auditing system for political ads on facebook. In Proceedings of the Web Conference 2020. 224–234.
- Simons and Ghosh (2020) Josh Simons and Dipayan Ghosh. 2020. Utilities for democracy: Why and how the algorithmic infrastructure of Facebook and Google must be regulated. Brookings website (2020).
- Susser and Grimaldi (2021) Daniel Susser and Vincent Grimaldi. 2021. Measuring Automated Influence: Between Empirical Evidence and Ethical Values. In Proceedings of the 2021 AAAI/ACM Conference on AI, Ethics, and Society. 242–253.
- TikTok ([n. d.]) TikTok. [n. d.]. Community Guidelines. https://www.tiktok.com/community-guidelines-2022?lang=en#40
- TikTok (2021) TikTok. 2021. Top ads: High-performing auction ads. https://ads.tiktok.com/business/creativecenter/inspiration/topads/pc/en
- Toubiana et al. (2010) Vincent Toubiana, Arvind Narayanan, Dan Boneh, Helen Nissenbaum, and Solon Barocas. 2010. Adnostic: Privacy preserving targeted advertising. In Proceedings Network and Distributed System Symposium.
- Vecchione et al. (2021) Briana Vecchione, Karen Levy, and Solon Barocas. 2021. Algorithmic Auditing and Social Justice: Lessons from the History of Audit Studies. In Equity and Access in Algorithms, Mechanisms, and Optimization. 1–9.
- West (2017) Darrell M West. 2017. Air wars: Television advertising and social media in election campaigns, 1952-2016. CQ Press.
Appendix A Ethical Considerations
A.1. Data selection
Facebook provides, through special agreements for researchers, access to the FORT dataset (Facebook, [n. d.]), which purports to contain more detailed information about ad targeting on the platform as compared to the public library we analyzed. We decided not to use the FORT data for two reasons. First, we wanted to focus on data that was available to the public at large. Second, at the time we conducted our analysis, the platform did not provide us with appropriate assurances that we could use that data without any research & publication restrictions.
A.2. Privacy concerns
The analysis of the Facebook and Google data included only public information about ads and advertisers, as collected from the their APIs. For TikTok, we crawled the platform and collected only the public meta-data of user-generated TikToks, and not the actual videos. For security purposes, only one researcher of the project has access to the information, and will delete it upon completion of the study, as proposed by ethical data collection & analysis guidelines (Franzke et al., 2020).
Appendix B Data
B.1. Facebook
Facebook’s Ads Library contains information about ads related to politics, credit, housing, and employment. The platform provides information about whether an ad was sponsored or not, who sponsored it, its content, and data about the audience. Specifically, it provides a lower and upper number of generated impressions and cost, as well as which user groups saw the ad in terms of age, gender222Gender is a spectrum. Nevertheless, both Facebook & Google use a binary classification of genders. We adopt this language for the specific analysis, but we disagree with this form of classification., and location. Using the Ads Library API service, we collected all political ads placed in the 60 days leading up to the election (September 1st to November 4th), which tracks the legal definition of ”electioneering communications,” by advertisers who spent at least hundred thousand dollars. Our final dataset consisted of 749,556 ads created by 803 advertisers, and we collected it in November 2020. This represented approximately 65 % of political ads in the specified period. Facebook also enforced a ban for placing political ads during the week before the Elections (Kovach, 2020), and indeed we did not locate any new ads in our collected sample for the specific period.
To detect ads Facebook moderated, we crawled the ads in our dataset to locate on which Facebook placed a flag that specific that they were removed. In total, we located the removal of 8635 ads from 253 advertisers on the platform.
For the ads in our collection that were in the form of image or video, we transformed them to text using the Google Cloud Vision and Speech-to-Text APIs, to make them available for further statistical processing. Next, we queried the Federal Election Commission (FEC) database (Commision, 2022), to investigate how many advertisers were registered as political entities. We also matched advertisers with their corresponding records in the political tracking website FollowTheMoney (OpenSecrets, 2022), which classify them as Political Action Committees (PACs), Authorized Campaign Committees, NGOs, State related entities, Corporation or Labor entities, or other entities. Based on the information of the platform, we also categorized advertisers in respect to the content they created, i.e. whether they promoted a specific ideology or single issue, whether they were promoting civil rights, they were general advertising agencies, they created policy related content, they created candidate or party related content, they were selling merchandise, promoting the issues of government and state agencies, or they were asking individuals to perform civic service (e.g. working in election administration).
B.2. Google & YouTube
Google’s ad archive contains information about political ads placed through the Google ad services. This includes ads that appeared in the google search engine, on third party websites that use the services, and on YouTube. The archive provides information about the content of an ad, a lower and upper number of generated impressions and cost, as well as which user groups in terms of age, gender, and location were targeted by the advertiser. Like with Facebook, we crawled the ad archive and collected all political ads placed in the 2 months prior to the election (September 1st to November 4th) by advertisers who spent again at least hundred thousand dollars. The final dataset contains 117,607 ads from 490 advertisers, which represents 83% of political ads placed during this period.
Unlike Facebook, Google removes ads that violate its terms & conditions, leaving only its meta-data visible in the archive. To locate the content of ads that were removed, we systematically crawled the archive between September and November 2020, and once in January 2021. By comparing the crawls we located 9735 Ads that were moderated by Google. Similarly, we located 451 Ads that were also moderated, but we were not able to uncover their exact content, since they were removed prior to us collecting their original content. We transformed all ads that were in the form of images and all YouTube videos into text using the Google Cloud Vision and Speech-to-Text APIs, to make them available for further statistical processing. For the advertisers present in the dataset, we followed the same classification process as for Facebook, searching for their presence in the FEC database, and coding their type and advertising content.
B.3. TikTok
Formally, TikTok does not allow the placement of political ads. But we observed influencers engaged in political campaigning, who formed so-called HypeHouses. HypeHouses are TikTok accounts managed by coalitions of political influencers, generating content supporting specific candidates.
We started with a list of known influencers and HypeHouses (Lorenz, 2020) and by snowballing we collected other popular accounts that interacted with them. This resulted in a final list of 40 Democratic and 56 Republican HypeHouses and political influencers. We then crawled the HypeHouse videos between September 1st and October 15th. We had wanted to collect data through November 4th, but our access to crawl the platform was restricted, as the platform changed its internal API structure. (Appendix, table 5). Next, we created a list of political hashtags (Appendix, table 6) that included candidates’ names, election related issues such as mail-in ballots, and general political issues such as abortion or gun laws. We searched for videos containing these hashtags. Because our TikTok crawl returns only trending content and not all videos related to a hashtag, we identified video creators of the returned content and collected all of their videos for the same period as above. Our final dataset contained 2,690,923 videos from more than 61,000 TikTok creators. For each creator, we obtained information such as their account description, number of followers, and general popularity. For each video, we collected information about how many times they were viewed, liked, and shared, as well as their description. For the HypeHouses, we reviewed the profiles to manually categorize them based on whether they reported links to following entities: PACs, NGOs, politicians, media outlets and whether they were selling merchandise, or were asking for donations. For the purpose of evaluating its moderation practices, we relied on TikTok returning information about whether a video was an ad or was assigned a flag, such as being related to the US elections.
Appendix C Figures
| Influencers | ||||||||||||||||||||||||
| Republican | Democratic | |||||||||||||||||||||||
|
|
|||||||||||||||||||||||
| Hashtags | |||||
|
| Top Non FEC registered advertisers | ||||||
|---|---|---|---|---|---|---|
| Spent($) | Spent($) | |||||
| YES ON 22 - SAVE APP-BASED JOBS & SERVICES | 7,122,400 | Yes on Prop 22 | 5,382,534 | |||
| CONSERVATIVE BUZZ LLC | 5,849,400 | 5,000,000 | ||||
| SAHAK NALBANDYAN | 3,254,100 | No On Proposition 23 | 4,302,798 | |||
|
3,221,900 | When We All Vote | 4,014,869 | |||
| THERESA GREENFIELD FOR IOWA, INC. | 3,193,900 | U.S. Census Bureau | 3,658,788 | |||
| NEWSMAX MEDIA INC | 2,716,300 | Democratic Governors Association (DGA) | 2,884,356 | |||
| EPOCH USA INC. | 2,154,300 | Voto Latino | 2,670,929 | |||
| ALLIANCE FOR A BETTER MINNESOTA ACTION FUND | 1,229,800 | Stop the Illinois Tax Hike Amendment | 2,378,970 | |||
|
1,181,900 | The Collective PAC | 2,121,249 | |||
| JUDICIAL WATCH INC | 1,140,700 | One North Carolina | 2,033,109 | |||
| Platform | % removed | reach | Advertisers | ||
|---|---|---|---|---|---|
| 13.3% |
|
256 (18%) | |||
| YouTube | 4.5% |
|
307 (22%) | ||
| 1.2% | 200 million | 253 (30%) |
| Label | Counts |
| Get info on the U.S. elections | 243,440 |
| Learn the facts about COVID-19 | 2,341 |
| The action in this video could result in serious injury. | 30 |
| Variable | Estimator | St. Error |
|---|---|---|
| $100-$1k | ||
| $1k-$50k | ||
| $50k-$100k | ||
| $100k | ||
| Google Network | ||
| YouTube | ||
| Male | ||
| Female | ||
| Age 18-24 | ||
| Age 25-34 | ||
| Age 45-54 | ||
| Age 55+ | ||
| Zip code | ||
| County | ||
| USA | ||
| region not targeted | ||
| Trump over Biden | ||
| 10k—10k-100k | ||
| 10k-100k—100k-1M | ||
| 100k-1M—1M-10M | ||
| 1M-10M— 10M | ||
| AIC | ||
| BIC | ||
| Log Likelihood | ||
| Deviance | ||
| Num. obs. | ||
| ; ; | ||
| Variable | Estimator | St. Error | Variable | Estimator | St. Error | ||
|---|---|---|---|---|---|---|---|
| AL | AK | ||||||
| AZ | AR | ||||||
| CA | CO | ||||||
| CT | DE | ||||||
| FL | GA | ||||||
| ID | IL | ||||||
| IN | IA | ||||||
| KS | KY | ||||||
| LA | ME | ||||||
| MD | MA | ||||||
| MI | MN | ||||||
| MS | MO | ||||||
| MT | NE | ||||||
| NV | NH | ||||||
| NJ | NM | ||||||
| NY | NC | ||||||
| ND | OH | ||||||
| OK | OR | ||||||
| PA | RI | ||||||
| SC | SD | ||||||
| TN | TX | ||||||
| UT | VT | ||||||
| VA | WA | ||||||
| WV | WI | ||||||
| WY | DC | ||||||
| Male 18-24 | Male 25-34 | ||||||
| Male 35-44 | Male 45-54 | ||||||
| Male 55-64 | Male 65+ | ||||||
| Female 18-24 | Female 25-34 | ||||||
| Female 35-44 | Female 45-54 | ||||||
| Female 55-64 | Female 65+ | ||||||
| Ad delivery start time | Biden Campaign | ||||||
| Trump Campaign | |||||||
| ; ; | |||||||
| coef | std err | z | Pz | [0.025 | 0.975] | |
|---|---|---|---|---|---|---|
| video likes (by 100k) | -0.1177 | 0.031 | -3.738 | 0.000 | -0.179 | -0.056 |
| video shares (by 100k) | 3.5197 | 0.278 | 12.669 | 0.000 | 2.975 | 4.064 |
| video comments (by 100k) | 1.3187 | 0.237 | 5.566 | 0.000 | 0.854 | 1.783 |
| playCount (by 100k) | -0.0431 | 0.006 | -7.270 | 0.000 | -0.055 | -0.032 |
| author likes (by 100k) | -0.6334 | 0.019 | -33.465 | 0.000 | -0.671 | -0.596 |
| #biden | 5.6269 | 0.010 | 555.612 | 0.000 | 5.607 | 5.647 |
| #trump | 5.8192 | 0.018 | 319.928 | 0.000 | 5.784 | 5.855 |
| #vote | 5.5635 | 0.018 | 312.633 | 0.000 | 5.529 | 5.598 |
| #blm | 0.6550 | 0.028 | 23.246 | 0.000 | 0.600 | 0.710 |
| #abortion | 1.3162 | 0.087 | 15.117 | 0.000 | 1.146 | 1.487 |
| #gun | 0.6233 | 0.068 | 9.172 | 0.000 | 0.490 | 0.756 |
| const | -4.5996 | 0.008 | -570.047 | 0.000 | -4.615 | -4.584 |