No Evolution in the Half-mass Radius of Milky Way-type Galaxies over the Last 10 Gyr
Abstract
The Milky Way (MW) galaxy is in focus, thanks to new observational data. Here we shed new light on the MW’s past by studying the structural evolution of MW progenitors, which we identify from extragalactic surveys. Specifically, we constrain the stellar-mass growth history (SMGH) of the MW with two methods: () direct measurement of the MW’s star formation history, and () assuming the MW is a typical star-forming galaxy that remains on the star-forming main sequence. We select MW progenitors based on these two SMGHs at from the CANDELS/3D-HST data. We estimate the structural parameters (including half-mass radius and Sérsicindex) from the stellar-mass profiles. Our key finding is that the progenitors of the MW galaxy grow self-similarly on spatially resolved scales with roughly a constant half-mass radius ( kpc) over the past 10 Gyr, while their stellar masses increase by about 1 dex, implying little-to-no inside-out growth. We discover that the radius containing of the stellar mass () decreases by between redshifts of and , while the central stellar-mass density () increases by a factor of 1.3 dex over the same time and the Sérsicindex changes as . This is consistent with an early () formation of a thick disk, followed by the formation of a bar that led to an increase in the mass in the core. The formation and evolution of the thin disk had only little impact on the overall half-mass size. We also show that the constant-size evolution of the MW progenitors challenges semiempirical approaches and numerical simulations.
June 17, 2022
1 Introduction
Understanding the assembly history of the Milky Way (MW) galaxy is of great interest because we live within it and because the MW—as a typical disk galaxy—provides a unique probe of galaxy evolution. Thanks to invaluable data from Gaia (Gaia Collaboration et al., 2018) and other surveys (e.g., Conroy et al., 2019), recent studies allowed us to put better constraints on the stellar-mass growth history (SMGH) of the MW and produced a picture in which most of the MW stellar mass is assembled in situ over the last 8–11 Gyr (e.g., Belokurov et al., 2018; Helmi et al., 2018; Bonaca et al., 2020; Kruijssen et al., 2020). In this work, we connect these recent insights to extragalactic studies to shed new light on the structural evolution of the MW and disk galaxies in general.
Observationally, it remains challenging to understand how individual galaxies assemble and evolve about scaling relations (e.g., Abramson et al., 2016; Tacchella et al., 2016). In particular, regarding the structural evolution of galaxies, recent observational studies compared the structural parameters of galaxies at a fixed stellar mass over time (e.g., van der Wel et al., 2014; Mowla et al., 2019). However, the evolution of galaxies should be traced by linking progenitors and descendants through cosmic time (e.g., Carollo et al., 2013).
Several different approaches have been used to select progenitors. One such approach is the constant cumulative number density method, which assumes that the galaxies have a fixed comoving number density and rank order at all epochs, thereby ignoring mergers and variations in star formation (van Dokkum et al., 2013). Variations in the SMGH can partially be addressed by abundance matching, which leads to an evolving cumulative number density to compare galaxies across cosmic time (Behroozi et al., 2013; Moster et al., 2013; Papovich et al., 2015; Torrey et al., 2015). In this method, observed galaxies are matched to dark matter halos for which the number density evolution can be tracked through simulations. In a third method, as in situ star formation dominates the mass assembly of star-forming galaxies (SFGs), one can trace the SMGH of SFGs from the observed star formation history (SFH) (Renzini, 2009; Leitner & Kravtsov, 2011; Patel et al., 2013). Because we focus on the MW for which we have good knowledge of the SMGH over the last Gyr and evidence for mostly in situ star formation (e.g., Kruijssen et al., 2019; Bonaca et al., 2020), we adopt this last method in this work.
Concerning the morphology of galaxies, several recent studies have shown that considering the effect of mass-to-light () gradients and hence analyzing the stellar-mass profiles instead of their light profiles is essential to better constrain the structural evolution of galaxies (Tacchella et al., 2015b; Mosleh et al., 2017, 2020; Suess et al., 2019a, b). Moreover, different size definitions can be used to depict changes in subcomponents of galaxies (Cibinel et al., 2013; Miller et al., 2019). Therefore, in this study, we carefully select MW progenitors and use the mass-based structural parameters to revisit the buildup of the MW stellar-mass profile (Section 2). We find negligible evolution in the half-mass size of MW-type galaxies over the past 10 Gyr (Section 3), implying little-to-no inside-out growth of such disk galaxies (Section 4). We show that this is largely independent of the assumed SMGH as the half-mass size versus stellar-mass relation is flat and nearly redshift invariant.
2 Data and Sample Selection
2.1 Observational Data
We aim at selecting star-forming progenitors of MW-type galaxies with a total stellar mass of in the present-day universe (McMillan, 2017). We use the CANDELS/3D-HST catalogs (Skelton et al., 2014) to identify those progenitors at earlier cosmic times. We cross-matched this sample with the Mosleh et al. (2020) catalog, which provides stellar-mass profiles and mass-based structural parameters for 5557 galaxies. These have been obtained by producing the stellar-mass maps from the Hubble Space Telescope (HST) imaging data and applying the pixel-by-pixel spectral energy distribution fitting technique. The reliability of the technique has been examined in Mosleh et al. (2020) using simulated galaxies, and it has been shown that the measured parameters are robust and the sample is complete for galaxies with at .
2.2 Stellar Mass Growth History (SMGH)
To select the MW progenitors, we derive the SMGHs in two different ways: () using the main-sequence integration (MSI) method developed by Renzini (2009); Leitner & Kravtsov (2011) to follow SFGs on the star-forming main sequence (referred to as MW-type SMGH) and () adopting the inferred SFH of MW studies (referred to as MW SMGH).
In the first approach (MW-type SMGH), the basic assumption is that present-day SFGs (including the MW) have assembled most of their stellar masses steadily and smoothly by in situ star formation. Thus, the star formation rate (SFR) of MW-type progenitors must fall within the scatter of the observed star-forming main sequence ( relation). The SMGH can then be iteratively calculated by obtaining the SFR from the evolving relation and taking into account stellar-mass loss. In this work, we apply the relation of (Speagle et al., 2014, hereafter Sp14) and that the final () stellar mass of the MW is (McMillan, 2017).
In the second approach (MW SMGH), we employ the SFH estimates of MW studies to determine its SMGH directly. In this work, we use the SFH of Snaith et al. (2015, hereafter Sn15) which is obtained from fitting the solar vicinity relation to a chemical evolution model. The SMGH derived by this SFH is in good agreement with the MW mass assembly history presented by Kruijssen et al. (2019).
To compare our observational results with numerical simulation, we select MW-like galaxies from the IllustrisTNG (TNG50) simulation (Nelson et al., 2019; Pillepich et al., 2019) in the following way at (see Park et al., 2021, for the definition of those quantities):
-
•
Stellar mass ( kpc): ;
-
•
Disk-to-total ratio: ;
-
•
.
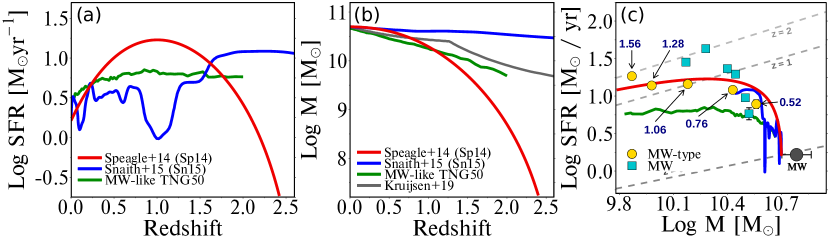
Figure 1 shows in panel (a) and panel (b) the SFH and SMGH of MW-type galaxies inferred from the MSI method with the relation of Sp14 (red lines) of the MW galaxy from Sn15 (blue lines) and of MW-like galaxies from the TNG50 simulation (green lines). The SMGH from the MW indicates an earlier formation (consistent with Kruijssen et al. 2019) than the one from the MSI method. Figure 1(c) shows the evolution of the SFR and . The large gray circle is the MW mass and SFR estimated by Licquia & Newman (2015), highlighting that our SMGHs are consistent with this estimate.
2.3 Selection of Progenitors
We select the MW progenitors at a given redshift to be all SFGs with a stellar mass consistent within dex of the MW and MW-type SMGHs inferred above. SFGs are defined by their location in the rest-frame UVJ color diagram with the boundaries given in Mosleh et al. (2017). In order to reduce the uncertainties, we exclude galaxies with unreliable structural parameters (see Mosleh et al., 2020, for more details). A total of 1250 and 721 objects are identified as possible MW-type and MW progenitors up to and , respectively. In Figure 1(c), the yellow circles and cyan squares show the median of the integrated UV+IR SFRs from Whitaker et al. (2014) for the MW-type and MW progenitors, respectively. The yellow circles are different from the solid red line because the UVJ-selected SFGs do not exactly reproduce the relation of Sp14. The cyan squares differ from the blue line because the UVJ-selected SFGs have typically higher SFRs than the MW at fixed stellar mass and redshift.
3 Results
3.1 Size Evolution
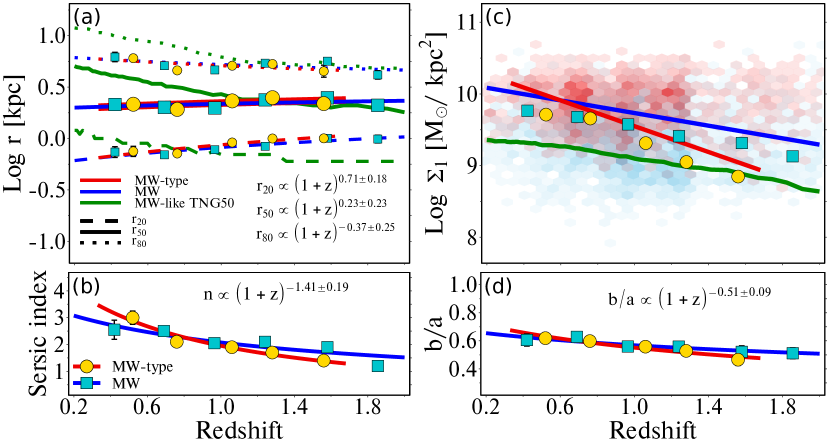
Figure 2(a) shows the size growth of the MW-type progenitors (yellow symbols) and the MW progenitors (cyan symbols). We focus on the stellar-mass-based radii that enclose 20% (), 50% (), and 80% () of the total stellar mass. We fit a power law of the form to the median values to quantify the rate of size evolution.
Focusing on the evolution of MW-type galaxies (red lines and yellow circles), the half-mass sizes () of the progenitors remain almost constant within the redshift range of this study. The rate of size growth is also shallow (). By contrast, the size decreases with a rate of . Similar results are obtained if we focus on the MW progenitors (blue lines and cyan squares). In contrast, the sizes of MW-like galaxies from TNG50 (green lines) increase significantly with cosmic time, particularly below .
The slow rate of the half-mass size evolution for SFGs has already been alluded to by previous studies that performed the analysis at fixed masses (e.g., Mosleh et al., 2020; Suess et al., 2019a). However, tracing progenitors makes this even more apparent. This might be caused by the simultaneous buildup of stellar mass in the core and the outskirts at large radii over time. This self-similar growth of the stellar-mass profile is consistent with a flat radial specific SFR profile, as observed at intermediate redshifts (e.g., Tacchella et al., 2015a, 2018; Nelson et al., 2016; Morselli et al., 2019).
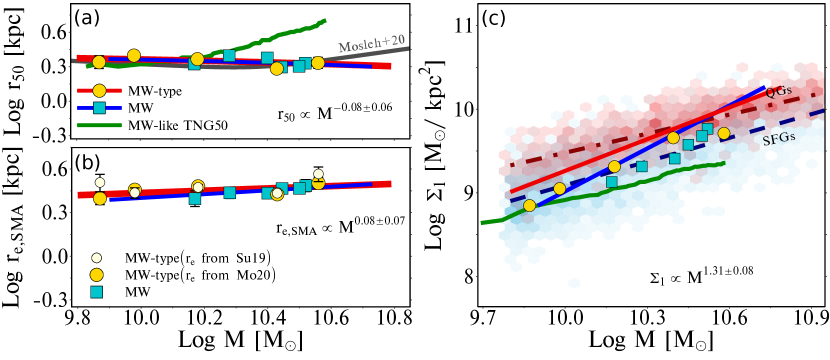
This pattern of self-similar growth can also be seen directly in Figure 3(a), where we plot the plane. The MW and MW-type progenitors increase their stellar mass by nearly 1 dex, while their size remains constant ( with ). Their evolution tracks well with the relation ofMosleh et al. (2020) for SFGs at , which is not too surprising because this relation does not evolve strongly with cosmic time.
To check whether our results depend on the exact size definition (above, we have used circularized half-mass sizes) and methodology, we plot in Figure 3(b) the half-mass radius of the semimajor axis from this work and Suess et al. (2019a). Adopting instead of leads to a weak trend in the opposite direction, i.e., weakly increases with mass and time (), but it is still consistent with being constant. This is expected because the axis ratio increases with cosmic time for MW and MW-type progenitors (Figure 2(d)). Adopting the size measurements of Suess et al. (2019a) instead of the ones of Mosleh et al. (2020) leads to negligible changes. We conclude that our key result of negligible size growth of MW and MW-type progenitors is robust.
3.2 Growth of Central Densities
The buildup of the central density can be directly linked to an increase of the Sérsicindex () and the stellar-mass surface density within 1 kpc (). Panels (b) and (c) of Figure 2 show the redshift evolution of the Sérsicindex and for the MW-type (yellow circles) and MW progenitors (cyan squares).
We find that both the MW and MW-type progenitors increased and with cosmic time, with the trend being shallower for the MW than the MW-type progenitors. For the Sérsicindex , we find and for the MW-type and MW progenitors, respectively. Furthermore, MW-type progenitors increase by nearly one order of magnitude from to , while a shallower evolution is found at lower redshifts, independent of the parametric or nonparametric estimation. This is consistent with the increase in and the decrease of , pointing to a significant buildup of mass in the core, reaching values of that are consistent with quiescent galaxies (QGs). Interestingly, reaches a value of only by , compatible with a pseudo-like bulge or a thick disk rather than a classical bulge component. We caution that the results are based on a single Sérsicmodel. The MW-like progenitors of the TNG50 simulation (green line in Figure 2(c)) show a shallower evolution in than one of the MW-type progenitors but are roughly consistent with the MW progenitors.
The track of progenitors in the –mass plane is illustrated in Figure 3(c). Compared with the general relation of SFGs (dashed navy line), the MW-type and MW progenitors trace steeper relations as indicated by the red () and blue () lines, respectively. For comparison, the SFGs and QGs have slopes of and , respectively, in agreement with Barro et al. (2017).
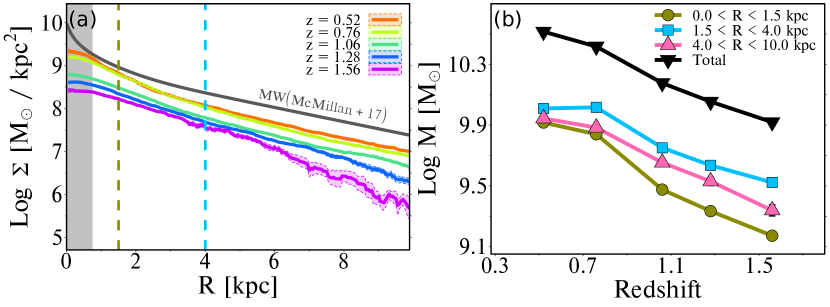
Finally, for the MW-type progenitors, we tested whether the profile change is self-similar at all redshifts by comparing the shape of their median mass profiles (Figure 4). As a comparison, we used the MW mass profile from McMillan (2017), noting that they assumed a spatially constant . Figure 4(a) shows that the shape and slope of the profiles mostly remain the same with time, though there is some change in the central regions ( kpc) at later times. The growth of stellar mass within different apertures is shown in panel (b). The MW-type progenitors grow largely self-similarly, though there is a phase of accelerated core growth between and . At late times (), there seems to be more growth beyond 10 kpc than within.
4 Discussion & Conclusions
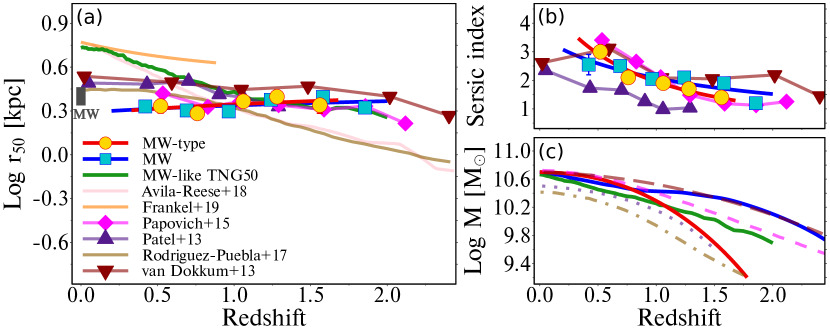
Our key result, which is summarized and compared with other observational (Patel et al., 2013; van Dokkum et al., 2013; Papovich et al., 2015), theoretical (Rodríguez-Puebla et al., 2017; Frankel et al., 2019), and simulated (Avila-Reese et al., 2018) studies in Figure 5, is that the progenitors of the MW galaxy grow self-similarly and have roughly a constant half-mass radius over the past 10 Gyr, while their stellar mass increases by about 1 dex. This holds while adopting two rather different SMGHs: one obtained via the MSI method (MW type; red lines) and one measured directly from the MW (MW; blue lines).
Patel et al. (2013), also using the MSI method, find a weak increase in at the late cosmic time, while the increase in their Sérsicindex is weaker and with a lower normalization than our estimate. Adopting the relation of their work, we find our results still hold. We therefore attribute these differences to the increasing importance of the gradient at late times (e.g., Mosleh et al., 2017; Suess et al., 2019b). van Dokkum et al. (2013) and Papovich et al. (2015) adopt different selection techniques to identify MW progenitors (constant comoving number density and abundance matching, and they both include QGs), which lead to shallower SMGHs than those estimated by the MSI method (Figure 5(c)). Their inferred size growth shows a slow rate of evolution, similar to our study, despite using half-light radii. They also find that bulges have already been built by (Figure 5(b)).
Rodríguez-Puebla et al. (2017) adopt a semiempirical approach for connecting galaxies to their host halos. The SMGH for the final halo mass of of the MW shows a similar trend to this work (Figure 5(c)). However, the inferred size evolution, which assumes that the sizes scale as , predicts a steeper trend, particularly at . Moreover, Frankel et al. (2019) estimate the half-mass size evolution of the MWs low- disk ( kpc) by fitting a global model to the ages, metallicities, and radii of APOGEE red clump stars and find a size growth of , which is in line with our size growth, but significantly larger than our estimates. We also find that the size evolution of MW-like galaxies in the TNG50 simulation (green line in Figure 5) is consistent with our results at early times but shows a strong increase in more recent times (), which is contrary to our findings. This rapid increase in size is similar to that driven by Avila-Reese et al. (2018), who simulated the evolution of eight zoomed-in hydrodynamical MW-sized galaxies. As seen in Figure 5(a), grows relatively faster than in any observational study.
A concern of our analysis is the assumption that mergers play no significant role in the buildup of the stellar mass of the MW. Kruijssen et al. (2020) and Naidu et al. (2021) estimate that the most massive mergers of the MW contributed a total stellar mass of , suggesting that the MW formed mainly by in situ star formation. Therefore, we conclude that mergers did not significantly affect the mass assembly of the MW progenitor, at least for the redshift range of this study.
Our analysis also has important consequences regarding the angular momentum history of galactic disks (such as the MW). The angular momentum of a galaxy is
| (1) |
where is the rotational velocity, which increased from to today for MW-type galaxies by a factor of (Simons et al., 2017). As discussed above, the stellar mass of the MW increased by a factor of 5–10 from to today, while the half-mass size remains constant. Putting this all together, we find that the angular moment of MW-like disks increased over the past 10 Gyr by a factor of . This estimate is consistent with canonical dark matter theory (Peebles, 1969; Danovich et al., 2015; Dutton & van den Bosch, 2012) and not as extreme as recently claimed by Peng & Renzini (2020) and Renzini (2020), who have used observational scaling relations and inferred an increase by a factor of . In the future, direct estimates of the angular momentum history of the MW will provide important constraints on the vorticity of the accreted gas and accretion history of satellite galaxies.
From the MW perspective, these results seem to be in accordance with the early () formation of the thick disk, followed by a decrease in the SFR and a formation of a bar (Haywood et al., 2018; Bovy et al., 2019). This bar redistributed the stellar mass of the thick disk, thereby increasing the mass surface density in the core. This is consistent with our inferred increase of the Sérsic index and central stellar-mass density at . Moreover, the mild growth of our half-mass size, in particular of , is compatible with the slow thin-disk formation over the last Gyr (Conroy et al., 2022).
As shown here, connecting detailed studies of the MW galaxy with extragalactic studies of MW-like galaxies is fruitful. Upcoming telescopes (including the James Webb and the Roman Space Telescopes) will probe MW-like galaxies to higher redshifts and with better spatial resolution, allowing us to constrain the cosmic evolution of the thickness of disks and the occurrence of bars.
We thank the anonymous referee for the suggestions that helped improve the manuscript. We are also grateful to Alvio Renzini for insightful comments.
References
- Abramson et al. (2016) Abramson, L. E., Gladders, M. D., Dressler, A., et al. 2016, ApJ, 832, 7. doi:10.3847/0004-637X/832/1/7
- Avila-Reese et al. (2018) Avila-Reese, V., González-Samaniego, A., Colín, P., et al. 2018, ApJ, 854, 152. doi:10.3847/1538-4357/aaab69
- Barro et al. (2017) Barro, G., Faber, S. M., Koo, D. C., et al. 2017, ApJ, 840, 47. doi:10.3847/1538-4357/aa6b05
- Behroozi et al. (2013) Behroozi, P. S., Marchesini, D., Wechsler, R. H., et al. 2013, ApJ, 777, L10. doi:10.1088/2041-8205/777/1/L10
- Belokurov et al. (2018) Belokurov, V., Erkal, D., Evans, N. W., et al. 2018, MNRAS, 478, 611. doi:10.1093/mnras/sty982
- Bonaca et al. (2020) Bonaca, A., Conroy, C., Cargile, P. A., et al. 2020, ApJ, 897, L18. doi:10.3847/2041-8213/ab9caa
- Bovy et al. (2019) Bovy, J., Leung, H. W., Hunt, J. A. S., et al. 2019, MNRAS, 490, 4740. doi:10.1093/mnras/stz2891
- Carollo et al. (2013) Carollo, C. M., Bschorr, T. J., Renzini, A., et al. 2013, ApJ, 773, 112. doi:10.1088/0004-637X/773/2/112
- Cibinel et al. (2013) Cibinel, A., Carollo, C. M., Lilly, S. J., et al. 2013, ApJ, 776, 72. doi:10.1088/0004-637X/776/2/72
- Conroy et al. (2019) Conroy, C., Bonaca, A., Cargile, P., et al. 2019, ApJ, 883, 107. doi:10.3847/1538-4357/ab38b8
- Conroy et al. (2022) Conroy, C., Weinberg, D. H., Naidu, R. P., et al. 2022, arXiv:2204.02989
- Danovich et al. (2015) Danovich, M., Dekel, A., Hahn, O., et al. 2015, MNRAS, 449, 2087. doi:10.1093/mnras/stv270
- Dutton & van den Bosch (2012) Dutton, A. A. & van den Bosch, F. C. 2012, MNRAS, 421, 608. doi:10.1111/j.1365-2966.2011.20339.x
- Frankel et al. (2019) Frankel, N., Sanders, J., Rix, H.-W., et al. 2019, ApJ, 884, 99. doi:10.3847/1538-4357/ab4254
- Gaia Collaboration et al. (2018) Gaia Collaboration, Brown, A. G. A., Vallenari, A., et al. 2018, A&A, 616, A1. doi:10.1051/0004-6361/201833051
- Haywood et al. (2018) Haywood, M., Di Matteo, P., Lehnert, M., et al. 2018, A&A, 618, A78. doi:10.1051/0004-6361/201731363
- Helmi et al. (2018) Helmi, A., Babusiaux, C., Koppelman, H. H., et al. 2018, Nature, 563, 85. doi:10.1038/s41586-018-0625-x
- Kruijssen et al. (2020) Kruijssen, J. M. D., Pfeffer, J. L., Chevance, M., et al. 2020, MNRAS, 498, 2472. doi:10.1093/mnras/staa2452
- Kruijssen et al. (2019) Kruijssen, J. M. D., Pfeffer, J. L., Reina-Campos, M., et al. 2019, MNRAS, 486, 3180. doi:10.1093/mnras/sty1609
- Leitner & Kravtsov (2011) Leitner, S. N. & Kravtsov, A. V. 2011, ApJ, 734, 48. doi:10.1088/0004-637X/734/1/48
- Licquia & Newman (2015) Licquia, T. C. & Newman, J. A. 2015, ApJ, 806, 96. doi:10.1088/0004-637X/806/1/96
- McMillan (2017) McMillan, P. J. 2017, MNRAS, 465, 76. doi:10.1093/mnras/stw2759
- Miller et al. (2019) Miller, T. B., van Dokkum, P., Mowla, L., et al. 2019, ApJ, 872, L14. doi:10.3847/2041-8213/ab0380
- Morselli et al. (2019) Morselli, L., Popesso, P., Cibinel, A., et al. 2019, A&A, 626, A61. doi:10.1051/0004-6361/201834559
- Mosleh et al. (2020) Mosleh, M., Hosseinnejad, S., Hosseini-ShahiSavandi, S. Z., et al. 2020, ApJ, 905, 170. doi:10.3847/1538-4357/abc7cc
- Mosleh et al. (2017) Mosleh, M., Tacchella, S., Renzini, A., et al. 2017, ApJ, 837, 2. doi:10.3847/1538-4357/aa5f14
- Moster et al. (2013) Moster, B. P., Naab, T., & White, S. D. M. 2013, MNRAS, 428, 3121. doi:10.1093/mnras/sts261
- Mowla et al. (2019) Mowla, L. A., van Dokkum, P., Brammer, G. B., et al. 2019, ApJ, 880, 57. doi:10.3847/1538-4357/ab290a
- Naidu et al. (2021) Naidu, R. P., Conroy, C., Bonaca, A., et al. 2021, ApJ, 923, 92. doi:10.3847/1538-4357/ac2d2d
- Nelson et al. (2019) Nelson, D., Pillepich, A., Springel, V., et al. 2019, MNRAS, 490, 3234. doi:10.1093/mnras/stz2306
- Nelson et al. (2016) Nelson, E. J., van Dokkum, P. G., Förster Schreiber, N. M., et al. 2016, ApJ, 828, 27. doi:10.3847/0004-637X/828/1/27
- Papovich et al. (2015) Papovich, C., Labbé, I., Quadri, R., et al. 2015, ApJ, 803, 26. doi:10.1088/0004-637X/803/1/26
- Park et al. (2021) Park, M., Tacchella, S., Nelson, E. J., et al. 2021, arXiv:2112.07679
- Patel et al. (2013) Patel, S. G., Fumagalli, M., Franx, M., et al. 2013, ApJ, 778, 115. doi:10.1088/0004-637X/778/2/115
- Peebles (1969) Peebles, P. J. E. 1969, ApJ, 155, 393. doi:10.1086/149876
- Peng & Renzini (2020) Peng, Y.-. jie . & Renzini, A. 2020, MNRAS, 491, L51. doi:10.1093/mnrasl/slz163
- Pillepich et al. (2019) Pillepich, A., Nelson, D., Springel, V., et al. 2019, MNRAS, 490, 3196. doi:10.1093/mnras/stz2338
- Renzini (2020) Renzini, A. 2020, MNRAS, 495, L42. doi:10.1093/mnrasl/slaa054
- Renzini (2009) Renzini, A. 2009, MNRAS, 398, L58. doi:10.1111/j.1745-3933.2009.00710.x
- Rodríguez-Puebla et al. (2017) Rodríguez-Puebla, A., Primack, J. R., Avila-Reese, V., et al. 2017, MNRAS, 470, 651. doi:10.1093/mnras/stx1172
- Simons et al. (2017) Simons, R. C., Kassin, S. A., Weiner, B. J., et al. 2017, ApJ, 843, 46. doi:10.3847/1538-4357/aa740c
- Skelton et al. (2014) Skelton, R. E., Whitaker, K. E., Momcheva, I. G., et al. 2014, ApJS, 214, 24. doi:10.1088/0067-0049/214/2/24
- Snaith et al. (2015) Snaith, O., Haywood, M., Di Matteo, P., et al. 2015, A&A, 578, A87. doi:10.1051/0004-6361/201424281
- Speagle et al. (2014) Speagle, J. S., Steinhardt, C. L., Capak, P. L., et al. 2014, ApJS, 214, 15. doi:10.1088/0067-0049/214/2/15
- Suess et al. (2019a) Suess, K. A., Kriek, M., Price, S. H., et al. 2019, ApJ, 877, 103. doi:10.3847/1538-4357/ab1bda
- Suess et al. (2019b) Suess, K. A., Kriek, M., Price, S. H., et al. 2019, ApJ, 885, L22. doi:10.3847/2041-8213/ab4db3
- Tacchella et al. (2018) Tacchella, S., Carollo, C. M., Förster Schreiber, N. M., et al. 2018, ApJ, 859, 56. doi:10.3847/1538-4357/aabf8b
- Tacchella et al. (2015a) Tacchella, S., Carollo, C. M., Renzini, A., et al. 2015, Science, 348, 314. doi:10.1126/science.1261094
- Tacchella et al. (2016) Tacchella, S., Dekel, A., Carollo, C. M., et al. 2016, MNRAS, 457, 2790. doi:10.1093/mnras/stw131
- Tacchella et al. (2015b) Tacchella, S., Lang, P., Carollo, C. M., et al. 2015, ApJ, 802, 101. doi:10.1088/0004-637X/802/2/101
- Torrey et al. (2015) Torrey, P., Wellons, S., Machado, F., et al. 2015, MNRAS, 454, 2770. doi:10.1093/mnras/stv1986
- van der Wel et al. (2014) van der Wel, A., Franx, M., van Dokkum, P. G., et al. 2014, ApJ, 788, 28. doi:10.1088/0004-637X/788/1/28
- van Dokkum et al. (2013) van Dokkum, P. G., Leja, J., Nelson, E. J., et al. 2013, ApJ, 771, L35. doi:10.1088/2041-8205/771/2/L35
- Whitaker et al. (2014) Whitaker, K. E., Franx, M., Leja, J., et al. 2014, ApJ, 795, 104. doi:10.1088/0004-637X/795/2/104