Extending Momentum Contrast with
Cross Similarity Consistency Regularization
Abstract
Contrastive self-supervised representation learning methods maximize the similarity between the positive pairs, and at the same time tend to minimize the similarity between the negative pairs. However, in general the interplay between the negative pairs is ignored as they do not put in place special mechanisms to treat negative pairs differently according to their specific differences and similarities. In this paper, we present Extended Momentum Contrast (XMoCo), a self-supervised representation learning method founded upon the legacy of the momentum-encoder unit proposed in the MoCo family configurations [1, 2, 3]. To this end, we introduce a cross consistency regularization loss, with which we extend the transformation consistency to dissimilar images (negative pairs). Under the cross consistency regularization rule, we argue that semantic representations associated with any pair of images (positive or negative) should preserve their cross-similarity under pretext transformations. Moreover, we further regularize the training loss by enforcing a uniform distribution of similarity over the negative pairs across a batch. The proposed regularization can easily be added to existing self-supervised learning algorithms in a plug-and-play fashion. Empirically, we report a competitive performance on the standard Imagenet-1K linear head classification benchmark. In addition, by transferring the learned representations to common downstream tasks, we show that using XMoCo with the prevalently utilized augmentations can lead to improvements in the performance of such tasks. We hope the findings of this paper serve as a motivation for researchers to take into consideration the important interplay among the negative examples in self-supervised learning.
Index Terms:
Self-supervised learning, representation learning, contrastive learning, unsupervised learning.I Introduction
The dramatic performance of deep neural networks strongly depends on the amount of training data available. Sophisticated architectures, trained with large scale datasets continue to set new state-of-the-art (SOTA) records. However, collection and annotation of large datasets are time consuming and expensive. To overcome the costly and laborious data annotation, many self-supervised/unsupervised representation learning methods have been developed to extract visual semantics of the large-scale image datasets, without the burden of labeling them [4, 5, 6, 7, 8, 9]. The semantic representations are meant to be preserving useful visual information when representing the images in a downstream task.
Self-supervised visual representation learning has received a great deal of attention in the recent years, particularly after achieving success in the field of natural language processing [10]. A popular self-supervised approach to learn the visual representations is to train a network to solve one or multiple pretext tasks on an unlabeled dataset, by introducing objective functions which are optimized through gradient descent. A variety of pretext tasks have been designed so far for self representation learning. Some early, but influential ones include: predicting image rotations [11], solving a jigsaw puzzle [12], gray scale image colorization [13], automatic image inpainting [14], spatio-temporal geometric deformations in a video sequence [15], or utilizing 2D heatmaps as a supervision signal [16].
A breakthrough in designing pretext tasks occurred by the introduction of contrastive learning [17] and infoNCE loss [18, 19], and was later improved by the introduction of the transformation consistency property [20, 21]. The authors in [20] and [21] reasoned that useful image representations must be invariant under semantics preserving image transformations/augmentations.111semantic preserving transformations are simple augmentations that do not change the visual semantics of the image, e.g. in image classification, image class label is not changed if it undergoes such transformations [22]. This observation formed the foundation of the latest generation of contrastive learning algorithms. From the standard contrastive perspective, each image in a batch has one positive peer which together they make a positive pair, and negative peers which together they make negative pairs. The main idea is to discriminate randomly transformed versions of non-identical images (negative pairs) against each other by minimizing the cosine similarity between their representations. Simultaneously, courtesy of transformation consistency, the features representing transformed versions of identical images (positive pairs) are forced to be close in terms of their normalized inner product [1, 2, 3].
The infoNCE loss incorporated in these methods in fact minimizes the cross-entropy between (a) softmax probability of matching a representation to its positive/negative peers, and (b) deterministic one-hot encoded pseudo-labels which always assign 1 to the positive peer and 0 to the negative ones. Accordingly, the infoNCE loss forces the cross similarity between the negative pairs towards zero222We use the term cross similarity for the cosine similarity between the representations associated to negative pairs, since they belong to non-identical images.. By doing so, infoNCE ignores the information concealed in the cross similarities. However, the negative pairs might be sharing visual semantics with each other. For example, there may be different instances of a same object category.
To overcome this issue, in this paper, we moderate the effect of infoNCE loss by incorporating the information concealed in the negative samples. To this end, first we propose the idea of cross similarity consistency regularization. In particular, we argue that after applying transformations333In this paper we assume that all the transformations are semantic preserving., not only the semantic representation of an image is preserved, but also its cross similarity with the representation associated to each negative peer is preserved. In other words, the representation associated to any random transformation of image A is equally similar with the representation of any random transformation of image B in the cosine similarity sense. We will later show that using this property we can regularize how the similarity score is distributed between the negative peers.
In addition, we further regularize the learning by softening the pretext pseudo-labels associated to similarities of positive and negative pairs (in the vanilla contrastive approach, this is a one-hot encoded vector). To this end, we generate pseudo-labels from data representation vectors such that in a batch of training data, the probability of examples being similar to the positive peers is encouraged to be high, while their similarity to the negative peers are equally discouraged on the average. The non-zero soft pseudo-label assignments also account for a degree of similarity that exists within the negative pairs. In other words, label smoothing allows the model to learn not only the class with highest prediction score, but also the second most likely prediction, the third, and so on, since it provides relative information across the categories. This is achieved through a constrained entropy maximization technique which we explain later in the paper. This regularization provides extra support to better learn to distinguish between the positive and negative samples, which in turn enhances the representation learning quality. Our contributions can therefore be summarized as:
-
•
We propose a cross similarity consistency regularization strategy to account for the fact that semantic preserving transformations lead to unchanged similarity between representations of negative pairs.
- •
-
•
Our results show competitive performance in the standard linear head classification benchmark on Imagenet-1K and other downstream tasks such as object detection and semantic segmentation.
II Related Works
This section briefly reviews the related works. Related to our work are in general the self-supervised learning algorithms, and in particular the contrastive approaches.
II-A Earlier self-supervised learning techniques
Initial efforts in self-supervised learning were inspired by applying tangible image operations to extract some of kind of pseudo ground truth to use for training. To this end, [11] applied a fixed set of rotations to input images and defined a task of rotation classification. They argued that this task will help the model learn generic representations of the images. [12] defined a pretext task of solving an artificially created jigsaw puzzle. [13] converted colorful images to gray scale, and designed a colorization auxiliary task. [14] used the inpainting of deliberately removed patches to learn representations. A detailed survey of such methods is available in [4]. Despite an initial success, the performance of these methods did not reach the levels achieved by contrastive-based methods proposed later. However, they paved the way for some of the strong successors as they showed there is promise in self-supervised learning.
II-B Clustering-based Approaches
Clustering methods ratiocinate that data points corresponding to representations belonging to a same cluster must share similar visual semantics. Therefore, they try to minimize the distance between the distributions of the representations generated by the network and cluster assignments of the clustering algorithm [25, 26, 24, 27, 28].
II-C Contrastive Learning
The rationale behind the contrastive methods is that different views of a same image, or different frames of the same short video sequence, must be encoded to a same representation. On the other hand, views associated to different images should delegate distant representations in the latent space. Based on this, in their loss they try to drag the representations of the views associated to a same image (positive pairs) towards each other while at the same time push away the representations associated to the views of different images (negative pairs) [17, 1, 2, 18, 20, 29, 30, 31].
II-D Siamese Networks
The Siamese approaches eliminate the necessity of incorporating negative samples in their methodology. They argue that the representations of different views of same images should be minimally distant in the representation space. Based on this criteria, they minimize the Euclidean distance between the representations associated to views of same images [23, 32].
II-E Summary
In this paper, we extend the existing contrastive learning approach with cross similarity consistency regularization. To this end, we design a contrastive formulation in which not only positive example pairs attain a similar representation, but also negative pairs are equally dis-similar across various semantic preserving transformations. Additionally, we enforce a uniform similarity distribution on the negative examples. In other words, samples across a batch are forced to be on the average, equally similar to each negative peer. These constraints enable the network to incorporate the information concealed in the negative pairs while learning the visual semantics of the dataset.
III Method
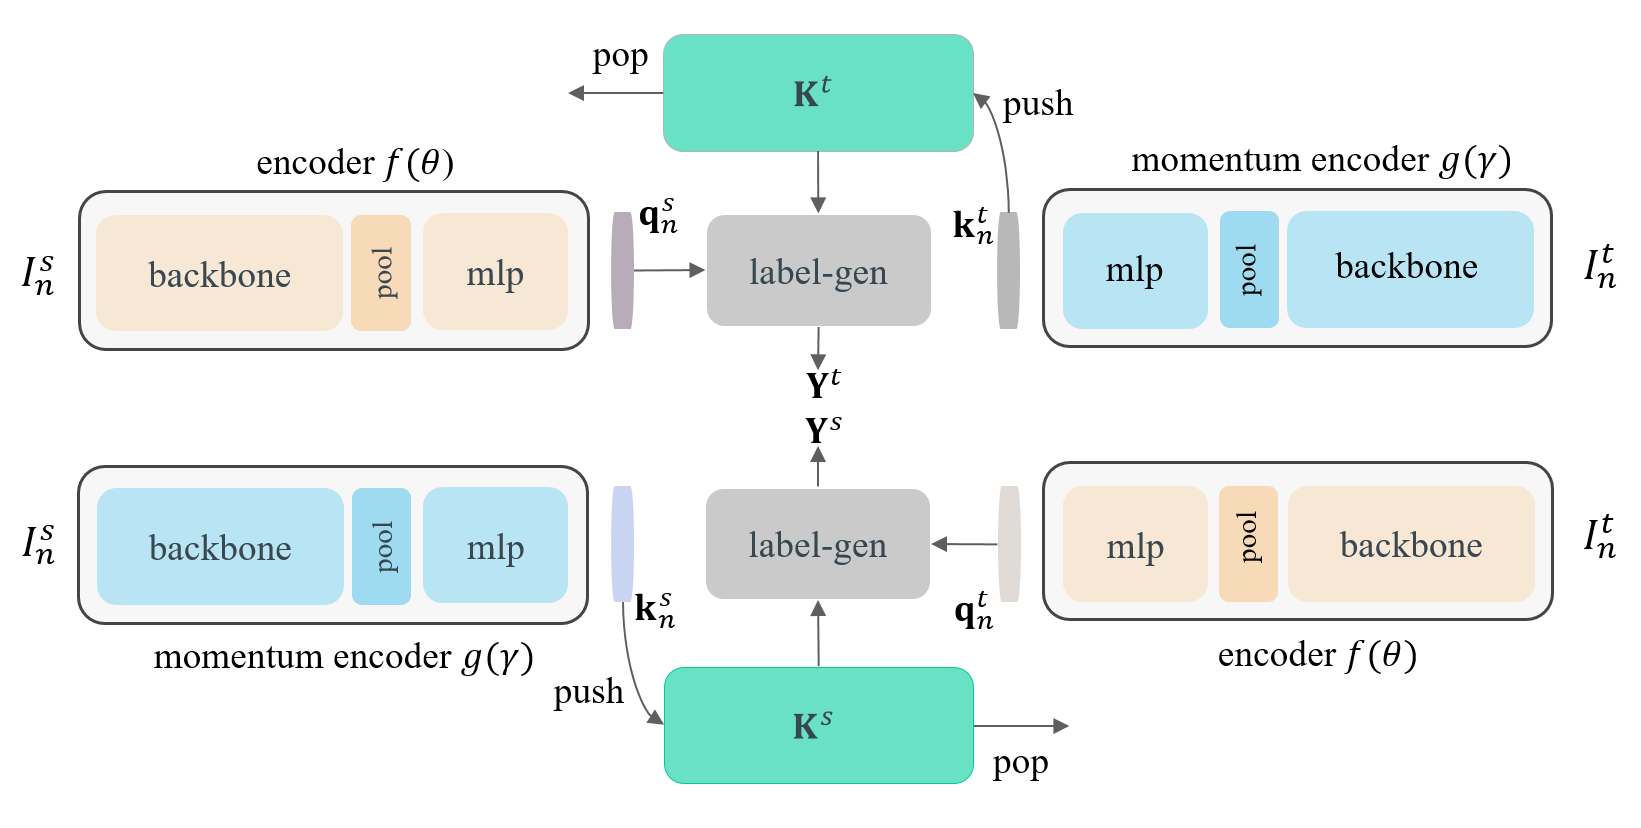
This section describes our extended momentum contrast method, dubbed as XMoCo. As a whole, Figure 1 shows the building blocks of our approach.
Representation vectors/features are obtained by passing images through feature generator networks, and pseudo-labels are created by a pair of label generator functions. The feature generators are two deep convolutional networks, encoder and momentum-encoder, the weights of which are updated by minimizing a predefined loss function.
The key system components and mechanisms can be summarized as follows:
-
1.
Each image in a batch is transformed into two versions which are called source and target views. These views are generated by passing the images through random semantic preserving transformations. Subsequently, the source and target features are the embeddings inferred by passing the their associated views through the network. For images in the batch we have total of views.
-
2.
Since the images are passed through semantic preserving transformations, their visual meaning inferred by looking at transformed image is not altered.
-
3.
For each source view there exists one, and only one, view among the target views which is co-generated from the exact same image and vice versa. These two views form a positive pair.
-
4.
For each source view there exists exactly views (negative peers) from different original images in the batch, and vice versa. Together, they constitute negative pairs of views.
-
5.
In each batch, source and target features are stored in two long memory banks.
-
6.
The source features should be similar to their associated target features because the have the same origin.
-
7.
Each source feature should be dissimilar (to a certain degree) to all the negative features stored in the target memory bank, because they are not from same origin. Similarly, each target feature should be dissimilar (to a certain degree) to all the stored negative features in the source memory bank for the same reason.
Next, we provide basic definitions and setup of the problem, followed by our solution description.
III-A System Model
Let denote a training dataset comprising number of images. Also, assume and are two image transformation functions, sampled randomly from a continuous set of semantic preserving transformations formed by a sequential composition of random crop and resize, color jitter, random gray scale, and random horizontal flip [33, 32, 24, 20, 34, 35].
Thus, for the image in a batch denoted by , we can generate two different transformed versions and , respectively. We denote as the source and as the target view, the representations of which are later forced to be transformation consistent. Following the general momentum contrast strategy of [1, 2, 3], for , we use an encoder network , which consists of a backbone convolutional network, a pooling layer, and a set of sequential fully connected linear layers followed by a final normalization layer555For simplicity of notation we assume the encoder and the momentum-encoder architectures provide normalized feature vectors.. Moreover, as shown in Figure 1, the momentum-encoder network has a similar structure. The encoder network generates the query representation vector . Simultaneously, the momentum-encoder network generates the key representation vector .
Our system design also contains two pre-registered memory banks of size , where is the memory bank length. After each iteration of training, the memory banks are updated by the key feature vectors in the batch. These banks are updated via the same mechanism as in [1, 2, 3].
In our architecture, the query vectors and , are obtained by passing the source and the target views of image , i.e., and , through the encoder . Following the standard practice in the contrastive learning literature, we choose a Resnet50 encoder with its fully connected layer, res50.fc, replaced with a multi layer perceptron [32, 24, 20, 34, 35]. At the same time, and , traverse through the momentum-encoder structure and create the key feature vectors and , respectively. Therefore, , , , and are different representations of and , via separate networks. Since the images are not repeated in the batches during one epoch, it is guaranteed that there is no representation in the memory bank that is similar to any representations in the current batch. Therefore we can safely use all the representations in the memory as negative features.
The two memory banks denoted by and , keep track of the source and target key features from previous iterations. For ease of notation, we define belonging to , where , are the stashed source key features pertaining to previous iterations, and holds the current source feature. In a similar way holds the current target key, and the set of target key representations belonging to the previous iterations, such that .
Throughout this paper unless otherwise mentioned we use to notify the average cross entropy loss of distribution relative to distribution in a batch of samples via
| (1) |
where is the Frobenius dot product between probability matrices and .
III-B Classical Contrastive Learning
The idea of contrastive learning is to homogenize the positive pairs, (, and , by forcing them to be similar in the feature space via a cosine similarity function:
Simultaneously, the representation extracted from image is contrasted with the representations associated to other images in with . In other words, for , traditional contrastive learning is interested in making the negative pairs and as dis-similar as possible.
In fact is the distance between the query representation , and the negative peer representation vector. Based on the relative distance between and all other negative peer representation vectors, , the posterior softmax probability of the query feature being correlated/similar to the representation vector associated to the peer is given by:
| (2) |
where the peer is positive for and negative otherwise. It must be emphasised that represents , and the rest of the key features are taken from . The temperature , is a hyper-parameter value that must be fine-tuned. In a similar way, the posterior probability that the query feature be similar to the representation vector related to the peer is given by:
| (3) |
where represents . Note that all the features in the memory banks and are generated by the momentum-encoder architecture, the weights of which are frozen and are only updated via a momentum update recursion [1].
In the classical contrastive learning, a one-hot pseudo-label is assigned to every peers with the deterministic posterior probability distribution:
| (4) |
The symmetric contrastive scheme [20, 3], therefore minimizes the average of cross-entropy losses between the probabilities in (III-B) and (III-B) and the pseudo-labels via
| (5) |
III-C Cross Similarity Consistency
Our idea of cross similarity consistency is declared as follows: For any pair of transformations , and :
| (6) |
The cross similarity consistency in (6) suggests that under any semantic preserving transformation, the similarity of negative pairs remains unchanged. This in turn stems from the transformation invariance hypothesis; meaning that, for any image the representation vector associated to the transformed image remains unchanged for any .
III-D Uniform Similarity to Negative Peers
As mentioned earlier, for any image in a batch, the classical contrastive learning assumes a one-hot encoded pretext pseudo-label with probability distribution defined in (4) which assigns to the positive peer with a deterministic probability of 1. This choice of pseudo-labeling ignores the so called dark knowledge [36] in the cross similarities between the query and the negative key features, and imposes the similarity of the query feature to any of the negative peers with a zero probability, whereas the soft labels have high entropy, providing much more information per training sample than one-hot-encoded labels [36]. We propose to soften the pseudo-labels by considering the outcome of cross similarity consistency in (7).
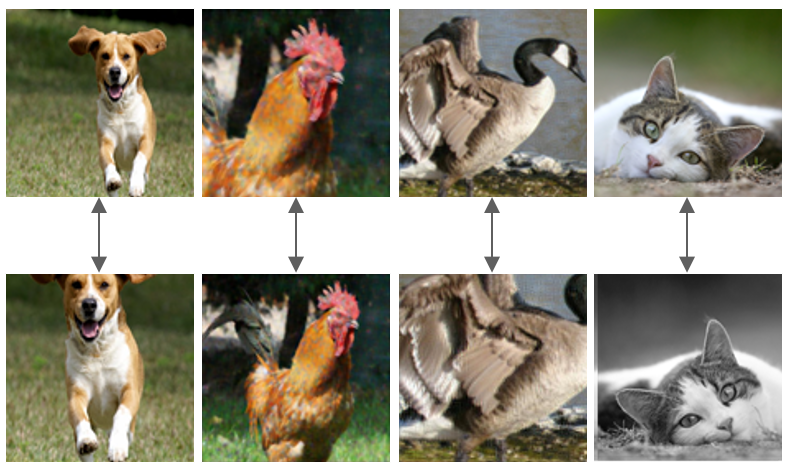

(b) Cross similarity consistency: is a by-product of transformation invariance consistency. Images in the same columns make negative pairs. They come from images with different contextual semantics. In the traditional contrastive learning, their representation features should not be similar at all (zero cosine similarity). But, in this paper we let the model capture some similarities among the negative pairs (e.g. zebra and horse are not the same but they share visual semantics). If the cosine similarity between the images in the first column is , then the similarity between the images in every other column is also .
Let the pseudo-labels associated to and be defined as and , where and . We denote the pseudo-labels in a batch of samples by and . Let’s also define probability matrices and in such that , and . We propose to converge the probability distribution of to and to under certain conditions:
-
•
The probability distribution of the pseudo-labels for the positive peer must be larger than the negative peers, since the positive pairs are more likely to be similar.
-
•
On the average, representation vectors associated to images in the batch are equally similar/dis-similar to any of the negative representations in the memory bank. In other words, in a batch of data, on the average, the similarities, are uniformly distributed among all the negative peers.
We train the network by alternating between two optimization problems. First, we find the closest distribution of pseudo-labels to the output probability distributions with the constraints we just mentioned. In particular, we find the optimal pretext pseudo-labels via the objective function:
| (8) |
where
| (9) | ||||
| s.t. | ||||
for . The first and the second constraints in (9) guarantee that the pseudo-labels are indeed probabilities. The third and the last constraints are imposed by the infoNCE transformation invariance consistency and guarantee the positive pair is the most similar pair. Finally, the forth constraint pushes the pseudo-labels to be uniformly distributed over the negative peers in a batch of data. It is worth noting that converts the optimization of (9) to the classical contrastive learning problem. To solve (9) we relax the last constraint by letting . This would guarantee that . Removing the constraint for , our new optimization problem becomes:
| (10) | ||||
| s.t. | ||||
where and are sub-matrices of and with their first row removed such that , and , and is a constant. Note that , and , where is a vector of all ones with proper dimensions, and and are histograms with and . The optimization problem in (10) is a transportation problem for which a fast solution is provided by [37] by smoothing the cost function with an entropic regularization term,. The author in [37] showed that using a fast version of the Sinkhorn-Knopp algorithm, the minimizer of (10) for a proper value of can be obtained by:
| (11) |
Note that -, is the negative entropy of the pseudo-labels over the negative peers, which filters out the solutions with smaller entropy. The normalization factors and can be found by simple matrix scaling such that satisfies the constraints in (10). Eventually the optimal pseudo-labels are assigned via666To be more clear the pseudo labels on each side are obtain from and , respectively.:
| (12) |
Once the pseudo-labels are obtained, we minimize the symmetric cross-entropy between the pseudo-labels and the probability distributions and the cross similarity regularization cross-entropy via:
| (13) | |||||
The network is trained by alternating between generating pseudo-labels and updating the network weights. In this scheme in each iteration two set of pseudo-labels and are first generated via (12). Then these pseudo-labels are used to update the networks weight by back-propagating the gradients of loss function in (13) through the network using stochastic gradient decent algorithms. Once the weights are updated this procedure repeats. Therefore the network converges by alternating the following two steps:
-
1.
Generate the optimal pseudo-labels and are obtained from (12).
-
2.
Optimise (13) with respect to and and back-propagate.
Algorithm 1 shows our pseudo code in pytorch format.
III-E Discussion
Each element of and is in fact a cross similarity between representations of either a positive or a negative pair. It must be noted that and belong to transformed versions of identical images. The first two terms in (13) are responsible to uniformly scatter the similarities between the negative pairs; however, the second two terms push the cross similarities to follow (7). Equation (13) therefore, minimizes the cross entropy between and via some pseudo-labels and . Minimizing the average column-by-column cross entropy between and implies that no matter what the transformation is, as long as it is semantic preserving, the cross similarity between both positive and negative pairs should remain the same.
Although not mathematically required, it is intuitively feasible to set . Throughout this paper we use , however following [24] we use a queue of past probabilities to incorporate in the loss.
| Top-1 accuracy for frozen linear head vs end-to-end fine-tuning | |||||||||||||||||||||||||||||||||||||||||||||||||||||||||||||||||||||||||||||||||||||||||||||||||||||||
|
| layers | 2 | 3 | 4 | 5 |
| top-1 acc | 69.0 | 70.6 | 71.3 | 70.0 |
| time/200 ep | 57h | 59h | 60h | 62h |
| memory/64 batch-size | 4.5G | 4.6G | 4.7G | 4.8G |
| Ablation on the number of MLP layers of other SOTA methods | ||||||||||||||||||||||||
|
IV Experiment Results
In this section we evaluate the performance of our method and compare
our results with the existing approaches. Details of experiments can be seen in the Appendix.
General Setup: Following the common practice we use a Resnet50 architecture as our backbone. We also use two views of size during Imagenet-1K pre-training. In our structure we use a multi layer MLP projection head where each layer consists of a fully connected layer, followed by batchnorm and relu. We use the same SGD optimizer and cosine learning rate scheduler as in [1] with a base learning rate of for batch size of 512. For a fair comparison, denoted by , the results of other papers are reproduced, either by us or different authors, following the standard practice of two views for pre-training. Unless otherwise stated, we set , , and for all the experiments. The memory bank and the momentum update parameters are adopted from [1].
| 0.5 | 0.6 | 0.7 | 0.8 | 0.9 | 1.0 | |
| k-NN-acc | 42.5 | 44.8 | 47.1 | 48.0 | 51.4 | 48.5 |
| 512 | 1024 | 2048 | 4096 | 8192 | |
| k-NN-acc | 44.2 | 46.3 | 48.5 | 51.4 | 52.2 |
| queue-memory(MB) | 4 | 13 | 42 | 148 | 552 |
| Uniform Dist. | Cross-Similarity-Cons. | k-NN acc. |
| ✓ | ✓ | 51.4 |
| ✓ | ✗ | 43.8 |
| ✗ | ✓ | 48.5 |
| ✗ | ✗ | 48.5 |
| backbone | Resnet-50 | Resnet152 | Resnet-50xw2 | Resnet-50xw4 |
| params | 25m | 60m | 98m | 380m |
| top1-acc | 71.3 | 73.4 | 74.3 | 75.5 |
| VOC 07 detection | VOC 07+12 detection | COCO detection | COCO segmentation | |||||||||||||
| pre-train |
|
|
|
|
||||||||||||
| scratch |
|
|
|
|
||||||||||||
| Imagenet-1K-sup. |
|
|
|
|
||||||||||||
| BYOL[32] |
|
|
|
|
||||||||||||
| MoCo-v2+[34] |
|
|
|
|
||||||||||||
| SwAV*[24] |
|
|
|
|
||||||||||||
| SimSiam[34] |
|
|
|
|
||||||||||||
| BarlowT[41] |
|
|
|
|
||||||||||||
| VCRReg*[42] |
|
|
|
|
||||||||||||
| XMoCo(ours) |
|
|
|
|
IV-A Unsupervised Pre-Training
Full details of augmentations, optimizer, scheduler and hyper-parameter fine-tuning can be found in Sec. V-B in the Appendix.
IV-B Liner head protocol vs end-to-end fine-tuning
We evaluate the quality of the learned visual semantics during self-supervised pre-training, in terms of top-1 accuracy performance. For a fair comparison we have compared all the algorithms when they are pre-trained with two 224224 views of input images. Our algorithm secures a spot in the top SOTA algorithms in terms of top-1 classification accuracy. We consider two scenarios:
Freezing the backbone weights and training a linear classifier head for 100 epochs. TABLE I shows the performance of our proposed algorithm compared to existing methods.
Fine-tuning the end-to-end network by using two separate learning rates for the backbone and the linear head, i.e., .01 and .2, respectively. We train the network end-to-end for 20 epochs, where we use a SGD optimizer along with a multi-step learning rate scheduler decayed at [12, 16] epoch marks with a decay factor of 0.2. The last column of Table. I shows the performance of fine-tuning the network over Imagenet-1K.
IV-B1 Ablation on the number of MLP layers
We study the effect of number of MLP layers in the quality of the learned visual semantics by ablating the number of layers in TABLE II.
Increasing number of MLP layers up to 4, boosts the classification performance. This is likely because by deepening the model, the last layer of the backbone captures more general low level features, leaving the MLP layers to capture fine-grained pretext task-related features [4]. It is worth mentioning that even with 3 MLP layers our method performs competitive with other SOTA algorithms. It must be noted that increasing the number of MLP layers may or may not add to the performance of other SOTA methods; e.g. the authors in [41] did not achieve any performance improvement when increasing the number of MLP layers for BYOL method. The authors in [34] could only reach to better performance for SwAV [24] and SimCLR [34] when increasing the number of MLP layers by one. Our attempt to gain better top-1 accuracy by increasing the MLP layers on the other SOTA methods failed as depicted in Table. III.
IV-B2 Ablation on the value of
To verify our proposed uniform similarity distribution on the negative peers we ablate the choice of through k-nearest-neighbors (k-NN) algorithm with neighbors. TABLE IV corroborates our intuition of incorporating the information concealed in the negative peers to the loss via . As the value of increases the model learns higher quality features as the similarity between the representations associated to the positive samples increases. However, at the point , the trade-off between the positive pair similarity and the interaction between the negative samples reach to an equilibrium, prompting a model learned the highest quality features in terms of k-NN accuracy. Increasing towards 1 in practice ignores the role of negative samples and as could be predicted leads to deteriorated quality of learned features.
IV-B3 Ablation on the number of negative peers,
Ablation study as shown in TABLE V shows that increasing the number of negative peers contributes to the quality of learned features via contrasting against more samples. Additionally, since we use a queue of previous probabilities to deal with the cases where , larger number of negative samples is neither memory friendly nor is the performance increase worth the hassle. It must be noted that we have used far less negative pairs, compared to traditional contrastive methods with [1, 2].
IV-B4 Ablation on the loss
In this section we study the effect of uniform distribution of similarity on the negative peers as well as the cross similarity consistency in the quality of features learned by the model, by ablating the loss accordingly. As discussed in Sec. III-E the effect of cross similarity can be cancelled by cancelling the last two terms in the cross-entropy loss of (13). On the other hand the effect of uniform distribution of similarity over the negative peers can be cancelled by using the traditional one-hot-encoded pseudo-labels for our contrastive algorithm. Neutralizing the cross similarity regularization, as shown in TABLE VI aggravates the quality of the learned features significantly by losing the symmetry of the loss. This regularization in short, conveys the transformation invariance property of positive pair in the traditional contrastive learning to negative pairs if their similarity is non-zero. Cancelling the uniform distribution of similarity on the negative peers, on the other hand, is equal to setting (one-hot-encoded pseudo-labels) which naturally cancels the cross similarity regularization as well by decoupling the interaction of negative samples from pseudo-labels. As it can be seen this also exacerbates the quality of the learned features.
IV-B5 Ablation on the backbone
The experiments in Table. VII ablates the complexity of the backbone instead of the traditional Resnet-50. As the backbone parameters increase the performance also increases.
IV-C Object Detection and Segmentation
We use Detectron2 [44] framework to perform all object detection tasks by finetuning Faster-RCNN [45] structures on the pretrained Resnet-50 backbone. We evaluate the results on PASCAL-VOC and COCO datasets and report the standard , , and for both VOC and COCO, all averaged over trials. We follow the same procedure as in [1] to fine-tune the model in detectron2. All the experiments are run on NVIDIA-V100 GPUs with batch size of .
IV-C1 PASCAL-VOC Dataset
We fine-tune all layers of a Faster R-CNN [45] detector with a R50-C4 backbone in two different scenarios. 1. We train on the VOC trainval07( images) and test on the VOC test2007. 2. We train on the VOC trainval07+12 and evaluate on the VOC test2007. We train both with schedules which is approximately 12 epochs. TABLE VIII shows the detection results fine-tuned on VOC dataset with R50-C4 backbone, where best results are depicted with bolded face font. It can be seen that the performance of XMoCo in localization/classification tasks is either comparable or better than state-of-the-art representation learning methods.
IV-C2 COCO Object Detection and Segmentation
V Appendix

V-A Traditional Contrastive vs XMoCo
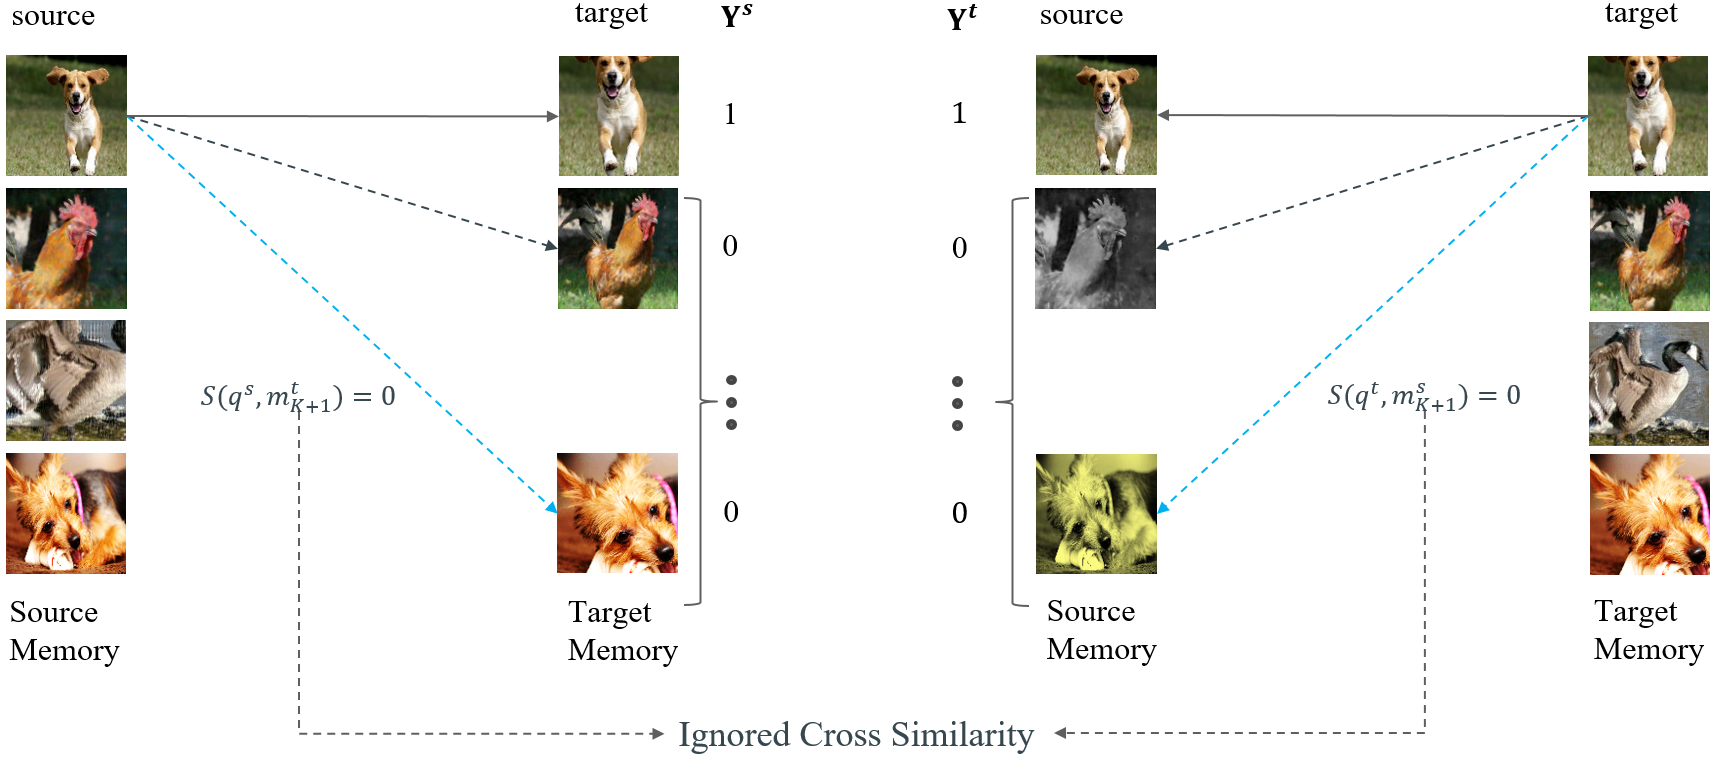
In traditional contrastive learning the interplay between the negative examples is ignored. Figure 3 shows the schematic of traditional contrastive learning algorithm. As it is shown in the figure, the negative pairs “dog-dog” are treated similarly as the negative pairs “dog-cock”. In particular all the negative peers in the memory are treated the same. This would degrade the performance of contrastive learning as it pushes away the representation vectors associated to the two dogs as well. The traditional contrastive learning algorithm uses one-hot-encoded pseudo-labels for the probability distributions in (III-B) and (III-B). The zeros in the pseudo-labels tend to force the similarity between the negative samples to be zero.
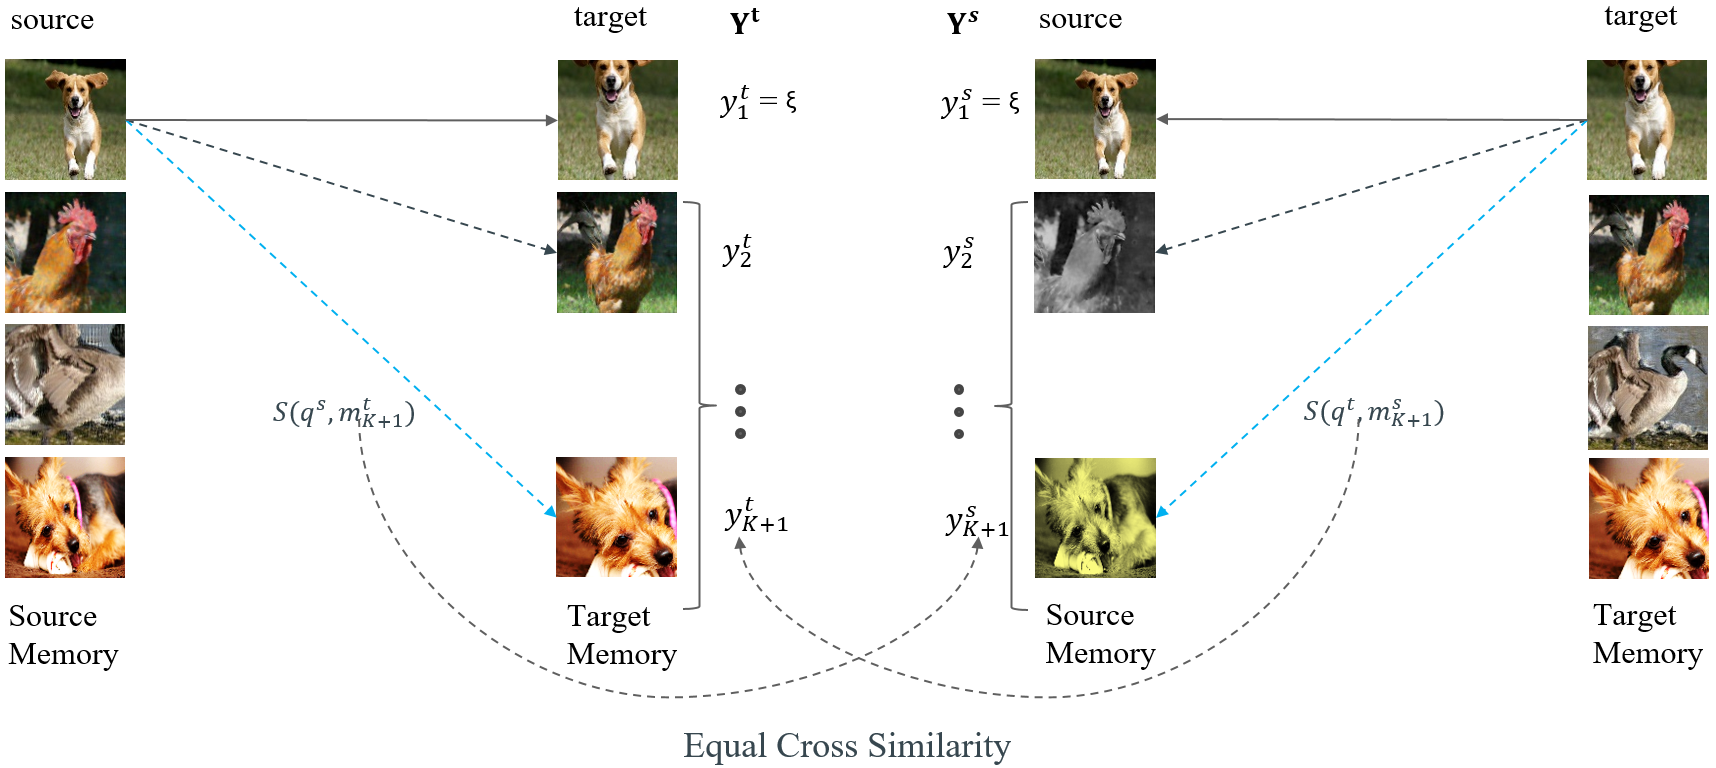
In XMoCo we relax the scenario and let the pseudo-labels to be soft labels. This would allow the model to capture the similarities between e.g. the “dog-dog” negative samples. Figure 4 shows the schematic of the proposed XMoCo algorithm. The pseudo-labels are however constrained to follow the optimization rule in (9), with which we assure that the positive samples still capture the most similarity between all the samples.
V-A1 Cross Similarity Consistency
By swapping the pseudo-labels according to (13) we implicitly push the probabilities in (III-B) and (III-B) to be equal for any query-key pair which in turn implies (6). Intuitively, in Figure 4 the “dog-cock” cross similarity in the left is equal to the “dog-cock” similarity in the right. Note that “dog-cock” pairs in the left and right are subjected to different transformations.
V-A2 Uniform Distribution over the Negative Peers
Figure 5 depicts the concept of uniform distribution of similarities over the negative pairs. We can better explain this concept using its analogy to clustering of samples to certain number of clusters. In a classification problem with a balanced dataset, We would like each cluster of data to receive equal number of samples. Here equivalently, we would like each negative sample to receive same aggregated amount of similarity (probability of two representation vectors being the same). This would regularize out the loss and spreads the similarity of a batch equally to all negative samples.
V-B Unsupervised Training
We use RandomResizedCrop in Pytorch, to crop and resize the the input image to two 224 x 224 crops. After that we use RandomHorizontalFlip with probability of 0.5. We also use a random color distortion composed of random ColorJitter with probability and (brightness=0.8, contrast=0.8, saturation=0.8, hue=0.2) and strength of , followed by a RandomGrayscale with probability of , and a random Gaussian blur with probability and kernel size and uniform kernel with unit mean and variance of . We normalize the images at the last stage with mean = [0.485, 0.456, 0.406] and std = [0.228, 0.224, 0.225]. We train the networks using SGD optimizer with momentum of 0.9 and weight decay of 0.0001. We train on 8 Nvidia-V100 GPUs with batch size of 512 and initial learning rate of .135. Similar to [34] we use a cosine learning rate schedule [47] with coefficient of 0.5 and offset of 0.1.
V-C Classification on Imagenet-1K
V-C1 1. Linear Head Classification on Imagenet-1K
We further freeze the weights of the encoder that were trained previously in the first stage, and only train the fully connected layer with the true Imagenet-1K labels in a supervised fashion for 100 epochs. The philosophy behind linear head training is that if in the first stage, the image semantics are learned properly, then the linear fully connected layer should learn to classify the images of the same dataset in the second stage within a few epochs. We use Pytorch CrossEntropyLoss and SGD optimizer with momentum of and weight decay of in this stage. We use batch size of 512 with initial learning rate of 60. We schedule the learning rate to drop by a factor of 0.1 in the interval of [60 80] epochs [48]. A softmax layer is concealed in the CrossEntropyLoss function in pytorch.
V-C2 Ablation on the batch size
TABLE IX shows the effect of changing the batch size on the linear head classification performance, when the backbone is frozen. As observed, the best performance is when the batch size is set to 512.
| batch size | 256 | 512 | 1024 | 2048 | 4096 |
| top-1 acc | 65.0 | 71.3 | 70.2 | 69.5 | 58.9 |
| top-5 acc | 85.3 | 90.0 | 89.2 | 88.7 | 81.1 |
| pre-train | Aircraft | Caltech101 | Cars | CIFAR10 | CIFAR100 | DTD | Flowers | Pets | SUN397 | VOC2007 |
| Supervised | 43.6 | 90.2 | 44.9 | 91.4 | 73.9 | 72.2 | 89.9 | 91.5 | 60.5 | 83.6 |
| InsDis[17] | 36.9 | 71.1 | 29.0 | 80.3 | 60.0 | 68.5 | 83.4 | 68.8 | 49.5 | 74.4 |
| MoCo-v1[1] | 35.5 | 75.3 | 28.0 | 80.2 | 57.7 | 68.8 | 82.1 | 69.8 | 51.0 | 75.9 |
| PCL-v1[49] | 21.6 | 76.9 | 12.9 | 81.8 | 55.7 | 62.9 | 64.7 | 75.3 | 45.7 | 78.3 |
| PIRL[20] | 37.1 | 74.5 | 28.7 | 82.5 | 61.3 | 69.0 | 83.6 | 71.4 | 53.9 | 76.6 |
| PCL-v2[49] | 37.0 | 86.4 | 30.5 | 91.9 | 73.5 | 70.6 | 85.3 | 82.8 | 56.2 | 81.1 |
| SimCLR-v1[2] | 44.9 | 90.0 | 43.7 | 91.2 | 72.7 | 74.2 | 90.9 | 83.3 | 59.2 | 80.8 |
| MoCo-v2[2] | 41.8 | 87.9 | 39.3 | 92.3 | 74.9 | 73.9 | 90.1 | 83.3 | 60.3 | 82.7 |
| SimCLR-v2[35] | 46.4 | 89.6 | 50.4 | 92.5 | 76.8 | 76.4 | 92.9 | 84.7 | 61.5 | 81.6 |
| SeLa-v2[24] | 37.3 | 87.2 | 36.9 | 92.7 | 74.8 | 74.2 | 90.2 | 83.2 | 62.7 | 82.7 |
| InfoMin[33] | 38.6 | 87.8 | 41.0 | 91.5 | 73.4 | 74.7 | 87.2 | 86.2 | 61.0 | 83.2 |
| BYOL[32] | 53.9 | 91.5 | 56.4 | 93.3 | 77.9 | 76.9 | 94.5 | 89.1 | 60.0 | 81.1 |
| DeepCluster-v2[24] | 54.5 | 91.3 | 58.6 | 94.0 | 79.6 | 78.6 | 94.7 | 89.4 | 65.5 | 83.9 |
| SwAV[24] | 54.0 | 90.8 | 54.1 | 94.0 | 79.6 | 77.0 | 94.6 | 87.6 | 65.6 | 83.7 |
| JCL[39] | 52.0 | 89.4 | 53.2 | 93.3 | 77.1 | 74.5 | 93.2 | 86.2 | 63.2 | 81.1 |
| SwAV+UTOA*[40] | 55.1 | 90.9 | 55.0 | 94.0 | 78.6 | 78.4 | 95.4 | 87.5 | 65.1 | 81.8 |
| BarlowT[41] | 57.0 | 91.0 | 65.0 | 92.9 | 77.8 | 78.5 | 95.9 | 89.3 | 63.0 | 82.7 |
| XMoCo(ours) | 62.9 | 92.4 | 64.1 | 94.9 | 80.5 | 76.1 | 95.1 | 89.5 | 63.0 | 83.8 |
| pre-train | Aircraft | Caltech101 | Cars | CIFAR10 | CIFAR100 | DTD | Flowers | Pets | SUN397 | VOC2007 |
| Supervised | 83.5 | 91.0 | 82.6 | 96.4 | 82.9 | 73.3 | 95.5 | 92.4 | 63.6 | 84.8 |
| InsDis[17] | 73.4 | 72.0 | 61.6 | 93.3 | 68.3 | 64.0 | 89.5 | 76.2 | 51.8 | 71.9 |
| MoCo-v1[1] | 75.6 | 75.0 | 65.0 | 93.9 | 71.5 | 65.4 | 89.5 | 77.0 | 53.4 | 74.9 |
| PCL-v1[49] | 75.0 | 87.6 | 73.2 | 96.3 | 79.6 | 70.0 | 90.8 | 87.0 | 58.4 | 82.1 |
| PIRL[20] | 72.7 | 70.8 | 61.0 | 92.2 | 66.5 | 64.3 | 89.8 | 76.3 | 50.4 | 69.9 |
| PCL-v2[49] | 79.4 | 88.0 | 71.7 | 96.5 | 80.3 | 71.8 | 93.0 | 85.4 | 58.8 | 82.2 |
| SimCLR-v1 | 81.1 | 90.3 | 83.8 | 97.1 | 84.5 | 71.5 | 93.8 | 84.1 | 63.3 | 82.6 |
| MoCo-v2[2] | 79.9 | 84.4 | 75.2 | 96.5 | 71.3 | 69.5 | 94.3 | 79.8 | 55.8 | 71.7 |
| SimCLR-v2[35] | 78.7 | 82.9 | 79.8 | 96.2 | 79.0 | 70.2 | 94.3 | 83.2 | 61.1 | 78.2 |
| SeLa-v2[24] | 82.0 | 89.0 | 85.6 | 96.8 | 84.4 | 74.4 | 95.8 | 88.5 | 65.8 | 84.8 |
| InfoMin[33] | 80.2 | 83.9 | 78.8 | 96.9 | 71.2 | 71.1 | 95.2 | 85.3 | 57.7 | 76.6 |
| BYOL[32] | 79.5 | 89.4 | 84.6 | 97.0 | 84.0 | 73.6 | 94.5 | 89.6 | 64.0 | 82.7 |
| DeepCluster-v2[24] | 82.5 | 90.8 | 87.3 | 97.1 | 85.2 | 74.8 | 95.3 | 89.4 | 66.4 | 84.9 |
| SwAV[24] | 83.1 | 89.8 | 86.8 | 96.8 | 84.4 | 75.2 | 95.5 | 89.0 | 66.2 | 84.7 |
| JCL[39] | 82.0 | 87.8 | 85.6 | 95.4 | 84.0 | 74.1 | 93.3 | 87.1 | 65.2 | 83.2 |
| SwAV+UTOA*[40] | 83.0 | 89.6 | 86.9 | 96.7 | 84.6 | 75.4 | 95.4 | 89.2 | 66.1 | 84.8 |
| BarlowT[41] | 83.9 | 91.7 | 88.3 | 97.1 | 84.6 | 76.6 | 96.6 | 90.9 | 65.5 | 82.8 |
| XMoCo(ours) | 85.4 | 94.4 | 87.0 | 97.5 | 88.4 | 76.4 | 96.8 | 93.2 | 65.0 | 84.8 |
| VOC 07+12 R50-FPN detection | COCO R50-FPN detection | COCO R50-FPN segmentation | ||||||||||
| pre-train |
|
|
|
|||||||||
| Imagenet-1K-sup. |
|
|
|
|||||||||
| XMoCo(ours) |
|
|
|
| VOC 07+12 R50-FPN detection | COCO R50-FPN detection | COCO R50-FPN segmentation | ||||||||||
| pre-train |
|
|
|
|||||||||
| Imagenet-1K-sup. |
|
|
|
|||||||||
| XMoCo(ours) |
|
|
|
| pre-train | COCO R50-FPN-RetinaNet detection, 1x schedule | COCO R50-FPN-RetinaNet detection, 2x schedule | ||||||
|
|
|||||||
| Imagenet-1K-sup. |
|
|
||||||
| XMoCo(ours) |
|
|
V-D Classification on other Datasets
To study how well features learned during self-supervised training can be transferred to other datasets, we study the classification downstream task on various target datasets FGVC Aircraft [50], Caltech-101 [51], Stanford Cars [52], CIFAR10, and CIFAR-100 [53], DTD [54], Oxford 102 Flowers[55], Oxford-IIIT Pets [56], SUN397 [57] and Pascal VOC2007 [58]. These datasets span a wide variety of classification tasks such as fine-grained, texture and scene classification. The cardinality of the target dataset and their associated number of classes span the intervals [2000, 75000] and [10, 397], respectively. For the target datasets Cifar-10, Cifar100, SUN397, Stanford Cars and DTD the top-1 accuracy is reported; however, due to the multi-label nature of datasets like Pascal VOC 2007 the 11 point interpolated average precision, mAP, is reported [58]. For the rest of the target datasets we report mean accuracy per class. We split the train, validation and test splits for each datasets similar to what it is reported in [59]. We further compare our results with respect to the representation learning pioneers. [17, 1, 27, 20, 49, 2, 35, 33, 32, 24, 41].
We study the classification transfer learning for the scenarios explained in the following two sections.
V-D1 Linear Evaluation Using Logistic Regression
We train a logistic regression with a cross-entropy loss, a L-BFGS [60] solver, and an regularization, on the features extracted by the Resnet-50 frozen backbone. We train for 5000 iterations for a batch size of 64. We use the same augmentation for both train and validation datasets. In particular, we resize the input image to 224 on the small edge and apply a center crop following with a normalization with the Imagenet-1K normalization factors. We fine-tune the regularization factor similar to [59]. Since Pascal VOC 2007 is a multi-label dataset, we fit 20 binary logistic regression for each class and report the mAP.
Our method achieves the top-2 spot in 8 datasets out of 10 as depicted in TABLE X. It must be noted that methods like SwAV, DeepCluster-v2, and SeLa-v2 [24] are pre-trained on 16 views rather than two 224 x 224 views. Our method performs well in almost all the scenarios, from Aircraft fine-grained classification to Pascal VOC 2007 multi-label classification.
V-D2 Transfer Learning (End-to-End Fine-Tuning)
In this section we append a linear head to the pre-trained Resnet-50 backbone and fine-tune the network end-to-end with a binary cross-entropy loss for Pascal VOC 2007 and softmax cross-entropy loss for all other datasets. We use the same training settings and augmentations as before. Additionally we use a SGD optimizer with nestrov momentum of 0.9 and a CosineAnnealingLR learning rate scheduler for 5000 iterations. We grid search for the best learning rate between 10 logarithmically equally spaced points the interval [, ]. We also grid search for the best optimizer weight decay among 10 logarithmically equally spaced points in the interval [, ] appended with a zero weight decay point.
When fine-tuning the pre-trained model on various datasets with the aforementioned specifications, as shown in TABLE XI, our method performs very well and achieves a top spot in the classification accuracy in 8 out of 10 datasets.
V-E Object Detection and Segmentation
Due to limitations of the Batch Normalization (BN) [61] in structures like Resnet-50 it is relatively hard to achieve good detection results by training object detectors from scratch [62]777Object detectors are trained on images of higher resolution. This makes it inevitable to load batches of very small size to the GPUS due to memory limitations. Therefore, BN operates on very small batch sizes, resulting in inaccurate learned parameters [63, 64, 65]. . Therefore, it is common to pre-train on Imagenet-1K in a supervised fashion, and then freeze the BN layers and fine-tune the detector on the downstream task by using the pre-trained network as the initialization. Detectron2 as a standard platform however, trains object detectors with selected standard hyper-parameters fine-tuned on Imagenet-1K supervised pre-trained networks. Since, detectors are highly dependant to their training hyper-parameters and the scheduling mechanism, for a fair comparison, we follow the normalization routine adopted by [1] via fine-tuning and synchronizing the BN trained across GPUs [64]. This would bypass the need for freezing the BN layers trained on Imagenet-1K in the detector architecture [66]. Also, similar to [1] we normalize the detector-specific appended layers by adding BN for better adjustment of the weights magnitude. As for fine-tuning, we use the same schedule as the Imagenet-1K supervised pre-training peer.
V-E1 Pascal-VOC Object Detection
We use a Faster R-CNN [45] detector with R50-C4 backbone, The image scale during training changes in the interval with the step of pixels, where at the test time it is fixed on pixels. Unless otherwise stated, we train for iterations where we reduce the learning rate by in and iteration marks. The initial learning rate is set as the default value of with linear warm-up [67] for iterations. The weight decay and momentum are and , respectively.
V-E2 COCO Object Detection and Segmentation
Similar to [23] we use a Mask-RCNN [46] with C4 backbone. We train for iterations, in the main experiments, with stepping down the learning rate by at the iterations and (The schedule routine). We fine tune all layers on train2017 and validate on val2017 sets. The image size for training is within [640, 800] and at the inference is 600. The batch size is 16 and the learning rate is the default value of .
V-E3 Ablation on the backbone
TABLE XII(a) investigates the effect of changing the detector backbone on the detection performance compared to the supervised training counterpart. As it can be seen XMoCo outperforms its supervised counterpart when trained on R50-FPN backbone for both VOC 2007 and COCO datasets. The training in this section is executed for 12 epochs only (1x schedule).
V-E4 Ablation on the training schedules
Table XII(b) shows how longer schedules can affect the detection performance in both Pascal and COCO datasets when the backbone is R50-C4. As it is depicted in the table, not only does XMoCo hold to out performing its supervised counterpart, but also the gap between the unsupervised and supervised performances is increased.
V-E5 Ablation on the detector
VI Conclusion
Traditional contrastive self-supervised representation learning methods in general pull the representations associated to the positive pairs together and push the ones associated to the negative pairs away. Traditionally, these methods ignore the inter-connection between the negative pairs. In this paper we presented extended momentum contrast, XMoCo, a method founded upon the legacy MoCo contrastive learning family. we introduced a cross consistency regularization loss, through which we extend the pretext invariance idea presented in the conventional representation learning methods to dissimilar images (negative pairs). Under the cross consistency regularization rule, we argued that transformations should preserve the cross similarities between the negative sample representation vectors as well. Additionally, we also proposed to soften the one-hot encoded pretext pseudo-labels in the classical infoNCE loss to take the cross similarities of the negative pairs into account. We proposed a formulation to uniformly distribute the similarity of samples in a batch, among all the negative peers in the memory bank. Our results show a competitive performance on the standard self-supervised learning benchmarks with respect to other SOTA representation learning methods.
References
- [1] K. He, H. Fan, Y. Wu, S. Xie, and R. Girshick, “Momentum contrast for unsupervised visual representation learning,” arXiv preprint arXiv:1911.05722, 2019.
- [2] X. Chen, H. Fan, R. Girshick, and K. He, “Improved baselines with momentum contrastive learning,” arXiv preprint arXiv:2003.04297, 2020.
- [3] X. Chen, S. Xie, and K. He, “An empirical study of training self-supervised vision transformers,” in Proceedings of the IEEE/CVF International Conference on Computer Vision, 2021.
- [4] L. Jing and Y. Tian, “Self-supervised visual feature learning with deep neural networks: A survey,” IEEE transactions on pattern analysis and machine intelligence, 2020.
- [5] L. Schmarje, M. Santarossa, S.-M. Schröder, and R. Koch, “A survey on semi-, self-and unsupervised learning for image classification,” IEEE Access, 2021.
- [6] M. Seyfi, A. Banitalebi-Dehkordi, and Y. Zhang, “Extending momentum contrast with cross similarity consistency regularization,” IEEE Transactions on Circuits and Systems for Video Technology, pp. 1–1, 2022.
- [7] A. Banitalebi-Dehkordi and Y. Zhang, “Repaint: Improving the generalization of down-stream visual tasks by generating multiple instances of training examples,” British Machine Vision Conference, BMVC, 2021.
- [8] M. Akbari, A. Banitalebi-Dehkordi, and Y. Zhang, “E-lang: Energy-based joint inferencing of super and swift language models,” arXiv preprint arXiv:2203.00748, 2022.
- [9] A. Banitalebi-Dehkordi, “Knowledge distillation for low-power object detection: A simple technique and its extensions for training compact models using unlabeled data,” in Proceedings of the IEEE/CVF International Conference on Computer Vision, 2021, pp. 769–778.
- [10] J. Devlin, M.-W. Chang, K. Lee, and K. Toutanova, “Bert: Pre-training of deep bidirectional transformers for language understanding,” arXiv preprint arXiv:1810.04805, 2018.
- [11] S. Gidaris, P. Singh, and N. Komodakis, “Unsupervised representation learning by predicting image rotations,” in International Conference on Learning Representations, 2018.
- [12] M. Noroozi and P. Favaro, “Unsupervised learning of visual representations by solving jigsaw puzzles,” in European conference on computer vision. Springer, 2016, pp. 69–84.
- [13] R. Zhang, P. Isola, and A. A. Efros, “Colorful image colorization,” in European conference on computer vision. Springer, 2016, pp. 649–666.
- [14] D. Pathak, P. Krahenbuhl, J. Donahue, T. Darrell, and A. A. Efros, “Context encoders: Feature learning by inpainting,” in Proceedings of the IEEE conference on computer vision and pattern recognition, 2016, pp. 2536–2544.
- [15] P. Xu, Z. Song, Q. Yin, Y.-Z. Song, and L. Wang, “Deep self-supervised representation learning for free-hand sketch,” IEEE Transactions on Circuits and Systems for Video Technology, vol. 31, no. 4, pp. 1503–1513, 2020.
- [16] S. Guo, E. Rigall, L. Qi et al., “Graph-based cnns with self-supervised module for 3d hand pose estimation from monocular rgb,” IEEE Transactions on Circuits and Systems for Video Technology, vol. 31, no. 4, pp. 1514–1525, 2021.
- [17] Z. Wu, Y. Xiong, S. X. Yu, and D. Lin, “Unsupervised feature learning via non-parametric instance discrimination,” in Proceedings of the IEEE Conference on Computer Vision and Pattern Recognition (CVPR), June 2018.
- [18] A. Van den Oord, Y. Li, and O. Vinyals, “Representation learning with contrastive predictive coding,” arXiv e-prints, pp. arXiv–1807, 2018.
- [19] O. J. Hénaff, A. Srinivas, J. De Fauw et al., “Data-efficient image recognition with contrastive predictive coding,” arXiv preprint arXiv:1905.09272, 2019.
- [20] I. Misra and L. v. d. Maaten, “Self-supervised learning of pretext-invariant representations,” in Proceedings of the IEEE/CVF Conference on Computer Vision and Pattern Recognition (CVPR), June 2020.
- [21] M. Ye, X. Zhang, P. C. Yuen, and S.-F. Chang, “Unsupervised embedding learning via invariant and spreading instance feature,” in IEEE International Conference on Computer Vision and Pattern Recognition (CVPR), 2019.
- [22] J. Von Kügelgen, Y. Sharma, L. Gresele, W. Brendel, B. Schölkopf, M. Besserve, and F. Locatello, “Self-supervised learning with data augmentations provably isolates content from style,” Advances in Neural Information Processing Systems, vol. 34, 2021.
- [23] X. Chen and K. He, “Exploring simple siamese representation learning,” in Proceedings of the IEEE/CVF Conference on Computer Vision and Pattern Recognition, 2021.
- [24] M. Caron, I. Misra, J. Mairal et al., “Unsupervised learning of visual features by contrasting cluster assignments,” arXiv preprint arXiv:2006.09882, 2020.
- [25] M. Caron, P. Bojanowski, A. Joulin, and M. Douze, “Deep clustering for unsupervised learning of visual features,” in Proceedings of the European Conference on Computer Vision (ECCV), 2018, pp. 132–149.
- [26] M. Caron, P. Bojanowski, J. Mairal, and A. Joulin, “Unsupervised pre-training of image features on non-curated data,” in Proceedings of the IEEE/CVF International Conference on Computer Vision, 2019, pp. 2959–2968.
- [27] Y. Asano, C. Rupprecht, and A. Vedaldi, “Self-labelling via simultaneous clustering and representation learning,” in International Conference on Learning Representations, 2019.
- [28] Q. Zheng, J. Zhu, and Z. Li, “Collaborative unsupervised multi-view representation learning,” IEEE Transactions on Circuits and Systems for Video Technology, pp. 1–1, 2021.
- [29] L. Tao, X. Wang, and T. Yamasaki, “An improved inter-intra contrastive learning framework on self-supervised video representation,” IEEE Transactions on Circuits and Systems for Video Technology, pp. 1–1, 2022.
- [30] I. Dave, R. Gupta, M. N. Rizve, and M. Shah, “Tclr: Temporal contrastive learning for video representation,” arXiv preprint arXiv:2101.07974, 2021.
- [31] J. Huang, Y. Huang, Q. Wang, W. Yang, and H. Meng, “Self-supervised representation learning for videos by segmenting via sampling rate order prediction,” IEEE Transactions on Circuits and Systems for Video Technology, pp. 1–1, 2021.
- [32] J.-B. Grill, F. Strub, F. Altché, C. Tallec, P. Richemond, E. Buchatskaya, C. Doersch, B. Avila Pires, Z. Guo, M. Gheshlaghi Azar et al., “Bootstrap your own latent-a new approach to self-supervised learning,” Advances in Neural Information Processing Systems, vol. 33, pp. 21 271–21 284, 2020.
- [33] Y. Tian, C. Sun, B. Poole et al., “What makes for good views for contrastive learning?” Advances in Neural Information Processing Systems, vol. 33, pp. 6827–6839, 2020.
- [34] T. Chen, S. Kornblith, M. Norouzi, and G. Hinton, “A simple framework for contrastive learning of visual representations,” arXiv preprint arXiv:2002.05709, 2020.
- [35] T. Chen, S. Kornblith, K. Swersky, M. Norouzi, and G. Hinton, “Big self-supervised models are strong semi-supervised learners,” arXiv preprint arXiv:2006.10029, 2020.
- [36] G. Hinton, O. Vinyals, J. Dean et al., “Distilling the knowledge in a neural network,” arXiv preprint arXiv:1503.02531, vol. 2, no. 7, 2015.
- [37] M. Cuturi, “Sinkhorn distances: Lightspeed computation of optimal transport,” Advances in neural information processing systems, vol. 26, 2013.
- [38] T. Wang and P. Isola, “Understanding contrastive representation learning through alignment and uniformity on the hypersphere,” in International Conference on Machine Learning. PMLR, 2020, pp. 9929–9939.
- [39] Q. Cai, Y. Wang, Y. Pan, T. Yao, and T. Mei, “Joint contrastive learning with infinite possibilities,” Advances in Neural Information Processing Systems, vol. 33, pp. 12 638–12 648, 2020.
- [40] Y. Wang, J. Lin, J. Zou et al., “Improving self-supervised learning with automated unsupervised outlier arbitration,” Advances in Neural Information Processing Systems, vol. 34, 2021.
- [41] J. Zbontar, L. Jing, I. Misra et al., “Barlow twins: Self-supervised learning via redundancy reduction,” in International Conference on Machine Learning. PMLR, 2021, pp. 12 310–12 320.
- [42] A. Bardes, J. Ponce, and Y. Lecun, “Vicreg: Variance-invariance-covariance regularization for self-supervised learning,” in ICLR 2022-10th International Conference on Learning Representations, 2022.
- [43] X. Chen, H. Fan, R. Girshick, and K. He, “Improved baselines with momentum contrastive learning,” arXiv preprint arXiv:2003.04297, 2020.
- [44] Y. Wu, A. Kirillov, F. Massa, W.-Y. Lo, and R. Girshick, “Detectron2,” https://github.com/facebookresearch/detectron2, 2019.
- [45] S. Ren, K. He, R. Girshick, and J. Sun, “Faster r-cnn: Towards real-time object detection with region proposal networks,” in Advances in neural information processing systems, 2015.
- [46] K. He, G. Gkioxari, P. Dollár, and R. Girshick, “Mask r-cnn,” in Proceedings of the IEEE international conference on computer vision, 2017, pp. 2961–2969.
- [47] I. Loshchilov and F. Hutter, “Sgdr: Stochastic gradient descent with warm restarts,” arXiv preprint arXiv:1608.03983, 2016.
- [48] X. Wang and A. Gupta, “Unsupervised learning of visual representations using videos,” in Proceedings of the IEEE international conference on computer vision, 2015.
- [49] J. Li, P. Zhou, C. Xiong, and S. C. Hoi, “Prototypical contrastive learning of unsupervised representations,” arXiv preprint arXiv:2005.04966, 2020.
- [50] S. Maji, E. Rahtu, J. Kannala et al., “Fine-grained visual classification of aircraft,” arXiv preprint arXiv:1306.5151, 2013.
- [51] L. Fei-Fei, R. Fergus, and P. Perona, “Learning generative visual models from few training examples: An incremental bayesian approach tested on 101 object categories,” in 2004 conference on computer vision and pattern recognition workshop. IEEE, 2004, pp. 178–178.
- [52] L. Yang, P. Luo, C. C. Loy, and X. Tang, “A large-scale car dataset for fine-grained categorization and verification,” in 2015 IEEE Conference on Computer Vision and Pattern Recognition (CVPR), 2015, pp. 3973–3981.
- [53] A. Krizhevsky, G. Hinton et al., “Learning multiple layers of features from tiny images,” Technical Report, 2009.
- [54] M. Cimpoi, S. Maji, I. Kokkinos, S. Mohamed, and A. Vedaldi, “Describing textures in the wild,” in 2014 IEEE Conference on Computer Vision and Pattern Recognition, 2014, pp. 3606–3613.
- [55] M.-E. Nilsback and A. Zisserman, “Automated flower classification over a large number of classes,” in 2008 Sixth Indian Conference on Computer Vision, Graphics & Image Processing. IEEE, 2008, pp. 722–729.
- [56] O. M. Parkhi, A. Vedaldi, A. Zisserman, and C. V. Jawahar, “Cats and dogs,” in CVPR, 2012.
- [57] J. Xiao, J. Hays, K. A. Ehinger, A. Oliva, and A. Torralba, “Sun database: Large-scale scene recognition from abbey to zoo,” in 2010 IEEE Computer Society Conference on Computer Vision and Pattern Recognition, 2010, pp. 3485–3492.
- [58] M. Everingham, L. Van Gool, C. K. Williams, J. Winn, and A. Zisserman, “The pascal visual object classes (voc) challenge,” International journal of computer vision, vol. 88, no. 2, pp. 303–338, 2010.
- [59] L. Ericsson, H. Gouk, and T. M. Hospedales, “How well do self-supervised models transfer?” in Proceedings of the IEEE/CVF Conference on Computer Vision and Pattern Recognition, 2021.
- [60] D. C. Liu and J. Nocedal, “On the limited memory bfgs method for large scale optimization,” Mathematical programming, vol. 45, no. 1, pp. 503–528, 1989.
- [61] S. Ioffe and C. Szegedy, “Batch normalization: Accelerating deep network training by reducing internal covariate shift,” in International Conference on Machine Learning, 2015.
- [62] K. He, R. Girshick, and P. Dollár, “Rethinking imagenet pre-training,” in Proceedings of the IEEE international conference on computer vision, 2019, pp. 4918–4927.
- [63] S. Ioffe, “Batch renormalization: Towards reducing minibatch dependence in batch-normalized models,” in Advances in neural information processing systems, 2017, pp. 1945–1953.
- [64] C. Peng, T. Xiao, Z. Li, Y. Jiang, X. Zhang, K. Jia, G. Yu, and J. Sun, “Megdet: A large mini-batch object detector,” in 2018 IEEE/CVF Conference on Computer Vision and Pattern Recognition, 2018, pp. 6181–6189.
- [65] Y. Wu and K. He, “Group normalization,” in Proceedings of the European conference on computer vision (ECCV), 2018.
- [66] K. He, X. Zhang, S. Ren, and J. Sun, “Deep residual learning for image recognition,” in Proceedings of the IEEE conference on computer vision and pattern recognition, 2016, pp. 770–778.
- [67] P. Goyal, P. Dollár, R. Girshick, P. Noordhuis, L. Wesolowski, A. Kyrola, A. Tulloch, Y. Jia, and K. He, “Accurate, large minibatch sgd: Training imagenet in 1 hour,” arXiv preprint arXiv:1706.02677, 2017.
- [68] T.-Y. Lin, P. Goyal, R. Girshick et al., “Focal loss for dense object detection,” in Proceedings of the IEEE international conference on computer vision, 2017, pp. 2980–2988.
![[Uncaptioned image]](/html/2206.04676/assets/Figures/Mehdi_Seyfi.jpg) |
Mehdi Seyfi is a staff researcher in the Vancouver big data and intelligence platform lab at Huawei Technologies Canada. His research interest spans various domains in computer vision, image/video/signal processing, machine learning, and deep learning. Mehdi is the recipient of the Simon Fraser University Dean of Graduate Studies (DGS) convocation medal of excellence for his academic achievements during his PhD. |
![[Uncaptioned image]](/html/2206.04676/assets/Figures/Amin_Banitalebi.jpg) |
Amin Banitalebi-Dehkordi received his PhD from the University of British Columbia (UBC), Canada, in 2014. His academic career has resulted in publications in computer vision and pattern recognition, visual attention modeling, and high dynamic range video. His industrial experience expands to areas in machine learning, deep learning, computer vision, and NLP. Amin is currently a principal researcher in machine learning and technical lead at Huawei Technologies Canada. |
![[Uncaptioned image]](/html/2206.04676/assets/Figures/Yong_Zhang.jpg) |
Yong Zhang is a Distinguished Researcher at Huawei Technologies Canada and leading the big data and intelligence platform lab at Vancouver research center. Prior to that, he was a postdoctoral research fellow at Stanford University, USA. His research interests include large scale numerical optimization and machine learning. His research works have been published in top-tier journals and conferences. |