Uncovering bias in the PlantVillage dataset
Abstract
We report our investigation on the use of the popular “PlantVillage” dataset for training deep-learning based plant disease detection models. We trained a machine learning model using only 8 pixels from the PlantVillage image backgrounds. The model achieved 49.0% accuracy on the held-out test set, well above the random guessing accuracy of 2.6%. This result indicates that the PlantVillage dataset contains noise correlated with the labels and deep learning models can easily exploit this bias to make predictions. Possible approaches to alleviate this problem are discussed.
1 Introduction
Plant diseases are a massive threat to the global food supply. Potato late blight (Phytophthora infestans) caused the Irish Potato Famine that claimed the lives of one million people. Today, more than 150 years later after this catastrophic event, potato late blight costs billions of euros to the global economy each year[1]. Overall, plant diseases are responsible for 20 to 40% of crop losses globally[2, 3]. Disease detection and identification play an essential role in disease management for minimizing crop losses. Researchers have developed various methods for disease detection, such as DNA-based methods and sensing techniques for measuring leaf volatile emissions[4, 5]. In 2007, Huan et al. demonstrated one of the first uses of neural networks for plant disease detection[6].
The artificial intelligence (AI) revolution started in the early 2010s when convolutional neural networks dominated the computer vision competitions[7, 8]. The real value of AI, however, was understood when it started tackling challenges in other domains such as medicine[9] and physics[10]. Today, machine learning has become an indispensable tool in plant science. It has found wide-ranging applications such as classifying plant cell organelles[11], high-throughput root phenotyping[12], and estimating crop growth using drone images[13]. Even though machine learning was used for plant disease identification as early as 2007, a lack of large public datasets prevented further studies. This changed when the first extensive and public plant disease dataset, PlantVillage, was published in 2015[14].
Several open plant disease datasets emerged in recent years (Table 1). The PlantVillage dataset is the largest and most studied plant disease dataset. It contains more than 54,000 images of leaves on a homogenous background. This sparked a plethora of studies on plant disease detection using deep learning[15, 16]. Most of the papers reported classification accuracies above 98%.
| Dataset | Number of images | Google Scholar citations (as of June 2022) |
|---|---|---|
| PlantVillage[14] | 54,305 | 516 |
| BRACOL[17] | 4,407 | 11 |
| Plant Pathology[18] | 3,651 | 33 |
| DiaMOS Plant[19] | 3,505 | 1 |
| RoCoLe[20] | 1,560 | 28 |
| Citrus[21] | 750 | 77 |
| Rice Leaf Diseases[22] | 120 | 129 |
Mohanty et al.[15] realized that the convolution neural network they developed using the PlantVillage dataset experienced a significant drop in accuracy from 99% to 31% when tested on other online datasets. They claimed that increasing the number and variability of the dataset would be sufficient to overcome this problem. However, it is also possible that such a vast drop indicates an inherent dataset bias issue. If this is the case, collecting more data will not improve performance.
Dataset bias sources such as background bias and capture bias are well documented in machine learning[23, 24]. There is a strong relationship between the environment and the objects in it. For example, an aquatic animal is expected to be found around a body of water. When photographs capture the real world, this effect manifests itself as a correlation between the background and the foreground. Machine learning models may exploit this relationship to predict class labels[25]. It has been shown that even humans use the background-foreground relationship to make sense of the objects[26]. This relationship is called background bias. PlantVillage dataset has a uniform background with no contextual correlation with the foreground (the leaf). Therefore, background bias is not expected in the PlantVillage dataset. In fact, when Mohanty et al.[15] removed the background, the model performance dropped less than 1%. Another common bias source, capture bias[23, 24], emerges from the device used for data collection, collector preferences, and illumination. It affects both the foreground and the background. Therefore, even though background bias is not expected in the PlantVillage dataset, a model can still exploit the background for making predictions due to capture bias. Moreover, removing the background will not be enough since capture bias is also present in the foreground.
This study was performed to investigate and quantify the amount of dataset bias in the most popular public plant disease dataset, PlantVillage. By training a model using a fraction of the background, we were able to show that there is significant capture bias associated with this dataset. We also showed that removing the background does not remove the bias. This issue should be kept in mind by the current and future users of this and similar datasets.
2 Methods
Section 2.1-2.5 describe the datasets used in this paper. Section 2.6 explains the machine learning model development.
2.1 PlantVillage dataset
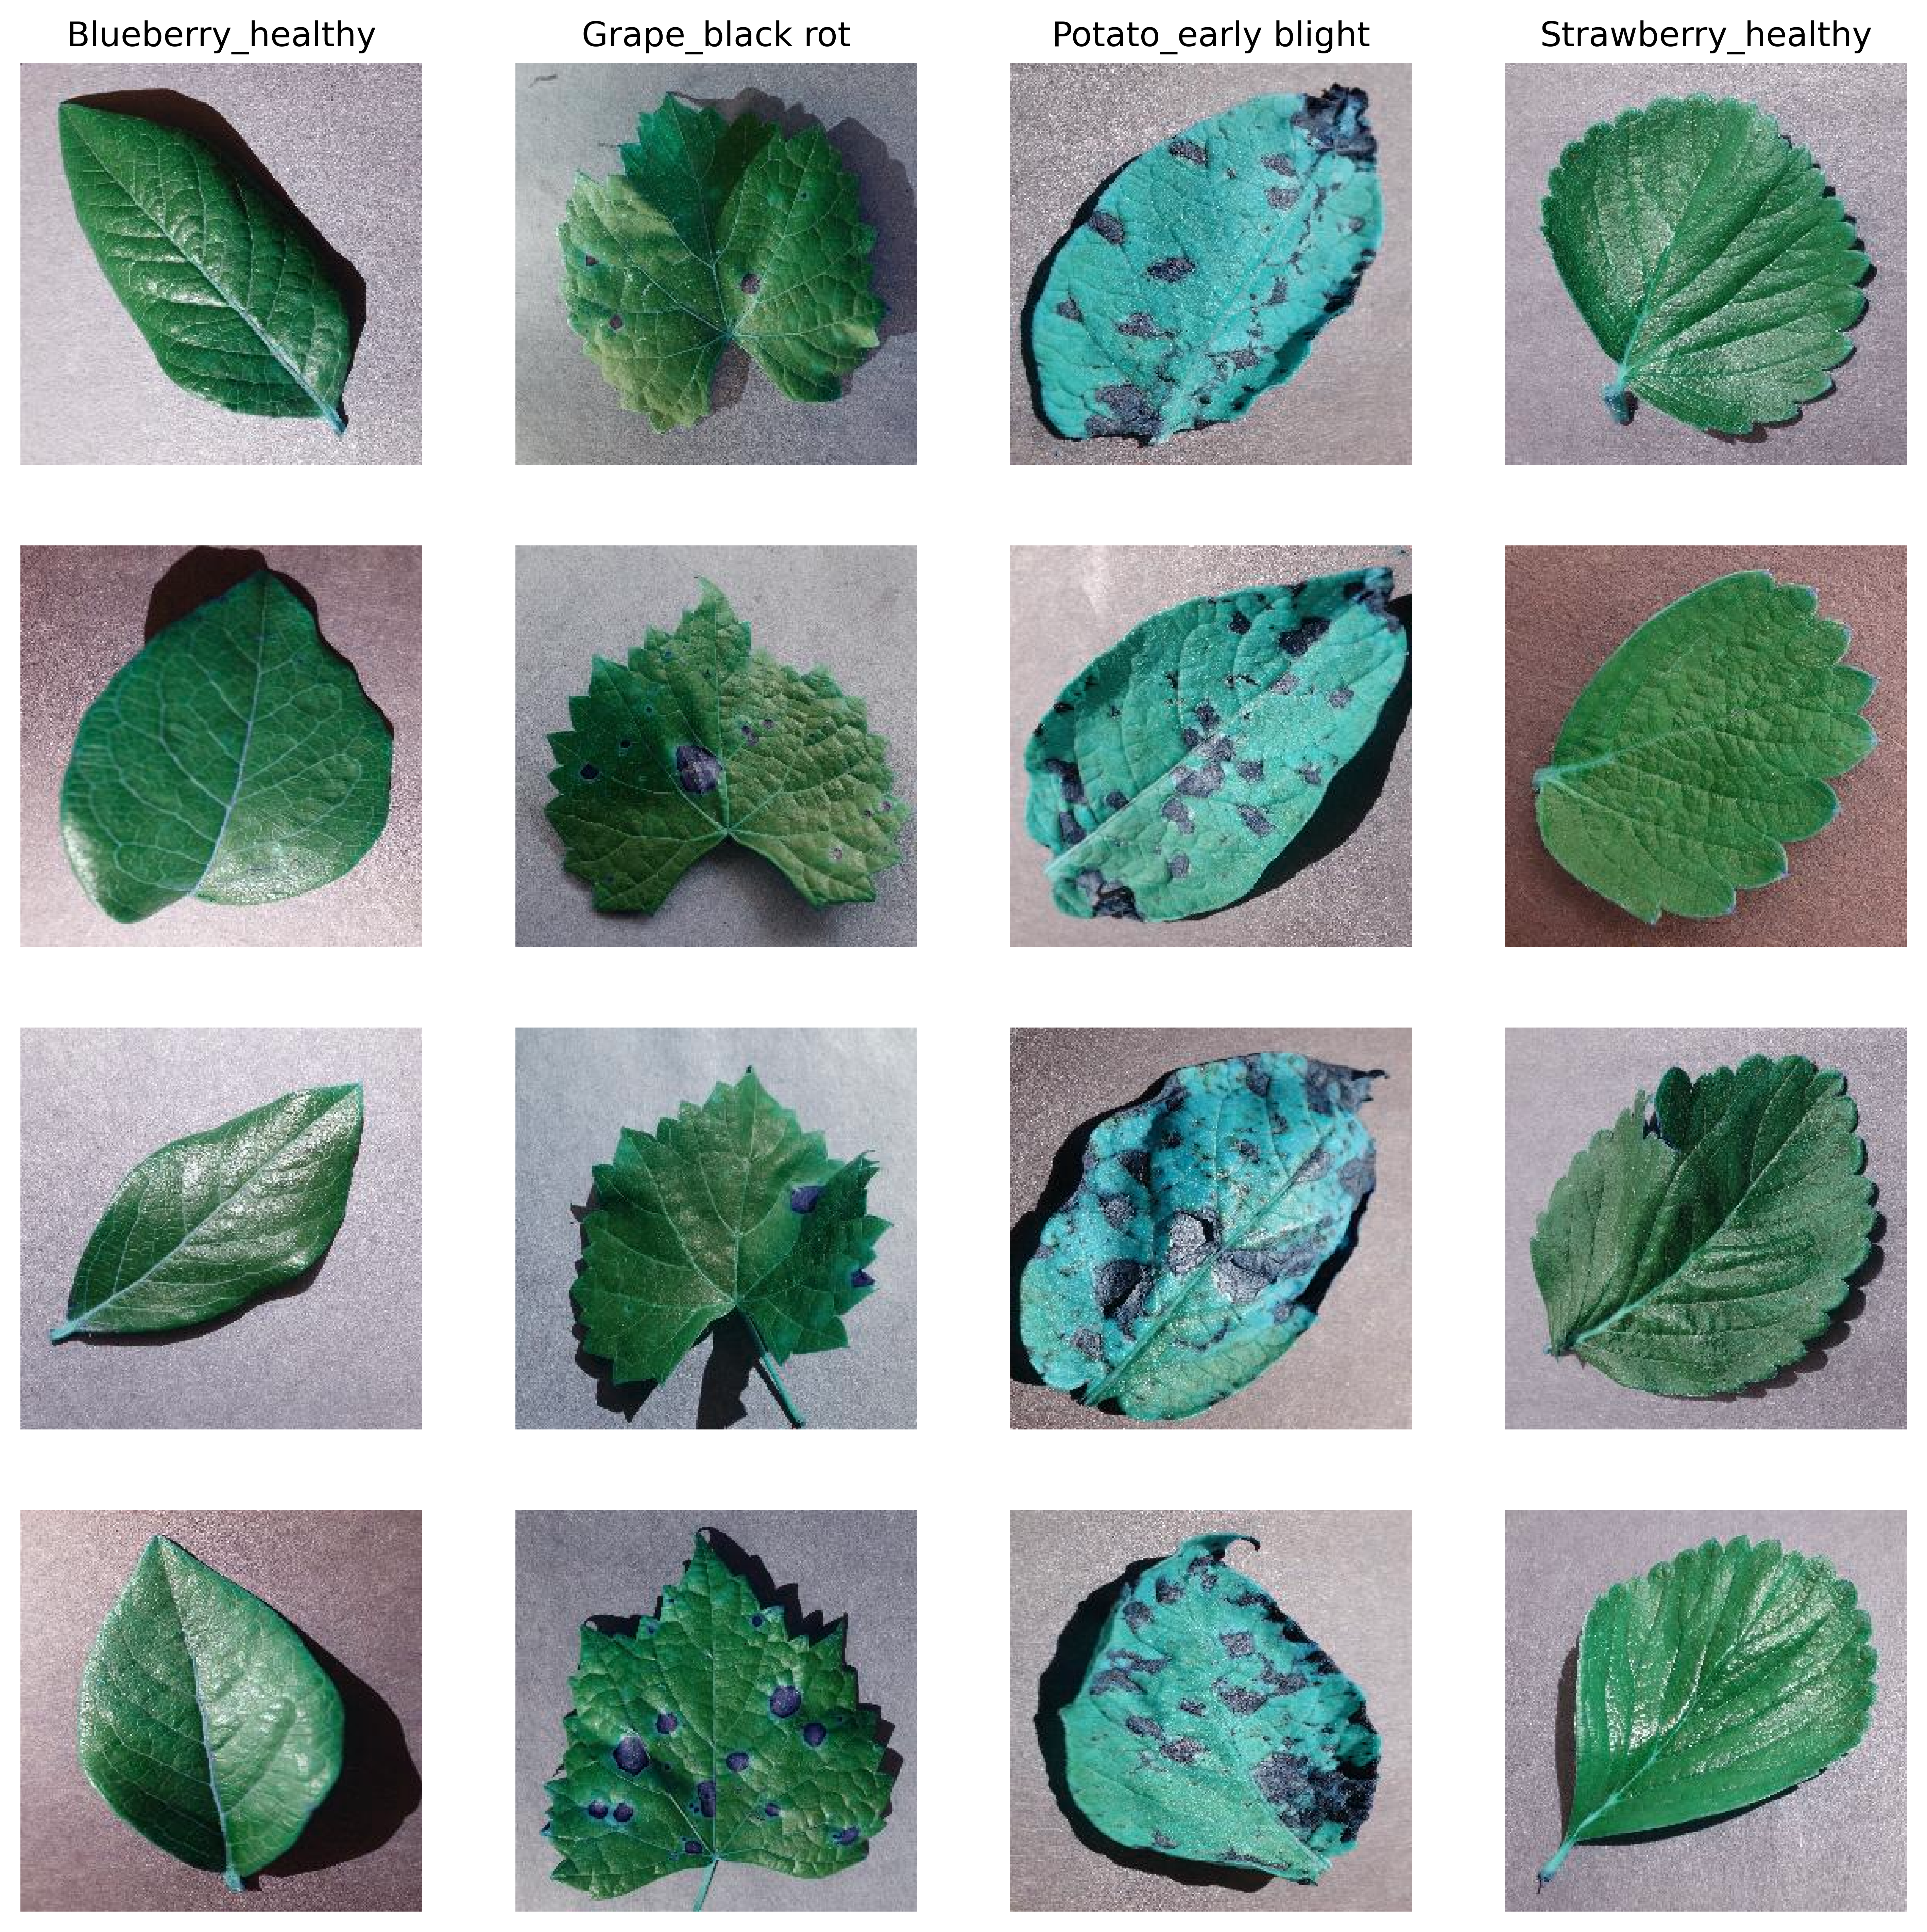
The PlantVillage dataset contains 54,305 single leaf images (256 px2, RGB) from 14 crop species (Figure 1). There are 38 classes named as species disease or species healthy (Table 2). The leaves were removed from the plant, placed against a grey or black background, and photographed outdoors with a single digital camera on sunny or cloudy days. Many researchers developed models based on the PlantVillage dataset and reported accuracies above 98% (Table 3). In this paper, we used the version of the dataset shared by Mohanty et al., which contains the original images, grayscale images and images without the backgrounds[15].
| Apple_apple scab | Grape_leaf blight | Strawberry_leaf scorch |
| Apple_blackrot | Grape_healthy | Strawberry_healthy |
| Apple_cedar apple rust | Orange_huanglongbing | Tomato_bacterial spot |
| Apple_healthy | Peach_bacterial spot | Tomato_early blight |
| Blueberry_healthy | Peach_healthy | Tomato_late blight |
| Cherry_powdery mildew | Bell Pepper_bacterial spot | Tomato_leaf mold |
| Cherry_healthy | Bell Pepper_healthy | Tomato_septoria leaf spot |
| Corn_gray leaf spot | Potato_early blight | Tomato_spider mites |
| Corn_common rust | Potato_late blight | Tomato_target spot |
| Corn_northern leaf blight | Potato_healthy | Tomato_tomato yellow leaf curl virus |
| Corn_healthy | Raspberry_healthy | Tomato_tomato mosaic virus |
| Grape_black rot | Soybean_healthy | Tomato_healthy |
| Grape_esca | Squash_powdery mildew |
| Reference | Dataset | Plant | Accuracy |
|---|---|---|---|
| Mohanty et al.[15] | PlantVillage | All | 99.35% |
| Too et al.[27] | PlantVillage | All | 99.75% |
| Ferentinos et al.[16] | PlantVillage extension | All | 99.53% |
| Zhang et al.[28] | PlantVillage extension | Maize | 98.9% |
2.2 PlantVillage extensions
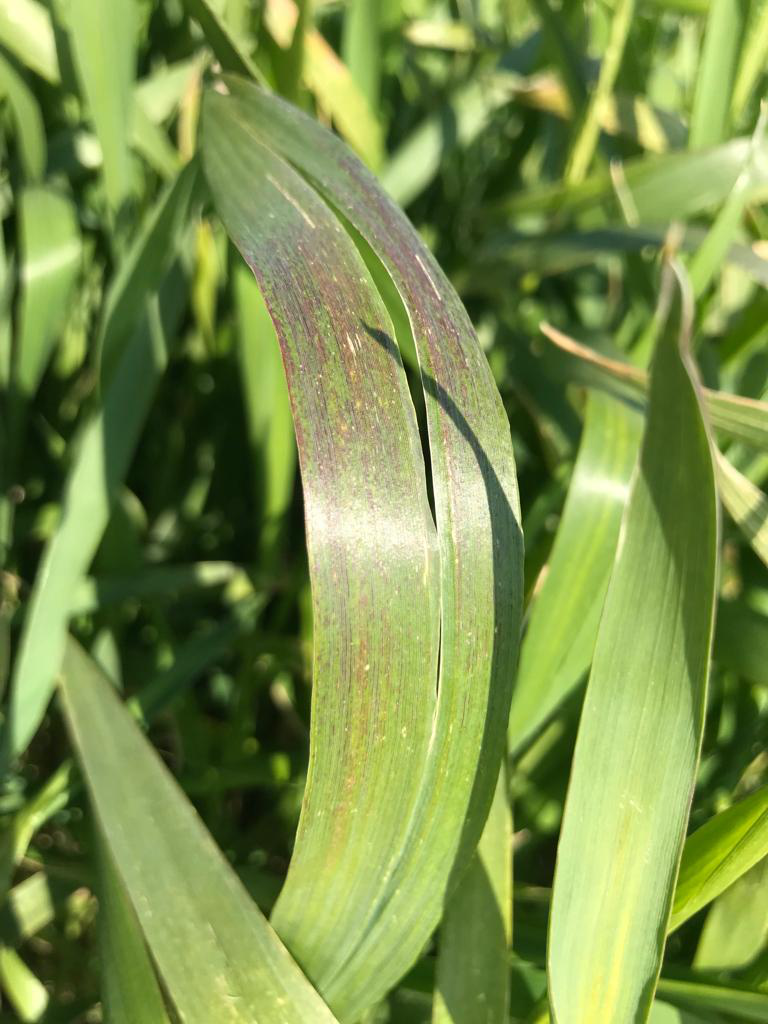
A common criticism[19] of the PlantVillage dataset is that a single leaf on a black/gray background does not represent an image taken in the field (Figure S1). Therefore, some researchers extended the PlantVillage dataset with field data or images collected from other online databases (Table 3). However, adding new images does not guarantee to eliminate the bias; on the contrary, it can introduce additional biases.
2.3 PlantVillage_8px
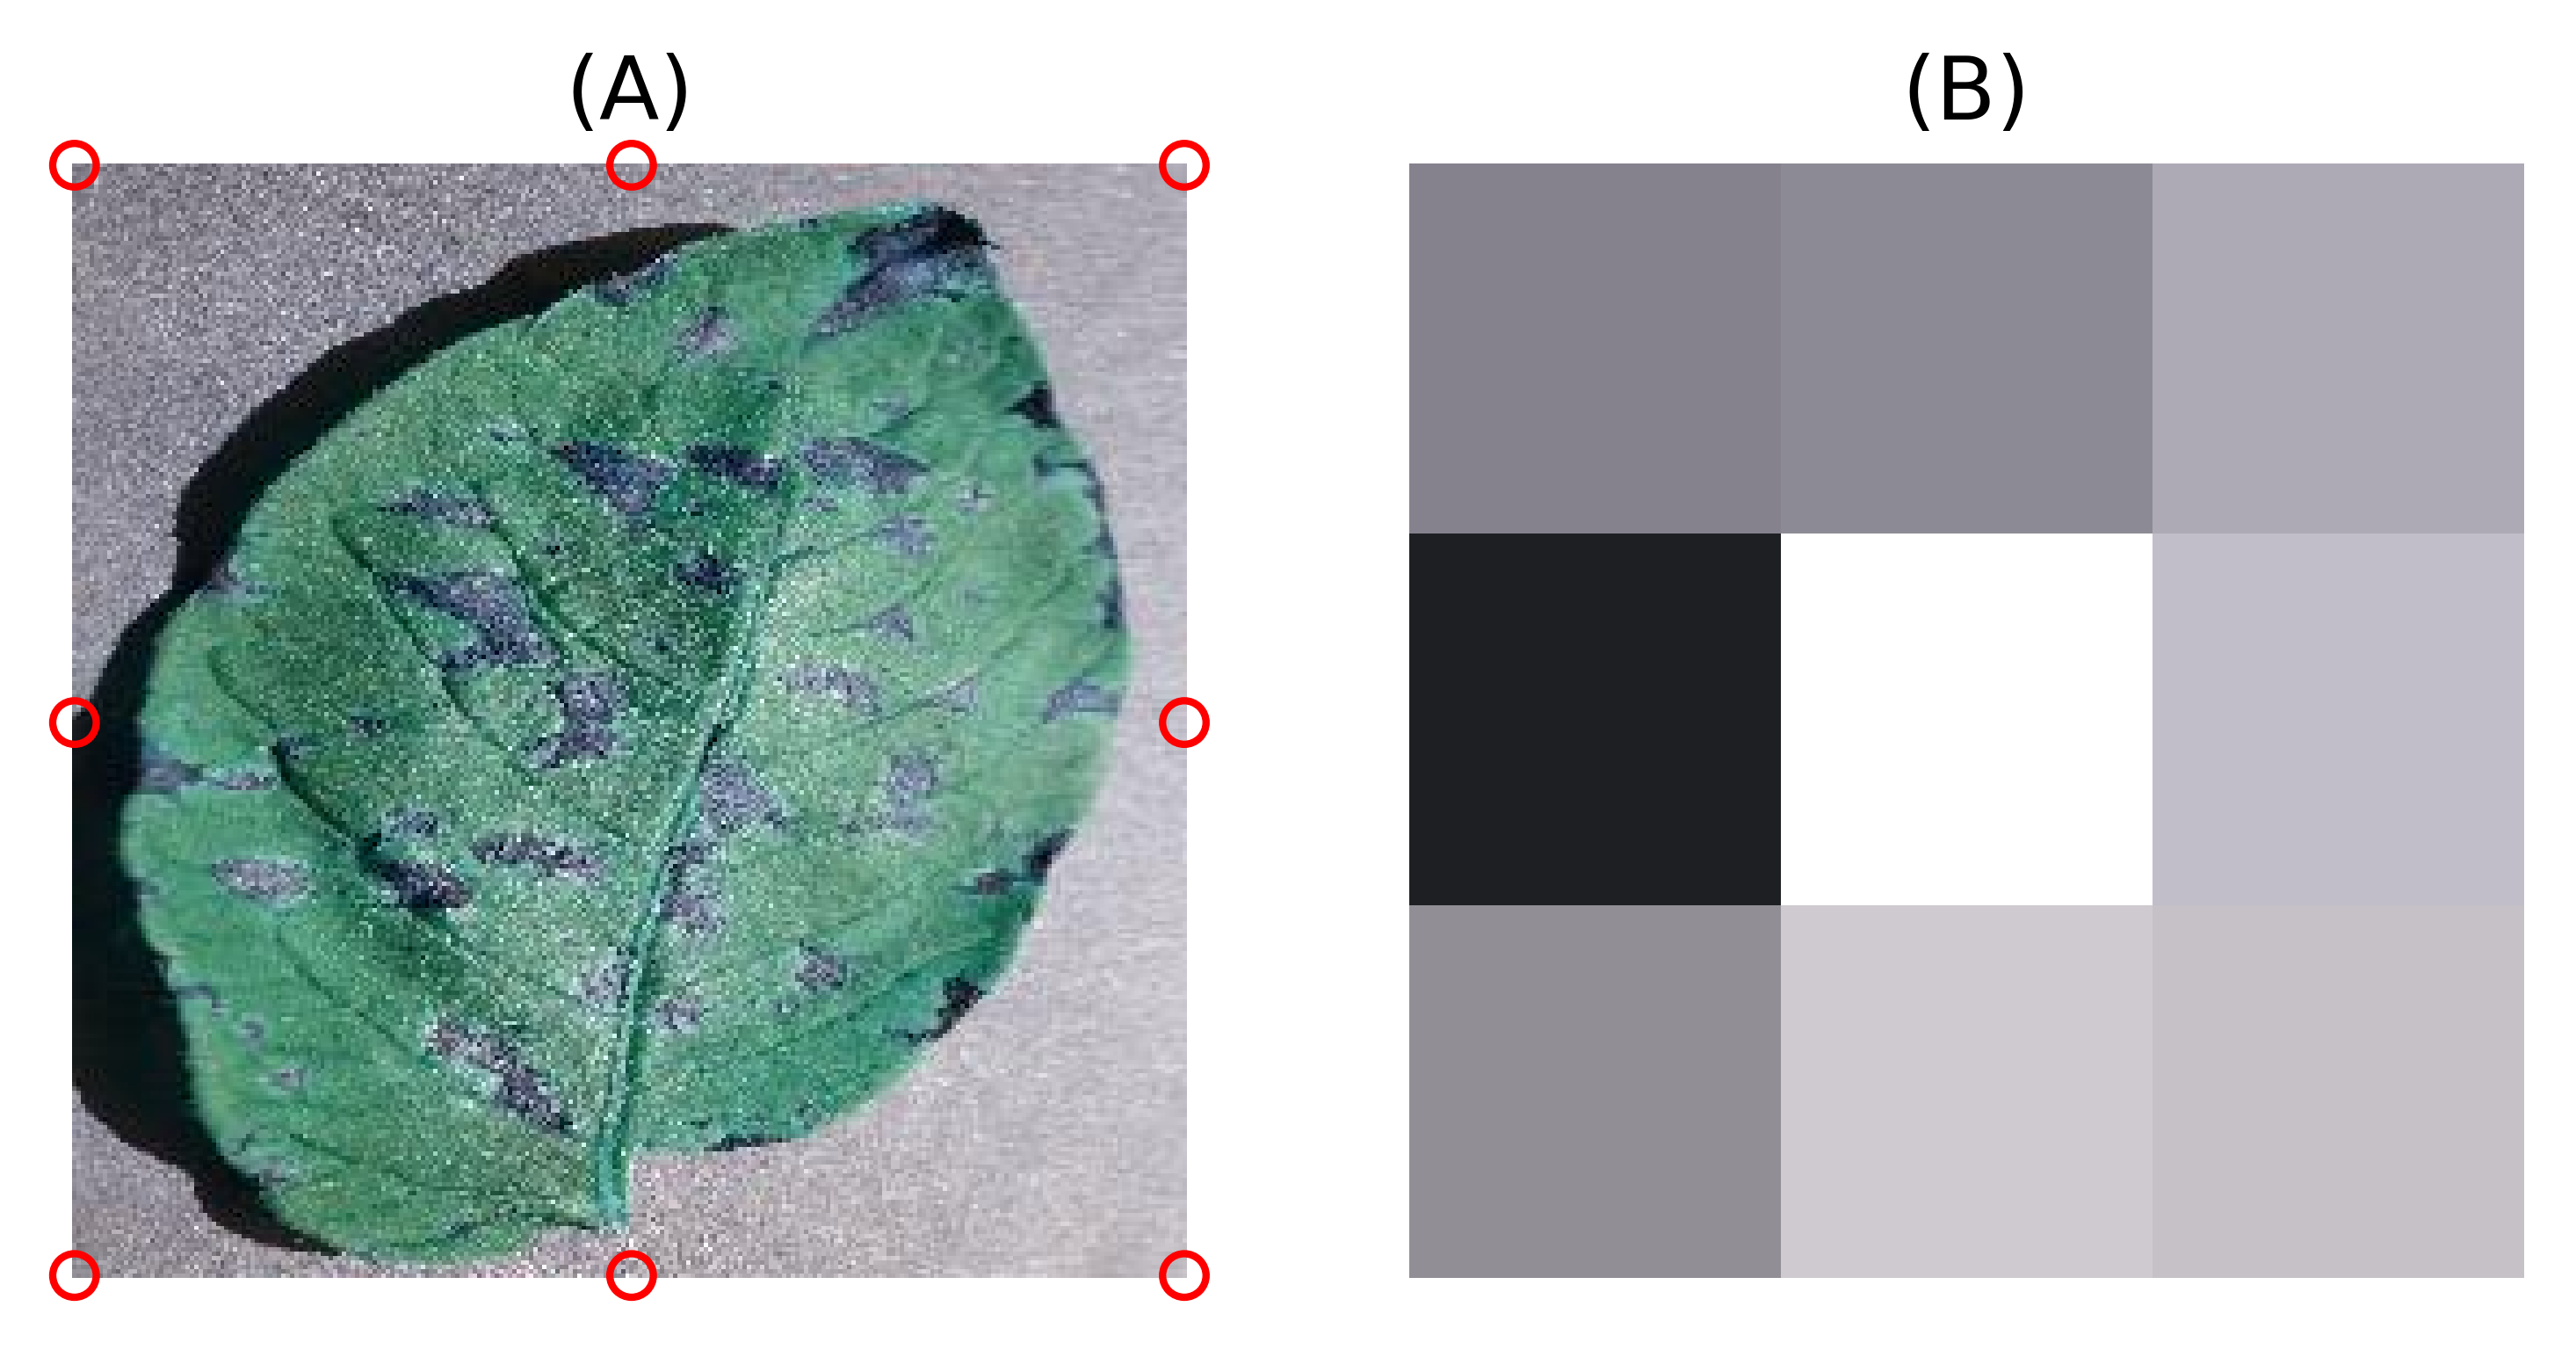
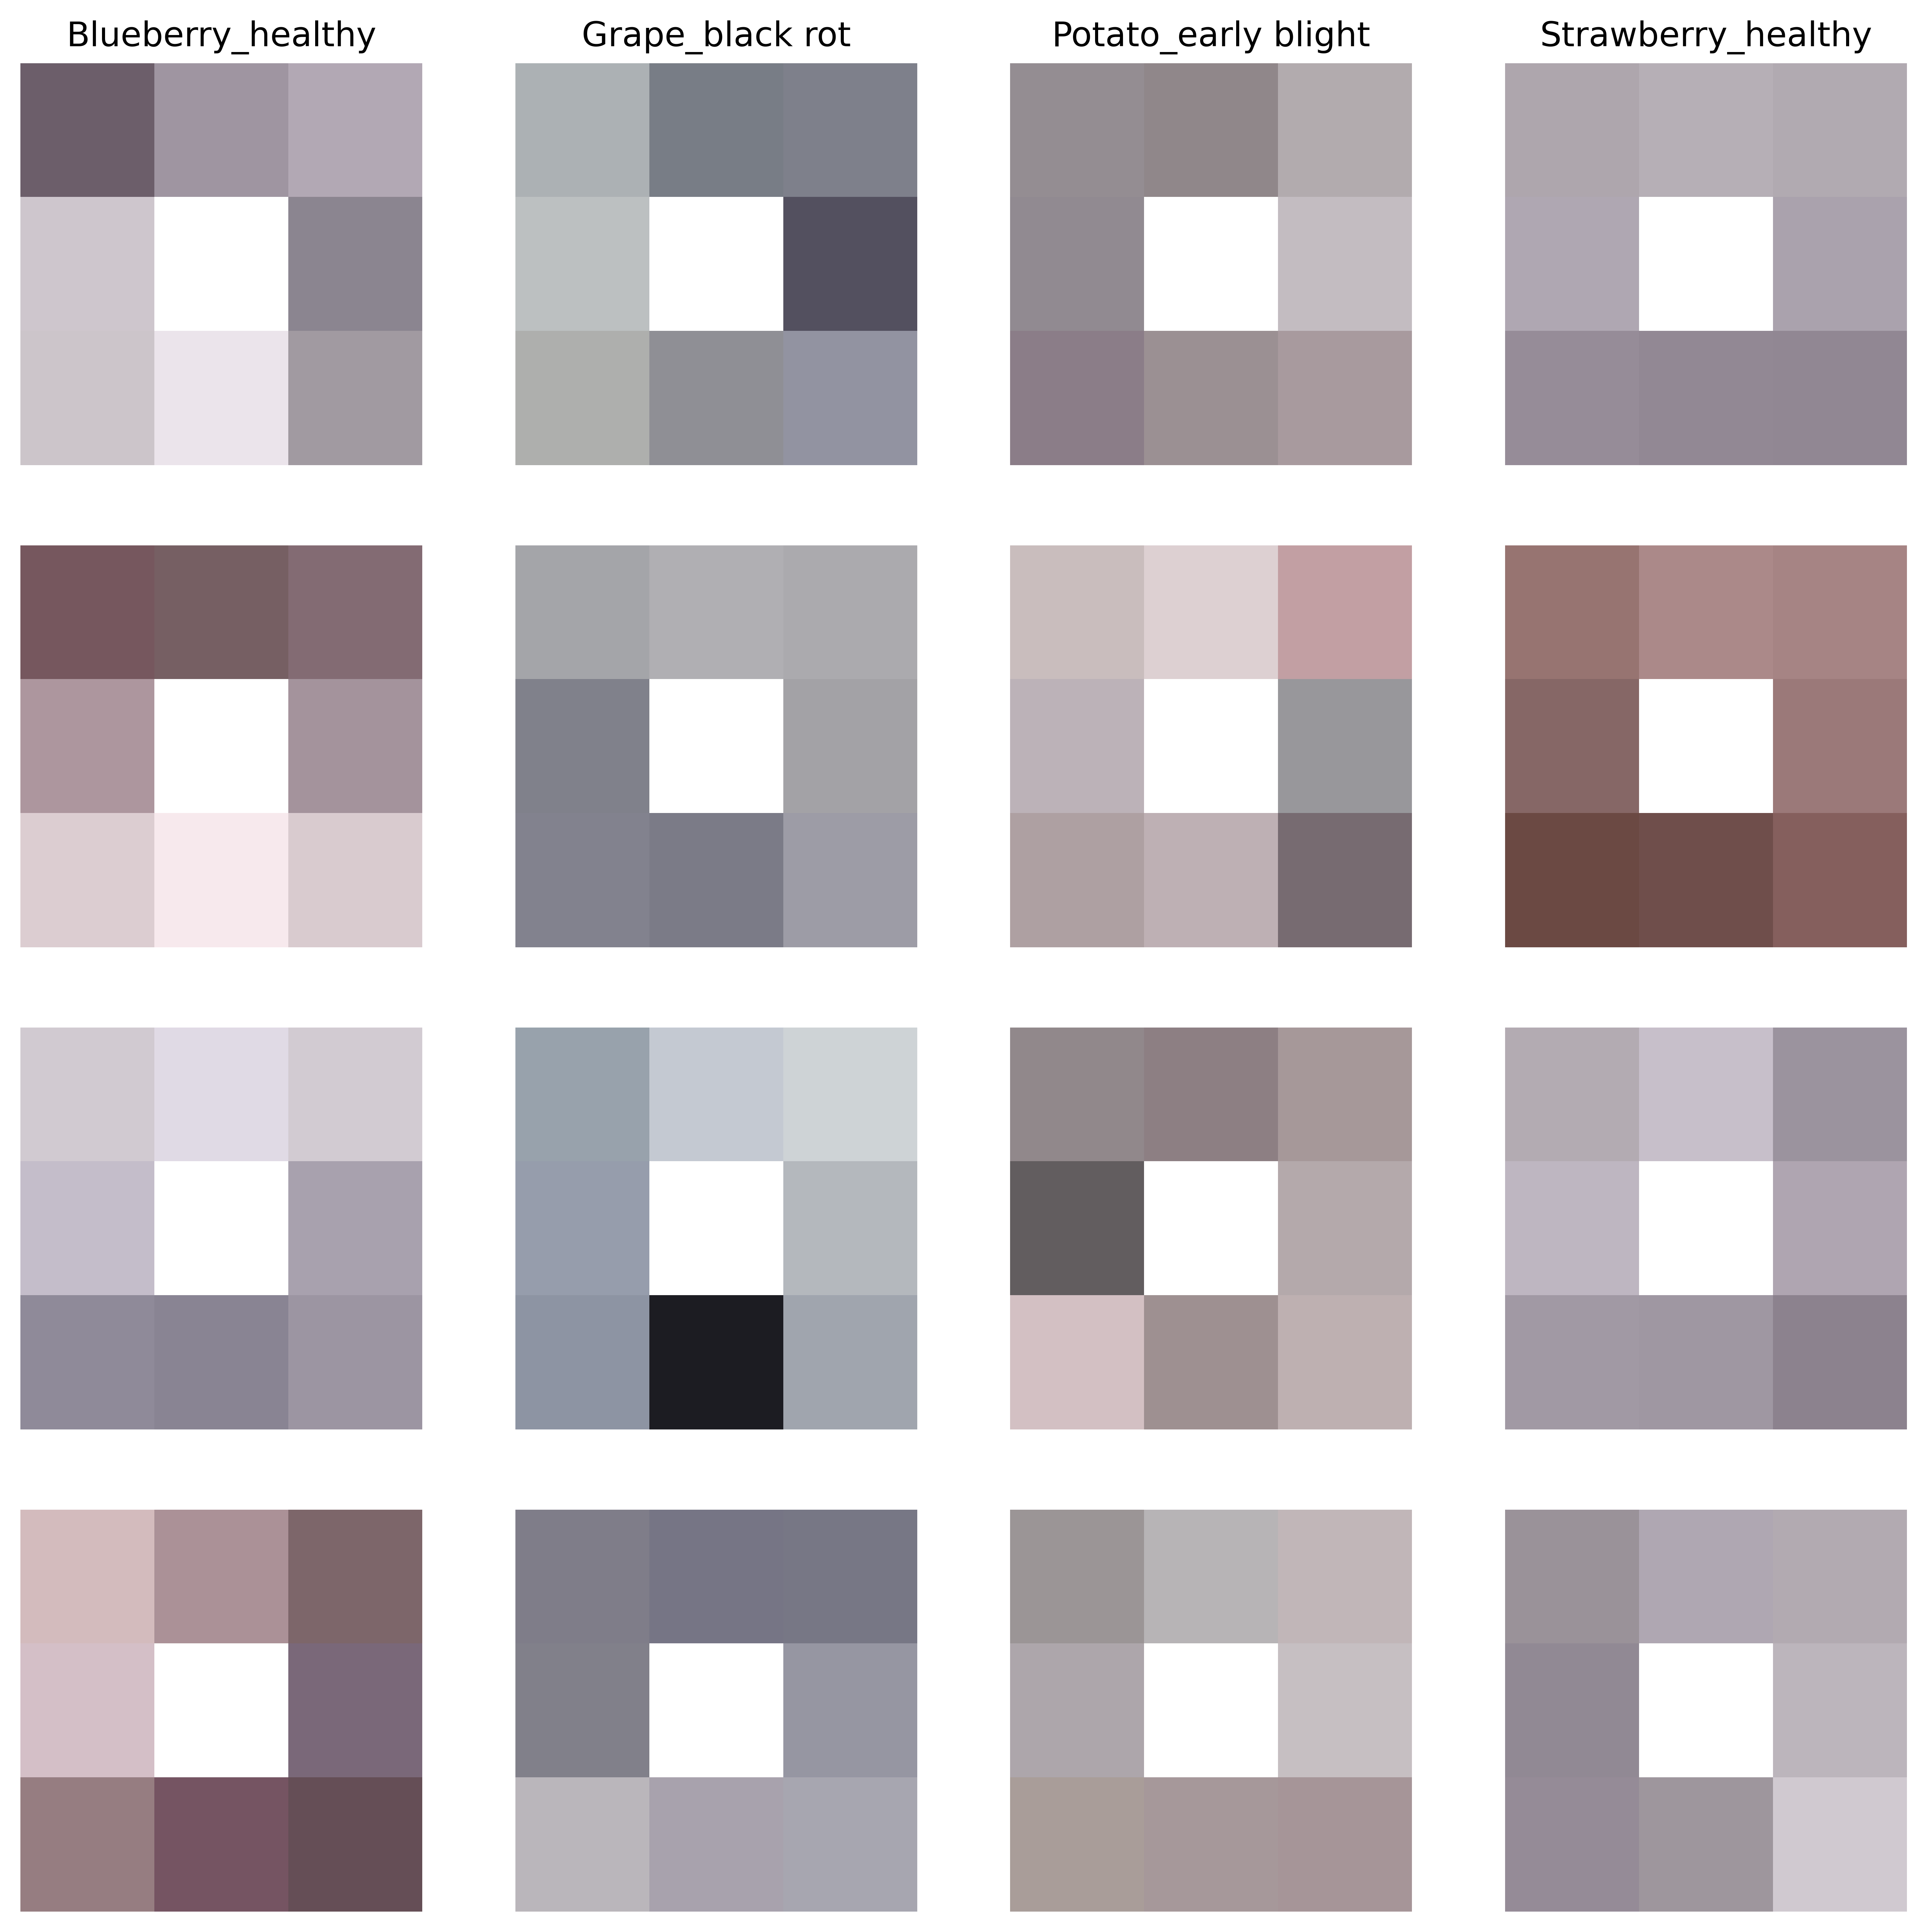
There are multiple ways to separate the background and the foreground[25]. We devised a transformation that uses a fraction of the background pixels. It extracts 8 pixels from the original image, four from the corners and four from the centers of the sides. An example transformation can be seen in Figure 2. This transformation was applied to all images of the PlantVillage dataset (Figure 1) to create the PlantVillage_8px dataset (Figure 3). As can be seen, PlantVillage_8px contains zero information about diseases (the signal). It only includes information on the background color and capture conditions, which is pure noise in terms of plant diseases. Moreover, 8 pixels correspond to less than 0.1% of the whole background.
2.4 MNIST_8px
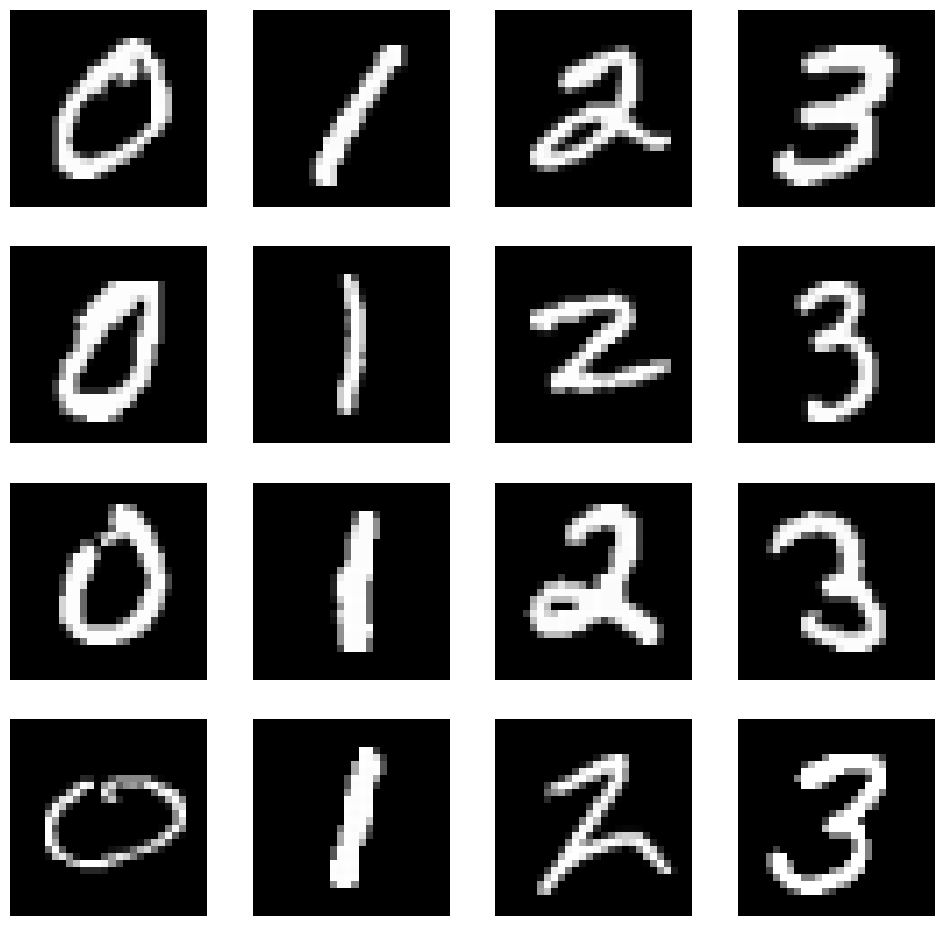
MNIST is a dataset containing 28 px2 grayscale handwritten digit images (Figure S2). Digits are centered, and the backgrounds are uniform. The 8-pixel transformation described in Figure 3 was applied to MNIST, resulting in the MNIST_8px dataset. The background in this dataset does not contain background bias or capture bias; therefore, it will be used as an ideal case comparison.
2.5 PlantVillage_blur
Blur is an image quality metric that is part of the capture conditions. It is expected to be similar across the classes. In order to quantify the effect of background removal on capture bias, we used blur as a predictor before and after background removal. The data repository contained the PlantVillage dataset and the foregrounds (PlantVillage_fg). By subtracting the foregrounds from the PlantVillage dataset, we obtained the backgrounds as well (PlantVillage_bg). We measured the blur of every image in all these three datasets and obtained PlantVillage_blur, PlantVillage_blur_fg, and PlantVillage_blur_bg. A summary of PlantVillage datasets can be found in Table 4.
| Dataset name | Description | Feature size |
|---|---|---|
| PlantVillage | Original dataset | 256x256 |
| PlantVillage_fg | Foregrounds of PlantVillage | 256x256 |
| PlantVillage_bg | Backgrounds of PlantVillage | 256x256 |
| PlantVillage_8px | 8 pixels from the PlantVillage | 8 |
| PlantVillage_blur | Blur values of the PlantVillage images | 1 |
| PlantVillage_fg_blur | Blur values of the PlantVillage_fg images | 1 |
| PlantVillage_bg_blur | Blur values of the PlantVillage_bg images | 1 |
2.6 Machine learning model development
In order to quantify the amount of bias in the PlantVillage dataset, we trained and tested a machine learning model on the PlantVillage_8px dataset. If there is no bias, the model should not be able to beat the random guess accuracy, which is defined as 100/number_of_classes % for a balanced dataset.
Then, to show that removing the backgrounds does not necessarily remove this bias, we trained and tested another three machine learning models on the datasets PlantVillage_blur, PlantVillage_fg_blur, and PlantVillage_bg_blur. If background removal indeed helps, the bias contained in the PlantVillage_fg_blur should be much less than PlantVillage_blur and PlantVillage_bg_blur.
We used scikit-learn’s random forest classifier implementation with default hyperparameters to train all four models[29]. To be comparable with other works that developed models on PlantVillage, all four datasets were randomly split into a training set (80%) and a test set (20%). Classification accuracy was used to evaluate model performance.
3 Results and Discussion
Table 5 shows the result of our model on the PlantVillage_8px dataset. It reached 49.0% classification accuracy on the test set, well above random guess performance (100/38 = 2.6 %). On the MNIST_8px dataset, the same model obtained 11.7% accuracy, which is roughly equal to the random guess performance (100/10 = 10%).
These results indicate significant dataset bias in the PlantVillage dataset. Since the foregrounds and the backgrounds are not correlated contextually, minimal background bias is expected. Therefore, capture bias must be the main reason for the dataset bias. This means that the models developed on this dataset will experience significant performance drops even on new datasets collected on similar conditions, let alone field data. Note that this underestimates the dataset bias because capture bias influences both the background and foreground, whereas the model used only a fraction of the background. Moreover, the random forest model was trained with the default hyperparameters without any tuning to improve its performance.
| Dataset name | Random guess accuracy | Random Forest Model |
|---|---|---|
| PlantVillage_8px | 2.6% | 49.0% |
| MNIST_8px | 10% | 11.7% |
To eliminate this bias, Mohanty et al.[15] removed the backgrounds and trained a model with only foregrounds. However, our experiment shows that background removal does not eliminate the bias, PlantVillage_fg_blur contains an amount of bias similar to the datasets with backgrounds (Table 6). Capture bias (in this case blur) influences both the foreground and background.
| PlantVillage_blur | PlantVillage_fg_blur | PlantVillage_bg_blur | Random guess accuracy |
| 11.7% | 10.0% | 10.8% | 2.6% |
Extending this dataset with new images can indeed alleviate the issue, but only if great care is taken. One of the most famous studies with an extended PlantVillage dataset is reported by Ferentinos et al.[16]. The dataset is not open, but the collection procedure described in the paper suggests that it introduces yet another bias. They extended the classes from 38 to 58. Unfortunately, 31% of the classes were purely field data, whereas 48% of the classes were collected purely from the laboratory (Table 7). Therefore, the model will learn the difference between the field images and laboratory images to distinguish between these classes easily.
| Source | Number of classes (%) |
|---|---|
| Field conditions | 18 (31%) |
| Laboratory conditions | 28 (48%) |
| Mixed | 12 (21%) |
At the end of the day, the best way to deal with a biased dataset is to avoid collecting it in the first place. Design of Experiments, a branch of statistics, laid out the principles of efficient and proper data collection[30]. The salient idea is to determine the noise factors before data collection and ensure they are either controlled for or randomized. If one must work with a biased dataset, the first step is to understand the bias sources and quantify them. Once this is done, bias can be decreased by either removing it or negating it with additional data collection. The most critical step is to collect a separate dataset that matches the use case and report the model performance on this dataset. This will provide a reliable estimate of the model performance.
4 Conclusions
This work identified and quantified the dataset bias in the PlantVillage dataset. Unfortunately, removing backgrounds or haphazardly adding data cannot eliminate this bias. Therefore, researchers should be careful when using this dataset and the models developed on this dataset for their future research and applications.
References
- [1] A. J. Haverkort, P. M. Boonekamp, R. Hutten, E. Jacobsen, L. A. P. Lotz, G. J. T. Kessel, R. G. F. Visser, and E. A. G. Van Der Vossen, “Societal Costs of Late Blight in Potato and Prospects of Durable Resistance Through Cisgenic Modification,” Potato Research, vol. 51, pp. 47–57, 2008.
- [2] S. Savary, L. Willocquet, S. J. Pethybridge, P. Esker, N. McRoberts, and A. Nelson, “The global burden of pathogens and pests on major food crops,” Nature Ecology and Evolution, vol. 3, pp. 430–439, mar 2019.
- [3] E. C. Oerke, “Crop losses to pests,” The Journal of Agricultural Science, vol. 144, pp. 31–43, feb 2006.
- [4] F. Martinelli, R. Scalenghe, S. Davino, S. Panno, G. Scuderi, P. Ruisi, P. Villa, D. Stroppiana, M. Boschetti, and L. R. Goulart, “Advanced methods of plant disease detection. A review Advanced methods of plant disease detection. A review.,” Agronomy for Sustainable Development, vol. 35, pp. 1–25, 2015.
- [5] Z. Li, R. Paul, T. B. Tis, A. C. Saville, J. C. Hansel, T. Yu, J. B. Ristaino, and Q. Wei, “Non-invasive plant disease diagnostics enabled by smartphone-based fingerprinting of leaf volatiles,” Nature Plants, vol. 5, pp. 856–866, 2019.
- [6] K.-Y. Huang, “Application of artificial neural network for detecting Phalaenopsis seedling diseases using color and texture features,” Computers and Electronics in Agriculture, vol. 57, pp. 3–11, may 2007.
- [7] D. Ciregan, U. Meier, and J. Schmidhuber, “Multi-column Deep Neural Networks for Image Classification,” CVPR, pp. 3642–3649, feb 2012.
- [8] A. Krizhevsky, I. Sutskever, and G. E. Hinton, “ImageNet Classification with Deep Convolutional Neural Networks,” NIPS, vol. 25, 2012.
- [9] M. A. Noyan, M. Durdu, and A. H. Eskiocak, “TzanckNet: a convolutional neural network to identify cells in the cytology of erosive-vesiculobullous diseases,” Scientific Reports, vol. 10, oct 2020.
- [10] R. Hussain, M. Alican Noyan, G. Woyessa, R. R. Retamal Marín, P. Antonio Martinez, F. M. Mahdi, V. Finazzi, T. A. Hazlehurst, T. N. Hunter, T. Coll, M. Stintz, F. Muller, G. Chalkias, and V. Pruneri, “An ultra-compact particle size analyser using a CMOS image sensor and machine learning,” Light: Science & Applications, vol. 9, feb 2020.
- [11] J. Li, J. Peng, X. Jiang, A. C. Rea, J. Peng, and J. Hu, “DeepLearnMOR: a deep-learning framework for fluorescence image-based classification of organelle morphology,” Plant physiology, vol. 186, pp. 1786–1799, aug 2021.
- [12] V. Lube, M. A. Noyan, A. Przybysz, K. Salama, and I. Blilou, “MultipleXLab: A high-throughput portable live-imaging root phenotyping platform using deep learning and computer vision,” Plant Methods, vol. 18, pp. 1–22, dec 2022.
- [13] L. Han, G. Yang, H. Dai, B. Xu, H. Yang, H. Feng, Z. Li, and X. Yang, “Modeling maize above-ground biomass based on machine learning approaches using UAV remote-sensing data,” Plant Methods, vol. 15, pp. 1–19, feb 2019.
- [14] D. P. Hughes and M. Salathe, “An open access repository of images on plant health to enable the development of mobile disease diagnostics,” arXiv preprint, nov 2015.
- [15] S. P. Mohanty, D. P. Hughes, and M. Salathé, “Using deep learning for image-based plant disease detection,” Frontiers in Plant Science, vol. 7, p. 1419, sep 2016.
- [16] K. P. Ferentinos, “Deep learning models for plant disease detection and diagnosis,” Computers and Electronics in Agriculture, vol. 145, pp. 311–318, feb 2018.
- [17] R. Krohling, J. Esgario, and J. A. Ventura, “BRACOL - A Brazilian Arabica Coffee Leaf images dataset to identification and quantification of coffee diseases and pests,” Mendeley Data, vol. 1, 2019.
- [18] R. Thapa, K. Zhang, N. Snavely, S. Belongie, and A. Khan, “The Plant Pathology Challenge 2020 data set to classify foliar disease of apples,” Applications in Plant Sciences, vol. 8, sep 2020.
- [19] G. Fenu and F. M. Malloci, “DiaMOS Plant: A Dataset for Diagnosis and Monitoring Plant Disease,” Agronomy, vol. 11, oct 2021.
- [20] J. Parraga-Alava, K. Cusme, A. Loor, and E. Santander, “RoCoLe: A robusta coffee leaf images dataset for evaluation of machine learning based methods in plant diseases recognition,” Data in Brief, vol. 25, aug 2019.
- [21] H. T. Rauf, B. A. Saleem, M. I. U. Lali, M. A. Khan, M. Sharif, and S. A. C. Bukhari, “A citrus fruits and leaves dataset for detection and classification of citrus diseases through machine learning,” Data in Brief, vol. 26, oct 2019.
- [22] H. B. Prajapati, J. P. Shah, and V. K. Dabhi, “Detection and classification of rice plant diseases,” Intelligent Decision Technologies, vol. 11, pp. 357–373, jan 2017.
- [23] A. Torralba and A. A. Efros, “Unbiased Look at Dataset Bias,” CVPR, 2011.
- [24] T. Tommasi, N. Patricia, B. Caputo, and T. Tuytelaars, “A Deeper Look at Dataset Bias,” arXiv preprint, may 2015.
- [25] K. Xiao, L. Engstrom, A. Ilyas, and A. Madry, “Noise or Signal: The Role of Image Backgrounds in Object Recognition,” arXiv preprint, jun 2020.
- [26] A. Torralba, “Contextual Priming for Object Detection,” International Journal of Computer Vision, vol. 53, no. 2, 2003.
- [27] E. C. Too, L. Yujian, S. Njuki, and L. Yingchun, “A comparative study of fine-tuning deep learning models for plant disease identification,” Computers and Electronics in Agriculture, vol. 161, pp. 272–279, jun 2019.
- [28] X. Zhang, Y. Qiao, F. Meng, C. Fan, and M. Zhang, “Identification of maize leaf diseases using improved deep convolutional neural networks,” IEEE Access, vol. 6, 2018.
- [29] F. Pedregosa, G. Varoquaux, A. Gramfort, V. Michel, B. Thirion, O. Grisel, M. Blondel, P. Prettenhofer, R. Weiss, V. Dubourg, J. Vanderplas, A. Passos, and D. Cournapeau, “Scikit-learn: Machine Learning in Python,” Journal of Machine Learning Research, vol. 12, pp. 2825–2830, 2011.
- [30] D. C. Montgomery, Design and Analysis of Experiments. John Wiley & Sons, 10 ed., 2019.
5 Supplementary Information