Probing shapes of microbes using liquid crystal textures
Abstract
We propose a novel technique to probe shape of a single microbe embedded in a nematic liquid crystal (NLC) sample by observing geometry of dark brushes with optical microscope using a cross-polarizer set up. Assuming certain anchoring conditions for the NLC director at the surface of the microbe, we determine the resulting shapes of brushes using numerical simulations. Our results suggest that for asymmetrical microbes (such as cylindrical shaped bacteria/viruses), resulting brushes may carry the imprints of this asymmetry (e.g. the aspect ratio of cylindrical shape) at relatively large distances to be able to be seen using simple optical microscopy even for microbe sizes in few tens to few hundred nanometer range.
pacs:
PACS numbers: 61.30.Jf, 61.30.Gd, 07.60.PbKey words: Topological Defects, Liquid Crystals, microbes
I Introduction
Topological defects arise in a variety of physical systems. Vortices in superfluid helium, flux tubes in superconductors, monopoles and strings in liquid crystals are some examples of topological defects. A remarkable property of these objects originates from the word topology itself which refers to global properties of the relevant system. Topological defects in a system have global signature, even if the actual core of the defect may be microscopic. The stability of these objects stems from some topological invariant, such as the winding number of vortices or monopoles which refers to winding of some order parameter field in the order parameter space as one traces a closed curve (or surface, for monopoles) in the physical space. Topological defect present at some point leads to non-zero value of this winding number along a closed loop (or surface) in the physical space, irrespective of the size of such a loop (surface). Thus, in principle, presence of topological defect can be detected by making measurements very far from the defect, never ever going close to the defect core itself. However, for many cases, measurement of this winding number, by actually tracing the winding of the order parameter field is not possible. This is the situation for superfluid helium and superconductors where the relevant degree of freedom of the order parameter field relates to the phase of some quantum wave function which is not directly detectable.
The situation is very different for topological defects in liquid crystals. here the winding refers to actual rotation of local ordering of (say, rod like) molecules which can be directly determined using optical microscope and a cross-polarizer set-up due to birefringence of liquid crystalline phase books . Observations of liquid crystal defects with such a system is routinely carried out and typically topological defects are identified in terms of dark brushes originating from the location of defect core. A non-zero winding of the order parameter (the director, which refers to the local orientation of liquid crystal ordering) around the core of the defect extends to all regions enclosing the defect, resulting in brushes extending to the edge of the entire system (for a single isolated defect), allowing for easy observation using optical microscope. For typical liquid crystal defects, the core size can be of order tens of nanometers, which obviously cannot be seen with an optical microscope. But the dark brushes emanating from such a defect, being macroscopic, are easily seen, and geometry/topology of these brushes allows for identification of the defect core (including the sign of defect using rotation of the sample under microscope and observing the sense of rotation of brushes books ).
The crucial element of this topological information is the orientation of the director at the core. Thus, for example for monopoles (hedgehogs) in nematic liquid crystals (NLC), the director points radially outward at the surface of a spherical core. Thus, the director at the surface of the core traces a non-trivial winding on the order parameter space (which is RP2 for nematics). This non-trivial winding, being topological, extends to all closed surfaces enclosing the hedgehog, and is identified easily in terms of four dark brushes originating from a point like region when viewed with cross-polarizer set-up in an optical microscope. It is then obvious that exactly the same structure of brushes will result if there was a microscopic spherical object (say of similar size as the core of hedgehog, or bigger) on whose surface the director assumes normal boundary condition. Liquid crystal order parameter, the director, typically anchors at some fixed angles on surfaces of external objects (or, even medium such as NLC-air interface). Many surfaces allow normal boundary conditions. Though, with little thought, it will be obvious that any close-to-normal anchoring angle will lead to exactly the same situation, as long as the director does not become almost tangential to the surface. Another important point here is the size of the object. For extremely tiny objects, the gradient energy of the winding may be too large so that it may become energetically favorable for the order parameter to assume small (or vanishing) value at the surface. In that case no winding number will be generated at the surface and one will not expect any brushes to result. Such energetic balance is precisely what determines the core size of a topological defect. Thus, one will expect that as long as the size of the object is bigger than the typical size of the core of a topological defect, one will expect a normal (or close to normal) boundary condition for director anchoring to lead to non-trivial brushes. One can then use these brushes to detect presence of such a foreign object in the liquid crystal sample.
The above discussion also suggests the following possibility. Consider a foreign object of solid cylindrical shape immersed in an NLC sample. Assume normal boundary conditions (for simplicity) for the director at the surface of this object. The surface of solid cylinder is homeomorphic (topologically equivalent) to the surface of a 2-sphere (S2). Thus one expects the same topology of four dark brushes originating from this object with the cross-polarizer set-up. However, the geometry/shape of these brushes need not be the same as for the spherical body case. In fact, for a relatively long cylinder (compared to the diameter of the circular cross-section) one expects some sort of flat bands to originate from the surface along the length of the cylinder, while sort of conical brushes to originate from the circular disks at the ends of the cylinder, assuming that diameter d of the circular cross-section is much smaller compared to the length L of the cylinder. This shape asymmetry should become more pronounced for cylinders with larger aspect ratio (L/d). If this shape asymmetry survives for long distances which can be seen by optical microscope, then even for object of few tens to few hundred nanometer sizes, the aspect ratio of the object may be determined using simple optical microscopy. This can allow for easy identification of various microbes or at least narrow down various possibilities. For certain microbes, this may even lead to non-trivial topology of brushes. For example, for spiral shape bacterias, or viruses (e.g. Filoviridae viruses, such as the Ebola viruses, which form long, sometimes branched, filaments of varying shapes, with very large lengths of few thousand nanometers, with a diameter of about 100 nanometer) resulting brushes may show non-trivial patterns depending on the twists along the length of the microbe. Again, such patterns may allow easy identification of such microbes with optical microscopes.
We explore this possibility in this work using numerical simulations. Our results support the above mentioned possibility. We study brushes emanating from cylindrical shapes of different aspect ratios and study the resulting shapes of brushes. We find that the geometry of brushes retains some information about the aspect ratio of the cylindrical body to significant distances beyond the surface of the microbe, even when different dimensions of the body are in few tens to few hundred nanometer range. We also study structure of brushes emanating from spherical bodies of different radii exploring the possibility if the diameter of the sphere could be identified from optical observation of brushes. This could then help in identifying, or narrowing down possibilities, for a corona virus (though, we mention that for roughly spherical microbes, complete symmetry of brushes itself is a useful information as it can help distinguishing from general asymmetric impurities/microbes). However, we find that in this case the information about the radius of the spherical body is not reflected in the brushes at long distance, with brushes looking the same for a large range of radii, (e.g. from 30 nanometer to about 150 nanometer). We then studied the structure of brushes in the presence of electric field, with brushes folding down to two domain wall sheets emanating from the spherical body. This set-up shows some promise of determining the size of spherical body looking at close-distance observations, though it is not clear if optical microscope will be able to clearly identify such patterns. One possibility remains to be explored is whether the spikes on the surface of corona viruses can induce some non-trivial patterns in the brushes at long distances, allowing for easy identification. This possibility is very hard to explore numerically. It will be very useful if this possibility can be explored directly by carrying out experiments with immersion of corona virus in liquid crystalline samples. One important point we mention is that we carry out these simulations using parameters for a specific thermotropic nematic liquid crystal system MBBA (having critical temperature for isotropic-nematic (I-N) transition about 47.0 0C). For identification of microbes, e.g. corona virus, or bacteria, these microbes need to be immersed in the liquid crystal sample. It may be much more convenient to use lyrotropic liquid crystal lyrotropic as immersing of microbes will be easier in an aqueous solution. We expect that the qualitative aspects of our results will remain the same for lyrotropic liquid crystals also. With this note, we will continue to use thermotropic MBBA parameters for the simulation.
We mention that there have been studies where effects of microbes on liquid crystal ordering has been investigated (in lyrotropic liquid crystals as well as micro droplets of thermotropic liquid crystals) nlcmcrb1 ; nlcmcrb2 ; nlcmcrb3 ; nlcmcrb4 . (See, ref. nlcmcrb5 for brief reviews of investigations of liquid crystal based biosensors.) However, there typically a finite concentration of microbes has been considered and its effects on liquid crystal ordering has been discussed. For example, in nlcmcrb1 , it is observed that different types of bacterias and viruses can lead to transition from a bipolar to radial configuration of ordering in droplets in aqueous emulsions of thermotropic liquid crystals. Dependence of this bipolar to radial transition on the droplet size, pH etc. has been investigated in nlcmcrb2 . Detection of E. coli strains using nematic liquid crystal 5CB with crossed polarizer has been reported in nlcmcrb3 . For lyrotropic liquid crystals, it was reported in nlcmcrb4 that the presence of pathogens could be detected as optically bright regions arising from distortion of the director around the immune complexes in a crossed polarizer setup. As we mentioned, in all these studies, a finite concentration of microbes has been considered and its effects on liquid crystal ordering has been discussed. To our knowledge, use of geometry of brush structure emanating from a single microbe for possible identification of microbes has not been discussed previously.
The paper is organized in the following manner. In Section 2, we write down the order parameter and the Landau-de Gennes free energy to be used for numerical simulation. Section 3 discusses numerical simulation procedure. As we are interested in static order parameter configuration, we use free energy minimization technique for determining the order parameter configuration with given boundary conditions and the structure of resulting dark brushes. Section 4 presents some specific test simulations to see that the algorithm is producing results as expected. Here we show results of simulations of phase transitions which result in production of network of topological defects. By suitably changing the NLC order parameter space to S1, and S2, respectively we show that string network and monopole networks are formed respectively for the two cases as expected. We then study the case of RP2, the NLC order parameter space and show that it results in string network along with few monopole like structures, as expected. Section 5 discusses the case of microbes. Here we describe the boundary conditions for simulation of resulting brush structure. We first consider cylindrical bodies and show that large distance brush structure reflects the aspect ration of the cylindrical shape of the body. We then present results for brush structures for spherical bodies of different radii, concluding that information of radii is not reflected in large distance brush structure. We then study the brush structure for spherical bodies in the presence of electric field which leads to brushes folding to form domain walls (sheets) emanating from the core. We show that the close distance behavior of these sheets near the spherical core seems to reflect some information about the radius of the sphere. We conclude in Section 6 with a discussion of certain important issues regarding our investigation. We discuss various implication of our results and speculate about possible brush structures for a body like corona virus with spike proteins.
II The order parameter and Free energy
For uniaxial nematic, we use the tensor order parameter priestley
| (1) |
Where is the uniaxial order parameter and is the nematic director. We use the following expression for the Landau-de Gennes free energy density with terms up to second order in priestley
| (2) |
We have not used here kinetic terms for general distortions. In terms of and , can be written as
| (3) |
We will use following values of parameters for MBBA priestley .
| (4) |
For the numerical simulation purpose we change the length scale to nanometers. With that, all the parameters of the free energy become of order one with an overall factor of . All the plots will be shown in nanometer length scale.
We will start the simulation with distribution of and at lattice points with appropriate boundary conditions. Specific boundary conditions will be used for the sample boundaries as well as for the surface of the supposed microbe under consideration. The above free energy will be minimized and for the resulting order parameter configuration (for and ) resulting dark brush structure will be determined assuming a cross-polarizer setup. As we mentioned in the Introduction, for spherical microbe structures, the large length scale structure of dark brushes is not able to give information about the radius of the sphere (for radius in the range of few tens nanometers). To probe the size for the spherical case, we have also considered the effect of applied electric field which aligns the director field everywhere. With constraints of topological invariance of winding of the director, this leads to expansion of two brushes (for the electric field along or perpendicular to the polarization axis) while two other brushes fold to form domain wall sheets emanating from the spherical core. The thickness of this sheet is determined by the strength of the electric field, with stronger electric field leading to thinner sheet. Thus, when the size of the spherical body becomes comparable of larger than the sheet thickness, the sheet will undergo bulge like deformation near the spherical core, indicating presence of the spherical body. This bulging in some sense slightly magnifies the spherical core, increasing chances of its detectability. If this can be detected then it can be very useful in restricting possibilities for the spherical body, from general impurity to a body of specific size, say a corona virus. (As many microbes are of sizes just below threshold for detectability using an optical microscope system, even a small magnification of the effective core region can be useful.)
We consider electric field applied along the axis, so . We will consider cross-polarizer setup in the x-y plane with light propagating along the direction for studying the brush pattern. With the electric field contribution, we use the following free energy efield
| (5) |
In writing the right-most term, we have taken the dielectric constant to be proportional to the order parameter , rfrctindx , with representing rest of the factors (including ). Here, is the free energy (Eqn.(3)) in the absence of any external field (we have ignored here a contribution from the electric field which does not depend on the orientation of as our main motivation is to find structure of dark brushes resulting from orientational changes of ). is the difference between dielectric constants of extra-ordinary and ordinary rays. We will consider a sample value of the factor = 0.01. For this value, we will consider cores of different radii, and see if for some values observations of brushes can indicate the size of the spherical core.
III Numerical simulation
We consider a suitable lattice size, depending on the specific case under consideration, and prescribe values of the NLC order parameter field, the scalar order parameter and the director at each point of the lattice. Suitable boundary conditions, again depending on the specific case, are prescribed for and . As we are only interested in static configurations, we follow the procedure of free energy minimization to determine the correct nematic order parameter field configuration with given boundary conditions.
In the following we list main steps of the algorithm for the energy minimization in our numerical simulation procedure.
-
•
A suitable initial order parameter field configuration is prescribed on the three-dimensional lattice (lattice size and lattice spacing are appropriately chosen for the specific case being considered, as mentioned in the respective sections below). This amounts to specifying a suitable initial value for at each site, and the polar angle and the azimuthal angle for the director .
-
•
Each field variable, namely , as well as the orientation of the director and , are fluctuated by small amounts (say, for , typically 5 to 10 % of the starting value of , somewhat smaller initial fluctuations are found appropriate for and ) and the free energy (Eqn.(3)) is calculated for the three values, for the starting value , for , and for (similarly for fluctuated and values).
-
•
We use over relaxation technique for determining the final fluctuated configuration at each step. (We have used this technique for different field simulations and have found it to be very efficient overshoot .) This consists in first determining the most favorable fluctuation in the field (say, ) at a given site by fluctuating there and considering the change in the free energy density. The most suitable fluctuation corresponds to the minimum of the parabola which passes through these three values of energy densities (corresponding to fluctuated values of ). Then the actual change in is taken to be larger (by a certain factor) than this most suitable fluctuation. We have found that changing this overshoot factor in the range 0.02 - 0.2 worked best for our case.
-
•
For the nematic order parameter case, at each step of the above free energy minimization, we ensure that in comparing a fluctuated value of the free energy, say to the starting value , we calculate two values of , one with , say, and the other with , say, . This is because of the identification of and for the nematic director. The lower value among the two values and is then accepted as the correct choice.
-
•
This minimization technique works fine with free boundary conditions, or with fixed boundary conditions when and are completely fixed at the boundaries. However, the director is known to anchor at specific angles at certain specific boundaries, which differs from the normal anchoring angle . In that case the director lives on a cone with the half angle of the cone being given by the anchoring angle of at that specific boundary. In the absence of knowledge about the anchoring of at the surface of the specific microbe under consideration, we have also considered such boundary conditions. In such a case, the polar angle of (determined w.r.t the local normal to the surface of anchoring) is fixed, but the respective azimuthal angle is allowed full variation during free energy minimization.
-
•
Minimization procedure is continued until change in the free energy becomes insignificant. Often, when such a state is achieved, changing the magnitude of fluctuation (, , ), some times decreasing it, some times even increasing it, again starts giving significant changes in the free energy showing that earlier minimization led to a local minimum of the free energy, and larger fluctuations were needed to hop over some barrier to explore a new, lower minimum.
From the last step of the algorithm above it is clear that one is never sure if the final configuration indeed represents the correct order parameter configuration with the lowest possible free energy. Precisely for this reason, we have carried out different tests of our minimization code, as we discuss in the next section, which gives results as expected from general known simulations about the defects. This gives us greater confidence in our final results. Of course, the final check on these results has to come from experimental observations.
Our main proposal is to be able to identify the microbe shape using optical microscopy with cross-polarizer set up. Thus, we have to determine the geometrical shapes of the dark brushes expected in these cases. We consider plane polarized light of specific wavelength propagating from the bottom of the cell to the top of the cell along a given axis (z axis, or x axis, or y axis, depending on the specific shape of the central object being probed). The polarization of this light is decomposed in two components at each lattice site depending on the local direction of the director . Each component then propagates in the z direction with respective speed depending on the corresponding refractive index. This leads to rotation of the polarization vector for a general orientation of as the light propagates from the bottom of the sample to the top.
For getting clear picture of brushes, we calculate the polarization rotation only for small thickness of the sample in middle, consisting about 20 lattice points. Also, we use sample values for the refractive indices for the NLC. The aim here is not to calculate exact appearance of the dark brushes for the sample under consideration, but get the correct geometry of the brushes. Thus exact contrast of brushes to the background is not relevant.
For light traveling along the direction (when brushes are viewed in the x-y plane), we take to be the length travelled by the light. For this case, the starting polarization is taken to be along the x-axis and a crossed polarizer is taken on top, along the y axis. (Similar arrangements are done for light traveling along x axis, or along y axis). The resulting optical intensity is taken to be proportional to intensity ,
| (6) |
Here, , and being refractive indices for the extra-ordinary and ordinary rays respectively and is the polar angle (for light traveling along axis case). is the average director orientation from x axis for the particular light ray under consideration intensity . is the wavelength of the light. Taking the dielectric constant to be proportional to the order parameter , we use following dependence of the refractive indices on rfrctindx .
| (7) |
Here, subscript denotes either ordinary ray or the extra-ordinary ray, so is or , and is the refractive index for the isotropic phase. is the permittivity of the vacuum. is the equilibrium order parameter for the given temperature and is the refractive index with value of order parameter being . We use sample values of these parameters, nm, and rfrctindx . We have also varied these parameters, as well as the thickness for calculating brush structure. As expected, even though contrast with background changes, the geometry of brushes remains unaffected.
IV Tests of the simulation technique
As we mentioned above, getting correct order parameter configuration by energy minimization is complicated. Even when free energy appears minimized with subsequent fluctuations making insignificant changes in the free energy, changing the magnitude of fluctuation (decreasing it, or some times even increasing it), again starts giving significant changes in the free energy showing that earlier minimization had led to a local minimum of the free energy, and larger fluctuations were needed to hop over some barrier to explore a new, lower minimum. Thus, one needs to develop confidence that the minimization technique is giving desired result, at least qualitatively. For this purpose, we now discuss different tests of our minimization code which we have carried out. These produce results as expected from general known simulations about the defects giving us greater confidence in our final results.
The tests we carry out here are for phase transition dynamics and we determine qualitative structure of the resulting defect network. This is a comprehensive test as in this case the full order parameter, the scalar part , as well as the director , undergo large variations during energy minimization, and the coarsening of resulting defect networks is observed. If this produces desired results for the defect network and its evolution, we have greater confidence in the main simulations where main focus is only on the brush structure emanating from a central core object. We will study cases corresponding to different order parameter spaces by suitably choosing the degrees of freedom of director . We consider the cases of string production with order parameter space, monopole production with order parameter space, and strings and monopole network production with order parameter space as appropriate for NLC case.
We emphasize that we are not attempting to probe quantitative aspects of defect network which results in a phase transition. The network we get is highly non-equilibrium with underlying mechanism of formation being the so called Kibble Mechanism kbl . In this case a dense network of defects is formed at the phase transition which coarsens rapidly eventually leading to homogeneous phase (apart from isolated defects pinned to boundary). To get such an evolving network one needs to carry out simulation using full time-dependent Landau-de Gennes equations. Our main purpose is in the static order parameter configuration in presence of specific boundary conditions, specified at the sample boundary, as well as on the surface of the microbe. For this we are using energy minimization technique. Thus, for the phase transition case, we will get qualitatively correct network, after all highly dissipative dynamics is like free energy minimization. However, different steps of simulation during the minimization of free energy will not have any direct correspondence to actual time steps. We will see that the defect networks we get have correct qualitative behavior. We get a network of defects as expected for the relevant case, which coarsens as free energy is further minimized.
We start the simulation by starting with with tiny fluctuations and random variations of within the allowed degrees of freedom for the respective case under consideration. This will represent the situation of the isotropic phase, with fluctuations representing thermal fluctuations around the equilibrium order parameter for the isotropic phase. We set temperature to a value less than the critical temperature so that with energy minimization, the order parameter settles to a non-zero value as appropriate for the nematic phase. As the isotropic-nematic phase transition is weakly first-order, we set the temperature to a suitably low value so that there is no local minimum at (otherwise energy minimization may not take the order parameter outside this local minimum, remaining trapped within the free energy barrier). This is easily achieved by setting . With this the term vanishes and there is no metastable state at . The situation here therefore corresponds to a quench. Free energy minimization is carried out and field configuration is plotted at different stages during the minimization.
For all the plots shown in the figures in this section, the defect core is shown by making a density plot with suitable cutoff in the density. We have used energy density plot as well as plot of ( being the equilibrium order parameter corresponding to minimum value of the free energy for a uniform order parameter). Both plots show similar defect network. Also, to show defect cores clearly, we have generally plotted smaller portion of the lattice. Periodic boundary conditions have been used for the lattice boundary.
IV.1 String network with order parameter space
To get order parameter space, we restrict the polar angle of to . Further, in the energy minimization, we drop the step where we impose the identification of with . This reduces the original order parameter space to effectively case (same as for the model). The only topological defects in this case are string defects (in 3-D).
Fig.1 shows the resulting string network. The thickness of the tube representing strings depends on the choice of cutoff we impose for plotting energy density (or the value of ). We have chosen a value suitable to clearly see the string network as well as the core of the string (shown by the color contrast in the cross-section of tubes which is visible at the boundary of the plot). We have confirmed that these are genuine string defects with plots of around these strings which clearly shows non-trivial winding of . As mentioned above, we show a smaller part of the whole lattice used for simulation. we have used lattice of size with lattice spacing of 10 nm.
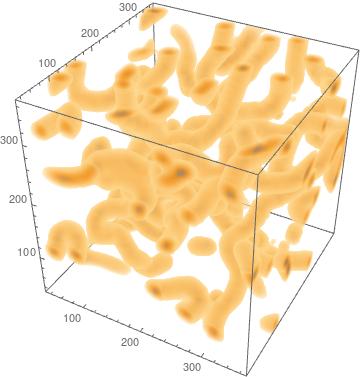
String network resulting in the quench. String profile can be seen at the cross-section of the core at the boundary. Initial string network is extremely dense. Length is given in nm. We show the situation after suitable number of minimization steps so that the string network has sufficient coarsened and individual strings can be seen.
This string network has correct qualitative structure as obtained in various simulations of string defect formation (from relativistic cases to non-relativistic ones), basically representing a random walk network with the formation of small string loops as well as many long strings. With further minimization of free energy, the network is seen to coarsen further leading finally to only 1-2 strings with ends pinned at the boundaries. Note that with periodic boundary conditions, one is working with the topology of a 3-torus for the physical space. A single string winding around any of the circles of is topologically stable and cannot be removed.
IV.2 Monopoles with order parameter space
Monopoles also arise with order parameter space of NLC. However, In that case one also gets strings. To clearly see monopole distribution, it is more convenient to consider the more standard case of order parameter space where only monopole defects are formed.To get order parameter we only drop the step of identification of with in energy minimization. This reduces the original order parameter space to effectively case.
Fig.2a,b show the resulting monopole distribution network. Each blob shows a monopole with the size of the blob depending on the choice of cutoff we impose for plotting energy density (or the value of ). Fig.2a shows a relatively large part of the lattice while Fig.2b shows a smaller portion showing clearly isolated monpoples. It is important to mention that several such localized blobs are seen after the quench which individually disappear with energy minimization. Such blobs represent only local fluctuations without any non-trivial topological monopole winding number associated with them. The blobs which survive are energetically stable and represent genuine monopole configurations. We have confirmed this with the plots of around such blobs clearly showing non-trivial winding of .
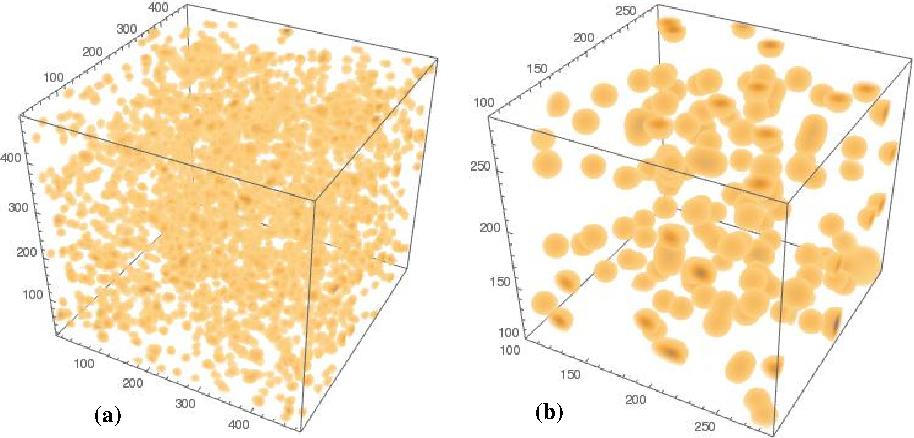
Monopole distribution resulting in the quench with order parameter space. (a) shows a relatively large part of the lattice while (b) shows a smaller portion showing clearly isolated monpoples. Length is given in nm.
IV.3 Defect network with NLC order parameter space
We now consider the case of full order parameter space of NLC. is allowed full variations of the polar angle and the azimuthal angle . Further, identification of with is imposed in energy minimization as explained in the previous section. We expect string network along with few monopoles. This is what is seen in Fig.3a,b. Fig.3a shows the network for a relatively large portion of the lattice while Fig.3b shows a zoomed portion to clearly show an isolated blob corresponding to the monopole. It is known that number of monopoles is highly suppressed for case when monopoles are formed directly via the Kibble mechanism monopole . However, monopoles can also form by the collapse of a string loop in this case. The few monopoles we see could well be result of collapse of small string loops.
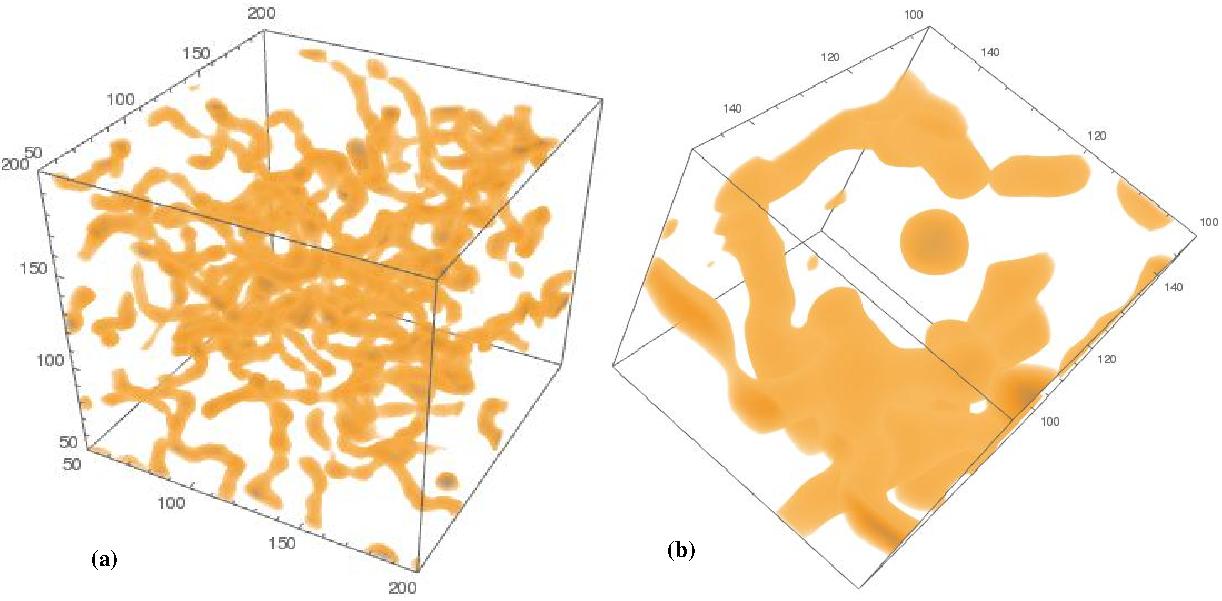
(a) Defect distribution for the order parameter space of NLC. String network and few isolated monopoles can be seen. (b) shows zoomed portion clearly showing an isolated monopole blob. Length is given in nm.
These results for the defect networks for different order parameter cases are in confirmation of the results in literature from dynamical simulations of phase transition. For example, pictures in network show similar defect network where molecular dynamics simulation was used to model I-N quench.
V Probing microbe shapes with the geometry of dark brushes
With the results in previous section in confirmation with the usual expectations for defect networks, we now move on to our main goal, to determine geometry of dark brushes for different shapes of microbes. We discuss two classes of microbes here. One with cylindrical shape, and the other with spherical shape which is the case relevant for corona virus. First we consider the cylindrical shape case. We have used lattice size and used spherical boundary with director anchored normal to the boundary. The microbe is situated at the centre of the lattice. Lattice spacing is taken to be 10 nm. Due to computer limitation, we are able to use relatively small lattice size here of order of few microns. This is sufficient for our purpose, as we imagine a spherical micro droplet of the sample being used for the microbe detection purpose which should be detectable using optical microscope.
V.1 microbes with cylindrical shape
We will consider shape of the microbe in the form of a solid cylinder, with flat disk shape at the end of the cylinder. Cylinder is kept with its length along the z axis, centered at the origin. We use normal boundary conditions for the surface of the cylindrical microbe. It is then useful to have a healing length for the order parameter so that is kept fixed within the healing length from the surface. After that its orientation is allowed full fluctuations to determine the correct distribution. For all the cases here we have taken healing length to be one lattice spacing. With this orientation of the cylinder, if the cross-polarizer setup is in the x-y directions respectively, four dark brushes are expected emanating from the surface of the central body (which will have a circular cross-section in the x-y plane), two along x axis and two along y axis. Similarly, if the cross-polarizer setup is in the y-z directions respectively, four dark brushes will emanate from the surface of the central body (which now will have a rectangular cross-section in the y-z plane), two along y axis and two along z axis.
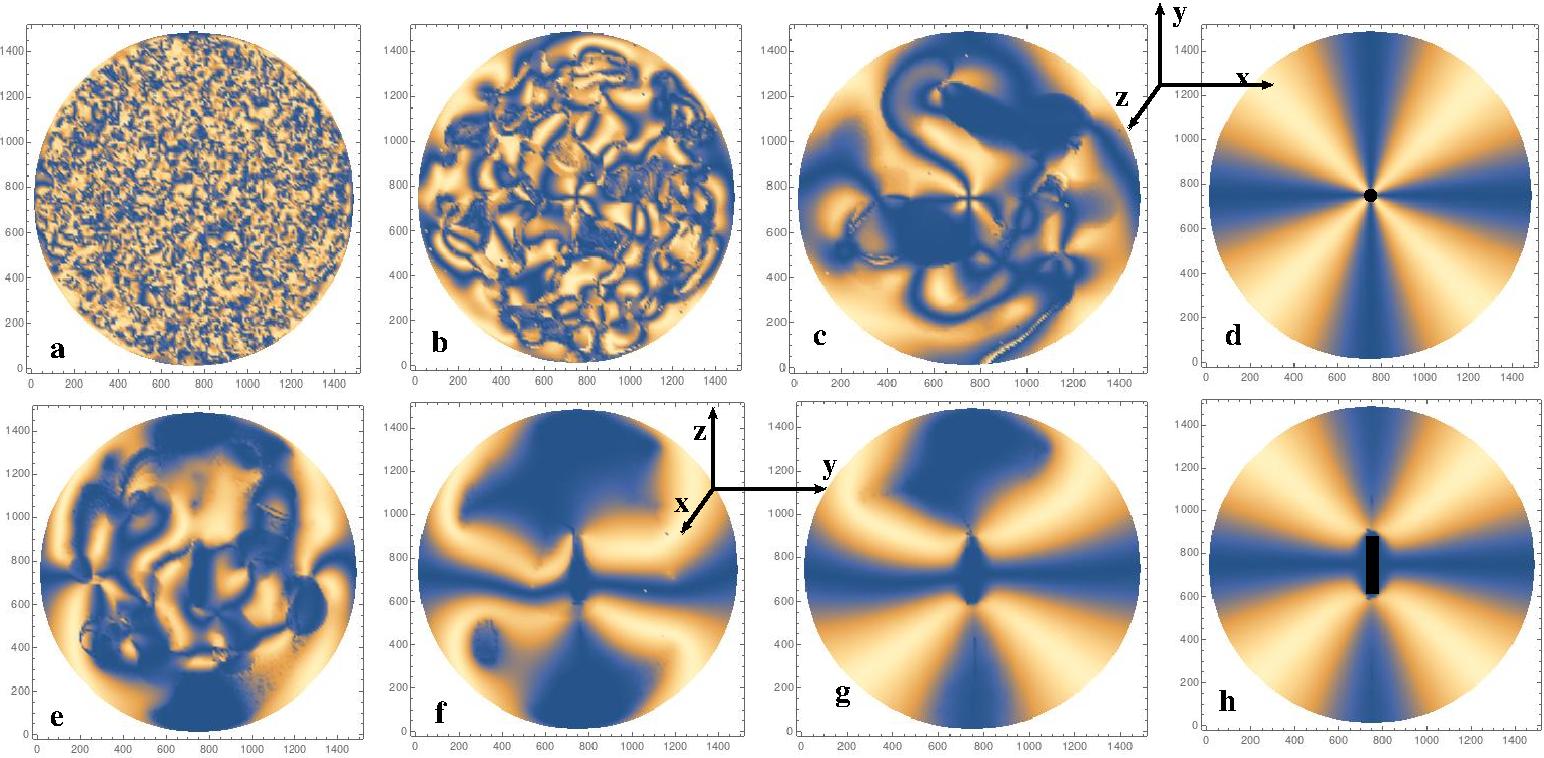
We carried out simulations in two different manners. First we started with a reasonable guess of director distribution, with the order parameter having the equilibrium value, and allowed only the director orientation to relax by energy minimization. We found reasonable results, however, the memory effect of initial choice could not be completely eliminated. To be completely sure of our results, we carried out the quench transition as in Section 4, by starting with scalar order parameter to be zero, with tiny random fluctuations in magnitude of , and in the orientation of the director. However, at the boundaries (outer boundary as well as on the microbe surface) we take equilibrium value with normal anchoring of the director. During energy minimization, a defect network is formed which rapidly coarsens, and finally leads to the director configuration appropriate for the given boundary conditions. We show in Fig.4, a sequence of pictures from the simulation showing different stages during energy minimization. Here, the central object is taken to be of cylindrical shape with diameter of 60 nm and length 300 nm, with its length along the z axis. (a)- (d) show time sequence of brushes viewed along the z axis during the coarsening, starting from the configuration at beginning stages in (a), with (d) showing the final brushes with fully relaxed order parameter configuration. (e)-(h) show time sequence of brushes viewed along the x axis from an intermediate stage in (e) to the final stage in (h). Shape of the central cylindrical object is shown by the black solid circle in (d) and black solid rectangle in (h). Symmetry of brushes in Fig.4d and the asymmetry of brushes in Fig.4h is clearly seen, directly originating from the corresponding shapes of the central object.
The final brush configuration obtained by this method was found to be very robust, using different lattices, different lattice spacing etc. We thus used this quench technique to determine the brush geometries for all the cases for the cylindrical shape case. Fig.5 shows three different cases. As we are only interested in the geometry of brushes, we have used a light intensity cut-off (with the cross-polarizer set-up) so that only brushes are seen in the figures. These brushes correspond to the configuration similar to the one shown in Fig.4h. Thus, as the cylinder length is along the z axis, and these figures correspond to light propagating along the x axis, the brushes shown here are in the y-z plane. Figs.5a,b,c show the cases of cylindrical cores with (diameter,length) being (100 nm, 300 nm), (60 nm, 300 nm), and (60 nm, 420 nm) respectively. Brush edges are marked by dashed lines and corresponding angles are measured (by transporting one of the lines towards the other line for each brush). angles correspond to the brushes emanating along the y axis while angles correspond to brushes emanating along the z axis. angles used (in Table 1 below) are the averages of the angles and respectively in Figs.5a,b,c.
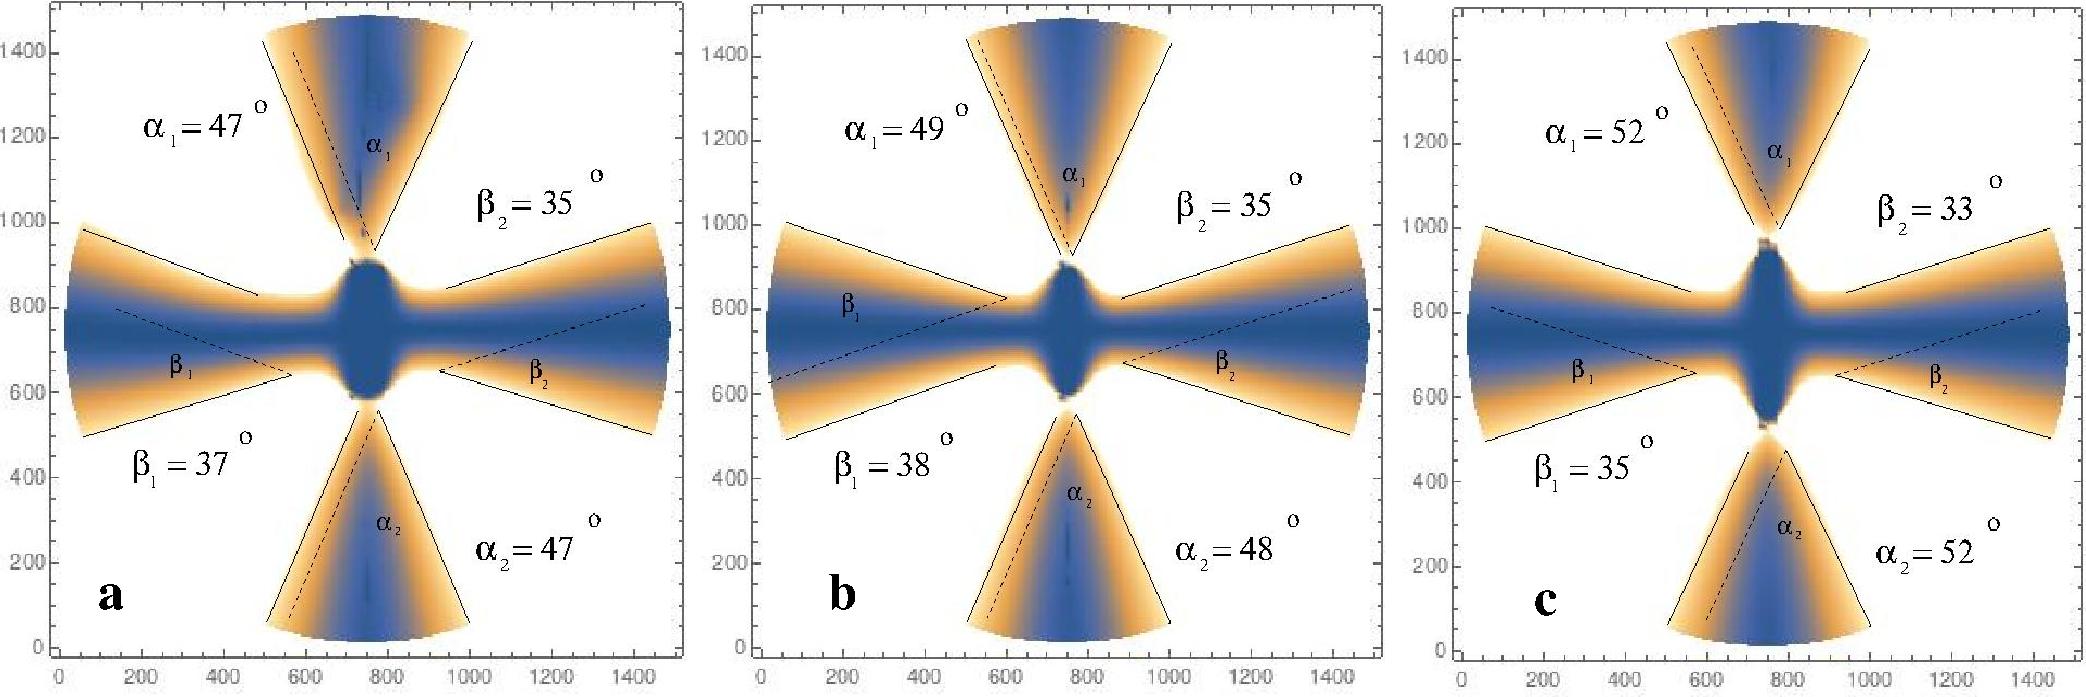
Table 1 shows the results of measurements of brush geometries for different cases. The shape of the brushes emanating along the y and z directions are given by (average) angles and . Results clearly show a monotonic increase of the ratio of the two brush angles with increasing aspect ratio of the object. We do not attempt to get a quantitative dependence of the angle ratio on the aspect ratio due to crudeness of our results at this stage. We mention here that the detection of brush edges here is done rather crudely, by visually drawing a straight line along the brush edges which are not very sharp and often are not of straight line shape. Clearly a more sophisticated technique of graphical analysis can give more reliable results. Our intention here is to show a clear pattern of brush geometry containing signature of shape asymmetry of the central core object.
| Fig5. | cylinder size | aspect ratio | angles | |
|---|---|---|---|---|
| lable | (diameter d, length L) | (L/d) | ||
| a | (100 nm, 300 nm) | 3.0 | 47.0o,36.0o | 1.306 |
| b | (60 nm, 300 nm) | 5.0 | 48.5o, 36.5o | 1.329 |
| c | (60 nm, 420 nm) | 7.0 | 52.00, 34.00 | 1.529 |
V.2 microbes with spherical shape
We now consider microbes of spherical shape. This case is of particular importance as it relates to corona virus. Of course, the corona virus does not have simple spherical surface, having spike proteins on the surface. Thus the actual boundary conditions of NLC director may be much more complex for corona virus. This has to be determined by experiments. We will ignore such complications here and assume simple spherical surface with normal boundary conditions for the director . This may not be unreasonable as the spike proteins are relatively small, and NLC molecular ordering in the nematic phase may be largely unaffected by their presence.
As our primary focus for the spherical case is regarding viruses, in particular the corona virus, we keep the sizes relatively small compared to the cylindrical case. For different radii we use different lattice sizes as appropriate. Fig.6 shows brush structure for widely different radii of the spherical microbe case (for light propagating along the z axis, so the resulting brushes are in the x-y plane). (a) and (b) show cases with radii 30 nm, and 150 nm respectively. (Brushes appear somewhat different here compared to earlier pictures due to different color scheme in plotting.) It is clear that no difference can be seen at large scales in brushes which could indicate the size of the core. This is expected as with normal boundary conditions on a spherical surface, brushes will appear to be originating from the center, hence will all have the same shape at large scales. With complete symmetry of brushes in x and y directions, one can conclude that there is an almost spherical body present with normal boundary conditions for the director, and that by itself is possibly some useful information. (A general foreign body, or other microbes will in general not have spherical shapes, and with our results shown in Figs.4,5, should result in some asymmetry in brushes.) However, one would like to get some information about the order of magnitude of the size of the object.
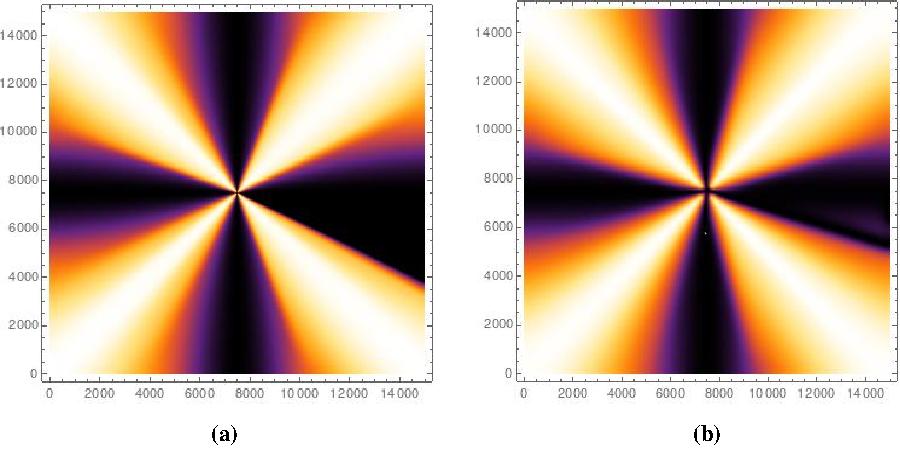
Spherical microbe case with (a), (b) showing brush structures for spheres with radii 30 nm, and 150 nm, respectively. No difference can be seen at large scales in brushes which could indicate the size of the core.
It is clear that the spherical symmetry of the microbe, with normal anchoring of NLC director on its surface continues to dominate the large scale brush structure, with the same brush structure for all radii considered. This also suggests that to probe the radius of the object with normal boundary conditions, one should break this spherical symmetry. This can be achieved by applying electric field, or magnetic field. As an example, we consider application of electric field along y direction. The relevant fee energy density is given by Eqn.(5). We use (which represents factors of dielectric constants, and ) as a variable without attempting to relate to actual value of the electric field applied. The lattice size is taken here as 500 with lattice spacing of 4 nm.
With electric field along y axis, the brushes along y axis expand while those along the x axis fold to form domain wall sheets along the x axis emanating from the spherical core. The sheets represent the regions where the director undergoes the winding as the folding of bands has to respect the topological invariance of winding arising from the boundary conditions at the surface of the sphere. For larger radius, the folding of bands will extend to larger distances from the center. The thickness of the sheet is determined by the strength of the electric field , with larger (hence larger value of factor )leading to thinner sheet. When sheet thickness is larger than the diameter of the spherical body, the presence of the body will not be noticeable. However, when the size of the spherical body becomes comparable of larger than the sheet thickness, the sheet will undergo bulge like deformation near the spherical core as the director attempts to fold down, starting with normal anchoring at the spherical surface, thus indicating presence of the spherical body and may become visible under optical microscope. Basically the electric field effect on folding the dark bands in form of domain wall helps in slightly magnifying the core size. Thus, for a given applied electric field (with a value corresponding to choice of in Eqn.(5), including other factors), we consider spheres of increasing radii. For a suitable radius, the folding of bands should show up with some bulging up near the core which may become visible under optical microscope even when the sphere size if few tens of nm. Fig.7(a), (b), (c) show the cases of spheres of radii 28 nm, 52 nm, and 152 nm respectively (specific choices being results of choice of lattice spacings). We see that there is no change in the folded bands in (a) and (b), but in (c) some bulging up can be seen near the core of the object. This indicates some possibility that in suspected presence of spherical microbe of some specific size (say, corona virus having radius of about 60 nm), as one gradually increases electric field in a cross polarizer set up, some bulges may start showing up at the locations of the microbes. Proper calibration can relate that particular value of the applied electric field (when bulges start appearing firs) to the size of the spherical microbe.
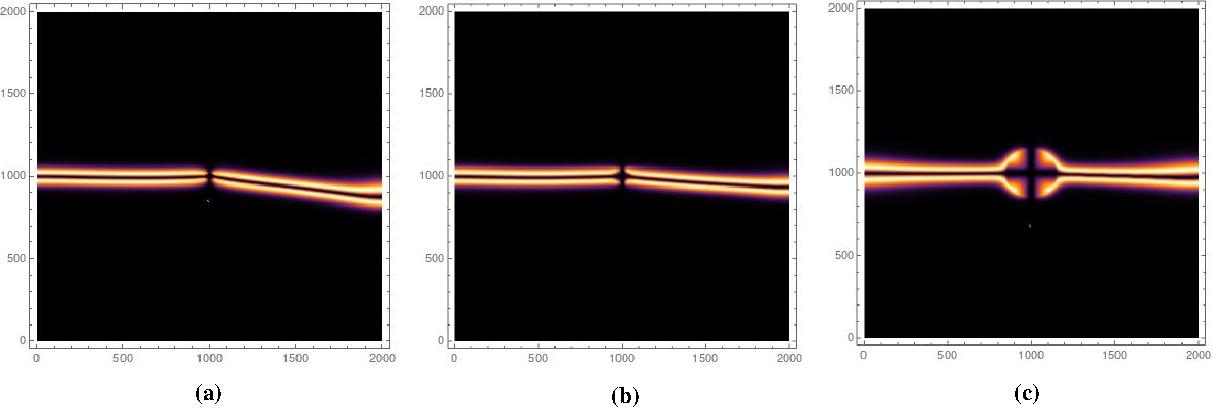
Spherical microbe case in the presence of electric field of fixed magnitude along y axis. (a), (b), (c) show folded brush structures (due to electric field) for spheres with radii 28 nm, 52 nm, and 152 nm respectively. No change in the folded bands is seen in (a) and (b), but in (c) some bulging up can be seen near the core of the object.
We mention that all the results we have presented in this paper are with normal boundary conditions. However, the results do not crucially depend on strict normal boundary conditions. We have also allowed conical boundary conditions for several cases, with half cone angle being about 30 degrees. The large scale brush structure remains almost unaffected, simply being determined by the geometry of the surface. This is expected as with conical boundary conditions, random variation in the azimuthal angle (w.r.t the cone axis) averages out in a given region of the surface, with average orientation being along the cone axis, i.e. normal to the surface. This is what seems to determine the overall geometrical structure of the brushes even with conical boundary conditions.
VI Conclusions
Our study here is aimed at providing possibilities. The main aim is to be able to have a quick diagnosis using simple optical microscopy with cross-polarizers and narrow down possibilities of microbes which could be present in the sample. As we mentioned, for microbes, it is more appropriate to use lyrotropic liquid crystals. We use here specific case of thermotropic NLC. Qualitative aspects of our results relating geometry of brushes to the aspect ratio of elongated microbes, or the appearance of bulges in the presence of specific value of electric field, should be valid for lyrotropic case as well. We have only considered simple geometrical shapes for the microbes here which lead to standard 4-brush geometry under cross-polarizer. Microbes occur in variety of shapes, including complicated shapes, such as spiral shape bacterias or Filovirus such as Ebola viruse. In such cases, even the topology of brushes may be non-trivial depending on the spiral nature/folding of the virus along its length. In fact, one may expect linked/knotted brush structure (with 2-D projection) which may uniquely identify the underlying microbe structure. The important point here is that while other studies probing microbes with liquid crystals involve clusters of microbes, here one is attempting to observe single, individual microbe. Thus, even with extremely low concentration of microbe, one may be able to detect it. In fact, even if the microbe is not in the field of view of the microscope, being slightly away, the brushes emanating from it may very well be seen in the microscope. With the converging nature of the brushes towards the microbe, one may be able to bring back the relevant region under microscope for further detailed analysis.
Our technique of determining the correct director configuration uses energy minimization. One can never be sure with this method that correct global energy minimum has been achieved. We have carried out different tests of our technique by determining defect network structures expected in a quench, and get qualitatively correct results. This gives us the confidence that the qualitative behavior of brush structures we determine should correctly represent the shapes of the microbes. Of course, one needs experimental tests to see if this proposed technique works. We are not aware of any previous studies (theoretical or experimental) of probing the geometry of brushes in the presence of microbes. So we are unable to compare our numerical simulation results with any experimental data.
Many issues remain to be probed. For example, distinction of a microbe from a random colloid. We expect that a random colloid will lead to some randomness also in the geometry of brushes, so that the case of a cylindrical microbe or a spherical microbe can be distinguished. For example, the reflection symmetry of the brushes for both these cases should not be seen for a randomly shaped particle (even angles between brushes will not be expected to be . Of course, there will not be any way to distinguish a microbe from a dust particle of exactly same shape until one knows of any possible differences in the anchoring angle between the two. Also note that there is a possibility of development of a hedgehog defect or a Saturn ring near the central object (depending on the size of the central object saturn ), in that case the brush geometries discussed here will not be seen. For very small microbe size, the continuum description will break down. Supposedly before that happens, value of scalar order parameter will also significantly change from the equilibrium value near the surface. We do not see that happening for the sizes considered here.
Our technique has not been effective in probing the size of spherical bodies. Even with external electric field, the resulting bulge in the bands of folded brushes has non-trivial structure too close to the spherical body. It is not clear if it may be visible with optical microscope for the size of body about 50 nm, like the corona virus. It is thus tempting to speculate if the spike proteins on the surface of the corona virus can have any non-trivial effects on the brush structure. With the size of the spike proteins being in ten nm range, it may be unlikely. However, the number density of spike protein being large may possibly induce non-trivial effects in the anchoring of nematic director at the surface. For example, if the director attempts to anchor around the spike protein, it will most likely lead to very non-trivial brushes emanating out, with several boojum like structures forming at the surface boojums . It is not clear what type of brush structure can emerge from that. It will be very useful to directly carry out experiments and see if a large distance observation involving brushes can quickly and easily indicate presence of such tiny microbes.
VII Acknowledgement
I would like to thank Shikha Varma for useful discussions about microbe structures and possibility of testing these using nanodots and nanorods. I also thank Sanatan Digal for useful discussions.
References
- (1) P.G. de Gennes and J. Prost, The physics of liquid crystals, (Clarendon Press, Oxford, 1993); S. Singh, Liquid crystals fundamentals, (World Scientific, River dge, N.J., 2002); S. Chandrasekhar and G.S. Ranganath, Adv. Phys. 35, 507 (1986).
- (2) A.M.F. Neto and S.R.A. Salinas, The physics of lyrotropic liquid crystals, (Oxford University Press, 2005).
- (3) S. Sivakumar et al., Advanced Functional Materials 19, 2260 (2022); B.J. Ortiz et al. ACS Appl. Mater. Interfaces 12, 29056 (2020); M.C.D. Carter, et al., Langmuir 31, 12850 (2015).
- (4) D.S. Miller and N.L. Abbott, Soft Matter 9, 374 (2013).
- (5) H. Xu, D. Hartono and K.-L. Yang, Liquid Crystals, 37, 1269 (2010).
- (6) S.L. Helfinstine, O.D. Lavrentovich, and C.J. Woolverton, Letters in Applied Microbiology 43, 27 (2006); S.V. Shiyanovskii et al., Phys. Rev. E 71, 020702(R) (2005).
- (7) A. Hussain, A.S. Pina, A.C.A. Roque, Biosensors and Bioelectronics 25, 1 (2009); S.W. Tam-Chang and L. Huang, Chem. Commun., Issue 17, 1957 (2008)
- (8) Introduction to Liquid Crystals, Edited by, E.B. Priestley, P.J. Wojtowicz, and P. Sheng, (Plenum, New York, 1974).
- (9) Fundamentals of Liquid Crystal Devices, D.K. Yang and S.T. Wu, (John Wiley & Sons, Ltd, West Sussex, 2006).
- (10) A.M. Srivastava and M. Stone, Mol. Cryst. Liq. Cryst. 257, 229 (1994); H. Lin and P. Palffy-Muhoray, Opt. Lett. 17, 722 (1992).
- (11) A.M. Srivastava, Phys. Rev. D 47, 1324 (1993); B. Layek, A.P. Mishra, and A.M. Srivastava, Phys. Rev. D 71, 074015 (2005).
- (12) S. Faetti and V. Palleschi, Phys. Rev. A30, 3241 (1984).
- (13) H. Mailer, K.L. Likins, T.R. Taylor, and J.L. Fergason, Appl. Phys. Lett. 18, 105 (1971)
- (14) T.W.B. Kibble, J. Phys. A 9, 1387 (1976); Phys. Rept. 67, 183 (1980); W.H. Zurek, Phys. Rep. 276, 177 (1996).
- (15) M. Hindmarsh, Phys. Rev. Lett. 75, 2502 (1995).
- (16) A.C. Callen-Jones, et al. Phys. Rev. E 74, 061701 (2006); J.L. Billeter, et al. Phys. Rev. E 60, 6831 (1999).
- (17) S.Alama, L. Bronsard, and X. Lamy, Phys. Rev. E 93, 012705 (2016).
- (18) O.D. Lavrentovich, Liq. Cryst. 24, 117 (1998); N.D. Mermin in Quantum Fluids and Solids, edited by S. B. Trickey, E.D. Adams and J.W. Dufty (Plenum Press, New York, 1977)), p. 3.