The impact of 17O + reaction rate uncertainties on the s-process in rotating massive stars
Abstract
Massive stars are crucial to galactic chemical evolution for elements heavier than iron. Their contribution at early times in the evolution of the Universe, however, is unclear due to poorly constrained nuclear reaction rates. The competing 17O()21Ne and 17O()20Ne reactions strongly impact weak s-process yields from rotating massive stars at low metallicities. Abundant 16O absorbs neutrons, removing flux from the s-process, and producing 17O. The 17O()20Ne reaction releases neutrons, allowing continued s-process nucleosynthesis, if the 17O()21Ne reaction is sufficiently weak. While published rates are available, they are based on limited indirect experimental data for the relevant temperatures and, more importantly, no uncertainties are provided. The available nuclear physics has been evaluated, and combined with data from a new study of astrophysically relevant 21Ne states using the 20Ne()21Ne reaction. Constraints are placed on the ratio of the ()/() reaction rates with uncertainties on the rates provided for the first time. The new rates favour the () reaction and suggest that the weak s-process in rotating low-metallicity stars is likely to continue up to barium and, within the computed uncertainties, even to lead.
keywords:
nuclear reactions – nucleosynthesis – stars:rotation1 Introduction
Massive stars are key contributors to the abundance of chemical elements, producing elements up to the iron group via charged-particle reactions during their evolution and subsequent explosion in core-collapse supernovae, and synthesising elements heavier than iron via neutron-capture reactions. The weak s-process during core-helium (Langer et al., 1989; Prantzos et al., 1990; Baraffe et al., 1992) and to a smaller extent during shell-carbon burning (Raiteri et al., 1991; The et al., 2007) and possibly the weak r-process in the supernova explosion (Thielemann et al., 2011) produce elements up to the strontium peak in standard, non-rotating, models.
Rotation in massive star models significantly boosts the efficiency of the weak s-process, especially at low metallicity (Pignatari et al., 2008), enhancing production of elements above strontium. With rotation, the helium core contribution to the s-process was shown to increase at the expense of the carbon-burning shell. In the models of Frischknecht et al. (2016), the carbon-burning shell contribution is less than 10 % at sub-solar metallicities. During the core helium burning phase, rotation-induced mixing transports 12C and 16O from the He-core to the H-shell, leading to substantial overproduction of 13C and 14N through the CNO cycle. These isotopes are later engulfed by the growing convective He-burning core, leading to a more efficient activation of neutron sources through the 14N()18F()18O()22Ne()25Mg chain and the 13C() reaction (Pignatari et al., 2008; Frischknecht et al., 2016; Choplin et al., 2018; Limongi & Chieffi, 2018; Banerjee et al., 2019). Specifically, Cescutti et al. (2013) have shown that the Sr/Ba scatter at low metallicity of the observed Milky Way halo stars can be reproduced if the contribution of fast rotating massive stars is included.
The contributions of rotating massive stars to chemical evolution are subject to stellar and nuclear uncertainties. One key nuclear uncertainty is the ratio between the 17O()20Ne and 17O()21Ne reaction rates (Frischknecht et al., 2012; Choplin et al., 2018). At all metallicities, 16O is abundant in both the helium-burning core and the shell carbon burning. It is a strong neutron absorber, producing copious amounts of 17O and loss of neutron flux. The neutrons absorbed by 16O may be recovered via the 17O()20Ne reaction. Alternatively, the 17O()21Ne reaction permanently absorbs the neutron, preventing it from contributing to s-process nucleosynthesis. The 17O()20Ne to 17O()21Ne ratio, therefore, determines the fraction of neutrons released and the strength of the s-process.
At He-core burning temperatures (0.2-0.3 GK), the 17O+ reactions are dominated by resonant contributions from states between and keV ( keV) in 21Ne. However key properties of the most important states have not been measured. These unknown properties lead to large uncertainties in the reaction rates though no previous rate estimates have provided uncertainties (Best et al., 2013; Caughlan & Fowler, 1988). Here, a new calculation of the 17O reaction rates is presented, providing realistic uncertainties for the first time. The rates are derived from a rigorous evaluation of excited states in 21Ne based on a new measurement of the 20Ne()21Ne reaction, together with an evaluation of existing literature.
2 Existing literature on 21Ne levels
Some experimental data on levels in 21Ne are available from studies using a variety of populating reactions. As these works are used in the present paper to constrain the properties of observed levels, they are briefly summarised.
Direct measurements of 17O()21Ne (Best et al., 2011; Taggart et al., 2019; Williams et al., 2022) and 17O()20Ne (Best et al., 2013) have been performed but were not able to observe all states within the Gamow window due to the prohibitively low cross-sections. The 17O()21Ne and 17O()20Ne measurements in forward kinematics of Best et al. (2011, 2013) used anodised tantalum-oxide targets with enriched 17O and a germanium detector. Measurements of the 17O()21Ne radiative-capture reaction were performed in inverse kinematics with the DRAGON recoil separator by Taggart et al. (2019) and Williams et al. (2022).
The 17O()21Ne measurement of Best et al. (2011) observed three resonances at , , and keV. The subsequent study of the same reaction by Taggart et al. (2019) observed resonances at , , and keV. Some of the resonance strengths were revised by Williams et al. (2022) based on new DRAGON measurements with higher beam intensities, including an upper limit for the strength of the -keV resonance in 17O()21Ne.
Best et al. (2013) also measured the 17O()20Ne reaction using tantalum-oxide targets. The neutrons were detected in 20 3He counters within a polyethylene moderator. The 17O()20Ne reaction was measured by observation of rays depopulating the first-excited state of 20Ne. The excitation function was measured between and keV. A number of resonance structures were observed and an -matrix analysis was performed. Rates of the 17O()21Ne and 17O()20Ne reactions were reported. These rates included estimated contributions from unmeasured resonances below the region scanned in the excitation function, making assumptions about unknown spins and parities in combination with known information about levels in 21Ne (Firestone, 2015).
A subsequent uncertainty analysis of the measured 17O(,n)20Ne excitation functions presented in the literature was performed by Mohr (2017), which raised some doubts about the consistency of the data presented in Best et al. (2013) in comparison to historical literature. However, the study found the largest discrepancy was in the high-energy cross section affecting the reaction rate at temperatures above 1 GK. At those energies, Mohr (2017) suggested that the cross section presented in Best et al. (2013) should be lowered by a factor of 2-3. At lower energies, though, their data appears to be in better agreement with the literature (see Fig. 5 of Mohr (2017)). Furthermore, at the temperatures of interest in the present work (0.2-0.3 GK), the reaction rate is dominated by un-observed resonances that we treat in a rigorous manner and were not considered in Mohr (2017), which focused on applying the statistical model to compute reaction rates.
Additional key information about the excited states has been extracted from earlier measurements, including scattering and transfer studies. Cohn & Fowler (1959) performed a neutron resonance-scattering experiment. Neutrons were produced by bombarding a zirconium tritide and 7Li targets with protons. The incident neutron energies were varied by changing the bombarding energy of the proton beam. Information on excitation energies, widths, and spins and parities for 21Ne levels above the neutron threshold was determined. The uncertainty in the neutron energy scale was less than 5 keV and the neutron energy resolution was around 13 keV. Resonances with widths as small as keV were observed in this experiment.
Various -ray studies using reactions such as 18O()21Ne (Rolfs et al., 1972; Hoffman et al., 1989), 12C(13C,)21Ne (Andritsopoulos et al., 1981; Hallock et al., 1975) and 16O()21Ne (Thummerer et al., 2003; Wheldon, C. et al., 2005) provided additional information. Spins and parities of excited levels were assigned on the basis of observed decay branching and angular distributions. The observation of -ray decays from neutron-unbound levels in 21Ne can be used in combination with other observables to rule out certain spins and parities since the neutron partial width of a state cannot exceed the -ray partial width by a significant factor if a -ray transition is observed depopulating the state.
The 20Ne()21Ne single-neutron transfer reaction has previously been studied by Stanford & Quin (1980). In this experiment, the differential cross sections and analysing powers of eight states in 21Ne were measured using a vector polarised deuteron beam on an enriched 20Ne gas cell target. The resolution was around 100 keV, largely due to the significant energy loss through the target for the deuteron beam. Large deviations between the calculated differential cross sections from the DWBA and the experimental data were observed at higher angles. This is likely due to the strong deformation of the 20Ne core. Inelastic excitation of deformed nuclei means that treatment with the DWBA may no longer accurately reflect the observed differential cross section (e.g. the 20Ne(He)19F study of Dudek & Edens (1971). For this reason, analysis of the strength of the 20Ne()21Ne single-neutron transfer reaction should be limited to centre-of-mass angles below around 30 degrees.
3 Experimental details
The experiment was performed at the Triangle Universities Nuclear Laboratory (TUNL). Deuterons were accelerated to 14 MeV through the tandem accelerator with an energy precision of better than 1 keV. Typical currents recorded with an electron-suppressed beamstop downstream from the target were 300-575 nA, except at the most forward angle where currents were limited to around 90 nA.
The target consisted of 20Ne implanted into a 44 gcm2 carbon foil with a Ne/C abundance ratio of 4.30.3 determined by Rutherford Backscattering Spectrometry.
The neon content was monitored with deuteron elastic scattering at = 25° after collecting 20Ne()21Ne data at each angle to account for any target degradation. Uncertainties in neon target areal density were of the order of 7.
Reaction products entered the TUNL Enge split-pole spectrograph through a 0.540.01 msr aperture and were momentum analyzed at the focal plane. The focal-plane detector comprised of two position-sensitive gas avalanche counters, a E proportional counter, and a scintillation counter (Marshall
et al., 2018). Protons were identified using a E-position cut. Data were collected at five laboratory angles: 10°, 15°, 20°, 25° and 38°. Additional data for background characterisation were collected using a natural carbon target at each angle.
A quadratic internal calibration using the 21Ne states at , , and keV (Firestone, 2015) was used to convert focal-plane position to excitation energy. The Bayesian method outlined by Marshall et al. (2018) gave realistic uncertainties, explicitly including the statistical uncertainties in the fitted peak centroids and the systematic uncertainties from the focal-plane calibration. For peaks observed at multiple angles, our recommended energy was obtained from a weighted average of individual measurements. The reported energy uncertainty was conservatively constrained to be no smaller than the uncertainty at a single angle.
An example focal-plane spectrum for the astrophysically important region is shown in Fig. 1.
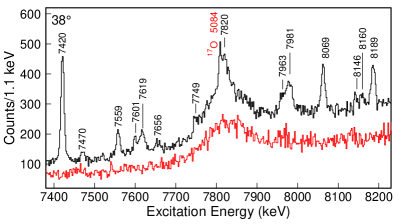
To extract peak intensities and positions, the focal plane was divided into regions based on the behaviour of the background reactions determined from the carbon target. For more details on the peak fitting see Frost-Schenk (2020). Angular distributions were extracted from the yields for each state observed at each angle accounting for beam on target, aperture solid angle, target content and dead time, which was typically below 9.
4 Calculation of neutron widths
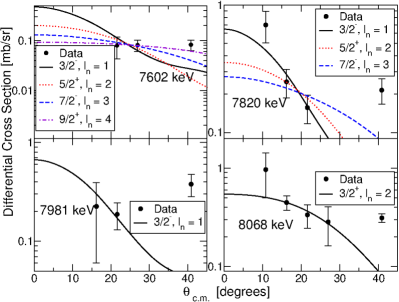
The code fresco (Thompson, 1988) was used to calculate differential cross-sections under the assumption of a single-step reaction, in order to assign the transferred angular momentum, , and extract the neutron width, . Calculations were performed using the first-order distorted-wave Born approximation since at these low energies the breakup effects on the deuteron in the entrance channel are minimal (Johnson & Soper, 1970). Past 20Ne()21Ne transfer reactions reported in Stanford & Quin (1980) have observed significant deviation between the expected differential cross section and the observed data at angles higher than ° degrees. For this reason, ° data was not used to assign . The ° data were used to determine and constrain the total width for observed states.
The optical model potentials for 20Ne, 21Ne, 20Ne, and 20Ne were taken from An & Cai (2006), Varner et al. (1991), Madland (1997), Yahiro et al. (1986) and Menet et al. (1971), respectively. Spectroscopic factors () relating the DWBA and experimental cross sections:
| (1) |
were found by normalising the calculations to the experimental data. Example differential cross sections for four states are shown in Fig. 2. Two states with known (the , -keV state and , -keV state) have been included to demonstrate that the DWBA calculations reproduce the data well. Two states with inconclusive assignments are also shown.
The wave-functions from fresco, , were used to compute the neutron widths, as in Iliadis (1997):
| (2) |
where is the penetrability of a neutron of energy and orbital angular momentum evaluated at the radius ; is the reduced mass. The radius, , was chosen to be where the 20Ne wave-function is at 99% of the asymptotic value (Meyer et al., 2020) and varied for different binding energies and . We used the weak-binding approximation, calculating at various positive binding energies and extrapolating with a quadratic function to the negative, physical neutron binding energy (Meyer et al., 2020). The uncertainties resulting from the calculations are much smaller than the uncertainty in the absolute normalisation from other sources.
5 Evaluation of 17O reaction rates
Table 1 summarises the spectroscopic information on relevant states in 21Ne above the -particle threshold. We discuss below the spin-parity assignments of astrophysically important states from which we produce physically-motivated reaction rates, with uncertainties for the first time. A comprehensive discussion on all of the states observed in this work will be presented in a forthcoming paper.
The -, -, - and -keV states all have differential cross sections which are consistent with or assignments. For the are, for , , , and , respectively (for , , , , and keV, respectively). Resonances with of this size would both have been observed in the neutron-scattering study reported in Cohn & Fowler (1959) and would additionally result in visible broadening of the states in the focal-plane spectrum. Since neither of these are observed, is ruled out for all of these states.
The differential cross section of the -keV state is consistent with . This state has been observed in -ray data of Rolfs et al. (1972). An assignment results in a neutron width of more than 100 eV. Based on lifetimes reported in that work, this neutron width greatly exceeds realistic -ray partial widths. It is, therefore, unlikely that -ray decay from this state would be observed if the assignment were made. We therefore assign this level or .
Close to keV are two states, one narrow at keV (Firestone, 2015; Taggart et al., 2019), likely not observed in this experiment, and a broader one at keV, likely the state populated in the present work. The neutron width ( keV), spin and parity () of the -keV state are known from 20Ne resonance scattering (Cohn & Fowler, 1959). From the current data, we determine keV.
| [keV] | Previous [keV] | [keV] | [eV] | [eV] | Comments | |||
| , | Adopt | |||||||
| , | , | |||||||
| , , | ||||||||
| Adopt | ||||||||
| Adopt | ||||||||
| , | , | |||||||
| Adopt | ||||||||
| From eVe | ||||||||
| eV | ||||||||
| eVd | ||||||||
| , | ||||||||
| meV | ||||||||
| Adopted from Ref. Williams et al. (2022) |
Reaction rates were calculated using the RatesMC Monte Carlo code Longland et al. (2010); Sallaska et al. (2013). Data on directly measured 17O()21Ne and 17O()20Ne resonances were taken from Best et al. (2011, 2013); Williams et al. (2022). The weighted mean with inflated uncertainties described by Longland et al. (2012) was used for the 17O()21Ne resonance strengths to account for systematic uncertainties. For many of the resonances listed in Best et al. (2013) there are no listed uncertainties. These were arbitrarily assumed to be 10% for all widths. For any resonances for which all partial widths could be estimated, the reaction rate was numerically integrated.
For resonances with no measured , the reduced -particle width was sampled from a Porter-Thomas distribution (see Sallaska et al., 2013; Longland et al., 2012, for details). The neutron widths were, where available, taken from the present work. eV was used, from the average of the lifetimes in Rolfs et al. (1972). For resonances where the and are unknown, the ratio of these widths is adopted from Best et al. (2013). Importantly, we adopt the tentative assignment for the -keV resonance from Firestone (2015) which reduces the contribution of this state to the 17O()21Ne reaction rate compared to Best et al. (2013) in which a assignment was used. We furthermore note that a assignment is inconsistent with systematic trends in 21Ne in which no other states at a similar excitation energy decay by -ray emission.
The -keV state was only observed at one angle due to 16O contamination. The peak observed in the present experiment does not appear in the background spectrum and was therefore assumed to be a 21Ne state, but confirmation of this state with additional measurements is required. An angular distribution could not be extracted and the spin remains unconstrained. For the calculation of the rate we adopted the assumptions of Best et al. (2013).
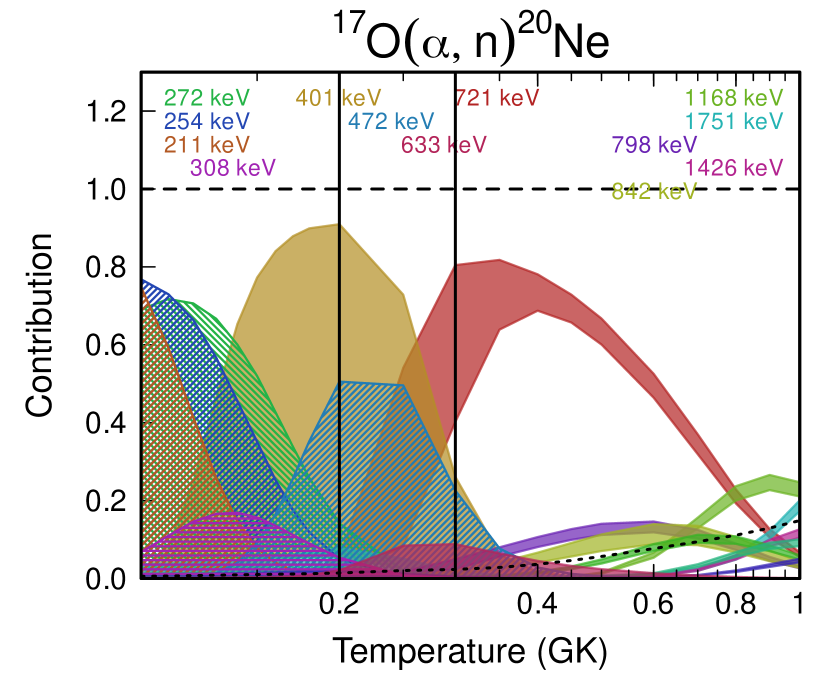
For the 17O()21Ne reaction, the Monte-Carlo calculations show that the dominant contributions are from the resonances at , and keV (, , and keV). The - and -keV resonances have measured strengths (Williams et al., 2022; Taggart et al., 2019; Best et al., 2011). For the 17O()20Ne reaction, the dominant contributions are from the -, - and -keV resonances (, and keV) with a small contribution from the -keV resonance. The dominant contributions to the uncertainty in the reaction-rate ratio are the unknown partial widths.
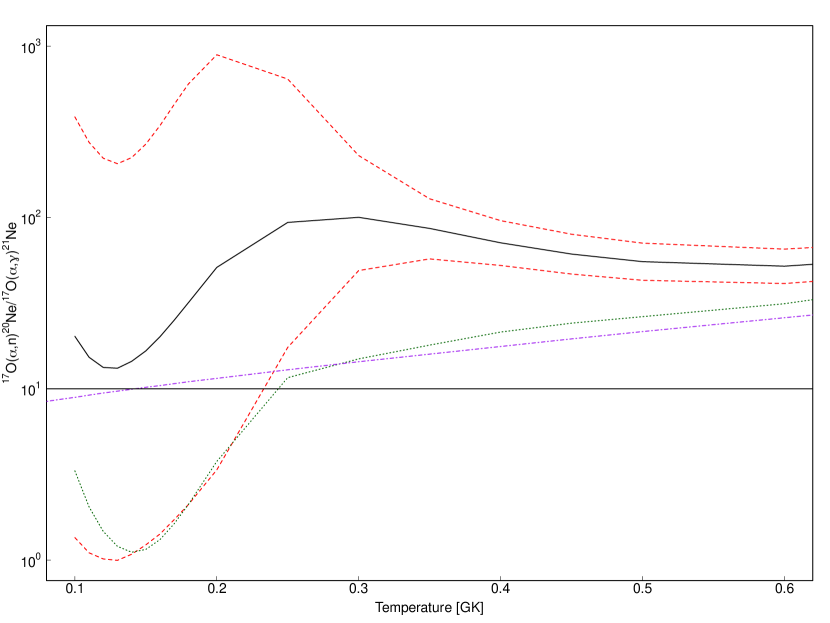
The 17O()20Ne to 17O()21Ne reaction-rate ratio for our median rates is presented in Fig. 3. Also shown are ‘high’ and ‘low’ ratios from our work, and those from Caughlan & Fowler (1988) and Best et al. (2013). The present ratio is significantly higher than that of Best et al. between 0.25 and 0.7 GK for a number of reasons. There are some inconsistencies in the data in Table II of Best et al. (2013) (e.g. the -keV resonance state), for which the listed resonance strengths are in disagreement with the and ratio (Best, 2021). We have, additionally, changed spin-parity assignments where appropriate resulting in some changes in contributions of states to the reaction rates. Lastly, we have utilised the direct 17O()21Ne measurements from DRAGON (Williams et al., 2022).
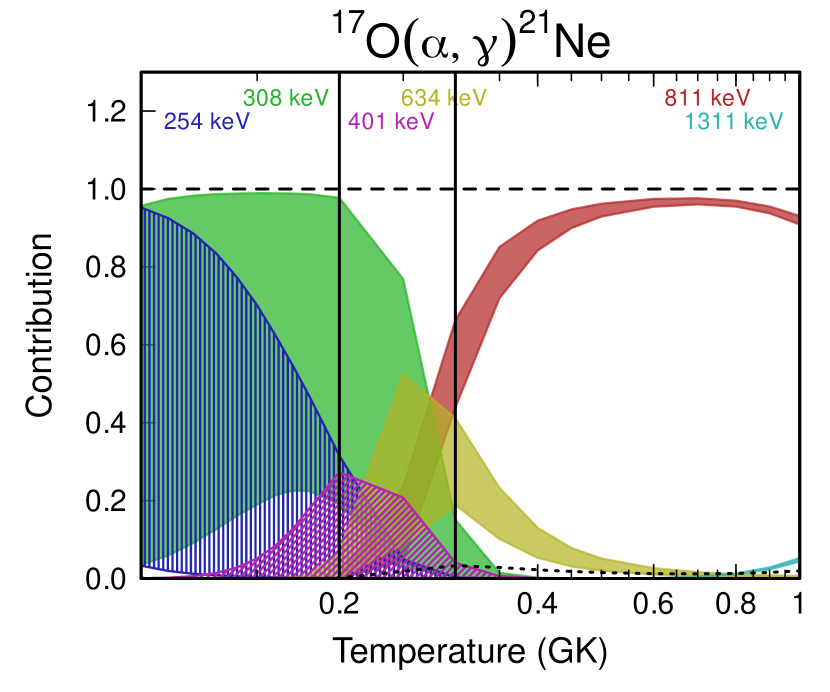
Contribution plots for the two reactions are shown in Fig. 4 (see caption for details). For the 17O()21Ne reaction, the main contribution within the astrophysically relevant region is the -keV resonance, for which no estimate of the -particle width is yet available. More resonances can potentially contribute to the 17O()20Ne reaction, since for many of these resonances the neutron partial width is known to be much larger than the -ray partial width. For most resonances, therefore, the -ray decay is vanishingly small and these states cannot meaningfully contribute to the flux of abundances through the 17O()21Ne reaction.
| [GK] | Lower | Recommended | Upper |
| 0.100 | 2.1810-22 | 1.2010-21 | 5.3310-21 |
| 0.110 | 3.6710-21 | 2.0510-20 | 9.1910-20 |
| 0.120 | 3.9110-20 | 2.2110-19 | 1.0110-18 |
| 0.130 | 2.9410-19 | 1.6810-18 | 7.9510-18 |
| 0.140 | 1.6810-18 | 9.5910-18 | 4.6610-17 |
| 0.150 | 7.7110-18 | 4.3810-17 | 2.1810-16 |
| 0.160 | 3.0010-17 | 1.6710-16 | 8.4310-16 |
| 0.170 | 1.0110-16 | 5.4610-16 | 2.8110-15 |
| 0.180 | 2.9910-16 | 1.5910-15 | 8.2210-15 |
| 0.200 | 2.1310-15 | 1.0210-14 | 5.1310-14 |
| 0.250 | 3.2310-13 | 5.8410-13 | 1.7110-12 |
| 0.300 | 4.5410-11 | 5.5310-11 | 6.9410-11 |
| 0.350 | 2.4310-09 | 2.7010-09 | 3.0210-09 |
| 0.400 | 5.2410-08 | 5.6810-08 | 6.1810-08 |
| 0.450 | 5.7610-07 | 6.2110-07 | 6.6910-07 |
| 0.500 | 3.9010-06 | 4.1910-06 | 4.5010-06 |
| 0.600 | 6.7410-05 | 7.2110-05 | 7.7110-05 |
| 0.700 | 5.0310-04 | 5.3710-04 | 5.7210-04 |
| 0.800 | 2.2310-03 | 2.3710-03 | 2.5310-03 |
| 0.900 | 7.0410-03 | 7.4810-03 | 7.9510-03 |
| 1.000 | 1.7610-02 | 1.8710-02 | 1.9810-02 |
| [GK] | Lower | Recommended | Upper |
| 0.100 | 7.0410-21 | 2.5210-20 | 8.7510-20 |
| 0.110 | 9.9810-20 | 3.2410-19 | 1.0510-18 |
| 0.120 | 1.0110-18 | 3.0010-18 | 9.1310-18 |
| 0.130 | 7.9210-18 | 2.2210-17 | 6.4010-17 |
| 0.140 | 5.0210-17 | 1.3810-16 | 3.9110-16 |
| 0.150 | 2.6610-16 | 7.3010-16 | 2.1410-15 |
| 0.160 | 1.2010-15 | 3.4010-15 | 1.0710-14 |
| 0.170 | 4.7510-15 | 1.4210-14 | 4.7810-14 |
| 0.180 | 1.7010-14 | 5.3010-14 | 1.9110-13 |
| 0.200 | 1.7010-13 | 5.5810-13 | 2.2310-12 |
| 0.250 | 3.6310-11 | 7.3010-11 | 2.3510-10 |
| 0.300 | 4.7210-09 | 5.7810-09 | 9.4410-09 |
| 0.350 | 1.9210-07 | 2.1510-07 | 2.5710-07 |
| 0.400 | 3.2410-06 | 3.5410-06 | 3.9510-06 |
| 0.450 | 2.9910-05 | 3.2310-05 | 3.5410-05 |
| 0.500 | 1.8010-04 | 1.9410-04 | 2.1010-04 |
| 0.600 | 2.9010-03 | 3.0810-03 | 3.2810-03 |
| 0.700 | 2.4610-02 | 2.5910-02 | 2.7210-02 |
| 0.800 | 1.4910-01 | 1.5510-01 | 1.6110-01 |
| 0.900 | 7.2910-01 | 7.5610-01 | 7.8410-01 |
| 1.000 | 3.0310+00 | 3.1310+00 | 3.2510+00 |
6 Astrophysical Implications
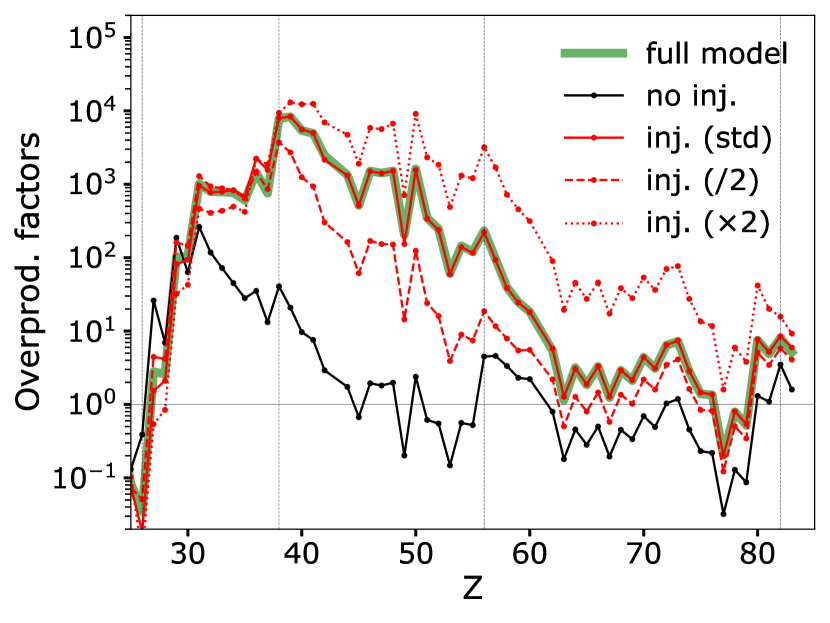
We tested the impact of the new 17O()20Ne and 17O()21Ne rates on s-process nucleosynthesis using a simplified one-zone nucleosynthesis code mimicking core helium burning. Details on this code can be found in Choplin et al. (2016). The code was also used in Placco et al. (2020) to make comparisons with an observed star enriched in trans-iron elements. We follow the central temperature and density profiles obtained from a complete rotating 25 stellar model at a metallicity of in mass fraction, computed with the Geneva stellar evolution code (Eggenberger et al., 2008). The initial composition of the one-zone code is extracted from the core of this stellar model, at core helium-burning ignition. To mimic rotation, 13C and 14N are injected (cf. Sect. 1) at a constant rate (expressed in yr-1) during the nucleosynthesis calculation (Choplin et al., 2016). During injection, times more 14N as 13C is injected as a typical value in full stellar models (e.g. Fig. 9 in Choplin et al., 2018). This factor of corresponds to the CNO 14N/13C equilibrium ratio at MK, which is found at the bottom of the H-burning shell in massive stars. The injection rate was calibrated so as to reproduce the central abundances of a full rotating stellar model at the end of the core helium-burning phase. For this calibration, we used the same rates as in the full stellar model, namely the rates of Best et al. (2013) for 17O()21Ne and 17O()20Ne, the rates of Longland et al. (2012) for 22Ne()26Mg and 22Ne()25Mg and the rate from Guo et al. (2012) for 13C()16O. The adopted standard injection rate is yr-1 and produces the overproduction factors111The overproduction factors are expressed as where represent the initial/final mass fractions. shown by the solid red line in Fig 5. For most elements, it deviates by less than 5 % from the full model (green pattern). Cases with higher (red dotted line) and lower (red dashed line) injection rates are shown for comparison. Without injection, we obtain a typical weak s-process pattern from non-rotating massive stars (black pattern).
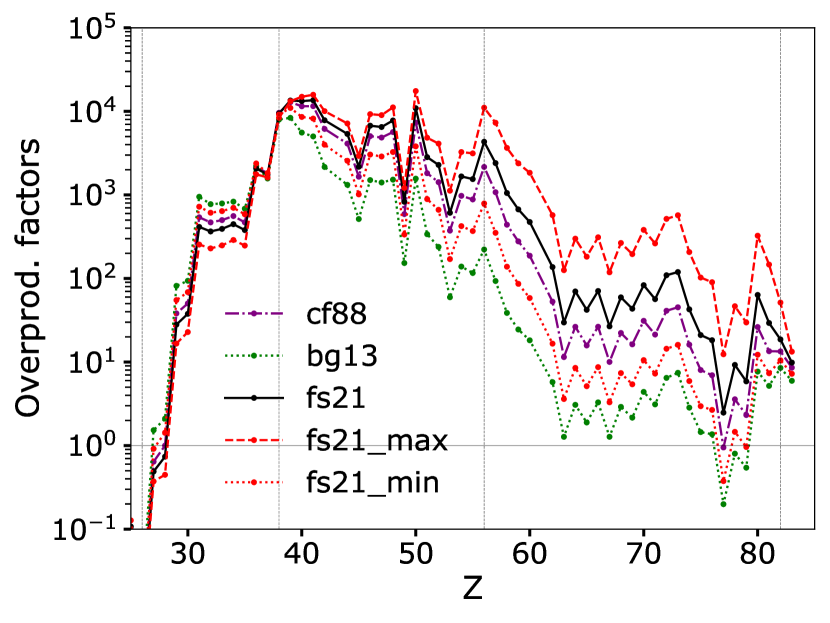
In the left panel of Fig. 6, all one-zone models were computed with the standard injection rate of yr-1 obtained from the calibration discussed previously. The only differences between the models shown in Fig. 6 (left panel) and the model shown by the solid red line in Fig. 5 are the rates of 17O()20Ne and 17O()21Ne. The recommended reaction rates were used (fs21), as well as the limiting cases of the minimum (fs21_min) and maximum (fs21_max) ()/() ratio. These results show that the s-process in rotating massive stars is likely to continue at least to barium, and potentially up to lead for the largest ()/) reaction-rate ratio. The scatter for elements with atomic number goes up to about 2 dex. The bg13 and fs21_min sets have the lowest 17O()20Ne/17O()21Ne ratios (Fig. 3) hence giving the lowest yields (green and red dotted pattern). The cf88 and fs21 sets with higher ()/() ratios substantially produce elements with and the fs21_max set shows the highest yields, as expected from the high ()/() ratio.
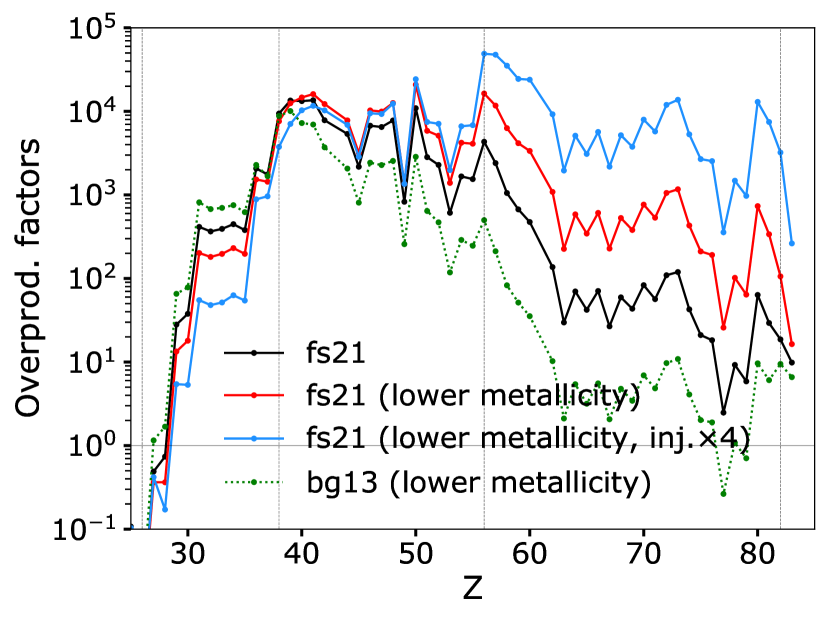
As an estimate of the impact of the new rate at very low metallicity, we include in the right panel of Fig. 6 a one-zone calculation similar to the fs21 model (black pattern) but computed with an initial composition corresponding to a metallicity of in mass fraction (red pattern). This shows that a lower initial metallicity combined with a similar neutron production leads to a stronger overproduction of elements heavier than atomic number at the expense of lighter elements. This is even more visible if considering a higher injection rate (green pattern) which would correspond to a more efficient rotational mixing in full stellar models. A higher injection rate at lower metallicity is not unrealistic since rotational mixing is expected to be more efficient with decreasing metallicity (e.g. Maeder & Meynet, 2001). We note that contrary to the fs21 rates, the bg13 rates at lower metallicity do not lead to significant changes in the overproduction factors (compare the green patterns in the two panels of Fig. 6) Full stellar models would be required to get a more accurate estimate of the overproduction factors.
7 Conclusions
For the first time, available data on the energies, spins, parities and partial widths of excited states in 21Ne have been thoroughly evaluated including a careful consideration of their ambiguities and uncertainties. In addition, states in 21Ne have been populated via the 20Ne()21Ne reaction, using an implanted 20Ne target. Angular distributions and neutron widths for states within the Gamow window for massive-star He-core burning were extracted. By combining these data with the evaluated data, reaction rates for 17O()20Ne and 17O()21Ne have been calculated using updated excitation energies, assignments and experimentally derived neutron widths. Using the RatesMC Monte Carlo code, uncertainties have been estimated consistently for the first time. Our recommended rates indicate enhanced s-process abundances between Sr and Pb. Production of these elements via the enhanced weak s-process in massive stars significantly shortens the timescale for the production of Pb (otherwise only produced via the main s-process in low-mass stars with much longer lifetimes) and provides an alternative to the r-process for producing elements between Fe and Ba in the early Universe. Experimental constraints on the -widths of the key states in 21Ne are thus crucial to allow the production of elements above barium in such massive stars, and so for the evolution of elements heavier than iron in the early Universe to be understood.
acknowledgements
The authors thank Nick Keeley and Andreas Best for useful discussions. JFS, AML, CB and CD thank the UK Science and Technology Facilities Council (STFC). PA thanks the trustees and staff of Claude Leon Foundation for support in the form of a Postdoctoral Fellowship. RL, CM, FP, and KS thank the U.S. Department of Energy, Office of Science, Office of Nuclear Physics, for support under Grant No. DE-SC0017799 and Contract No. DE-FG02-97ER41041. This work was supported by the Fonds de la Recherche Scientifique-FNRS under Grant No IISN 4.4502.19. This paper is based upon work from the ‘ChETEC’ COST Action (CA16117), supported by COST (European Cooperation in Science and Technology). RH acknowledges support from the IReNA AccelNet Network of Networks, supported by the National Science Foundation under Grant No. OISE-1927130 and from the World Premier International Research Centre Initiative (WPI Initiative), MEXT, Japan. RH also acknowledges funding from the European Union’s Horizon 2020 research and innovation programme under grant agreement No 101008324 (ChETEC-INFRA).
Data Availability
The nuclear physics data used in the evaluation are available from NNDC (https://www.nndc.bnl.gov) via ENSDEF and EXFOR. The reaction rates in tabular form will be available as part of the Starlib reaction rate library (https://github.com/Starlib/Rate-Library). Other data arising from the present work are available on reasonable request to the corresponding author.
References
- An & Cai (2006) An H., Cai C., 2006, Physical Review C, 73, 054605
- Andritsopoulos et al. (1981) Andritsopoulos G., Catford W., Garman E., Pringle D., Fifield L., 1981, Nuclear Physics A, 372, 281
- Banerjee et al. (2019) Banerjee P., Heger A., Qian Y.-Z., 2019, ApJ, 887, 187
- Baraffe et al. (1992) Baraffe I., El Eid M. F., Prantzos N., 1992, A&A, 258, 357
- Best (2021) Best A., 2021, Private Communication
- Best et al. (2011) Best A., et al., 2011, Phys. Rev. C, 83, 052802
- Best et al. (2013) Best A., et al., 2013, Phys. Rev. C, 87, 045805
- Caughlan & Fowler (1988) Caughlan G. R., Fowler W. A., 1988, Atomic Data and Nuclear Data Tables, 40, 283
- Cescutti et al. (2013) Cescutti G., Chiappini C., Hirschi R., Meynet G., Frischknecht U., 2013, A&A, 553, A51
- Choplin et al. (2016) Choplin A., Maeder A., Meynet G., Chiappini C., 2016, A&A, 593, A36
- Choplin et al. (2018) Choplin A., Hirschi R., Meynet G., Ekström S., Chiappini C., Laird A., 2018, A&A, 618, A133
- Cohn & Fowler (1959) Cohn H. O., Fowler J. L., 1959, Phys. Rev., 114, 194
- Dudek & Edens (1971) Dudek A., Edens D., 1971, Physics Letters B, 36, 309
- Eggenberger et al. (2008) Eggenberger P., Meynet G., Maeder A., Hirschi R., Charbonnel C., Talon S., Ekström S., 2008, Ap&SS, 316, 43
- Firestone (2015) Firestone R. B., 2015, Nuclear Data Sheets, 127, 1
- Frischknecht et al. (2012) Frischknecht U., Hirschi R., Thielemann F.-K., 2012, A&A, 538, L2
- Frischknecht et al. (2016) Frischknecht U., et al., 2016, MNRAS, 456, 1803
- Frost-Schenk (2020) Frost-Schenk J. W., 2020, PhD thesis, University of York, http://etheses.whiterose.ac.uk/28004/
- Guo et al. (2012) Guo B., et al., 2012, ApJ, 756, 193
- Hallock et al. (1975) Hallock J., Enge H., Garrett J., Middleton R., Fortune H., 1975, Nuclear Physics A, 252, 141
- Hoffman et al. (1989) Hoffman A., et al., 1989, Z. Phys. A., 332, 289
- Iliadis (1997) Iliadis C., 1997, Nuclear Physics A, 618, 166
- Johnson & Soper (1970) Johnson R. C., Soper P. J. R., 1970, Phys. Rev. C, 1, 976
- Langer et al. (1989) Langer N., Arcoragi J.-P., Arnould M., 1989, A&A, 210, 187
- Limongi & Chieffi (2018) Limongi M., Chieffi A., 2018, ApJS, 237, 13
- Longland et al. (2010) Longland R., Iliadis C., Champagne A. E., Newton J. R., Ugalde C., Coc A., Fitzgerald R., 2010, Nucl. Phys. A, 841, 1
- Longland et al. (2012) Longland R., Iliadis C., Karakas A. I., 2012, Phys. Rev. C, 85, 065809
- Madland (1997) Madland D. G., 1997, OECD/NEA
- Maeder & Meynet (2001) Maeder A., Meynet G., 2001, A&A, 373, 555
- Marshall et al. (2018) Marshall C., Setoodehnia K., Kowal K., Portillo F., Champagne A. E., Hale S., Dummer A., Longland R., 2018, IEEE Transactions on Instrumentation and Measurement, 68, 533
- Menet et al. (1971) Menet J., Gross E., Malanify J., Zucker A., 1971, Physical Review C, 4, 1114
- Meyer et al. (2020) Meyer A., et al., 2020, Phys. Rev. C, 102, 035803
- Mohr (2017) Mohr P., 2017, Phys. Rev. C, 96, 045808
- Pignatari et al. (2008) Pignatari M., Gallino R., Meynet G., Hirschi R., Herwig F., Wiescher M., 2008, ApJ, 687, L95
- Placco et al. (2020) Placco V. M., et al., 2020, ApJ, 897, 78
- Prantzos et al. (1990) Prantzos N., Hashimoto M., Nomoto K., 1990, A&A, 234, 211
- Raiteri et al. (1991) Raiteri C. M., Busso M., Picchio G., Gallino R., 1991, ApJ, 371, 665
- Rolfs et al. (1972) Rolfs C., Trautvetter H., Kuhlmann E., Riess F., 1972, Nuclear Physics A, 189, 641
- Sallaska et al. (2013) Sallaska A. L., Iliadis C., Champange A. E., Goriely S., Starrfield S., Timmes F. X., 2013, The Astrophysical Journal Supplement Series, 207, 18
- Stanford & Quin (1980) Stanford A., Quin P., 1980, Nuclear Physics A, 342, 283
- Taggart et al. (2019) Taggart M., et al., 2019, Physics Letters B, 798, 134894
- The et al. (2007) The L.-S., El Eid M. F., Meyer B. S., 2007, ApJ, 655, 1058
- Thielemann et al. (2011) Thielemann F. K., et al., 2011, Progress in Particle and Nuclear Physics, 66, 346
- Thompson (1988) Thompson I. J., 1988, Computer Physics Reports, 7, 167
- Thummerer et al. (2003) Thummerer S., et al., 2003, Journal of Physics G: Nuclear and Particle Physics, 29, 509
- Varner et al. (1991) Varner R., Thompson W., McAbee T., Ludwig E., Clegg T., 1991, Physics Reports, 201, 57
- Wheldon, C. et al. (2005) Wheldon, C. et al., 2005, Eur. Phys. J. A, 26, 321
- Williams et al. (2022) Williams M., et al., 2022, Accepted in Phys. Rev. C
- Yahiro et al. (1986) Yahiro M., Iseri Y., Kameyama H., Kamimura M., Kawai M., 1986, Progress of Theoretical Physics Supplement, 89, 32