The isotropic -ray emission above 100 GeV: where do very high energy rays come from?
Abstract
Astrophysical sources of very high energy (VHE; GeV) rays are rare, since GeV and TeV photons can be only emitted in extreme circumstances involving interactions of relativistic particles with local radiation and magnetic fields. In the context of the Fermi Large Area Telescope (LAT), only a few sources are known to be VHE emitters, where the largest fraction belongs to the rarest class of active galactic nuclei: the blazars. In this work, we explore Fermi-LAT data for energies GeV and Galactic latitudes in order to probe the origin of the extragalactic isotropic -ray emission. Since the production of such VHE photons requires very specific astrophysical conditions, we would expect that the majority of the VHE photons from the isotropic -ray emission originate from blazars or other extreme objects like star-forming galaxies, -ray bursts, and radio galaxies, and that the detection of a single VHE photon at the adopted Galactic latitudes would be enough to unambiguously trace the presence of such a counterpart. Our results suggest that blazars are, by far, the dominant class of source above 100 GeV, although they account for only % of the extragalactic VHE photons. The remaining of the VHE photons still have an unknown origin.
1 Introduction
Emitting photons with energies greater than 100 GeV is challenging. In nature, such photons are typically produced under extreme conditions surrounding compact astrophysical sources (Rieger et al., 2013), such as pulsars or black holes, where charged particles can be accelerated up to relativistic energies and hence emit very high energy (VHE, GeV) rays via inverse Compton (IC) scattering and/or curvature radiation (Sturrock, 1971; Caraveo, 2014; Blandford et al., 2019). Above GeV, only a few hundred -ray sources are significantly detected (Wakely & Horan, 2008; Ackermann et al., 2016) with the Fermi Large Area Telescope (LAT) and ground-based observatories, like the High Energy Stereoscopic System (Funk et al., 2004), the Very Energetic Radiation Imaging Telescope Array System (Weekes et al., 2002), and the Major Atmospheric Gamma Imaging Cherenkov Telescopes (Baixeras et al., 2003).
As listed in TeVCat111http://tevcat2.uchicago.edu/ (Wakely & Horan, 2008) and the Second Fermi-LAT Catalog of High-Energy Sources222https://fermi.gsfc.nasa.gov/ssc/data/access/lat/2FHL/ (2FHL; Ackermann et al., 2016), the extragalactic VHE sky is dominated by blazars, which are radio-loud active galactic nuclei with a relativistic jet directed toward the observer (Urry & Padovani, 1995; Blandford et al., 2019). Blazars are known for their multifrequency variable emission and are divided mainly into BL Lacs and Flat Spectrum Radio Quasars, which differ mostly by the absence or presence of broad emission lines ( Å) from an accretion disk in their optical spectra and a flat radio spectrum (Massaro et al., 2009). On the other hand, most of the VHE Galactic sources are associated to supernova remnants and pulsar wind nebulae (Ackermann et al., 2016), i.e., sources where effective acceleration of particles in magnetic fields is followed by their interactions with the surrounding gas and radiation fields (Reynolds et al., 2012), thus emitting rays. Other important contributions to the VHE sky come from Milky Way’s interstellar medium, where rays are produced via cosmic ray interactions with gas and photon fields of star forming regions (Ackermann et al., 2012a); and from the Fermi bubbles, which are two large structures extending up to nearly in Galactic latitude, for which the origin is still under debate (Su et al., 2010; Ackermann et al., 2014; Miller & Bregman, 2016).
The large positional uncertainty of -ray observations, especially below 1 GeV, makes the association of -ray sources with their low-energy counterparts a challenging task (Massaro et al., 2016), as several astrophysical objects can lie within their positional reconstruction confidence regions (Massaro et al., 2016; Abdollahi et al., 2020, 2022). Therefore, the astrophysical community relies on statistical association methods, where observed quantities are used to compute an association probability between the -ray source and its counterpart candidates (Sutherland & Saunders, 1992; Ackermann et al., 2011; Abdollahi et al., 2020; de Menezes et al., 2020).
At high Galactic latitudes (i.e., ), where -ray emission from interstellar medium and Fermi bubbles is almost negligible, most of the photons with more than 100 GeV could in principle be associated with blazars, especially with the BL Lac type (Massaro et al., 2013), which typically present harder -ray spectra. At such energies, the 68% containment radius for a single photon detection with Fermi-LAT is (Atwood et al., 2009), and therefore this single detection could unveil the presence of a blazar. Blazars indeed account for nearly 80% of the sources listed in the third data release of the Fermi-LAT fourth source catalog (4FGL-DR3; Abdollahi et al., 2020, 2022) for such Galactic latitudes and are prone to emit VHE photons via inverse Compton processes (especially BL Lac objects).
In this work, we investigate the origin of the isotropic -ray emission for energies GeV and Galactic latitudes . We want to test whether this isotropic VHE emission can be interpreted as coming from a population (or many populations) of sources. In other words, we want to test if the detection of a single VHE photon can be attributed to a potential astrophysical counterpart. At such energies and Galactic latitudes, blazars are by far the dominant population of sources in the sky and we would expect them to have a major role in the extragalactic isotropic -ray emission (Wakely & Horan, 2008; Ackermann et al., 2016). Furthermore, recent theoretical results (Roth et al., 2021) suggest that star-forming galaxies may account for most (if not all) isotropic -ray emission in the Fermi-LAT energy band. As an additional piece of information, we know that VHE photons cannot travel through cosmological distances due to - interactions with the extragalactic background light (EBL; Finke et al., 2010; Domínguez et al., 2011; Gilmore et al., 2012; Domínguez et al., 2013), implying that the VHE sky is mainly dominated by photons coming from redshifts . At such depth, the counterparts of the majority of the GeV photons must be relatively nearby sources accessible to lower-energy surveys.
Results achieved in this work will have direct applications to the science developed with the upcoming Cherenkov Telescope Array (aka CTA; Actis et al., 2011; Acharya et al., 2013). This paper is organized as follows. In §2, we describe the selections we apply to Fermi-LAT data and in §3 we describe the analysis methods. In §4 we detail the results for the adopted sky regions and, finally, we summarize and conclude our findings in §5.
2 Data selection
This work uses data collected by the Fermi-LAT during its first 12.5 years of operation, i.e., from August 4th 2008 to February 10th 2021, with energies above 100 GeV. We select only Fermi-LAT events belonging to the SOURCEVETO class (evclass ; Bruel et al., 2018), which is one of the cleanest event classes in Pass 8 (Atwood et al., 2013) and is recommended for studies of diffuse emission that require low levels of cosmic-ray contamination333Additional information about all types of event classes can be found in the Fermi Science Support Center webpage: https://fermi.gsfc.nasa.gov/ssc/data/analysis/documentation/Cicerone/Cicerone_Data/LAT_DP.html. We consider events converted in the front or back sections of the telescope tracker (evtype ), and in two regions of interest (ROIs) above in Galactic latitude, hereinafter referred as north and south ROIs. At such latitudes, we avoid 90% of the predicted Galactic interstellar -ray emission at energies around 100 GeV, and discard nearly 95% of the Galactic sources listed in 4FGL-DR3. To reduce the contamination from the Earth limb, a maximum zenith angle cut of is applied, and we apply the standard good time interval filter DATA_QUAL and the recommended instrument science configuration LAT_CONFIG .
For the main analysis, no exposure maps, livetime cubes or source maps are computed. We aim to analyze each event of our dataset individually. To estimate the Galactic contribution at such high latitudes and energies, we compare the predicted number of photons from four distinct Galactic models, namely gll_iem_v07, gll_iem_v06, gll_iem_v05 and gal_2yearp7v6_v0 in the energy range 100–500 GeV for both ROIs. This energy range has been chosen because the Galactic models prior to gll_iem_v07 do not reach TeV energies. For each model, we compute the total number of VHE photons by directly integrating them over the time, energy, and solid angle intervals adopted here. These Galactic models are compositions of several multiwavelength templates mapping the gas and dust in the Milky Way and differ in several aspects, as in the angular resolution of the gas distributions, and the gas and dust density/velocity profiles over the Galaxy444The several components used in the Galactic model gll_iem_v07 can be found on a document in this website: https://fermi.gsfc.nasa.gov/ssc/data/access/lat/BackgroundModels.html. Unfortunately, this work was not published in a peer-reviewed journal.. We select the upper and lower values for the total number of photons estimated with these Galactic models as the systematic error band (in the 100–500 GeV energy range) and consider the predicted number of photons from gll_iem_v07 to be the most accurate value among all the models, since it is the latest model released to date. When we extrapolate these values for energies GeV (based on the energy distribution of photons in our dataset) and consider the Poissonian statistical error on the total number of photons, we get a total of (sys) (stat) and (sys) (stat) photons predicted by the Galactic model for the northern and southern ROIs, respectively.
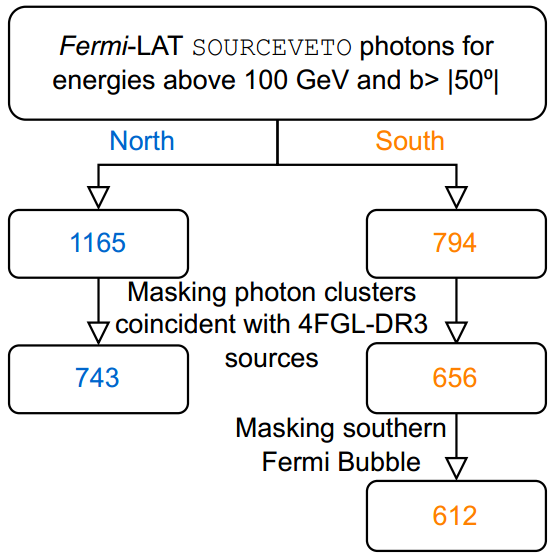
Other major background contributors are the Fermi Bubbles. However, as shown in the next section, only the Southern bubble is a significant source of VHE photons on the analysis performed here and we remove it from our ROI. Our two ROIs are centered in the North and South Galactic poles and include 1165 and 794 VHE photons, respectively. This substantial difference in the number of photons is caused mainly by the uneven coverage of the sky performed by Fermi-LAT, which has a deeper exposure towards the Northern Galactic hemisphere (Ackermann et al., 2012b) and by the presence of Mkn 421 in the northern ROI.
3 Methods
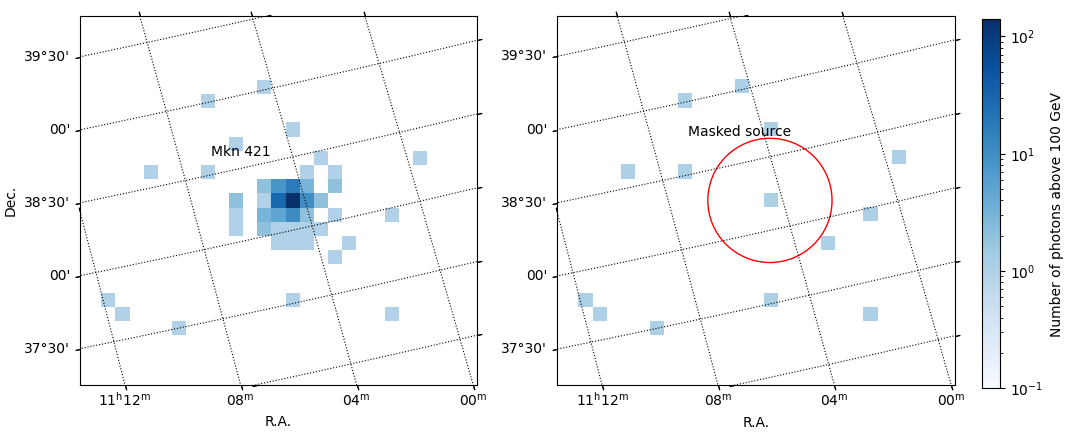
Several -ray blazars are relatively bright VHE sources. The VHE photons that they emit appear as clusters of events in the LAT data. In order to avoid to erroneously associate these clustered photons with multiple sources, we start our analysis by crossmatching the VHE photons with 4FGL-DR3 and masking those photon clusters coincident with 4FGL-DR3 sources, such that, to the aims of our analysis, they are represented by a single photon centered on the position of the -ray counterpart listed in 4FGL-DR3. From now on, we refer to our sample of photons after masking as “equivalent photons”, since some of them may represent clusters of photons. In Figure 1 we show the effect of applying the mask to Mkn 421, where all VHE photons lying within a radius of from the -ray source center are substituted by a single equivalent photon. Adopting this strategy, we aim to be very conservative in excluding any clustering of VHE photons related to 4FGL-DR3: as can be seen in Figure 1, for strong VHE sources, like Mkn 421, a small percentage () of VHE photons can be spread over a radius of . The total number of equivalent photons in the northern ROI drops to 743 after masking 58 clusters, while in the Southern ROI it drops to 656 after masking 41 clusters.
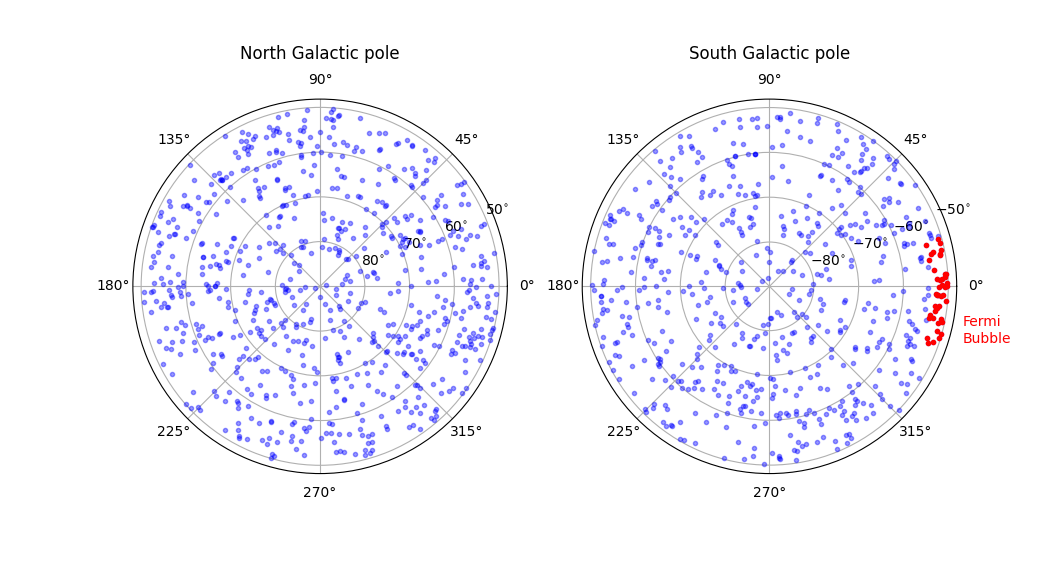
The spatial distribution of equivalent photons after masking photon clusters coincident with 4FGL-DR3 sources is shown in Figure 2, where the panels are centered at the North and South Galactic poles. Differently from the Northern Fermi Bubble, which barely reaches in Galactic latitude and does not contaminate our ROI, the Southern Fermi Bubble extends down to and is a significant source of background for our analysis. We therefore discard all equivalent photons spatially coincident with the bubble, as shown by the red dots in Figure 2. The chosen edges are , in Galactic latitudes, and in Galactic longitude, in accordance with the bubble edges available in Sarkar (2019). The number of discarded equivalent photons is 44, reducing the total number of equivalent photons in the Southern ROI to 612. In Figure 3 we summarize all cuts applied to Fermi-LAT data for both ROIs.
After masking, we assume that each VHE equivalent photon is a potential -ray source and crossmatch them with several catalogs of astrophysical counterparts. Our main catalog is comprised of 5648 blazars collected from Roma-BZCat (Massaro et al., 2015), 4FGL-DR3, and identified in optical spectroscopic campaigns (Massaro et al., 2013; Paggi et al., 2014; Crespo et al., 2016; Marchesini et al., 2019; Peña-Herazo et al., 2019). Most of the blazars listed in this catalog have a confirmed optical spectrum (nearly 100% in the case of BL Lacs) or are confirmed -ray emitters. The impact of adopting other catalogs of -ray sources is discussed in §4.2. To test if these blazars indeed contribute to the VHE isotropic emission, we repeat the matching process for 5000 lists of mock VHE equivalent photons, generated by displacing the original positions of the VHE equivalent photons by a random value between and in a random direction of the sky (see §4).
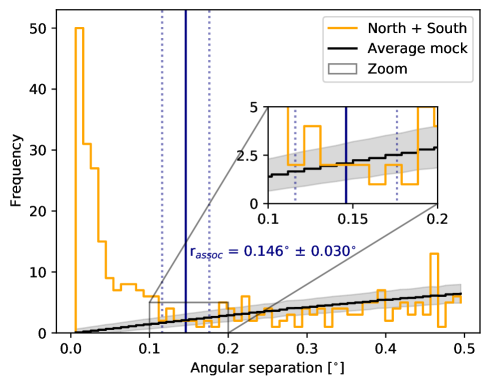
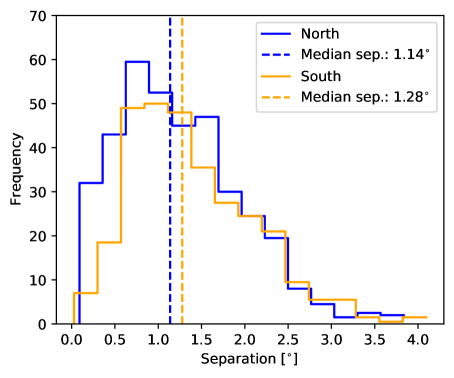
In order to define the optimal association radius, we first perform the crossmatches between the VHE equivalent photons and the sources listed in our main catalog considering a quite large constant association radius , and then compare the distribution of angular separation between the real and mock equivalent photon lists. From Figure 4, we define the optimal association radius to be , beyond which the associations are consistent with noise. This procedure has been successfully adopted in several works searching for the counterparts of -ray sources in radio, infrared and optical bands (more details can be found in Massaro et al., 2013, 2014b, 2014a; Giroletti et al., 2016). We assume to be constant over the adopted energy range, which is reasonable, given that the Fermi-LAT containment radius for photons above 100 GeV is nearly constant (see section 2 in Abdo et al., 2011). If instead we use other catalogs to define the optimal association radius (as those discussed in §4.2), we find very similar values for , all around and consistent within the error region.
4 Results
The results for both ROIs are shown in Figure 5. For the northern ROI (hereinafter represented in blue), we find that equivalent photons (after applying the masks previously discussed and considering the error in ) are associated with blazars. The expected number of random associations derived from our mock lists of VHE equivalent photons is . For the southern ROI (hereinafter represented in orange), we have equivalent photons associated with blazars, with an expected number of random matches of . In this figure, we fit the distributions of mock matches with a Poissonian function and the results indicate that blazars indeed account for a significant fraction of the VHE equivalent photons detected by Fermi-LAT, with an association level of confidence of in the North and in the South. However, most of the VHE equivalent photons still lack an astrophysical counterpart listed in the catalogs adopted in this work.
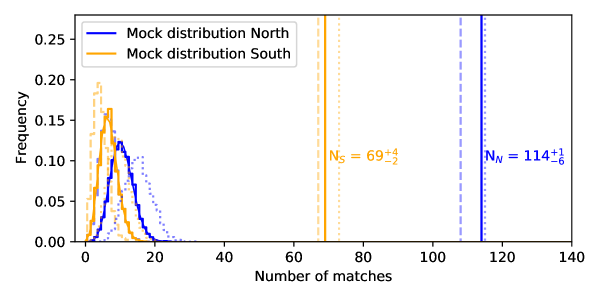
The basic statistics of our findings are shown in Table 1. We observe that % of the VHE equivalent photons in the northern ROI are associated with blazars, while for the southern ROI this fraction is %. Furthermore, only of all blazars scattered over both ROIs, as listed in our main catalog, have a corresponding VHE -ray counterpart detected with Fermi-LAT, most of which () are BL Lac objects, although this class of source only makes 28% of our main catalog. These results tell us that of Fermi-LAT VHE equivalent photons at high Galactic latitudes are unlikely to be originated in blazars. Moreover, as the fraction of associated blazars is smaller than the fraction of associated equivalent photons, it is unlikely that the high number of non-associations is due to incompleteness in our blazar catalog (more details in §5).
As discussed in §2, the expected number of Galactic VHE photons for both ROIs is in the North and in the South, which correspond to and of all VHE equivalent photons available in both ROIs, respectively. This means that after taking the Galaxy and the blazars into account, roughly 50% of the observed VHE equivalent photons still have unknown origin (assuming that none of the equivalent photons coincident with blazars are spurious or have Galactic origin). This is equivalent to saying that only % of the extragalactic photons have a blazar counterpart and that the remaining of the extragalactic photons have unknown origin. A possible origin for a fraction of these photons, however, can be due to spurious signals induced by cosmic rays at the detector level (see §5).
| North | South | North + South | |
|---|---|---|---|
| Number of equiv. photons | 743 | 612 | 1355 |
| Number of blazars | 977 | 764 | 1741 |
| Matches equiv. photons/blazars | |||
| Median matches mock lists | |||
| Expected number of Galactic photons | |||
| Fraction of associated equiv. photons | |||
| Fraction of associated blazars | |||
| Fraction of photons from the Galaxy | |||
| Frac. of extragal. photons assoc. to blazars | % | % | % |
4.1 Clustering of VHE equivalent photons
There are basically no clusters of VHE equivalent photons within an angular separation of . The exceptions are 8 pairs of equivalent photons in the southern and 15 pairs in the northern ROIs, and none of them match with the blazars in our catalog. These values are compatible with what is expected by chance ( for the north and for the south) when we crossmatch the lists of VHE equivalent photons from both ROIs with 5000 random distributions of VHE photons scattered over the same areas of the sky and with the same size of our original sample of equivalent VHE photons. In Figure 6, we show the distribution of angular separation between each pair of equivalent photons in our ROIs and their closest neighbors. We see that most VHE equivalent photons are truly isolated in the sky, being typically more than away from each other.
4.2 Repeating the analysis for other catalogs
We repeat the crossmatching process with other catalogs of candidate -ray emitters, again considering the whole sample of VHE equivalent photons and as the association radius (see §3). For FRICAT and FRIICAT, two catalogs of Fanaroff-Riley (FR) radio galaxies (Capetti et al., 2017a, b), we find only 3 matches with FR I galaxies in the Northern ROI. Similarly, if we adopt a catalog containing only the non-blazars in 4FGL-DR3, we find only 8 matches in the North (three radio galaxies, one active galactic nucleus and three unidentified -ray sources, aka UGSs) and 7 in the South (one radio galaxy, one starburst galaxy and five UGSs).
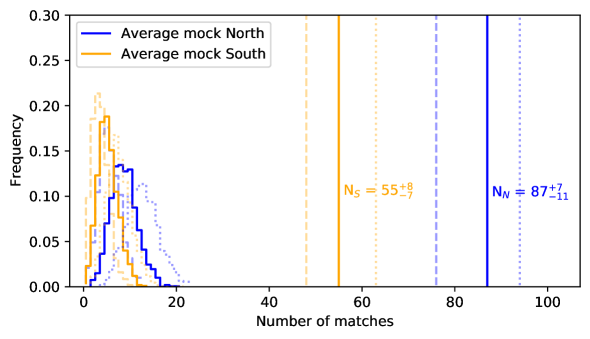
When we use the combined sample of WIBRaLS and KDEBLLACS (hereinafter WISECATS), which are two catalogs of -ray blazar candidates (D’Abrusco et al., 2019; de Menezes et al., 2019) with 15121 sources in total (2468 sources in the Northern and 1929 in the Southern Galactic ROIs, i.e., far more sources than in our main catalog), the total number of matches is only ( equivalent photons in the North and equivalent photons in the South), which is significantly smaller than what we have with our main catalog (see Figure 5). Out of these matches, associations are not common to our main catalog. By taking these matches into account, the fraction of associated equivalent photons shown in Table 1 increases from % to % in the North and from % to % in the South (after subtracting the Galactic photons, the fraction of associated equivalent photons becomes over both ROIs, against the value reported in Table 1). The results for WISECATS are shown in Figure 7 together with the distribution of matches obtained from 5000 mock lists of equivalent photons. In order to properly compute these noise distributions, we first select WISECATS blazar candidates with and, out of those, we randomly select 959 candidates in the North and 730 in the South, so that they match the number of blazars that we have for both ROIs in the main catalog (see Table 1). We then generate 10 lists of mock VHE equivalent photons (as discussed in §3) and crossmatch them with the randomly selected blazar candidates. After repeating this process 500 times, we obtain the final noise distributions with a total of 5000 lists of mock VHE equivalent photons. We therefore conclude that WISECATS, although presenting a higher completeness, do not present better results than our main catalog in spotting VHE blazar candidates.
We also test other catalogs of possible -ray emitters, like the Catalogue of Extreme & High Synchrotron Peaked Blazars (3HSP; Chang et al., 2019) and the Candidate Gamma-Ray Blazar Survey Source Catalog (CGRaBS; Healey et al., 2008). For 3HSP we have a total of matches for both ROIs, but only of them are not common to our main catalog, while for CGRaBS we find matches in the North and in the South, all of them being common to our main catalog. For the Chandra ACIS Survey for X-Ray AGN in Nearby Galaxies (CHANSNGCAT; She et al., 2017), we find only matches in the North and in the South, while for the Australia Telescope National Facility Pulsar Catalogue (ATNF; Manchester et al., 2005) we find only 1 match for each ROI. Additionally, we find only 3 matches for the transient Fermi LAT Second Gamma-Ray Burst Catalog (FERMILGRB; Ajello et al., 2019) and 80 matches for the Fermi GBM Burst Catalog (FERMIGBRST; Gruber et al., 2014; Von Kienlin et al., 2014; Bhat et al., 2016; von Kienlin et al., 2020), this time assuming a larger and fixed association radius of instead of . The arrival times of the VHE photons, however, are not consistent with the trigger times of the -ray bursts, meaning that a correlation is unlikely. Among these alternative catalogs, 3HSP and WISECATS lead the significance on the number of sources associated with VHE equivalent photons. We summarize the matches obtained with these alternative catalogs and the combined significance of both ROIs for each one of them in Table 2.
| Catalog | Matches in the North | Matches in the South | N∘ of sources in both ROIs | Combined sig. () |
|---|---|---|---|---|
| 3HSP | 770 | 35.3 | ||
| ATNF | 92 | 0.5 | ||
| CGRaBS | 506 | 11.5 | ||
| CHANSNGCAT | 473 | 2.8 | ||
| FERMIGBRST* | 44 | 36 | 758 | |
| FERMILGRB* | 1 | 2 | 49 | |
| FRICAT | 120 | 1.3 | ||
| FRIICAT | 72 | 0 | ||
| WISECATS | 4617 | 28.1 |
The situation somewhat changes for the Veron Catalog of Quasars & AGN (VERONCAT; Véron-Cetty & Véron, 2010), where VHE equivalent photons ( in the North and in the South) are associated with active nuclei (mostly quasar candidates), and for the Million Quasars Catalogue (MILLIQUAS; Flesch, 2019), where 1270 VHE equivalent photons ( in the North and in the South) are associated with quasar candidates. These several multiple matches are, of course, a consequence of the very high number of sources in these catalogs, preventing us from precisely tracking the counterparts of the VHE equivalent photons. We also analyze the optical color diagrams of the matches achieved with VERONCAT and MILLIQUAS using the optical colors and magnitudes available in these catalogs, but they do not show any peculiar property over the general populations of VERONCAT and MILLIQUAS sources. We also tested if the VHE equivalent photons match with a list of 35 active galactic nuclei known to host ultrafast outflows (see this list in Fermi-LAT Collaboration, 2021), but we found only a couple of matches, leading to an association significance below .
In a recent work by Roth et al. (2021), the authors found that most (or possibly all) of the isotropic -ray emission could be explained by star-forming galaxies. The authors also argue that for energies TeV, the major contributors to the isotropic -ray emission are nearby () star-forming galaxies. To test this scenario, we collected 64 nearby () star-forming galaxies from Ackermann et al. (2012c), which have unambiguous ongoing star formation, selected based on the presence of dense molecular clouds spotted by the HCN survey (Gao & Solomon, 2004). Our results show that only a couple of these star-forming galaxies match with the VHE equivalent photons, giving an association significance of , and suggesting that nearby () star-forming galaxies (as selected here) may not significantly contribute to the isotropic -ray emission at energies GeV (assuming that the -ray emission of star-forming galaxies is correlated with their infrared emission collected in the HCN survey).
5 Discussion and conclusions
For energies GeV and Galactic latitudes , we would expect the extragalactic isotropic -ray emission to be dominated by blazars or other potential VHE sources, like star-forming and radio galaxies. It is unreasonable to assume that these VHE equivalent photons originate from Galactic VHE objects, like pulsar wind nebulae and supernova remnants, as out of 62 such objects listed in 4FGL-DR3, only two have (both in the Large Magellanic Cloud), and the rest has (Abdollahi et al., 2020, 2022). Above in Galactic latitude, the majority of VHE -ray emitters must be extragalactic. In fact, in the third data release of 4FGL, only 1.4% of the -ray sources with are associated with Galactic counterparts (i.e. 18 pulsars and one binary system), while 79% of them are associated with blazars.
After subtracting the expected number of Galactic VHE photons from our sample, we are left with equivalent photons (North + South). In the most optimistic scenario, where all blazar associations are real, only % of these equivalent photons can be associated with blazars, leaving of the isotropic -ray emission unexplained. Given the incompleteness of our main catalog (described in §3), the real fraction of associations can be higher, however, if incompleteness is really the problem, in §4.2 we should observe more matches with WISECATS than with our main catalog, as this catalog has a much higher completeness for BL Lac objects, which are the main candidates for VHE emission (Massaro et al., 2013). Our results therefore tend to disfavor unknown blazars as the sources of the majority of VHE equivalent photons from the extragalactic isotropic -ray emission. Instead, we could speculate other origins for them, like for instance the scattering of the EBL by ultra-high energy cosmic rays or the scattering of soft photons in the Galactic halo that are not appropriately accounted for in the gll_iem_v07 model. The electromagnetic cascades resulting from such interactions could in principle create a truly diffuse isotropic -ray emission (Ackermann et al., 2015). Other possibilities for this emission could rise from the interaction of cosmic rays with the Solar radiation field (Orlando & Strong, 2008) and Solar System debris (Moskalenko & Porter, 2009), which are expected to contribute to the isotropic emission at some still unknown level.
Furthermore, at the detector level, Fermi-LAT can eventually misinterpret a cosmic-ray induced event with a -ray, then introducing a spurious signal to the real data. We reduce the impact of this systematic problem by adopting the SOURCEVETO event class (see §2) in our analysis, which is one of the most stringent Fermi-LAT event reconstruction classes in discriminating cosmic rays from rays, even though it is not 100% effective. In the P8R3 SOURCEVETO Fermi-LAT data adopted in this work, the intensity of cosmic-ray induced events above 100 GeV is roughly constant, with a value of MeV cm-2 s-1 sr-1 (Fermi-LAT Collaboration, 2022, in preparation), which can account for of the events at 100 GeV, at 300 GeV, and less than 10% at 500 GeV. Since of the photons in our sample (before applying the masks) have energies below 300 GeV, the final level of contamination by cosmic rays is . These levels of contamination do not significantly affect the fraction of blazar associations shown in Table 1 since, except for a handful of blazars, all matches in our analysis (before masking) have at least one VHE photon below 300 GeV, where the contamination is minimal.
Previous works on the isotropic -ray emission (see e.g. Harding & Abazajian, 2012; Singal et al., 2012; Ajello et al., 2015) also found that blazars cannot account for all of the extragalactic isotropic -ray emission, although none of them used a method similar to the method adopted here. In Ackermann et al. (2015), the authors found that roughly half of the total extragalactic -ray emission at 100 GeV come from blazars which, in our work, would be equivalent to measuring the total number of photons in both ROIs (before masking) that are originated by blazars. For a matter of comparison, in our work the fraction of photons (before masking) coincident with blazars is , in reasonable agreement with Ackermann et al. (2015), given the significant differences in our analyses. Furthermore, (Roth et al., 2021) recently found that a significant fraction of the isotropic -ray emission at TeV can be attributed to the emission of nearby () star-forming galaxies using a theoretical approach. In this scenario, the VHE emission of star-forming galaxies is generated by cosmic rays accelerated in supernova remnants interacting with the interstellar medium. Our investigation of an observed list of low redshift () star-forming galaxies described in §4.2, disfavors the hypothesis that star-forming galaxies are the origin/counterparts of our list of VHE equivalent photons, at least in the very local Universe ().
In this work we used Fermi-LAT observations to investigate whether the GeV extragalactic isotropic -ray emission above can be explained by blazars. Our results suggest that blazars are not enough to explain this emission and are summarized below.
-
1.
Only % of all equivalent photons in the northern and % in the southern ROIs are associated with blazars. After subtracting the Galactic photons from our sample, the fraction of extragalactic equivalent photons associated with blazars is %. If additionally to the main catalog we also consider WISECATS, this fraction slightly increases to . This result suggests that the detection of a single VHE ray at does not unambiguously lead to the detection of a blazar counterpart.
-
2.
Based on the adopted catalogs, we found that of the extragalactic isotropic -ray emission above GeV and has no clear origin.
-
3.
Almost 70% of the matches are with BL Lac objects, which are sources known to typically present harder -ray spectra if compared to other blazars like Flat Spectrum Radio Quasars.
-
4.
The tests we performed with 5000 mock catalogs ensure that the association of blazars with VHE equivalent photons is not by chance and that blazars do have a contribution, although small, in the VHE sky. It is unlikely that the observed small fraction of associations is due to the incompleteness of our catalog. The fact that we have more blazars than photons in both ROIs and also that we performed the same analysis with alternative, and more complete catalogs, rule out this possibility.
With the advent of the CTA (Actis et al., 2011; Acharya et al., 2013) in the upcoming years, new possibilities for investigating VHE sources are expected, helping in the quest of unveiling the origin of the extragalactic isotropic -ray emission.
References
- Abdo et al. (2011) Abdo, A., Ackermann, M., Ajello, M., et al. 2011, The Astrophysical Journal, 734, 116
- Abdollahi et al. (2020) Abdollahi, S., Acero, F., Ackermann, M., et al. 2020, The Astrophysical Journal Supplement Series, 247, 33
- Abdollahi et al. (2022) Abdollahi, S., Acero, F., Baldini, L., et al. 2022, arXiv preprint arXiv:2201.11184
- Acharya et al. (2013) Acharya, B., Actis, M., Aghajani, T., et al. 2013, Astroparticle physics, 43, 3
- Ackermann et al. (2011) Ackermann, M., Ajello, M., Allafort, A., et al. 2011, The Astrophysical Journal, 743, 171
- Ackermann et al. (2012a) Ackermann, M., Ajello, M., Atwood, W., et al. 2012a, The Astrophysical Journal, 750, 3
- Ackermann et al. (2012b) Ackermann, M., Ajello, M., Albert, A., et al. 2012b, Physical Review D, 86, 022002
- Ackermann et al. (2012c) Ackermann, M., Ajello, M., Allafort, A., et al. 2012c, The Astrophysical Journal, 755, 164
- Ackermann et al. (2014) Ackermann, M., Albert, A., Atwood, W., et al. 2014, The Astrophysical Journal, 793, 64
- Ackermann et al. (2015) Ackermann, M., Ajello, M., Albert, A., et al. 2015, The Astrophysical Journal, 799, 86
- Ackermann et al. (2016) Ackermann, M., Ajello, M., Atwood, W. B., et al. 2016, The Astrophysical Journal Supplement Series, 222, 5
- Actis et al. (2011) Actis, M., Agnetta, G., Aharonian, F., et al. 2011, Experimental Astronomy, 32, 193
- Ajello et al. (2015) Ajello, M., Gasparrini, D., Sánchez-Conde, M., et al. 2015, The Astrophysical Journal Letters, 800, L27
- Ajello et al. (2019) Ajello, M., Arimoto, M., Axelsson, M., et al. 2019, The Astrophysical Journal, 878, 52
- Astropy Collaboration et al. (2013) Astropy Collaboration, Robitaille, T. P., Tollerud, E. J., et al. 2013, A&A, 558, A33, doi: 10.1051/0004-6361/201322068
- Astropy Collaboration et al. (2018) Astropy Collaboration, Price-Whelan, A. M., Sipőcz, B. M., et al. 2018, AJ, 156, 123, doi: 10.3847/1538-3881/aabc4f
- Atwood et al. (2009) Atwood, W., Abdo, A. A., Ackermann, M., et al. 2009, The Astrophysical Journal, 697, 1071
- Atwood et al. (2013) Atwood, W., Albert, A., Baldini, L., et al. 2013, arXiv preprint arXiv:1303.3514
- Baixeras et al. (2003) Baixeras, C., Collaboration, M., et al. 2003, Nuclear Physics B-Proceedings Supplements, 114, 247
- Bhat et al. (2016) Bhat, P. N., Meegan, C. A., von Kienlin, A., et al. 2016, The Astrophysical Journal Supplement Series, 223, 28
- Blandford et al. (2019) Blandford, R., Meier, D., & Readhead, A. 2019, Annual Review of Astronomy and Astrophysics, 57, 467
- Bruel et al. (2018) Bruel, P., Burnett, T., Digel, S., et al. 2018, arXiv preprint arXiv:1810.11394
- Capetti et al. (2017a) Capetti, A., Massaro, F., & Baldi, R. D. 2017a, Astronomy & Astrophysics, 598, A49
- Capetti et al. (2017b) —. 2017b, A&A, 601, A81
- Caraveo (2014) Caraveo, P. A. 2014, Annual Review of Astronomy and Astrophysics, 52
- Chang et al. (2019) Chang, Y. L., Arsioli, B., Giommi, P., Padovani, P., & Brandt, C. H. 2019, A&A, 632, A77, doi: 10.1051/0004-6361/201834526
- Crespo et al. (2016) Crespo, N. Á., Massaro, F., Milisavljevic, D., et al. 2016, The Astronomical Journal, 151, 95
- D’Abrusco et al. (2019) D’Abrusco, R., Crespo, N. Á., Massaro, F., et al. 2019, The Astrophysical Journal Supplement Series, 242, 4
- de Menezes et al. (2020) de Menezes, R., D’Abrusco, R., Massaro, F., Gasparrini, D., & Nemmen, R. 2020, The Astrophysical Journal Supplement Series, 248, 23
- de Menezes et al. (2019) de Menezes, R., Peña-Herazo, H. A., Marchesini, E. J., et al. 2019, Astronomy & Astrophysics, 630, A55
- Domínguez et al. (2013) Domínguez, A., Finke, J. D., Prada, F., et al. 2013, ApJ, 770, 77, doi: 10.1088/0004-637X/770/1/77
- Domínguez et al. (2011) Domínguez, A., Primack, J. R., Rosario, D. J., et al. 2011, MNRAS, 410, 2556, doi: 10.1111/j.1365-2966.2010.17631.x
- Fermi-LAT Collaboration (2021) Fermi-LAT Collaboration, T. 2021, arXiv preprint arXiv:2105.11469
- Finke et al. (2010) Finke, J. D., Razzaque, S., & Dermer, C. D. 2010, ApJ, 712, 238, doi: 10.1088/0004-637X/712/1/238
- Flesch (2019) Flesch, E. W. 2019, arXiv e-prints, arXiv:1912.05614. https://arxiv.org/abs/1912.05614
- Funk et al. (2004) Funk, S., Hermann, G., Hinton, J., et al. 2004, Astroparticle Physics, 22, 285
- Gao & Solomon (2004) Gao, Y., & Solomon, P. M. 2004, The Astrophysical Journal Supplement Series, 152, 63
- Gilmore et al. (2012) Gilmore, R. C., Somerville, R. S., Primack, J. R., & Domínguez, A. 2012, MNRAS, 422, 3189, doi: 10.1111/j.1365-2966.2012.20841.x
- Giroletti et al. (2016) Giroletti, M., Massaro, F., D’Abrusco, R., et al. 2016, A&A, 588, A141, doi: 10.1051/0004-6361/201527817
- Gruber et al. (2014) Gruber, D., Goldstein, A., von Ahlefeld, V. W., et al. 2014, The Astrophysical Journal Supplement Series, 211, 12
- Harding & Abazajian (2012) Harding, J. P., & Abazajian, K. N. 2012, Journal of Cosmology and Astroparticle Physics, 2012, 026
- Healey et al. (2008) Healey, S. E., Romani, R. W., Cotter, G., et al. 2008, The Astrophysical Journal Supplement Series, 175, 97
- Manchester et al. (2005) Manchester, R. N., Hobbs, G. B., Teoh, A., & Hobbs, M. 2005, AJ, 129, 1993, doi: 10.1086/428488
- Marchesini et al. (2019) Marchesini, E., Peña-Herazo, H., Crespo, N. Á., et al. 2019, Astrophysics and Space Science, 364, 5
- Massaro et al. (2009) Massaro, E., Giommi, P., Leto, C., et al. 2009, Astronomy & Astrophysics, 495, 691
- Massaro et al. (2015) Massaro, E., Maselli, A., Leto, C., et al. 2015, Astrophysics and Space Science, 357, 75
- Massaro et al. (2013) Massaro, F., D’Abrusco, R., Giroletti, M., et al. 2013, ApJS, 207, 4, doi: 10.1088/0067-0049/207/1/4
- Massaro et al. (2013) Massaro, F., D’Abrusco, R., Paggi, A., et al. 2013, The Astrophysical Journal Supplement Series, 209, 10
- Massaro et al. (2014a) Massaro, F., Giroletti, M., D’Abrusco, R., et al. 2014a, ApJS, 213, 3, doi: 10.1088/0067-0049/213/1/3
- Massaro et al. (2014b) Massaro, F., Masetti, N., D’Abrusco, R., Paggi, A., & Funk, S. 2014b, AJ, 148, 66, doi: 10.1088/0004-6256/148/4/66
- Massaro et al. (2013) Massaro, F., Paggi, A., Errando, M., et al. 2013, ApJS, 207, 16, doi: 10.1088/0067-0049/207/1/16
- Massaro et al. (2016) Massaro, F., Thompson, D. J., & Ferrara, E. C. 2016, The Astronomy and Astrophysics Review, 24, 2
- Miller & Bregman (2016) Miller, M. J., & Bregman, J. N. 2016, The Astrophysical Journal, 829, 9
- Moskalenko & Porter (2009) Moskalenko, I. V., & Porter, T. A. 2009, ApJ, 692, L54, doi: 10.1088/0004-637X/692/1/L54
- Orlando & Strong (2008) Orlando, E., & Strong, A. W. 2008, Astronomy & Astrophysics, 480, 847
- Paggi et al. (2014) Paggi, A., Milisavljevic, D., Masetti, N., et al. 2014, The Astronomical Journal, 147, 112
- Peña-Herazo et al. (2019) Peña-Herazo, H., Massaro, F., Chavushyan, V., et al. 2019, Astrophysics and Space Science, 364, 85
- Reynolds et al. (2012) Reynolds, S. P., Gaensler, B., & Bocchino, F. 2012, Space science reviews, 166, 231
- Rieger et al. (2013) Rieger, F. M., de Oña-Wilhelmi, E., & Aharonian, F. A. 2013, Frontiers of Physics, 8, 714, doi: 10.1007/s11467-013-0344-6
- Roth et al. (2021) Roth, M. A., Krumholz, M. R., Crocker, R. M., & Celli, S. 2021, Nature, 597, 341
- Sarkar (2019) Sarkar, K. C. 2019, Monthly Notices of the Royal Astronomical Society, 482, 4813
- She et al. (2017) She, R., Ho, L. C., & Feng, H. 2017, The Astrophysical Journal, 835, 223
- Singal et al. (2012) Singal, J., Petrosian, V., & Ajello, M. 2012, The Astrophysical Journal, 753, 45
- Sturrock (1971) Sturrock, P. 1971, The Astrophysical Journal, 164, 529
- Su et al. (2010) Su, M., Slatyer, T. R., & Finkbeiner, D. P. 2010, The Astrophysical Journal, 724, 1044
- Sutherland & Saunders (1992) Sutherland, W., & Saunders, W. 1992, Monthly Notices of the Royal Astronomical Society, 259, 413
- Taylor (2005) Taylor, M. B. 2005, in Astronomical data analysis software and systems XIV, Vol. 347, 29
- Urry & Padovani (1995) Urry, C. M., & Padovani, P. 1995, Publications of the Astronomical Society of the Pacific, 107, 803
- Véron-Cetty & Véron (2010) Véron-Cetty, M.-P., & Véron, P. 2010, Astronomy & Astrophysics, 518, A10
- Von Kienlin et al. (2014) Von Kienlin, A., Meegan, C. A., Paciesas, W. S., et al. 2014, The Astrophysical Journal Supplement Series, 211, 13
- von Kienlin et al. (2020) von Kienlin, A., Meegan, C., Paciesas, W., et al. 2020, The Astrophysical Journal, 893, 46
- Wakely & Horan (2008) Wakely, S. P., & Horan, D. 2008, in International Cosmic Ray Conference, Vol. 3, 1341–1344
- Weekes et al. (2002) Weekes, T., Badran, H., Biller, S., et al. 2002, Astroparticle Physics, 17, 221