STable
![[Uncaptioned image]](/html/2206.04045/assets/x1.png) Table Generation Framework for Encoder-Decoder Models
Table Generation Framework for Encoder-Decoder Models
Abstract
The output structure of database-like tables, consisting of values structured in horizontal rows and vertical columns identifiable by name, can cover a wide range of NLP tasks. Following this constatation, we propose a framework for text-to-table neural models applicable to problems such as extraction of line items, joint entity and relation extraction, or knowledge base population. The permutation-based decoder of our proposal is a generalized sequential method that comprehends information from all cells in the table. The training maximizes the expected log-likelihood for a table’s content across all random permutations of the factorization order. During the content inference, we exploit the model’s ability to generate cells in any order by searching over possible orderings to maximize the model’s confidence and avoid substantial error accumulation, which other sequential models are prone to. Experiments demonstrate a high practical value of the framework, which establishes state-of-the-art results on several challenging datasets, outperforming previous solutions by up to 15%.
1 Introduction
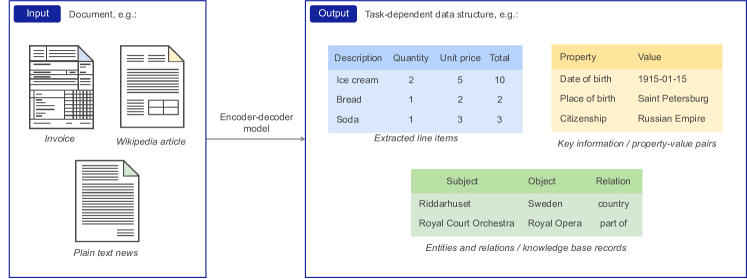
It has been previously shown that encoder-decoder models are capable of unifying a variety of problems involving natural language. In this setting, unification is achieved by casting different tasks as Question Answering with a plain-text answer, i.e., assuming the text-to-text (Kumar et al.,, 2016; Raffel et al.,, 2020; McCann et al.,, 2018; Khashabi et al.,, 2020) or document-to-text scenario (Powalski et al.,, 2021). We argue that the restriction of output type to raw text is suboptimal for the plethora of NLP problems and propose a decoder architecture able to infer aggregate data types such as a list of ordered tuples or a database-like table (see Figure 1).
Though the encoder-decoder architecture was formerly used to infer lists (Powalski et al.,, 2021), named tuples (Dwojak et al.,, 2020), or even more complex structures (Townsend et al.,, 2021), it was often achieved in an autoregressive manner, without any architectural changes. For example, a model intended for the generation of unstructured text in natural language was used to infer an output with formal structure. In contrast, we exploit regularities and relationships within the output data and employ a grammar-constrained decoding process. Consequently, incorrect tables cannot be generated. Part of these rules is explicit (e.g., we overwrite logits, so it is impossible to emit particular tokens such as the end-of-cell when no cell is opened), whereas part of the rules results implicitly from the algorithm.
Specifically, we focus on the text-to-table inference with applications to problems such as extraction of line items, key information extraction of multiple properties, joint entity and relation extraction, or knowledge base population. Tables as we understand them are equivalent to database tables and defined as a set of values structured in horizontal rows and vertical columns identifiable by name.
1.1 Motivation
The problem we address with a new model architecture occurs in the context of information extraction from both plain text and richly formatted inputs. From receipts and invoices, through paycheck stubs and insurance loss run reports, to scientific articles, real-world documents contain explicitly or implicitly tabular data to be extracted.
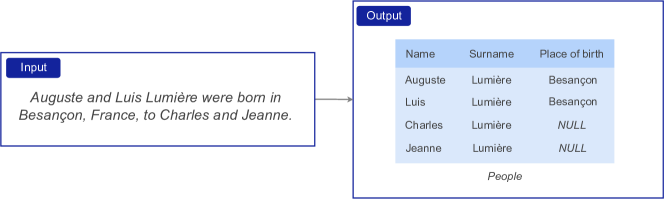
These are not necessarily represented as a table per se within the input document, e.g., the currency name on the invoice or policy number on the loss run can be mentioned once and be related to all the line items within. In other cases, the evidence one intends to comprehend and represent as a table may be available in free-text only, as can be found in problems of joint entity and relation extraction (see Figure 1-2). Finally, the data may require some postprocessing, such as the normalization of dates, before returning them to the end-user.
Moreover, it has been shown that parallel extraction of several property-value pairs can lead to better results than the extraction of these values one-by-one (Dwojak et al.,, 2020). We intend to achieve such emergent properties under the same decoding framework.
Significantly, the advantage the encoder-decoder framework has is that it can cover problems mentioned above in one end-to-end trainable process, thus simplifying the pipeline and reducing the accumulation of errors along the way. At the same time, since extracted data is already in the form the end user requires, one is able to use it directly for downstream application without further processing steps.
Admittedly, models based on the transformer encoder-decoder or decoder achieve remarkable results in generating complex, formalized outputs, such as computer programs or JSON files (Chen et al.,, 2021; Townsend et al.,, 2021). Nevertheless, we hypothesize that architectural changes leading to the explicit modeling of structured data can outperform the said implicit decoding that models long-range syntax dependencies sequentially and does not guarantee the formal validity of produced outputs.
1.2 Contribution and Related Works
The specific contribution of this work includes (1) equipping transformer models with permutation-based decoder training to allow comprehending complex, role-dependent relationships in a series of similar objects we represent as a table, and (2) a sequential, grammar-constrained decoding mechanism which generates table content cell-by-cell, in a dynamic, data-dependent order. The novelty of our approach can be better understood in the context of related works.
Decoding of data structures. A few authors attempted the problem of table generation in the encoder-decoder framework. Zhong et al., (2020) proposed a table recognition model consuming input images and decoupled the problem into unconstrained table and cell content generation. In comparison, (1) we use a single constrained decoder comprehending both table structure and its content; (2) we tackle problems of text-to-table inference where the presence of a table at the model input is optional. Recently, Wu et al., (2021) introduced a model relying on constrained decoding of table and tabular embeddings similar to ours. We share their motivation and idea but differ as (1) our method is not restricted to a predefined, row-by-row decoding order and uses a permutation-based training procedure aligned with the use of optimal, model-guided cell permutation during inference; (2) we assume the explicit prediction of the number of rows upfront (before the table decoding starts), instead of allowing the model to stop the generation process after any completed row. The advantage of this approach is discussed in Section 2 and proven by a series of experiments reported in Section 3.
The encoder-decoder model was previously used as is, to infer lists and tuples separated with special characters (Powalski et al.,, 2021; Dwojak et al.,, 2020). Similarly, Townsend et al., (2021) experimented with the generation of more complex data types represented as XML, JSON, or Python’s string representation. One of the problems with these approaches is that the same output structure may be represented in various valid forms. Consequently, valid responses may be penalized during the training phase, expecting only one reference representation. Due to the proposed grammar-constrained decoding process, we mitigate this problem without increasing the computational requirements that otherwise might result from the use of permutation-invariant loss functions. Moreover, in contrast to previous approaches, we do not rely on implicit modeling of the formal structure of the output but opt for explicit structure generation. The same remarks apply to the take of Sage et al., (2020) who proposed a method for the extraction of XML-structured information based on a pointer-generation network. Additionally, in contrast to ours, their approach is limited to copying words from the input document and thus cannot perform normalization or return values that are not present in the text explicitly.
Finally, a text-to-structure approach was recently taken by Lu et al., (2021) for event extraction. The authors used trie-based constrained decoding with event schema injected as the decoder prompt. It resembles our approach to constrained table generation, though they rely on only one proper decoding order resulting from the assumed tree linearization strategy. Moreover, the authors found it challenging to train the structure generation model directly and thus trained it on simple event substructures first. In contrast, we can directly train the structure decoder, and our permutation-based method allows one to generate the structure flexibly, in an arbitrary order dynamically guided by the decoding algorithm.
Flexible generation. Even though permutation-based training, which allows for output generation in any order, is of minor usability in the task of LM, it was validated by Stern et al., (2019) for machine translation. Accordingly, they proposed to equip a transformer with the insertion operation, realized by interpreting an additional number generated with the token as the position in the output sequence to which the insertion should be performed. This framework allows for the flexibility of the decoding process, understood as the possibility of stubbing the output sequence with tokens that the model recognizes with high confidence first and then gradually adding more details in the later iterations. In contrast, since the whole output sequence is passed through the decoder anyway, our one cell-decoding step is implemented by sampling all cells at once and then choosing the best-scored ones to be inserted at its location while disregarding others. In the ablation studies we evaluate how the number of cells inserted at once influence the decoding speed and quality, as higher values indicate more cells generated in parallel.
Permutation-based language modeling. The effectiveness of the permutation-based language modeling objective was demonstrated by Yang et al., (2019) who conditioned the BERT-like model to work with the AR objective. However, while the nature of the LM task allowed them to perturb the factorization order of the input sequence arbitrarily, our table-decoding problem requires additional constraints to account for the fact that each cell may consist of several tokens. Thus, the factorization order of blocks of tokens (representing cells) is permuted, while causal order is assumed within the cell.
2 STable — Text-to-Table Transformer Framework
Serialized representation of the table permits to treat it as a text sequence, and hence, use text-centric methods to perform an autoregressive generation of the output sequence by employing a vanilla Transformer decoder. However, this approach does not exploit the two-dimensional structure of the table as it expands the answer sequentially and utilizes only uni-directional context.
Consequentially, two challenging problems arise. Firstly, how to approach the fact that some information in the table may depend on other cells (e.g., name and surname or the same tax rate for similar items on a receipt) while some may not be dependent (prices of different articles on the shopping list). In general, a model possesses flexibility with respect to this dependence-independence assumption when it can leverage dependencies during decoding but is not forced to do so in any specific order. Our idea is to solve this problem by delaying the generation of the most challenging and complex answers to later stages and conditioning them on the already generated answer.
The second issue that further complicates the problem is that the decoding must remain free of train-inference discrepancies. Generally, the train-inference alignment means that the state of the table at every step while decoding a particular example must also be possible to achieve in the training phase. Formulating the training that allows for flexible cell generation without providing any additional information remains a non-trivial problem. We rise up to the challenge and demonstrate the solution below.
2.1 Decoding Invariant Under Cell Order
Instead of generating the cell values in a top-down, left-to-right manner as previously seen in the literature (e.g., Wu et al.,, 2021), we perform the pretraining by maximizing the expected log-likelihood of the sequence of cell values over all possible prediction orders.
More specifically, suppose that we are given a document containing a table with row labels 111In practice, usually there are no row labels; however, in the decoder, the special tokens used for distinguishing rows take this role. and column labels , which we will collectively denote . A linear ordering of the table cells can be represented with a bijection
where is the number of cells, so that are the row and column coordinates of the -th cell in the ordering. Given such a and cell values , we factorize the likelihood of given as
| (1) |
and using this factorization, we maximize the expected log-likelihood
| (2) |
over . The likelihoods themselves can be factorized according to the standard auto-regressive approach as
| (3) |
where is the length of represented as a sequence of tokens . In practice, the expected log-likelihood is estimated by sampling bijections at random.
At its root, this approach is similar to the XLNet (Yang et al.,, 2019) permuted language modeling, though two significant distinctions are: (1) permutations are applied not to the encoder’s input but to the decoder’s, (2) the bidirectional contexts are assembled over cells, while causal dependencies are modeled within cells.
2.2 Tabular Attention Bias
We base our attention computation method on the relative bias idea popularized by the T5 model. Given a text consisting of tokens, in the vanilla T5 model, raw attention scores for tokens and (with ) are modified by introducing a bias term: where is a trainable weight, depending on the relative sequential position of these tokens (Raffel et al.,, 2020).
We modify the decoder’s self-attention by extending it with two new bias terms, defined below. The tabular bias encodes the relative position of table cells in which the tokens lie, while the local sequential bias corresponds to the relative sequential position of tokens belonging to the same cell.
| (4) |
where are cell coordinates as given by its -based column and row indices (with reserved for the header row/column), and , , and are trainable weights. The special case with corresponds to the situation when the key/value token lies in the column header, in which case we want to use the same bias independent of the row of the query token, due to the different nature of the relation between two cells, and a cell and its column header.
After these adjustments, the final attention score takes the form
| (5) |
where is the bias term defined earlier.
Row and column bias we introduce is similar to the one used previously on the encoder side for comprehension of the two-dimensional structure of model input (Powalski et al.,, 2021; Garncarek et al.,, 2021; Xu et al.,, 2021; Zayats et al.,, 2021). In contrast, we (1) apply it in the decoder, (2) do not use buckets with sizes growing logarithmically but have one bucket per row or column, and (3) have a dedicated bucket for the vertical relation between cell and its header.
2.3 Predicting Number of Groups
Although the previous work of Wu et al., (2021) assumed the table is finalized when the appropriate special token explicitly appears in the output, our systematic study shows that the explicit prediction of the number of groups yields better results (see Section 4 for comparison). This explicit prediction is achieved with a linear layer that consumes the first input token’s embedding to perform a prediction on the number of groups. During the training stage, the layer’s output is scored against the known number of groups using MSE loss, while during the inference, it is used as a predictor declaring the number of groups to populate the template with.
2.4 Inference with Model-Guided Cell Order
While multiple decoding algorithms can be considered valid at test time, in light of the proposed training method we will focus on a simple greedy algorithm that does not introduce the train-inference discrepancy.
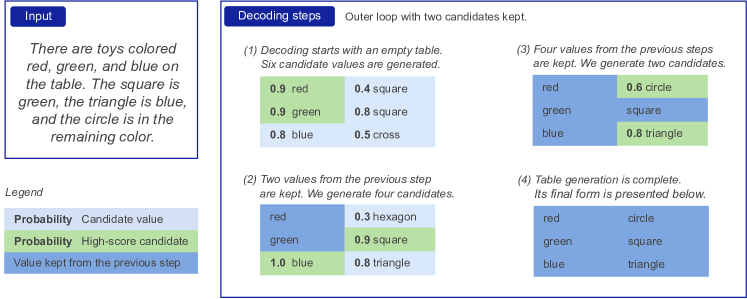
Since the model was trained assuming a permuted factorization of cell ordering, in expectation, the model learned to understand all possible variants of a partially-filled table and predict values for all empty cells. Because each step in the generation process implicates uncertainty that should be globally minimized, we propose to estimate the optimal table decoding algorithm by greedily finding the cell that minimizes this uncertainty at each step.
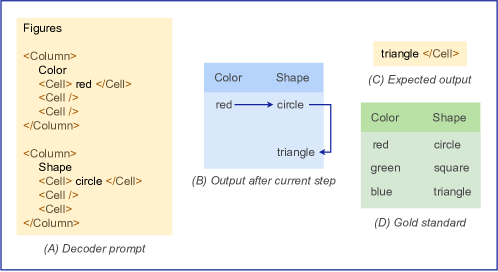
The decoding employs an outer loop that progresses cell-by-cell, an inner loop that generates each cell that is yet to render, and a selection heuristics that determine which cell, from all the finalized in the inner loop, should be added to the outer loop. The heuristic we use selects the cell containing the token with highest probability among all predicted (Figure 4). The detailed study of this and alternative selection criteria is presented in Table 2.
In the inner loop, each cell is decoded until the special token determining the end of cell generation is placed. As the inner loop generates each cell autoregressively and independently from other cells, the process can be treated as generating multiple concurrent threads of an answer and is well parallelizable. In the worst case, it takes as many steps as the number of tokens in the most extended cell.
After being selected by a heuristic, the cell from the inner loop is inserted into the outer loop, and made visible to all other cells, while the cells that were not selected are to be reset and continuously generated in the future steps until they are chosen by a heuristic (please refer to Appendix A for the commented pseudocode and the algorithm details).
3 Experiments
| Dataset | State-of-the-Art Reference | Linearized | Our Model | ||
| PWC★ | T5 2D (Borchmann et al.,, 2021) |
T5 2D + STable
|
|||
| CORD | TILT (Powalski et al.,, 2021) |
TILT† + STable
|
|||
| Rotowire | |||||
| Player | Text-to-Table (Wu et al.,, 2021) | T5 + STable
|
|||
| Team | (BART backbone) | ||||
| DWIE | KB-both (Verlinden et al.,, 2021) |
T5 + STable
|
|||
| Recipe… | TILT† | TILT† + STable
|
|||
| Payment… | |||||
| Bank… | |||||
In addition to state-of-the-art reference and our results, we provide scores of the same backbone models (T5, T5 2D, and TILT) while assuming a table linearization strategy that follows the assumptions of Wu et al., (2021)’s baselines. Please refer to the Appendix D for details of evaluation metrics and training procedure.
Complex Information Extraction. The problem of information extraction involving aggregated data types, where one may expect improvement within the document-to-table paradigm, is prevalent in business cases. Nevertheless, the availability of public datasets here is limited to PWC★ (Borchmann et al.,, 2021; Kardas et al.,, 2020) and CORD (Park et al.,, 2019).
In the case of PWC★, the goal is to determine model names, metrics, datasets, and performance, given the machine learning paper as an input. CORD assumes the extraction of line items from images of Indonesian receipts, among others. To determine the gain from our STable decoder, the experiments are conducted with state-of-the-art encoder-decoder models proposed for these datasets (T5 2D and TILT), assuming the same training procedure (Borchmann et al., (2021); Powalski et al., (2021); see Appendix D for details).
Additionally, due to the sparsity of public benchmarks of this kind, we decided to provide results on three confidential datasets. They assume, respectively, (1) the extraction of payments’ details from Payment Stubs, (2) Recipe Composition from documents provided by a multinational snack and beverage corporation, as well as (3) account balances from Bank Statements. These are covered in details in Appendix E and addressed by the TILT+STable model with vanilla TILT as a reference.
As summarized in Table 1, we outperformed state-of-the-art information extraction models on several datasets. At the same time, the CORD where we underperform was previously considered solved, e.g., Powalski et al., (2021) point that TILT’s output and the reference differed insignificantly. We used it in the experiment as a safety check to determine whether the model can maintain almost-perfect scores after applying the STable decoder. Consequently, we omit it in the ablation studies.
The rest of the experiments were conducted assuming the vanilla T5 model Raffel et al., (2020) equipped with the STable decoder of our proposal.
Joint Entity and Relation Extraction. To demonstrate the broad applicability of the model, we consider the problem of a joint entity and relation extraction on the example of the DWIE dataset (Zaporojets et al.,, 2021). Here, the tuples consisting of entities and one of the sixty-five relation types are to be determined given a plain-text news article. Despite not outperforming a multi-step state-of-the-art model, we achieved high scores and were the first to prove that the problem can be successfully approached end-to-end using an encoder-decoder framework. Here, the T5+STable’s errors and issues reflect the very demanding assumptions of DWIE, where it is required to return object and subject in the longest form of appearance in the document.
Reversed Table-to-Text. Finally, following Wu et al., (2021) we evaluate our approach on the Rotowire table-to-text dataset in a reverse direction, i.e., generate tables from text (Wiseman et al.,, 2017). Consequently, the complex tables reporting teams and player performance are generated given the game description. Results from Table 1 show that our T5+STable model can deliver an improvement over the Linearized T5 model on Rotowire Team. The fact that Linearized BART from Wu et al., (2021) outperforms our Linearized T5 baselines on Rotowire Team and Player datasets by and points, respectively, suggests that it has a better capacity as a backbone for this task. Several of the ablation studies from the next section were designed to shed light on this subject.
The results of our model (Table 1) demonstrate a significant improvement over the simple sequence-to-sequence generation of tables linearized as sequences on three out of five public datasets. As expected, it yields better results in cases where there is a considerable interdependency between values in a row and no clear, known upfront name distinguishes it from other rows. Note that, e.g., in Rotowire, it suffices to correlate all statistics with team or player name, which is always inferred first due to the employed linearization strategy. The order of columns being decoded is a hyperparameter in the case of linearization. In contrast, the power of STable comes from learning it from the data itself.
4 Ablation Studies
Five ablation studies investigating the design choices’ impact on performance were carried out. Models were trained three times with different random seeds on the Rotowire, DWIE, and PWC★ datasets. To reduce the computational cost, we relied on base variants of the models reported in Section 3 – please refer to Appendix D for detailed specifications and results. While results on a single dataset can be considered noisy, aggregation over a diverse set of them helps diminish the randomness’s impact and stabilize results on the new ones.
| Model | Average Score | Relative change | ||
| Complete STable (reference) | — | |||
| Semi-templated expansion | (1) | |||
| Fixed causal order | (2) | |||
| Decoding constraint | (3) | |||
| Column-by-column | ||||
| Row-by-row | ||||
| LR and TB | ||||
| No distant rows | ||||
| Decision criteria (inner outer) | (4) | |||
| min max | ||||
| mean max | ||||
| mean min | ||||
| min min | ||||
| max min |
(1) Semi-templated Expansion. To compare our method of group prediction with a regression-free alternative, we allow the model to work in a semi-templated manner, where the template is infinite, and the decoding stops when the group with NULL-only tokens is generated. For this method, we add such a group at the bottom of the table during the training to comply with the inference. The model performance is significantly below the STable reference, suggesting explicit group number prediction superiority.
(2) Non-Permutative Training. To measure the importance of understanding the bidirectional contexts within the model, we abstain from permutation-based training in our study and choose the predefined factorization order. Here, a fixed causal order model that reads tables from left to right and from top to bottom is evaluated. This alternative is in line with text-to-table approach of Wu et al., (2021). As shown in Table 2, the lack of permutative training we introduced in Section 2 leads to significantly worse scores.
(3) Constrained Cell Order. Whereas the permutation-based training allows for great flexibility, the questions posed here are whether limiting the model’s ability to discover new cells can be of any value. Methods in this group assure either that the column-by-column constrained model predicts the whole column before decoding a new one, the row-by-row constrained model predicts the whole row before entering a new one, whereas LR and TB is a combination of both (ensures row-by-row inference from left to right). The no distant rows constraint forces the decoding to have empty cells only on the bottom of each column, thus avoiding skipping cells in the decoding while moving down.
As shown in Table 2, all but column-by-column constraint lead to a decreased scores. At the same time, the mentioned performs on par with STable’s model-guided inference (Section 2.4), and both are better than the method with left-to-right decoding order. These results suggest that (1) our method does not require constraining the decoding order, (2) it seems to implicitly incorporate the column-by-column constraint, and (3) it is helpful to be elastic w.r.t. decoding order within the column.
(4) Inner/Outer Loop Decision Criteria. The heuristic we test selects the cell in the outer loop based on the minimal or maximal inner score. Such inner score is calculated in three different ways: by taking the minimal, maximal, and mean of the token’s logits score. The results, presented in Table 2, point to the lesser importance of choosing the inner scoring method, while the choice of the outer loop heuristics impacts results more significantly. The former is the desired behavior since the algorithm we proposed in Section 2.4 is based on the assumption that it is beneficial to decode cells starting from those with the model’s highest confidence. On the other hand, as there is a significant variance depending on the dataset chosen (see Appendix D), these and other inference parameters can be subject to cost-efficient, task-specific hyperparameter optimization.
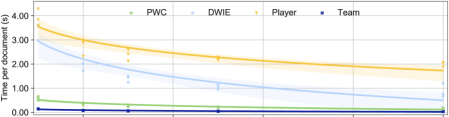
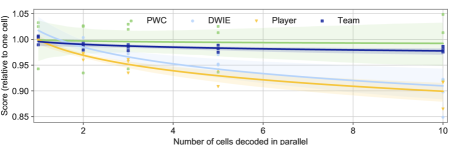
(5) Parallelization of Cell Decoding. As outlined in Section 2.4, one may allow multiple candidates to be kept in each decoding step to shorten the inference time while expecting the performance to degrade to some extent. Results of experiments that follow this observation are presented in Figure 5. One may notice that processing time varies across the considered datasets since it depends mainly on the input sequence length (ranging from for Rotowire to for PWC) and the sizes of the table to infer (we infer as many as cells for the Player table). Parallelization of cell decoding significantly reduces the total per-document processing time — up to five times for DWIE in the conducted experiments. Interestingly, speed-up does not necessarily lead to a decrease in scores; e.g., in the case of the Team table, there is four times better processing time when ten cells are inferred at once, whereas the scores achieved by the model remain comparable. It can be attributed to the fact that there are almost no inter-cell dependencies and always only two rows to infer — one for each team playing. Since the performance changes w.r.t. this parameter is heavily data-dependent, its value should be obtained experimentally for each dataset separately. Additionally, we argue that it is beneficial to use large values to speed up the train-time validation as it maintains a correlation with higher-scoring lower parameter values that can be employed during test-time inference.
5 Summary
We equipped the encoder-decoder models consuming text (T5, T5 2D) and documents (TILT) with the capabilities to generate tables in a data-dependent order. Firstly, an aligned training procedure based on permuting factorization order of cells was presented, and secondly, the parallelizable decoding process that fills the table with values in a flexible and unconstrained order was proposed. The important design choices for both contributions were motivated by an extensive ablation study. The proposed STable framework demonstrates its high practical value by yielding state-of-the-art results on PWC★ and outperforming linearized models on CORD and Rotowire Team datasets, as well as outperforming reference models on several confidential datasets. The highest gains due to the permutative training were accomplished on the PWC★ dataset, where points ( ) amounts to relative improvement, while the point gain on Bank Statements ( ) exceeds relative improvement.
Acknowledgments
The Smart Growth Operational Programme supported this research under project no. POIR.01.01.01-00-1624/20 (Hyper-OCR — an innovative solution for information extraction from scanned documents).
References
- Borchmann et al., (2021) Borchmann, Ł., Pietruszka, M., Stanislawek, T., Jurkiewicz, D., Turski, M., Szyndler, K., and Graliński, F. (2021). DUE: End-to-end document understanding benchmark. In Vanschoren, J. and Yeung, S., editors, Proceedings of the Neural Information Processing Systems Track on Datasets and Benchmarks, volume 1.
- Chen et al., (2021) Chen, M., Tworek, J., Jun, H., Yuan, Q., de Oliveira Pinto, H. P., Kaplan, J., Edwards, H., Burda, Y., Joseph, N., Brockman, G., Ray, A., Puri, R., Krueger, G., Petrov, M., Khlaaf, H., Sastry, G., Mishkin, P., Chan, B., Gray, S., Ryder, N., Pavlov, M., Power, A., Kaiser, L., Bavarian, M., Winter, C., Tillet, P., Such, F. P., Cummings, D., Plappert, M., Chantzis, F., Barnes, E., Herbert-Voss, A., Guss, W. H., Nichol, A., Paino, A., Tezak, N., Tang, J., Babuschkin, I., Balaji, S., Jain, S., Saunders, W., Hesse, C., Carr, A. N., Leike, J., Achiam, J., Misra, V., Morikawa, E., Radford, A., Knight, M., Brundage, M., Murati, M., Mayer, K., Welinder, P., McGrew, B., Amodei, D., McCandlish, S., Sutskever, I., and Zaremba, W. (2021). Evaluating large language models trained on code. CoRR, abs/2107.03374.
- Dwojak et al., (2020) Dwojak, T., Pietruszka, M., Borchmann, Ł., Chłędowski, J., and Graliński, F. (2020). From dataset recycling to multi-property extraction and beyond. In Proceedings of the 24th Conference on Computational Natural Language Learning, pages 641–651, Online. Association for Computational Linguistics.
- Garncarek et al., (2021) Garncarek, Ł., Powalski, R., Stanisławek, T., Topolski, B., Halama, P., Turski, M., and Graliński, F. (2021). LAMBERT: Layout-aware language modeling for information extraction. In Lladós, J., Lopresti, D., and Uchida, S., editors, Document Analysis and Recognition – ICDAR 2021, pages 532–547, Cham. Springer International Publishing.
- Kardas et al., (2020) Kardas, M., Czapla, P., Stenetorp, P., Ruder, S., Riedel, S., Taylor, R., and Stojnic, R. (2020). AxCell: Automatic extraction of results from machine learning papers. In 2004.14356.
- Khashabi et al., (2020) Khashabi, D., Min, S., Khot, T., Sabharwal, A., Tafjord, O., Clark, P., and Hajishirzi, H. (2020). UnifiedQA: Crossing format boundaries with a single QA system. In EMNLP-Findings.
- Kumar et al., (2016) Kumar, A., Irsoy, O., Ondruska, P., Iyyer, M., Bradbury, J., Gulrajani, I., Zhong, V., Paulus, R., and Socher, R. (2016). Ask me anything: Dynamic memory networks for natural language processing. In ICML.
- Lu et al., (2021) Lu, Y., Lin, H., Xu, J., Han, X., Tang, J., Li, A., Sun, L., Liao, M., and Chen, S. (2021). Text2Event: Controllable sequence-to-structure generation for end-to-end event extraction. In Proceedings of the 59th Annual Meeting of the Association for Computational Linguistics and the 11th International Joint Conference on Natural Language Processing (Volume 1: Long Papers), pages 2795–2806, Online. Association for Computational Linguistics.
- McCann et al., (2018) McCann, B., Keskar, N. S., Xiong, C., and Socher, R. (2018). The natural language decathlon: Multitask learning as question answering. arXiv preprint.
- Park et al., (2019) Park, S., Shin, S., Lee, B., Lee, J., Surh, J., Seo, M., and Lee, H. (2019). CORD: A consolidated receipt dataset for post-ocr parsing. In Document Intelligence Workshop at NeurIPS.
- Paszke et al., (2019) Paszke, A., Gross, S., Massa, F., Lerer, A., Bradbury, J., Chanan, G., Killeen, T., Lin, Z., Gimelshein, N., Antiga, L., Desmaison, A., Kopf, A., Yang, E., DeVito, Z., Raison, M., Tejani, A., Chilamkurthy, S., Steiner, B., Fang, L., Bai, J., and Chintala, S. (2019). Pytorch: An imperative style, high-performance deep learning library. In Wallach, H., Larochelle, H., Beygelzimer, A., d'Alché-Buc, F., Fox, E., and Garnett, R., editors, Advances in Neural Information Processing Systems 32, pages 8024–8035. Curran Associates, Inc.
- Powalski et al., (2021) Powalski, R., Borchmann, Ł., Jurkiewicz, D., Dwojak, T., Pietruszka, M., and Pałka, G. (2021). Going full-TILT boogie on document understanding with text-image-layout transformer. In Lladós, J., Lopresti, D., and Uchida, S., editors, Document Analysis and Recognition – ICDAR 2021, pages 732–747, Cham. Springer International Publishing.
- Raffel et al., (2020) Raffel, C., Shazeer, N., Roberts, A., Lee, K., Narang, S., Matena, M., Zhou, Y., Li, W., and Liu, P. J. (2020). Exploring the limits of transfer learning with a unified text-to-text transformer. JMRL.
- Sage et al., (2020) Sage, C., Aussem, A., Eglin, V., Elghazel, H., and Espinas, J. (2020). End-to-end extraction of structured information from business documents with pointer-generator networks. In Proceedings of the Fourth Workshop on Structured Prediction for NLP, pages 43–52, Online. Association for Computational Linguistics.
- Stern et al., (2019) Stern, M., Chan, W., Kiros, J. R., and Uszkoreit, J. (2019). Insertion transformer: Flexible sequence generation via insertion operations. In ICML.
- Townsend et al., (2021) Townsend, B., Ito-Fisher, E., Zhang, L., and May, M. (2021). Doc2dict: Information extraction as text generation. CoRR, abs/2105.07510.
- Verlinden et al., (2021) Verlinden, S., Zaporojets, K., Deleu, J., Demeester, T., and Develder, C. (2021). Injecting knowledge base information into end-to-end joint entity and relation extraction and coreference resolution. In Findings of the Association for Computational Linguistics: ACL-IJCNLP 2021, pages 1952–1957, Online. Association for Computational Linguistics.
- Wiseman et al., (2017) Wiseman, S., Shieber, S., and Rush, A. (2017). Challenges in data-to-document generation. In Proceedings of the 2017 Conference on Empirical Methods in Natural Language Processing, pages 2253–2263, Copenhagen, Denmark. Association for Computational Linguistics.
- Wu et al., (2021) Wu, X., Zhang, J., and Li, H. (2021). Text-to-table: A new way of information extraction. CoRR, abs/2109.02707.
- Xu et al., (2021) Xu, Y., Xu, Y., Lv, T., Cui, L., Wei, F., Wang, G., Lu, Y., Florencio, D., Zhang, C., Che, W., Zhang, M., and Zhou, L. (2021). LayoutLMv2: Multi-modal pre-training for visually-rich document understanding. In Proceedings of the 59th Annual Meeting of the Association for Computational Linguistics and the 11th International Joint Conference on Natural Language Processing (Volume 1: Long Papers), pages 2579–2591, Online. Association for Computational Linguistics.
- Yang et al., (2019) Yang, Z., Dai, Z., Yang, Y., Carbonell, J., Salakhutdinov, R. R., and Le, Q. V. (2019). Xlnet: Generalized autoregressive pretraining for language understanding. In Wallach, H., Larochelle, H., Beygelzimer, A., d'Alché-Buc, F., Fox, E., and Garnett, R., editors, Advances in Neural Information Processing Systems, volume 32. Curran Associates, Inc.
- Zaporojets et al., (2021) Zaporojets, K., Deleu, J., Develder, C., and Demeester, T. (2021). DWIE: An entity-centric dataset for multi-task document-level information extraction. Information Processing & Management, 58(4):102563.
- Zayats et al., (2021) Zayats, V., Toutanova, K., and Ostendorf, M. (2021). Representations for question answering from documents with tables and text. In Proceedings of the 16th Conference of the European Chapter of the Association for Computational Linguistics: Main Volume, pages 2895–2906, Online. Association for Computational Linguistics.
- Zhong et al., (2020) Zhong, X., ShafieiBavani, E., and Jimeno Yepes, A. (2020). Image-based table recognition: Data, model, and evaluation. In Vedaldi, A., Bischof, H., Brox, T., and Frahm, J.-M., editors, Computer Vision – ECCV 2020, pages 564–580, Cham. Springer International Publishing.
Appendix A Table Decoding Algorithm
The algorithm presented above operates on the output of the encoder model and reuses the cached encoded representations that are considered to be a part of the DecoderModel for brevity. Another important characteristic of the DecoderModel introduced for conciseness of the pseudocode is that it produces all cell tokens and handles the sequential text decoding on its own.
The decoding employs an OuterLoop, parametrized by the parameter (denoting the parallelization of cell decoding) that progresses cell-by-cell, the InnerLoop function that generates each cell that is yet to render, and OuterCriterion — a selection heuristics that determine which cell, from all the finalized in the inner loop, should be added to the outer loop. The InnerCriterion is a heuristic we utilize that selects the cell with the maximum probability for its tokens’ predictions (Figure 4).
In the InnerLoop, each cell is decoded until the special token determining the end of cell generation is placed. As the InnerLoop generates each cell autoregressively and independently from other cells, the process can be treated as generating multiple concurrent threads of an answer and is well parallelizable. In the worst case, it takes as many steps as the number of tokens in the most extended cell.
After the selection by the OuterCriterion heuristic, the cell from the inner loop is inserted into the outer loop, and made visible to all other cells, while the cells that were not selected are to be reset and continuously generated in the future steps until they are chosen by the OuterCriterion heuristics.
Appendix B Limitations
The state-of-the-art performance of STable is its foremost advantage, while the constraining factors come from different aspects. Of them, the generated sequence’s length seems to incure the most long-term cost during inference, while the increase in training time per example is a short-term obstacle. The underlying issue is that the full table context negatively influences the computational cost of the attention on the decoder side. This however is also the case for the family of encoder-decoder models generating the whole table such as these proposed by Wu et al., (2021) or Townsend et al., (2021). A possible solution here is a model with table context limited to the row and column a given table cell belongs to. Such a change would have a positive impact on the memory consumption in the decoder, as self-attention complexity decreases from to , where denotes the number of rows and columns respectively. The exploitation of this optimization is an interesting future direction.
Finally, our method by design does not generate the table header since we assume that the names of the datapoints to infer are given in advance. To tackle problems such as table structure recognition where the set of possible header values is not limited, one needs to slightly modify the proposed solution. However, we do not consider it a serious limitation as the required modification is relatively straightforward, and for the sake of completeness, we describe it in Appendix F.
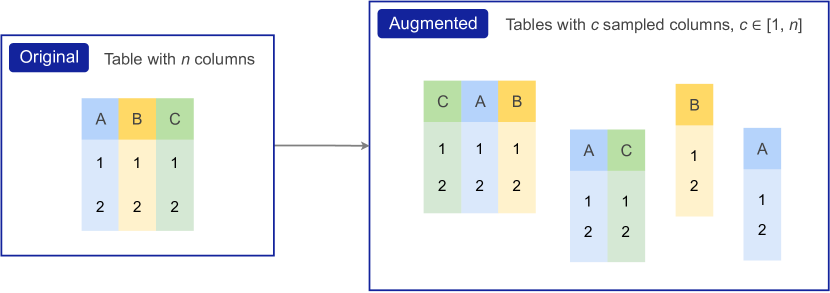
Appendix C Negative Result: Prevention of Column Order Leakage
In the approach outlined in Section 2, the sequence of column labels , on which the likelihoods are conditioned, may leak additional unwanted information to the decoder. If the data in the document are indeed formatted as a table, and the order of labels in matches the column order, the model might learn to extract cells by location, instead of using the actual semantics of the cell label. However, during inference, while we know which entities we want to extract from the document, we are not given the order in which they appear, which can be perceived as a serious train-inference discrepancy.
To remedy this problem, we tried to further modify the training objective (See Figure 6). Denote by the set of all non-empty sequences of distinct column labels. Instead of all the cells , we can predict only the cells corresponding to a sequence of columns, in the order defined by the order of columns in . The expected log-likelihood over all can be then expressed as
| (6) |
where decomposes according to the discussion in Section 2.
In practice, we found it to have no relevant impact on the training process. It did not lead to significant changes in evaluation scores when used in the supervised pretraining stage or on a downstream task. Consequently, we abandoned the idea and did not use it for any of the models reported in the paper. This study helps us state that the model learns the semantics of the cell labels without a need for regularization.
Appendix D Details of Experiments and Ablation Studies
All models were trained three times with different random seeds. We relied on large variants of the models for experiments in Table 1, and on base variants for the ablation studies. These are analyzed in Table 2 given the average results over Rotowire, PWC★, and DWIE datasets (see Table 3 for detailed scores).
Metrics. We rely on the original metrics for all but the DWIE dataset, i.e., GROUP-ANLS for PWC★, F1 for CORD, and non-header exact match cell F1 for Rotowire (other variants proposed by the authors are reported in Table 6). Use of the original DWIE metric was not possible, as it assumes a step-by-step process. In contrast, we tackle the problem end-to-end, i.e., return (object, relation, subject) tuples without detecting all entity mentions within the document and their locations. To ensure a fair comparison, we use the F1 score calculated on triples; that is, we require the model to return the exact match of the triple. Such a setup is very demanding for encoder-decoder models as the convention in DWIE is to require object and subject to be returned in the longest form of appearance in the document.
Pretraining/adaptation. Due to the switch to permutative training and the addition of the regression head, there is a significant change in the model objective. Consequently, we anticipated the necessity of the model adaptation phase. It consists of the pretraining stage equivalent to the one conducted by authors of the TILT model (Powalski et al.,, 2021), i.e., we use the same datasets and number of the model updates. The said stage is applied to both T5+STable, T5 2D+STable, and TILT+STable models.
| Model | RW Player | RW Team | PWC★ | DWIE | |
| Complete STable (reference) | |||||
| Semi-templated expansion | (1) | ||||
| Fixed causal order | (2) | ||||
| Decoding constraint | (3) | ||||
| Column-by-column | |||||
| Row-by-row | |||||
| LR and TB | |||||
| No distant rows | |||||
| Decision criteria (inner outer) | (4) | ||||
| min max | |||||
| mean max | |||||
| mean min | |||||
| min min | |||||
| max min |
Hyperparameters. We use task-independent hyperparameters that roughly follow these proposed by the authors of the T5 model for its finetuning, as during our initial experiments, they turned out to be a robust default (see Table 4).
Maximal input sequence lengths were chosen in such a way a fair comparison with reference models was ensured. In particular, we use T5+2D’s limit despite the fact one can achieve better results when consuming a more significant part of the input document. Similarly, the max number of updates follows the limit in reference models except for the DWIE dataset, where the state-of-the-art solution is based on the incomparable multi-step pipeline. See Table 5 for these task-specific details.
Software and hardware. All experiments and benchmarks were performed on DGX-A100 servers equipped with eight A100-SXM4-80GB GPUs that feature automatic mixed precision. Our models and references were implemented in PyTorch 1.8.0a0 (Paszke et al.,, 2019) with CUDA 11.4 and NVIDIA drivers 470.82.01.
| Hparam | Dropout | Batch | Learning rate | Weight decay | Label smoothing | Optimizer |
|---|---|---|---|---|---|---|
| Value | .1 | 64 | 1e-3 | 1e-5 | .1 | AdamW |
| Dataset | Max steps | Max input | |
| Ablation | Final | length | |
| PWC★ | 500 | 1,000 | 6,144∗ |
| Rotowire | 3,000 | 8,000 | 1,024 |
| CORD | — | 36,000 | 1,024 |
| DWIE | 4,000 | 8,000 | 2,048 |
| Recipe Composition | — | 400 | 2600 |
| Payment Stubs | — | ||
| Bank Statements | — | 200 | 7000 |
. Row header F1 Column header F1 Non-header F1 Exact Chrf BERT Exact Chrf BERT Exact Chrf BERT Team 94.9 95.2 97.8 88.9 85.8 88.7 84.7 85.6 90.3 Player 93.5 95.3 95.1 88.1 91.2 94.5 84.5 86.8 90.4
Appendix E Business Datasets
| Recipe Composition | Payment Stubs | Bank Statements | |
|---|---|---|---|
| train documents | |||
| val documents | |||
| test documents | |||
| avg doc len (words) | k | k | k |
| max doc len (words) | k | k | k |
| avg doc len (characters) | k | k | k |
| max doc len (characters) | k | k | k |
| properties total | |||
| properties in tables (tables columns) | |||
| properties outside of tables | |||
| mean number of table rows | |||
| max number of rows | |||
| mean length of cell (characters) | |||
| max length of cell (characters) |
Due to the sparsity of public benchmarks for complex information extraction, we decided to provide results on three confidential datasets. They assume, respectively, (1) the extraction of payments’ details from Payment Stubs, (2) Recipe Composition from documents provided by multinational snack and beverage corporation, as well as (3) account balances from Bank Statements. Their details are covered in the present section and Table 7.
Recipe Composition. The problem faced is extracting proprieties of food ingredients from confidential food manufacturer’s documentation. This dataset contains 165 annotated fragments from 55 documents, three pieces for each document, with annotations sourced from the corporation’s CRM system.
For each file, there are five tables to be extracted. The first one describes the ingredient’s physical and chemical parameters (i.e., parameter name, testing method, range of allowed values, unit of measurement, and testing method details). The second one describes sub-components of the ingredient (i.e., its quantity, name, allergens, ingredient function, and country of origin). The third table informs about the presence of allergens (e.g., their names and binary information about their presence). The last two tables contain a quantity of the allergens (e.g., names and their qualities) as sub-components and caused by contamination retrospectively.
The first table needs to be extracted from the first document fragment, the second table – from the second fragment, and the three last tables – from the third document fragment. Input documents feature tables and fulfilled forms, where properties are presented in the form of text or check-boxes.
The analysis of expected outputs shows a high level of variability concerning the factors of table length (1 to 60 rows) and answer type (either a binary value, number, complex chemical name, or a more extended description).
Payment Stubs. The second of our private datasets consists of 110 American payment stubs, i.e., documents obtained by an employee regarding the salary received.
We aim to extract employee and employer names, dates, and payment tables, where each row consists of payment type, hours worked, and payment amount. Since documents come from different companies, their layouts differ significantly.
Due to the straightforward form of information to be extracted, a single annotator annotated each document. We state these were annotated ethically by our paid co-workers.
Bank Statements. The last dataset consists of 131 annotated bank statements. The goal here is to extract bank and customer name, date of issue, and table of account balances (e.g., account number, balance at the beginning of the period, and balance at the end).
Data to be comprehended is partially presented in the document’s header and partially in multiple forms (each for one account).
Similar to the Payment Stubs dataset, documents here were issued by different banks and represent a broad spectrum of layouts. The annotation process was the same as for the Payment Stubs dataset.
Appendix F Adaptation to Table Structure Recognition Task
To adjust the proposed method to be applicable to the task of Table Structure Recognition, one must understand the differences in framing the problem between the tasks here.
Table Structure Recognition or Table Extraction aims to generate headers and the table content based on the document with the table provided explicitly. STable described in the main part of this paper can generate the table given any text and its position on pages. This capacity generalizes well to any input, including when the table is provided on the input. The difference is that the output form in STable assumes the headers are known upfront, while for Table Structure Recognition, inferring them is a part of the task. STable can achieve such capabilities to solve the Table Structure Recognition task by (1) adding a linear layer to predict the number of columns, (2) treating headers as the values to be inferred in the first row, (3) using dummy names of the columns, e.g., "first column," "second column," and (4) increasing the predicted number of rows by .
In this setup, the model will predict the number of columns and the number of rows, while the first row will represent the values of header names. The dummy headers will have to be removed during postprocessing, and the values in the first row should be treated as valid headers.
Appendix G Sample Input-Output Pairs
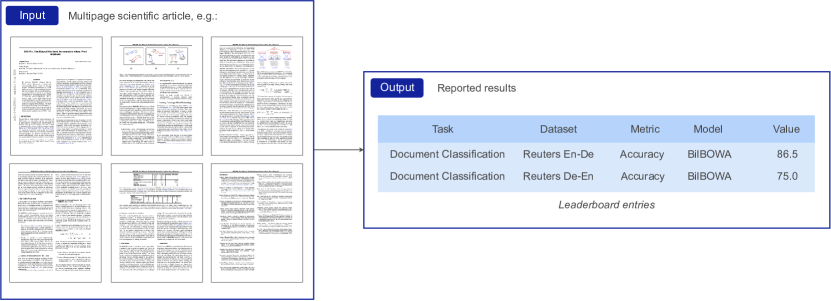
PWC★ (Borchmann et al.,, 2021). Input in the PWC★ consists of born-digital, multipage PDF files containing an article from the machine learning field. The expected output is a list of tuples describing achieved results on arbitrary datasets (see Figure 7).
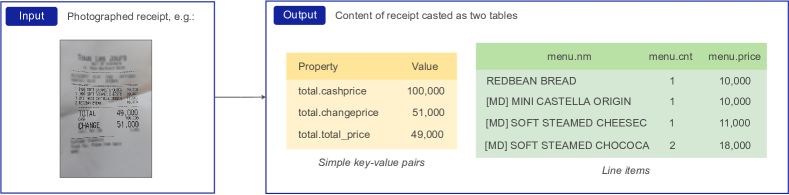
CORD (Park et al.,, 2019). Input in the dataset is a single scanned or photographed receipt. From our point of view, the output here is twofold — there are simple data points that can be considered key-value pairs and data points that take the structured form of line items. We approach the problem as the generation of two tables from the document — one for each data kind (see Figure 8).
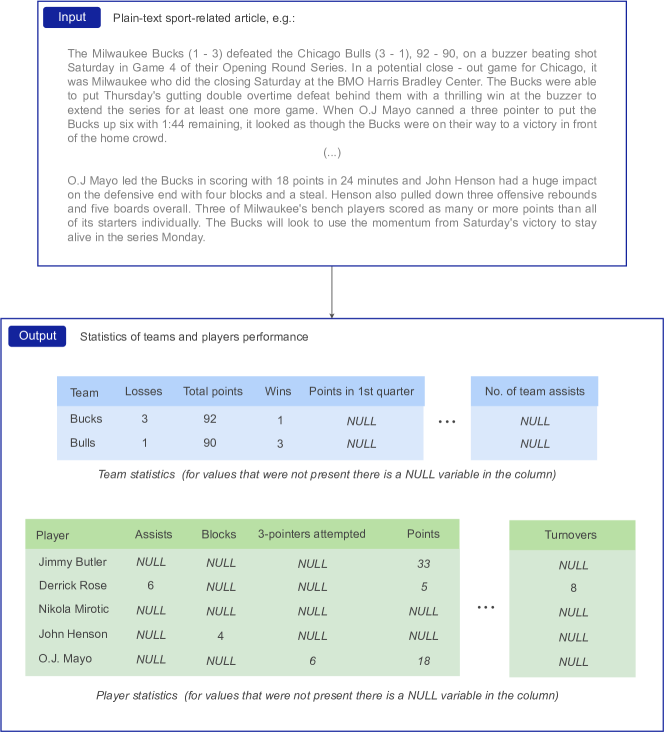
Reversed Rotowire (Wu et al.,, 2021). Input in the reversed Rotowire dataset, as reformulated by Wu et al., (2021), is a plain-text sport news article. The task is to generate tables with team and player statistics. The number of rows in the Team table is from zero (if no team is mentioned in the text) to two, whereas the number of rows in the Player is highly variable and content-dependent. Figure 10 present sample pair of document and tables to generate.
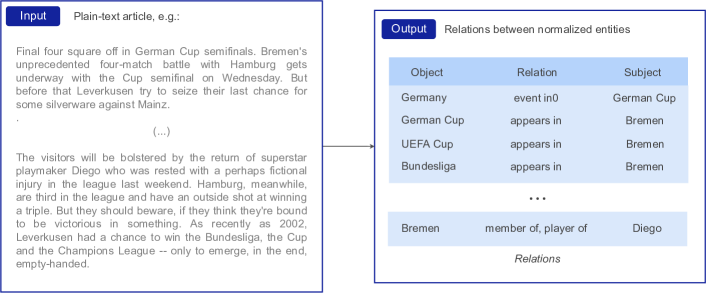
DWIE (Zaporojets et al.,, 2021). Input in the dataset is a plain-text article. The final goal is to extract the normed object, relation, and subject triples (though the original formulation assumes several intermediate stages). Triples are always complete (i.e., there are no NULL values, as we understand them (see Figure 9 for an example).
The horse face emoji we feature is a part of Noto Emoji distributed under the Apache License 2.0. Copyright by Google Inc. No animals were harmed in the making of this article.