To remove or not remove Mobile Apps?
A data-driven predictive model approach
Abstract
Mobile app stores are the key distributors of mobile applications. They regularly apply vetting processes to the deployed apps. Yet, some of these vetting processes might be inadequate or applied late. The late removal of applications might have unpleasant consequences for developers and users alike. Thus, in this work we propose a data-driven predictive approach that determines whether the respective app will be removed or accepted. It also indicates the features’ relevance that help the stakeholders in the interpretation. In turn, our approach can support developers in improving their apps and users in downloading the ones that are less likely to be removed. We focus on the Google App store and we compile a new data set of 870,515 applications, 56 of which have actually been removed from the market. Our proposed approach is a bootstrap aggregating of multiple XGBoost machine learning classifiers. We propose two models: user-centered using 47 features, and developer-centered using 37 features, the ones only available before deployment. We achieve the following Areas Under the ROC Curves (AUCs) on the test set: user-centered = 0.792, developer-centered = 0.762.
keywords:
Third-party apps, Mobile apps, App stores, Actions, Broadcast receivers, Privacy, Permissions, XGBoost, Predictive Analysis, Android.1 Introduction
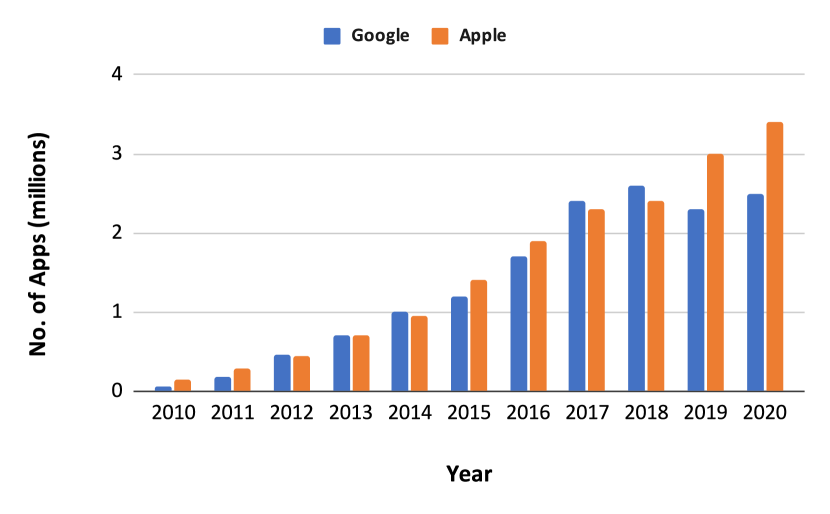
The mobile-app industry has grown tremendously in the last decade and is expected to keep rising. For example, Figure 1 shows the number of applications in two popular app stores, Google Play and Apple. The number of applications between 2010 and 2020 has enormously increased, from thousands into millions. This growth has also been accompanied with an increased number of malware and vulnerable applications [1, 2, 3, 4, bba5d9341b2a427192a2347fc775610f]. In response to these threats, researchers have proposed numerous defense solutions to protect the privacy of end users [5, 6] and the security of their devices [7]. Additionally, the mobile app stores have also implemented quality and security check measures to combat the different threats which resulted in removing a lot of applications from both markets between 2017 and 2019 [Wottrich2018ThePT]. Legitimate mobile app stores have long been compared against each other based on numerous factors such as submission process, cost, and the amount of guidance that is given to developers. The Google Play store, for instance, was criticised at first for not rigorously vetting apps before approving and making them available to users [8].
As such, Google has been introducing a number of solutions to monitor its app store, which resulted in removing a large number of applications [10]. For example, they introduced Google Play protect [11], which is responsible for the rejections, removals, and suspensions of violating and suspicious third-party applications. The system issues also warnings and sometimes delivers push notifications to the developers of removed or suspended apps.
Both Google Play Developer Distribution Agreement [12] and Google Play Program Policies [13] contain extensive details and instructions regarding what should and should not be included in mobile applications. The precise requirements are, however, still unclear and prone to misinterpretation, needless to say that some developers ignore these guidelines. Moreover, the Google Play store gives less guidance when an app is rejected in comparison to the iOS store [8].
Removing violating apps have various negative consequences on both benign developers and mobile users. This is especially the case if the applications were removed from the Google Play after they have been admitted and made available to users. When an app is removed, the notifications sent by Google Play protect [11] are very generic and do not give developers any particular directions as to how to fix their apps. As a result, not just their apps get flagged and removed from the store, their accounts might also get suspended. On the other hand, it is also inconvenient for users when some of the apps they have been using get removed from the store.
Researchers have long studied the factors that influence the trustworthiness of mobile apps in online stores. Because of that, numerous frameworks have been proposed to assess their trustworthiness [14], risk [15], quality and suspicious behavior [16, 17]. Determining the removability of mobile apps from the App stores is a challenging problem because there are numerous potential reasons as to why mobile applications get removed from these stores. In addition, it is very challenging if not impossible to enumerate all of these causes. Moreover, some of these reasons are not easy to pinpoint automatically or identify statistically [10]. Thus, researchers in their efforts to tackle this problem have considered fewer reasons and relied on manual analysis of the removed apps. For example, Wang et al. relied heavily on the manual analysis of the removed Android apps [10]. Their machine learning classifier was only focused on COPPA-violated apps. Similarly, Seneviratne et al. [18] also relied on manual analysis of the collected app samples, focused only on detecting spam apps, and assumed that top apps with respect to the number of downloads, number of user reviews, and rating, are quite likely to be non-spam.
The aim of our work is, thus, to develop two data-driven predictive models that can determine whether a given app will be removed or maintained by the Google Play store before its deployment and after it has been deployed. The predictive models are based on a machine learning algorithm called Extreme Gradient Boosting, or XGBoost [19]. It leverages a mix of contextual and technical app’s features such as the privacy policy link, the genre, the requested permissions or privileges, and broadcast listeners. The models are meant to support developers, users, and app stores. We expect that they will help developers determine whether their apps are likely to be removed or not; hence, giving them an opportunity to review and fix their apps before submitting them to the store. In addition, they can assist users in choosing applications that are less likely to be removed. Lastly, Google Play store may consult with these models to identify violating applications early on before admitting them into the store or afterwards. It is worth noting that we do not apply any manual analysis on the collected samples. In addition, our models are generic meaning that they do not include any domain-specific considerations; they are purely data-driven.
Our contribution in this work is threefold: First, we generated a very large data set of mobile applications from the Google Play store that includes the meta data, the Android Package (APK) files111APK is the package file format used by the Android operating system., and most importantly their standing in the store for over a year. The generated large data set is used to evaluate our approach, and is made publicly available [20]. Second, we propose two predictive models – developer-centered and user-centered – that can indicate whether or not an app will be kept in the Google app store. We believe that our data set and our encouraging results can be considered as a benchmark for further investigations. Third, we present different usage scenarios of the two models, in which they can be integrated into a service or an app. In this work, we follow the CRISP-DM methodology to address our research question, which is spanned across three sections: Methodology, Experiments and Results, and Discussion.
This paper is organized as follows: Section 2 provides general information about the topic, Section 3 introduces relevant works in the literature; Section 4 presents our data set and proposed method; Section 5 describes the experiments that we conducted; Section 6 discusses the results; and Section 7 presents our conclusions.
2 Background
We lay out the necessary background information regarding Android mobile applications, namely their distribution format, configuration file, permissions, and broadcast receivers.
2.1 Distribution
Android applications are distributed via official and non-official app markets in the Android Package file format (.apk). Official markets such as the Google Play store and Samsung Galaxy store apply a number of quality and safety checks on the admitted apps. Nonetheless, malicious and low-quality applications are frequently being published into these stores and downloaded by a large number of users. Additionally, Android applications can be downloaded from anywhere online. Because of that, the default security settings of Android is set to disallow installation of such applications, from unknown external sources. Since the official Google Play store is not available in some countries, alternative stores came out to fill that gap, such as the Xiaomi App Store, the 360 Mobile Assistant and the Huawei App store.
2.2 Android Manifest File
Any APK file usually contains among other things a configuration file called AndroidManifest. The manifest file of an app contains its configurations such as permissions, package name, broadcast receivers, and main activity. Extracting this file out of the APK file is easier and more accurate than retrieving the original source code [21]. In addition, accessing the manifest files of installed applications on mobile phones is also possible and accurate [22]. This is why researchers have long relied on it for building security and privacy solutions as we will detail in Section 3.
2.3 Android Permissions
The majority of third-party Android applications require some level of access to the device resources such as SMS, Contacts and Camera. The Android OS uses a permission system [23] to control the level of access each installed application has. The developers of these apps are, therefore, obligated to enlist all the permission requests in their apps’ AndroidManfiest.xml files.
2.4 Broadcast Receivers
In Android OS, a broadcast receiver of system actions allows apps to listen to events originating from the system. Examples include receiving SMS, call or voicemail, or when the WIFI is connected. As such, broadcast receivers might cause some security and privacy concerns to the end user. In Section 3 we discuss previous studies that employed broadcast receivers in assigning privacy scores to apps.
3 Related Work
Our research aims at helping users, developers, and app stores’ maintainers. As such, part of the discussion of the literature will be referring to these beneficiaries. Furthermore, the bulk of research that have been conducted in this area is focused on one or more type of bad applications.
Wang et al. [10] identified five categories, namely malicious, privacy-risk, fake, spamming, and privacy-violating. The models that we propose in this work are meant to be more generic, in that they will forecast whether an app will be maintained or removed, without specifying the reason of removal. Lin et al. [24] conducted a similar study but on iOS app store. Their work was focused on understanding the reasons why apps are being removed from the app store. Their data set was based on collecting daily snapshot of the whole iOS app market for a year and a half. They also built app removal prediction model based on a number of features that are extracted from the app metadata. Their model does not consider the apps that are new to the market because it simply relies on features that do not get populated immediately, e.g., app comments. Consequently, the model cannot be used by developers to predict the future of their apps before they upload them to the market.
The work of Wang et al. [10] is the closest to our work, in which they wanted to understand why some apps are being removed from the store. They implemented an empirical study on a large number of mobile apps collected from the Google Play store. However, the status of each app in their data set was only checked once, a year and a half later. In our work, the status was checked on three different occasions: the first check was done after 5 months, the second was done after 7 months, and the last was done after 1 year. Their manual analysis of the collected apps identified a set of 791,138 removed apps. They then ran an existing machine learning classifier [25] on this set to detect COPPA-violated apps, more specifically, apps targeting kids. Out of the 791,138 removed apps, the classifier has identified a total number of 23,319 apps targeting kids. It is important to note that this work aimed at encouraging researchers to build symptom-based predictor or even a machine learning-based predictor for flagging the to-be-removed apps before they are really removed. Thus, our work is an improvement of their work since it employs more sophisticated techniques, relies on more features, and one of our models, the developer-centered model, is designed to be effective even before the app gets submitted to the store.
Seneviratne et al. [18] proposed an Adaptive Boost classifier to detect spam apps based solely on their metadata that are available at the time of publication. Their work inspired us to use two of their features, namely IsSpamming and DeveloperCategory. Though, their classifier considers only spam apps, our two models do not distinguish between the different categories of bad applications. For us, an app is either removed or not. Additionally, their work relied on manual analysis of the collected app samples and assumed that the considered top apps with respect to the number of downloads, number of user reviews, and rating, are quite likely to be non-spam.
Researchers have long studied the factors that influence the trustworthiness of mobile applications in online stores. For example, Kuehnhausen and Victor [14] proposed a trustworthy model for mobile applications based on various factors, namely ratings, permissions, reviews and the relationships between applications. However, the number of features that were used in building the model is relatively small. Additionally, the ratings and the reviews features could be empty for some apps, especially, if these apps have not been long in the market or are not popular. Finally, the data set that was used to evaluate their proposed model is small and does not sufficiently represent the entire market because the focus was on popular apps. In our work, however, we use a much bigger and more representative data set, more features, and investigate two approaches; one that relies on features available before deployment and another that uses features that become available after deployment.
Natural Language Processing (NLP) techniques were investigated by Pandita et al. [15] on the description of an app and compared it with the permissions that the app had requested. Their aim was to examine whether the description of an application provides any indication for why the application needs a permission. In our view, we believe that in order to justify the use of a permission by an app, more features are needed besides the description such as the genre and system actions. Pratim Sarma et al. [26] on the other hand, used the genre to inform users whether the risks of installing an app is in accordance with its advertised benefit. In our work, the description, genre, permissions, system actions and more features are incorporated in the models.
A framework to help the user deciding whether a given application found in some app stores is trustworthy or not was introduced by Habib et al. [27]. It considers the publicly available information of an app such as user ratings and reviews, and also indicators regarding the security and as provided by state-of-the-art static analysis tools. As we explained earlier, the ratings and the reviews’ features could be empty, but they did not consider such cases like we do.
The permissions an app requests, the category of the app, and the permissions that are requested by other apps in the same category to infer a privacy score that would be used to help users with their installation decisions were leveraged by Sarma et. al [28]. The work of Mohsen et al. [29] did also devise a new privacy score for mobile applications, which is calculated based on the permissions they possess, the system actions they have registered to listen to and the users’ privacy preferences. Both scores [28, 29] could have been improved if more of the application’s meta data was utilized.
A large-scale longitudinal study on 5 million app records collected from three different snapshots of the Google Play store was conducted by Wang et al. [30]. Their study revealed a number of serious issues in the mobile app ecosystems. For example, the study shows that despite Google’s effort to remove bad apps from the store, the number of developers who do not comply with the guidelines has been nonetheless increasing. In our view, their results highlight the need to have a solution like the one we propose in this paper.
Researchers have also used some of the contextual and technical features that we used in our research but for detecting malicious Android applications. For example, Peiravian and Zhu [31] proposed to combine permissions and API (Application Program Interface) calls to detect malicious Android apps. Wu et al. [32] considered static information including permissions, deployment of components, intent messages passing and API calls for characterizing the Android applications’ behavior. Sanz et al. [33], Sato et al. [34], Feldman et al. [35], and Li et al. [36] extracted and used several features from the Android manifest of the applications to build machine learning classifiers for the detection of Android malware. In our work, we decided not to use any source code related features, because obtaining such features in real life is complicated, especially if the applications are paid and/or obfuscated.
Gómez et al. [16] analyzed the permissions and the user reviews of mobile applications to detect defective applications. The proposed system is aimed at helping app store maintainers predict apps with bugs before they harm the reputation of the app store as a whole.
Our work differs from the existing literature in three main aspects. First, we acquire and curate a very rich data set, that is large in volume and in independent variables. Moreover, the value of the dependent variable (removed or not removed) has been checked three times over a period of 1 year. Second, we propose two types of models that we refer to as developer-centered and user-centered, which can be applied before and after deployment, respectively. Third, our approach is completely data-driven. This means that the interaction between the given independent variables is learned from the training data rather than being imposed or manipulated by domain-specific knowledge.
4 Methodology
In this section, we describe the data set that we collect and curate followed by feature engineering and the predictive models.
4.1 Data set
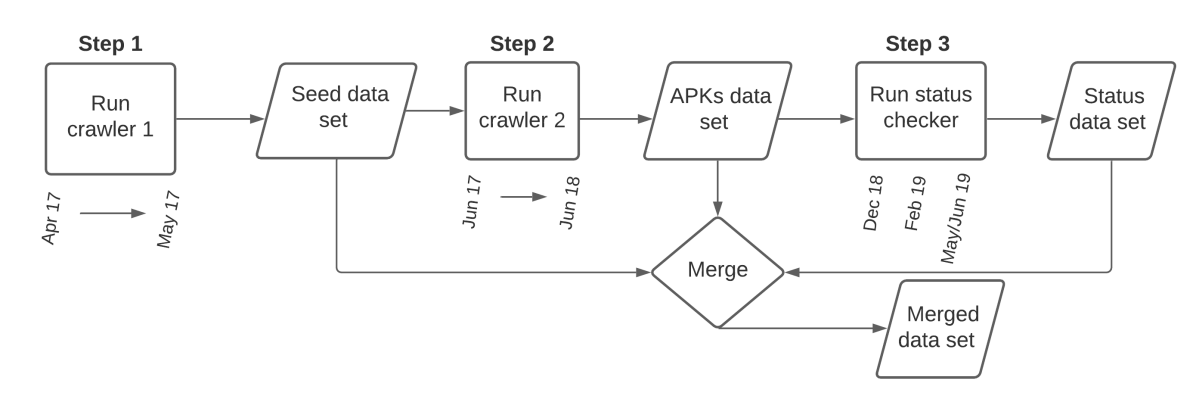
In Fig. 2 we show our methodology for collecting and curating the data set that we used for training and evaluating our models. We collected the data over a course of 26 months, between April 2017 and June 2019. In the first one-month long phase, we crawled the Google Play store main pages which resulted in 2,021,159 applications including all the information that we could find on these pages except for the permissions and users’ reviews. We call this collection the seed data set, the output of Step 1 in Fig. 2. Then, in the second phase, which lasted a year, we downloaded the APK files for slightly more than half of the apps that are in the seed data set. We call this collection the APKs data set, which contains 1,164,216 apk files, Step 2 in Fig. 2. The last phase was geared towards collecting the ground truth labels (i.e. the values of the dependent variable) for all apps in the APKs data set. It involved checking the status of the apps in the app store to see whether they are still in there or got removed. This phase was executed on three different occasions. We call this list the status data set, which contains 1,090,484 apps, Step 3 in Fig. 2.
4.2 Data preparation
Since the data set was collected in different phases, the first step was to merge them together, hence the Merge step in Fig. 2. The merge is meant to keep all the apps with complete profiles, which entails the information from the Play store pages, APK files, and the three different status checks. This resulted in a total of 999, 530 applications as per Table 3. We then excluded the applications that either had missing values due to crawling errors, or their manifest files could not be retrieved from their APK files. This step resulted in reducing the number of applications to 870,515, which we call the merged data set.
In Fig. 3, we show the top 22 represented genres in the merged data set (there are 48 distinct genres), nearly 86% of the entire data set fall into these genres. The mean and standard deviation of the reviews for all apps are 3.4 and 1.7, respectively. This suggests that the majority of the collected applications have in fact high review averages including the ones that were removed from the market. In fact, the mean for the reviews of the removed applications is 3.3 with a standard deviation of 1.77, in comparison to 3.6 and 1.77 for the applications that were kept in the market. Finally, in Fig. 4, we show the distribution of the lowest Android version of all applications in the data set. Nearly 60% of the apps have Gingerbread and Ice Cream Sandwich as their lower Android version. In Section 5 we describe the contribution of this information, lower Android version, in predicting the faith of an app.
4.3 Feature Engineering
In this phase, we determined the most suitable features, also known as independent variables, and whether they require any further preprocessing. We applied various techniques for the purpose of normalizing and standardizing all features. We call this collection the final data set.
In Table 1, we list all features in the final data set, their sources, types, and the pre-processing operations that we applied to them. Twenty seven features came directly or indirectly from the seed data set, and twenty features came from the APKs data set. Seven of these features are of categorical type and the remaining are numerical. We applied the one hot encoding to all categorical features.
4.3.1 Input features of the Seed data set
Table 2 shows the list of 24 features of the Seed data set, which we were able to crawl from the Google Play store pages for each application. The table contains real values for the features of the WhatsApp Android application as an example. In Table 1 we show the 27 features (the rows where the Source column has Seed for its value) that were generated from these 24 variables.
| Feature | Type | Source | Operation | |
|---|---|---|---|---|
| 1 | Status | Target | Status | Aggregated |
| 2 | OneStarRatings | Int | Seed | Normalized |
| 3 | TwoStarRatings | Int | Seed | Normalized |
| 4 | ThreeStarRatings | Int | Seed | Normalized |
| 5 | FourStarRatings | Int | Seed | Normalized |
| 6 | FiveStarRatings | Int | Seed | Normalized |
| 7 | ReviewsAverage | Float | Seed | None |
| 8 | LenTitle | Int | Seed | Transformed |
| 9 | LenDescription | Int | Seed | Transformed |
| 10 | LenWhatsNew | Int | Seed | Transformed |
| 11 | DeveloperWebsite | Int | Seed | Transformed |
| 12 | DeveloperEmail | Int | Seed | Transformed |
| 13 | DeveloperAddress | Int | Seed | Transformed |
| 14 | PrivacyPolicyLink | Int | Seed | Transformed |
| 15 | Paid | Int | Seed | None |
| 16 | MaxDownloadsLog | Int | Seed | Logarithmic |
| 17 | LowestAndroidVersion | Cat. | Seed | Derived |
| 18 | HighestAndroidVersion | Cat. | Seed | Derived |
| 19 | AndroidVersion | Cat. | Seed | Encoded |
| 20 | DevRegisteredDomain | Int | Seed | Transformed |
| 21 | DaysSinceLastUpdate | Int | Seed | Derived |
| 22 | LastUpdated | Int | Seed | Transformed |
| 23 | FileSize | Int | Seed | Encoded |
| 24 | CurrentVersion | Cat. | Seed | Transformed |
| 25 | Genre | Cat. | Seed | Encoded |
| 26 | ContentRating | Cat. | Seed | Encoded |
| 27 | DeveloperCategory | Cat. | Seed | Generated & Encoded |
| 28 | IsSpamming | Int | Seed | Generated |
| 29 | Storage | Int | APKs | Transformed |
| 30 | Calendar | Int | APKs | Transformed |
| 31 | Camera | Int | APKs | Transformed |
| 32 | Contacts | Int | APKs | Transformed |
| 33 | Location | Int | APKs | Transformed |
| 34 | Microphone | Int | APKs | Transformed |
| 35 | Phone | Int | APKs | Transformed |
| 36 | Sensors | Int | APKs | Transformed |
| 37 | SMS | Int | APKs | Transformed |
| 38 | Net | Int | APKs | Transformed |
| 39 | Intent | Int | APks | Transformed |
| 40 | Bluetooth | Int | APKs | Transformed |
| 41 | App | Int | APKs | Transformed |
| 42 | Provider | Int | APKs | Transformed |
| 43 | Speech | Int | APKs | Transformed |
| 44 | NFC | Int | APKs | Transformed |
| 45 | Media | Int | APKs | Transformed |
| 46 | Hardware | Int | APKs | Transformed |
| 47 | Int | APKs | Transformed | |
| 48 | OS | Int | APKs | Transformed |
| Feature | Type | Sample values | |
|---|---|---|---|
| 1 | Description | Text | WhatsApp Messenger is a FREE messaging app available for Android and other smartphones…. |
| 2 | Title | Text | WhatsApp Messenger |
| 3 | Last Updated | Date | May 13, 2020 |
| 4 | Whats New | Text | Group video and voice calls now support up to 8 participants. All participants need to be on the latest version of WhatsApp. |
| 5 | Reviews Average | Number | 4.3 |
| 6 | Price | Number | 0.0 |
| 7 | Ratings | Number | 114,391,572 |
| 8 | One Star Ratings | Number | 4,000,000 |
| 9 | Two Star Ratings | Number | 2,000,000 |
| 10 | Three Star Ratings | Number | 2,391,572 |
| 11 | Four Star Ratings | Number | 6,000,000 |
| 12 | Five Star Ratings | Number | 100,000,000 |
| 13 | Privacy Policy Link | Text | http://www.whatsapp.com/legal/#Privacy |
| 14 | Genre | Text | Communication |
| 15 | Url | Text | https://play.google.com/store/apps/details?id=com.whatsapp |
| 16 | Content Rating | Text | PEGI 3 |
| 17 | Current Version | Text | 2.20.157 |
| 18 | Android Version | Text | 4.0.3 and up |
| 19 | Developer Email | Text | android@support.whatsapp.com |
| 20 | Developer Website | Text | https://www.whatsapp.com/ |
| 21 | Developer Name | Text | WhatsApp Inc. |
| 22 | Developer Address | Text | 1601 Willow Road Menlo Park, CA 94025 |
| 23 | File Size | Number | 28M |
| 24 | Downloads | Number | 5,000,000,000+ |
For instance, in Table 2, feature number 7, Ratings illustrates the number of users who rated the app by giving it a score from 1 to 5. The feature was used to normalize features 8-12, in order to produce features 2-6 in Table 1. The Ratings was thus removed from the list.
As to the Title, Description, and Whats New features, we only considered their overall length in characters. The variables Developer Website, Developer Email, Developer Address, and Privacy Policy Link, were treated as binary; either present (1) or absent (0). The Paid binary feature is based on the Price feature, where 0 means it is a free app, and 1 means otherwise. The Downloads are originally given in ranges , and decided to take the logarithm of the maximum; i.e. . For instance, if the number of Downloads for an app is given as [5000,10000], then we take .
Some features were derived from existing ones, such as the HighestAndroidVersion and LowestAndroidVersion, both of them were derived from the AndroidVersion feature. The DevRegisteredDomain feature was derived from the DeveloperWebsite feature. It states whether the developer of the app has her own domain name or not. Additionally, the DaysSinceLastUpdate feature was derived from the LastUpdated feature. It is a continuous integer that represents the number of days since each app was last updated in comparison to other apps in the data set and we computed it as follows. First, we get the most recent date from the data set, which would be the maximum date. Second, we calculate the DaysSinceLastUpdate for each app as the number of days between its LastUpdated and the maximum date. As a consequence, at least one app will get a zero value; the app which was updated most recently. We kept the LastUpdated feature as well, however, we only considered its year value in four digits. The size of an app is not explicitly mentioned in the Play store. There are normally two possible values for it, either varies with the device or unspecified. Notably, the majority of the apps have an unspecified size and only a tiny proportion has a variable size. Thus, we encoded these two values to create the FileSize feature, where 0 means the size is unspecified, and 1 means it varies. For the CurrentVersion, we only considered the major version number. We also encoded the Genre and the ContentRating features using the one hot encoding.
Lastly, we calculated two additional features, namely IsSpamming and DeveloperCategory, based on the previous work in [37]. The former is a binary value calculated based on the number of apps a developer has and their download count, where 1 means that the developer is a spammer and 0 otherwise. The latter relies on the number of apps a developer has in the store. Each developer would be assigned any of the following categories; Aggressive (more than 50 apps released), Active (10 to 50 apps released), Moderate (2 to 10 apps released), and Conservative (released only 1 app). Spamming developers are aggressive developers that do not have any app with over 1M downloads and with an average install number below 10k.
4.3.2 APKs Input Features
The features that we obtained from the APKs data set came from extracting and then parsing the applications’ manifest files222Every app must include an AndroidManifest.xml file that contains essential information about the app.. We mainly focused on two components; the permissions and the system actions. The number of unique permissions and system actions slightly vary from one Android distribution to another. In this work, however, we considered 176 unique permissions and 134 unique system actions. The Android system classifies these permissions into dangerous and normal types. Dangerous permissions allow mobile apps to access users’ sensitive data such as contacts, SMS, and pictures. Therefore, Android mandates applications to get users’ consent and approval to be able to use them. On the other hand, normal permissions are presumably less risky, thus apps can obtain them without involving the users. The Android system further puts dangerous permissions into 9 groups; Storage, Calendar, Camera, Contacts, Location, Microphone, Phone, Sensors, and SMS. Each of these groups contains one or more permissions. We created a feature per each permission group with a value of 1 or 0, in which 1 means that the app has requested at least one permission of that group and 0 otherwise.
Android allows third-party applications to register for listening to various system’s events, such as when a new SMS arrives, a new call is made, and when the battery is low. The system sends out a broadcast whenever any of these events occurs. An application needs to be pre-configured in order to be able to listen to some of these events by including the corresponding system actions. As far as the actions are concerned, there is no preexisting classification to them. Instead, we relied on the top package name, which resulted in having 11 distinct groups/features; Net, Intent, Bluetooth, App, Provider, Speech, NFC, Media, Hardware, Google, and OS.
4.3.3 Dependent variable: Status
After completing the crawling phase, which included downloading the corresponding APKs, we determined the status of all applications, by checking on three different occasions whether they are still in the market or not. The first check was done on December 2018, the second on February 2019, and the last was completed during the months of May and June 2019. In Table 3, we show the percentages of the applications that were never found in the market upon the three checks, stayed in the market the whole time, and the ones that changed their status throughout this period. We call the first group removed, the second stable, and the latter mix. The apps that fall in the removed and stable groups represent 91.6% of the entire data set. As such, we decided to focus only on these two groups and ignore the other ones because the applications in those groups do not have sufficient samples in comparison to the first two.
| Dec 18 | Feb 19 | May-June 19 | #Apps | Portion (%) |
| 1 | 1 | 1 | 553395 | 50.7 |
| 0 | 0 | 0 | 446135 | 40.9 |
| 0 | 1 | 1 | 38848 | 3.6 |
| 0 | 1 | 0 | 31804 | 2.9 |
| 1 | 0 | 0 | 9715 | 0.9 |
| 1 | 0 | 1 | 6507 | 0.6 |
| 0 | 0 | 1 | 3005 | 0.3 |
| 1 | 1 | 0 | 1075 | 0.1 |
| Total | 1090484 | 100 | ||
4.4 Prediction Model
The machine learning algorithm chosen for this research is the Extreme Gradient Boosting of Decision Trees or XGBoost for short. This decision is motivated by its outstanding performance on various Kaggle333www.kaggle.com benchmark data sets among others, its efficiency in learning and applying a model together with the ability in determining the relevance of each independent variable, which facilitates the interpretation of the pipeline [38, 39, 40].
XGBoost is a supervised learning algorithm that predicts the target class through aggregating the decisions of a number of regression trees. It uses the gradient descent algorithm during learning for the minimization of the loss function when configuring new trees. For further technical details we refer to [19].
In order to counter for the imbalance in the distribution of the two classes (removed and stable) we embed the XGBoost in a bootstrap aggregating (bagging) approach. This ensures that an XGBoost model is trained with a balanced data set, something that is desirable in machine learning in order to avoid any bias. In practice, the bagging approach requires the bootstrapping with replacement of balanced subsets and use them to train XGBoost models. For a given app the prediction is then calculated using the majority voting rule of all the classifications achieved by the participating XGBoost models.
5 Experiments and Results
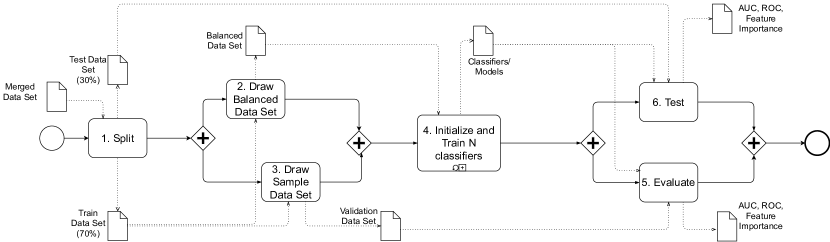
In Fig. 5, we show the steps that we have taken to build, train, and test the two models. In Step 1, the final data set of records is split (stratified random sampling) into training data (70%: ) and test data (30%: ). In Step 2, a balanced data set is drawn from the training data. We experimented with the following sizes of the balanced data set; and . Each balanced subset is determined by randomly selecting, with replacement, the same number of removed and not removed apps from all apps in the training data. In Step 3, a validation data set is drawn from the training data, which has the same class distribution and size as the test data. In step 4, a number of XGBoost classifiers are initialized and trained using a different balanced data set that is sampled as mentioned in Step 2. We experimented with the following number of classifiers: , and . Note that we do not fine tune the involved models/classifiers. We configure them using default values for all parameters except for the number of trees and the maximum depth of each tree . For these two parameters we pick a random value from the following predefined lists: and . Such values ensure that the learned XGBoost models are not fine tuned on the training data as they consist of an ensemble of very shallow decision trees. This is important to avoid overfitting. A similar approach was adapted in [40]. For a given app the prediction (removed or not removed) is then determined from the average score of all predictions by the participating XGBoost models. Steps 5 and 6 are used to estimate the performance of the validation and test sets in terms of ROC and AUC, as well as the feature importance scores.
5.1 User- and Developer-centered models
The above experiments were first conducted using the 47 features that are shown in Table 1. The resulting predictive model that relies on the full set of 47 features is distinctively suitable to the end users, who may use it to choose applications that will most likely remain in the market. We refer to this model as user-centered. The Google Play store may also use the resulting model to identify violating applications after they have been admitted into the store.
However, in order to aid developers before submitting their applications to the market or to aid the Play store before admitting the applications, another model is needed. The new model, which we call developer-centered, shall rely on less features, the ones that are only available before deployment. In Table 1 we indicate these features with the non-highlighted rows. Thus, the developer-centered model uses 37 features, as it excludes the following 10 features that are only available after deployment: OneStarRatings, TwoStarRatings, ThreeStarRatings, FourStarRatings, FiveStarRatings, ReviewsAverage, LenWhatsNew, MaxDownloadsLog, DaysSinceLastUpdate, LastUpdated.
In order to select the best user- and developer-centered models we generate the receiver operating characteristic (ROC) curves for different settings and choose the models that achieve the highest area under ROC curve (AUC). The ROC curve demonstrates how the true and false positive rates change as a function of the operating point. The operating point is the threshold (between 0 and 1) that determines the predicted label of the given sample. For instance, for an operating point of 0.5, if the average predicted score of all involved XGBoost classifiers is below 0.5 then the given sample is labelled as “to be removed”, otherwise “to be kept”. For each considered operating point we compute the confusion matrix that consists of the number of true positives (TP), false positives (FP), true negatives (TN) and false negatives (FN). The true positive rate (TPR) is then the ratio of TP and all positive predictions (TP + FP), while the false positive rate (FPR) is the ratio of FP and the total number of negatives (FP and TN). The AUC is the area under the ROC curve, which can have a value between 0 and 1. The higher (maximum 1) the AUC the better the performance of the respective model. An AUC of 0.5 for a two-class problem indicates that the model is not better than a random decision, and an AUC of 0 represents predictions that are completely opposite than desired.
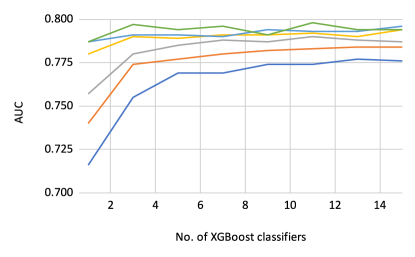
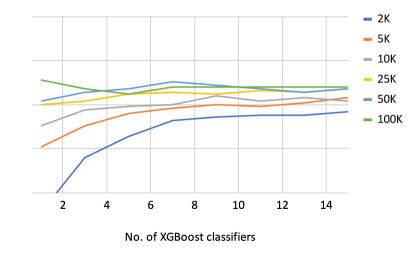
In Fig. 6 we show the AUC values for a number of experiments with varying number of XGBoost classifiers and sizes of the balanced training sets that are used to evaluate the user-centered and the developer-centered models on the validation set, respectively. The results show that the best performance of the user-centered model is achieved with 11 XGBoost classifiers, while for the developer-centered model the best performance is achieved with only 1 XGBoost classifier. For both models, the best performance is achieved with balanced training sets of in size.
In Fig. 7 we illustrate the ROC curves together with their AUC values of the selected models when applied to the test set. We also compute the AUC scores for the models when applied to the validation set. The high similarity between the AUCs of both models achieved for the validation (user-centered: 0.798, developer-centered: 0.764) and test sets (user-centered: 0.792, developer-centered: 0.762) demonstrate the generalisation ability of our approach.
| User-centered | Developer-centered |
|---|---|
 |
 |
As a byproduct, the XGBoost models provide us with an importance score for each independent variable. Importance scores are calculated for all attributes in each decision tree. For each tree, an attribute that is used more often to make key decisions, is given a high importance score. Then, the final feature importance of a particular attribute is summed up and divided by the number of decision trees. We determine the ranking of the features after averaging the importance scores across the participating XGBoost classification models. For the user-centered predictive model the ContentRating, PrivacyPolicyLink and DeveloperWebsite are the top most important features in predicting the removability of an app. In Fig. 8, we show the averaged and normalized importance scores of the top 20 features across the 11 XGBoost classifiers. Similarly, in Fig. 9 we show the normalized scores of the 20 most relevant features as achieved by the single XGBoost classifier that defines the developer-centered model. For this model the ContentRating_Teen, PrivacyPolicyLink and IsSpamming are the top most important features. Both models share the top 5 most important features, which demonstrate their predictive power in both scenarios. Moreover, both models highlight the importance of including a PrivacyPolicyLink upon submitting an app to the store. In addition, the difference in the number of features between the user- and developer-centered models (the user-centered model has 47 features, and the developer-centered model has 37 features) did not have a significant impact on the performance.
6 Discussion
In this work we proposed two predictive models that can indicate whether an app will stay in the Play store or eventually get removed by Google. Our results suggest that such a model can be built with a decent accuracy by largely relying on the app meta data that are publicly available and a number of elements that can be easily extracted from an app’s manifest file. The AUCs of 0.792 and 0.762 for the user- and developer-centered models, respectively, represent the probabilities that they achieve higher scores for apps that will eventually be removed by the app store compared to those that will be retained. Therefore, the closer such an AUC (or probability) is to 1 the more accurate the model is. Typically, AUCs higher than 0.7 indicate strong effects between the independent and dependent variables [41]. In practice, we would need to determine a threshold between 0 and 1 such that an app that results in a value above the threshold by our respective predictive model will be considered “to be removed”, otherwise “to be kept”. This threshold can be set to be the one that yields the maximum harmonic mean (or F-score) of precision and recall on a validation set. Such a validation set can be drawn from the training set with the same size and class distribution as the test set (see Section 5).
We identified the need for both the user-centered and the developer-centered models, as they would be practically useful for users, developers and app stores alike. The user-centered model will guide users into installing applications that are more likely to stay in the store. Developers can utilize the corresponding model to predict whether their applications are prone to be removed or not. Finally, online app stores will be able to use both models to filter out violating applications upon admission or thereafter.
As a result, we identify two deployment scenarios. First, the user-centered model can be incorporated into a mobile app or a browser’s extension/plugin. The former can work in two modes: before installing an application from the designated market or after. The user can use the latter on a desktop computer while browsing app stores to choose a new mobile app. Second, the developer-centered can be incorporated into a website that developers can use before submitting an application to the online store.
6.1 Threats to Validity
In this work, the collection of the data set from the Google Play store is done under two main assumptions. The first assumption states that all applications in the store are benign [11]. The second one states that the only reason applications were removed/disappeared from the store while crawling was due to their violations of the store’s policy and recommendations [10]. However, there could be other reasons, for example, removing applications by their owners temporally or permanently, which we do not take into account. While here we used the Google Play store as a case study, the proposed approach is also applicable to the Apple store and to other ones that share similar properties of mobile applications.
7 Conclusion and future work
The rapid increase of low quality and/or violating apps in the online stores has provoked stores’ maintainers into employing strict measures. As a result, large number of apps are continuously removed from the stores. Removing mobile applications after they have been admitted into online stores negatively affect the experience of end users and the reputation of app developers. Thus, in this work, we propose two predictive models, which we call user- and developer-centered. The former aids mobile users and app stores to determine the future of the app after deployment, while the latter supports developers and app stores before deployment. Our models consider the meta data of an app that is publicly available on the play store. Additionally, they incorporate the permissions that the app requests in its manifest file and the system actions that it is registered to listen to.
Both models were trained and validated using a very large data set of apps that we collected from the Google Play store. The data set is made publicly available [20].
In future, we firstly plan to investigate more sophisticated methods to extract information from unstructured text-based variables such as the Description, WhatsNew, and PrivacyPolicyLink features. Secondly, we will look into adapting the proposed data-driven approach to work with other app stores, such as Apple and beyond [42].
References
- [1] K. O. Elish, H. Cai, D. Barton, D. Yao, B. G. Ryder, Identifying mobile inter-app communication risks, IEEE Transactions on Mobile Computing 19 (1) (2020) 90–102. doi:10.1109/TMC.2018.2889495.
- [2] C. Bi, G. Xing, T. Hao, J. Huh-Yoo, W. Peng, M. Ma, X. Chang, Familylog: Monitoring family mealtime activities by mobile devices, IEEE Transactions on Mobile Computing 19 (8) (2020) 1818–1830. doi:10.1109/TMC.2019.2916357.
- [3] W. Gu, L. Shangguan, Z. Yang, Y. Liu, Sleep hunter: Towards fine grained sleep stage tracking with smartphones, IEEE Transactions on Mobile Computing 15 (6) (2016) 1514–1527. doi:10.1109/TMC.2015.2462812.
- [4] Y. Liu, Z. Li, aleak: Context-free side-channel from your smart watch leaks your typing privacy, IEEE Transactions on Mobile Computing 19 (8) (2020) 1775–1788. doi:10.1109/TMC.2019.2917659.
- [5] J. Lin, J. Niu, X. Liu, M. Guizani, Protecting your shopping preference with differential privacy, IEEE Transactions on Mobile Computing 20 (5) (2021) 1965–1978. doi:10.1109/TMC.2020.2972001.
- [6] F. Shen, J. D. Vecchio, A. Mohaisen, S. Y. Ko, L. Ziarek, Android malware detection using complex-flows, IEEE Transactions on Mobile Computing 18 (6) (2019) 1231–1245. doi:10.1109/TMC.2018.2861405.
- [7] S. Chang, H. Chen, H. Zhu, X. Hu, D. Cao, Cosafe: Securing mobile devices through mutual mobility consistency verification, IEEE Transactions on Mobile Computing 20 (5) (2021) 1761–1772. doi:10.1109/TMC.2020.2974222.
-
[8]
P. Viswanathan,
ios
app store vs. google play store (2020).
URL https://www.lifewire.com/ios-app-store-vs-google-play-store-for-app-developers-2373130 -
[9]
D. Curry.
[link].
URL https://www.businessofapps.com/data/app-stores/ - [10] H. Wang, H. Li, L. Li, Y. Guo, G. Xu, Why are android apps removed from google play? a large-scale empirical study, in: 2018 IEEE/ACM 15th International Conference on Mining Software Repositories (MSR), 2018, pp. 231–242.
-
[11]
Google, Google play protect
(2020).
URL https://www.android.com/play-protect/ -
[12]
G. inc.,
Google
play developer distribution agreement (2021).
URL https://play.google.com/about/developer-distribution-agreement.html -
[13]
Google,
Developer
policy center (2021).
URL https://play.google.com/about/developer-content-policy/ - [14] M. Kuehnhausen, V. S. Frost, Trusting smartphone apps? to install or not to install, that is the question, in: 2013 IEEE International Multi-Disciplinary Conference on Cognitive Methods in Situation Awareness and Decision Support (CogSIMA), 2013, pp. 30–37. doi:10.1109/CogSIMA.2013.6523820.
- [15] R. Pandita, X. Xiao, W. Yang, W. Enck, T. Xie, Whyper: Towards automating risk assessment of mobile applications, in: Proceedings of the 22nd USENIX Conference on Security, SEC’13, USENIX Association, USA, 2013, p. 527–542.
- [16] M. Gómez, R. Rouvoy, M. Monperrus, L. Seinturier, A recommender system of buggy app checkers for app store moderators, in: 2015 2nd ACM International Conference on Mobile Software Engineering and Systems, 2015, pp. 1–11.
-
[17]
R. Slavin, X. Wang, M. B. Hosseini, J. Hester, R. Krishnan, J. Bhatia, T. D.
Breaux, J. Niu, Toward a
framework for detecting privacy policy violations in android application
code, in: Proceedings of the 38th International Conference on Software
Engineering, ICSE 2016, Austin, TX, USA, May 14-22, ACM, 2016, pp.
25–36.
doi:10.1145/2884781.2884855.
URL https://doi.org/10.1145/2884781.2884855 -
[18]
S. Seneviratne, A. Seneviratne, M. A. Kaafar, A. Mahanti, P. Mohapatra,
Early detection of spam mobile
apps, in: Proceedings of the 24th International Conference on World Wide
Web, WWW ’15, 2015, p. 949–959.
doi:10.1145/2736277.2741084.
URL https://doi.org/10.1145/2736277.2741084 -
[19]
T. Chen, C. Guestrin,
Xgboost, Proceedings of the
22nd ACM SIGKDD International Conference on Knowledge Discovery and Data
Mining (Aug 2016).
doi:10.1145/2939672.2939785.
URL http://dx.doi.org/10.1145/2939672.2939785 -
[20]
F. Mohsen, The manifest and store data
of 870,515 Android mobile applications (2022).
doi:10.34894/H0YJFT.
URL https://doi.org/10.34894/H0YJFT -
[21]
S. Dong, M. Li, W. Diao, X. Liu, J. Liu, Z. Li, F. Xu, K. Chen, X. Wang,
K. Zhang, Understanding android
obfuscation techniques: A large-scale investigation in the wild, CoRR
abs/1801.01633 (2018).
arXiv:1801.01633.
URL http://arxiv.org/abs/1801.01633 -
[22]
Google,
Android
packagemanager (2021).
URL https://developer.android.com/reference/android/content/pm/PackageManager -
[23]
G. inc.,
Permissions
on Android (April 2017).
URL "https://developer.android.com/guide/topics/permissions/index.html" -
[24]
F. Lin, H. Wang, L. Wang, X. Liu,
A Longitudinal Study of
Removed Apps in IOS App Store, Association for Computing Machinery, New
York, NY, USA, 2021, p. 1435–1446.
URL https://doi.org/10.1145/3442381.3449990 -
[25]
M. Liu, H. Wang, Y. Guo, J. Hong,
Identifying and analyzing the
privacy of apps for kids, in: Proceedings of the 17th International Workshop
on Mobile Computing Systems and Applications, HotMobile ’16, Association for
Computing Machinery, New York, NY, USA, 2016, p. 105–110.
doi:10.1145/2873587.2873597.
URL https://doi.org/10.1145/2873587.2873597 -
[26]
B. P. Sarma, N. Li, C. Gates, R. Potharaju, C. Nita-Rotaru, I. Molloy,
Android Permissions: A
Perspective Combining Risks and Benefits, ACM, New York, NY, USA, 2012, p.
13–22.
URL https://doi.org/10.1145/2295136.2295141 - [27] S. M. Habib, N. Alexopoulos, M. M. Islam, J. Heider, S. Marsh, M. Müehlhäuser, Trust4app: Automating trustworthiness assessment of mobile applications, in: 2018 17th IEEE International Conference On Trust, Security And Privacy In Computing And Communications/ 12th IEEE International Conference On Big Data Science And Engineering (TrustCom/BigDataSE), 2018, pp. 124–135. doi:10.1109/TrustCom/BigDataSE.2018.00029.
-
[28]
B. P. Sarma, N. Li, C. Gates, R. Potharaju, C. Nita-Rotaru, I. Molloy,
Android permissions: A
perspective combining risks and benefits, in: Proceedings of the 17th ACM
Symposium on Access Control Models and Technologies, SACMAT ’12, ACM, New
York, NY, USA, 2012, pp. 13–22.
doi:10.1145/2295136.2295141.
URL http://doi.acm.org/10.1145/2295136.2295141 - [29] F. Mohsen, H. Abdelhaq, H. Bisgin, A. Jolly, M. Szczepanski, Countering intrusiveness using new security-centric ranking algorithm built on top of elasticsearch, in: 2018 17th IEEE International Conference On Trust, Security And Privacy In Computing And Communications/ 12th IEEE International Conference On Big Data Science And Engineering (TrustCom/BigDataSE), 2018, pp. 1048–1057. doi:10.1109/TrustCom/BigDataSE.2018.00147.
-
[30]
H. Wang, H. Li, Y. Guo,
Understanding
the evolution of mobile app ecosystems: A longitudinal measurement study of
google play, in: WWW, WWW ’19, ACM, New York, NY, USA, 2019, p. 1988–1999.
doi:10.1145/3308558.3313611.
URL https://doi-org.proxy-ub.rug.nl/10.1145/3308558.3313611 - [31] N. Peiravian, X. Zhu, Machine learning for android malware detection using permission and api calls, in: 2013 IEEE 25th International Conference on Tools with Artificial Intelligence, 2013, pp. 300–305.
- [32] D. Wu, C. Mao, T. Wei, H. Lee, K. Wu, Droidmat: Android malware detection through manifest and api calls tracing, in: 2012 Seventh Asia Joint Conference on Information Security, 2012, pp. 62–69.
-
[33]
B. Sanz, I. Santos, C. Laorden, X. Ugarte-Pedrero, J. Nieves, P. G. Bringas,
G. Álvarez Marañón,
Mama: Manifest analysis
for malware detection in android, Cybernetics and Systems 44 (6-7) (2013)
469–488.
arXiv:https://doi.org/10.1080/01969722.2013.803889, doi:10.1080/01969722.2013.803889.
URL https://doi.org/10.1080/01969722.2013.803889 - [34] R. Sato, D. Chiba, S. Goto, Detecting android malware by analyzing manifest files, in: Proceedings of the Asia-Pacific Advanced Network, Vol. 36, 2013, p. 23. doi:10.7125/APAN.36.4.
- [35] S. Feldman, D. Stadther, B. Wang, Manilyzer: Automated android malware detection through manifest analysis, in: 2014 IEEE 11th International Conference on Mobile Ad Hoc and Sensor Systems, 2014, pp. 767–772.
- [36] X. Li, J. Liu, Y. Huo, R. Zhang, Y. Yao, An android malware detection method based on androidmanifest file, in: 2016 4th International Conference on Cloud Computing and Intelligence Systems (CCIS), 2016, pp. 239–243.
-
[37]
H. Wang, Z. Liu, Y. Guo, X. Chen, M. Zhang, G. Xu, J. Hong,
An explorative study of the
mobile app ecosystem from app developers’ perspective, in: Proceedings of
the 26th International Conference on World Wide Web, WWW ’17, International
World Wide Web Conferences Steering Committee, Republic and Canton of Geneva,
CHE, 2017, p. 163–172.
doi:10.1145/3038912.3052712.
URL https://doi.org/10.1145/3038912.3052712 - [38] A. Alsahaf, G. Azzopardi, B. Ducro, E. Hanenberg, R. F. Veerkamp, N. Petkov, Estimation of muscle scores of live pigs using a kinect camera, IEEE Access 7 (2019) 52238–52245. doi:10.1109/ACCESS.2019.2910986.
-
[39]
S. Farrugia, J. Ellul, G. Azzopardi,
Detection
of illicit accounts over the ethereum blockchain, Expert Systems with
Applications 150 (2020) 113318.
doi:https://doi.org/10.1016/j.eswa.2020.113318.
URL https://www.sciencedirect.com/science/article/pii/S0957417420301433 -
[40]
S. S. Lövdal, R. J. D. Hartigh, G. Azzopardi,
Injury
prediction in competitive runners with machine learning, International
Journal of Sports Physiology and Performance (01 Jan. 2020) 1 – 10doi:10.1123/ijspp.2020-0518.
URL http://journals.humankinetics.com/view/journals/ijspp/aop/article-10.1123-ijspp.2020-0518/article-10.1123-ijspp.2020-0518.xml - [41] M. Rice, G. Harris, Comparing effect sizes in follow-up studies: ROC area, Cohen’s d, and r, Law and Human Behaviour 29 (5) (2005) 615–620. doi:{10.1007/s10979-005-6832-7}.
-
[42]
H. Wang, Z. Liu, J. Liang, N. Vallina-Rodriguez, Y. Guo, L. Li, J. Tapiador,
J. Cao, G. Xu,
Beyond google
play: A large-scale comparative study of chinese android app markets, in:
Proceedings of the Internet Measurement Conference 2018, IMC ’18, Association
for Computing Machinery, New York, NY, USA, 2018, p. 293–307.
doi:10.1145/3278532.3278558.
URL https://doi-org.proxy-ub.rug.nl/10.1145/3278532.3278558