Learning Digital Terrain Models from Point Clouds: ALS2DTM Dataset and Rasterization-based GAN
Abstract
Despite the popularity of deep neural networks in various domains, the extraction of digital terrain models (DTMs) from airborne laser scanning (ALS) point clouds is still challenging. This might be due to the lack of dedicated large-scale annotated dataset and the data-structure discrepancy between point clouds and DTMs. To promote data-driven DTM extraction, this paper collects from open sources a large-scale dataset of ALS point clouds and corresponding DTMs with various urban, forested, and mountainous scenes. A baseline method is proposed as the first attempt to train a Deep neural network to extract digital Terrain models directly from ALS point clouds via Rasterization techniques, coined DeepTerRa. Extensive studies with well-established methods are performed to benchmark the dataset and analyze the challenges in learning to extract DTM from point clouds. The experimental results show the interest of the agnostic data-driven approach, with sub-metric error level compared to methods designed for DTM extraction. The data and source code is provided at https://lhoangan.github.io/deepterra/ for reproducibility and further similar research.
Index Terms:
DTM, ALS point cloud, rasterization, deep networks, dataset, GAN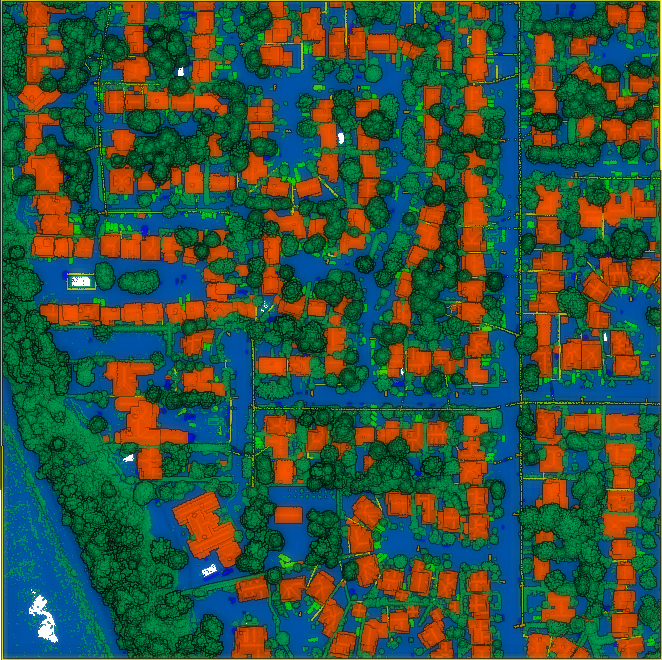

I Introduction
Digital terrain models (DTMs), 2D representations of bare-earth surface elevation, are critical for geographical and environmental studies such as flood modelling [1, 2, 3], above-ground biomass estimation [4], infrastructure planning [5], etc\onedot. Being a subset of digital elevation models (DEMs), DTMs are usually distinguished from its relative, digital surface models (DSMs), by the exclusion of objects (houses, vegetation, etc\onedot) and representing only the bare ground surface underlying the objects.
DTM extraction can be achieved from satellite or aerial images [6, 7], DSMs [8], or point clouds [9, 10]. Among the possibilities, airborne laser scanning (ALS) point clouds, with rich geometry information (c.f\onedot images) and high precision due to the penetration capability through vegetation (c.f\onedot photogrammetry), have gained attention in the recent decades. Several studies were proposed on ALS point clouds, while datasets were introduced to accommodate data-driven deep learning-based research, notably for point cloud segmentation [11, 12, 13, 14].
Deep learning methods, which learn to identify salient patterns from high volume of data, have proven to be more effective over well-engineered features for several computer vision and machine learning problems [15, 16, 17]. For DTM extraction, different CNN-based methods have been proposed for point cloud ground filtering [18, 19, 14], one of the two elemental steps, while the elevation interpolation problem is left open.
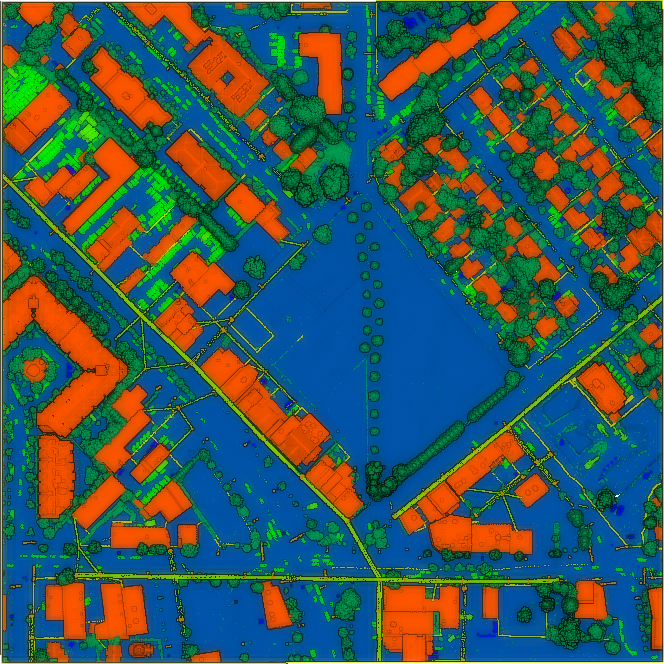
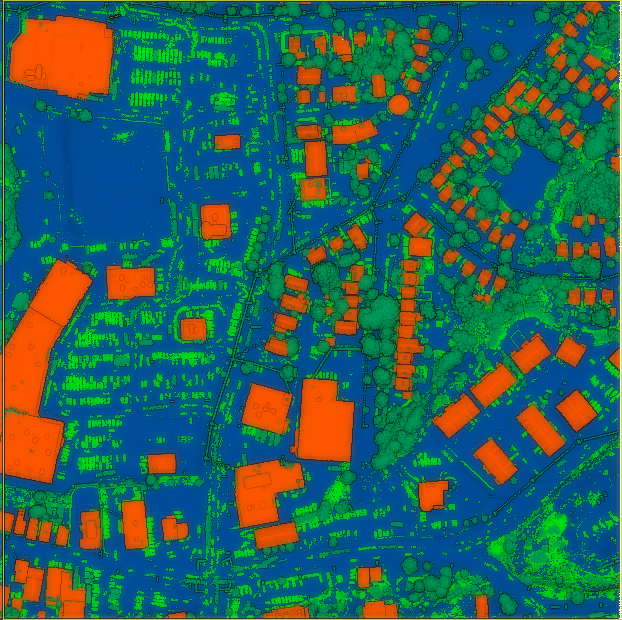
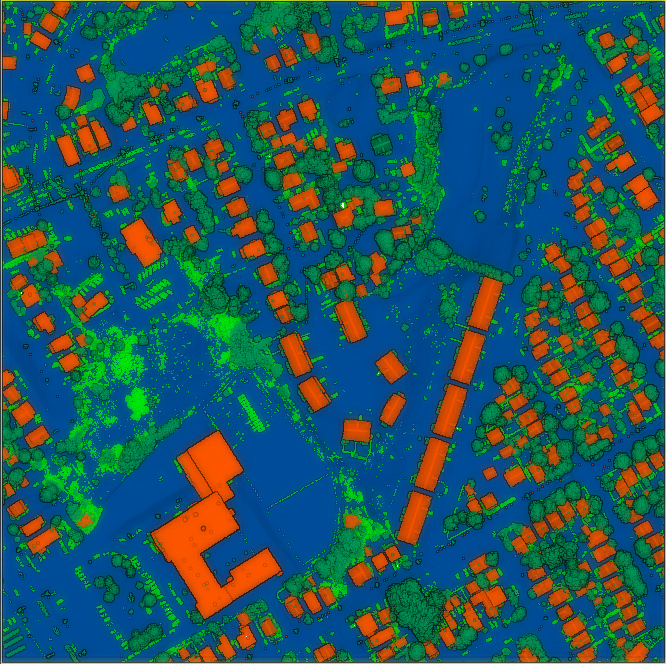
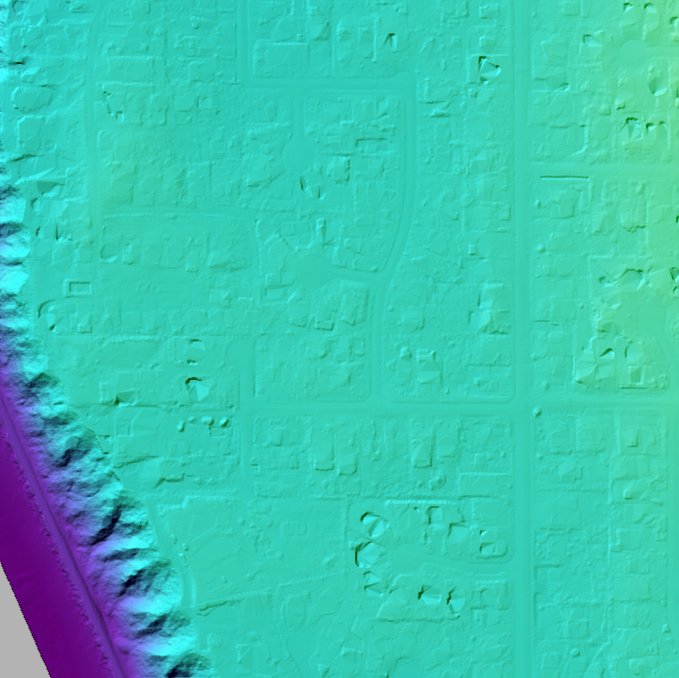
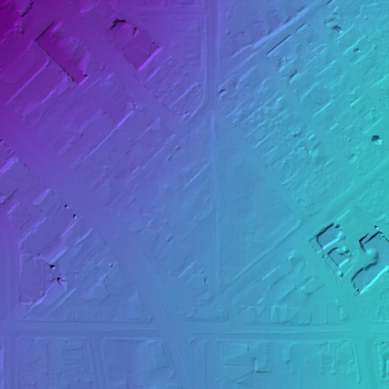
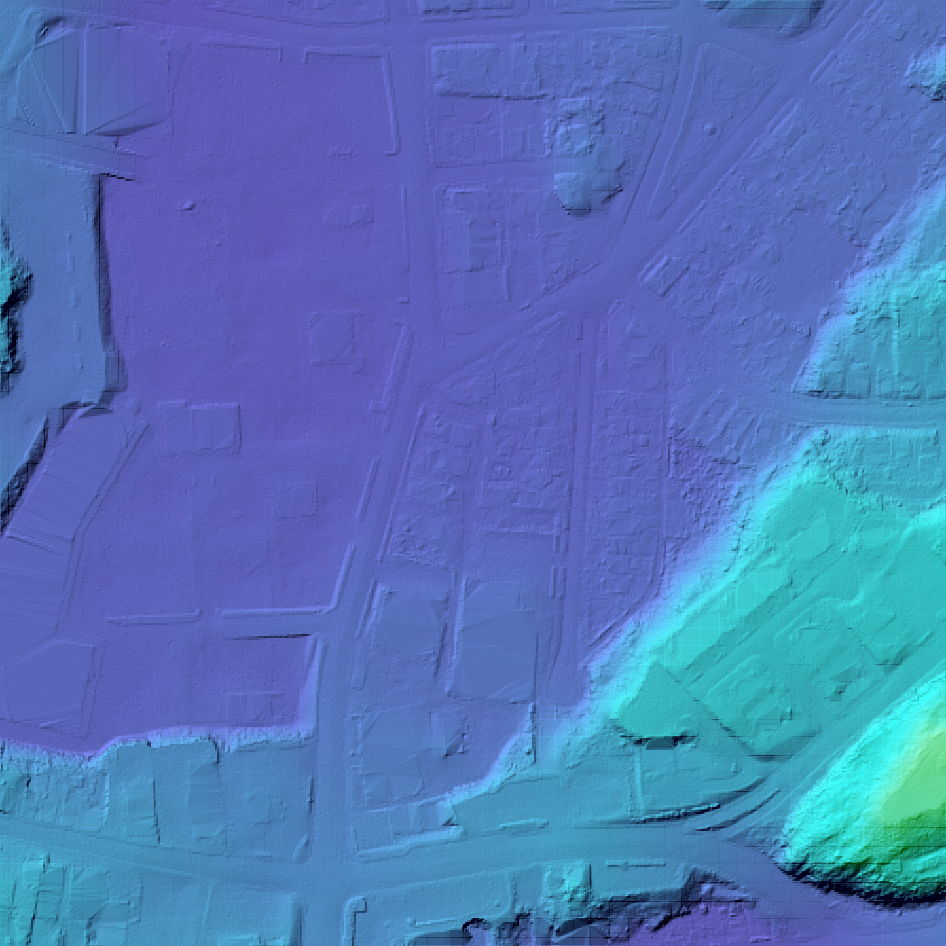
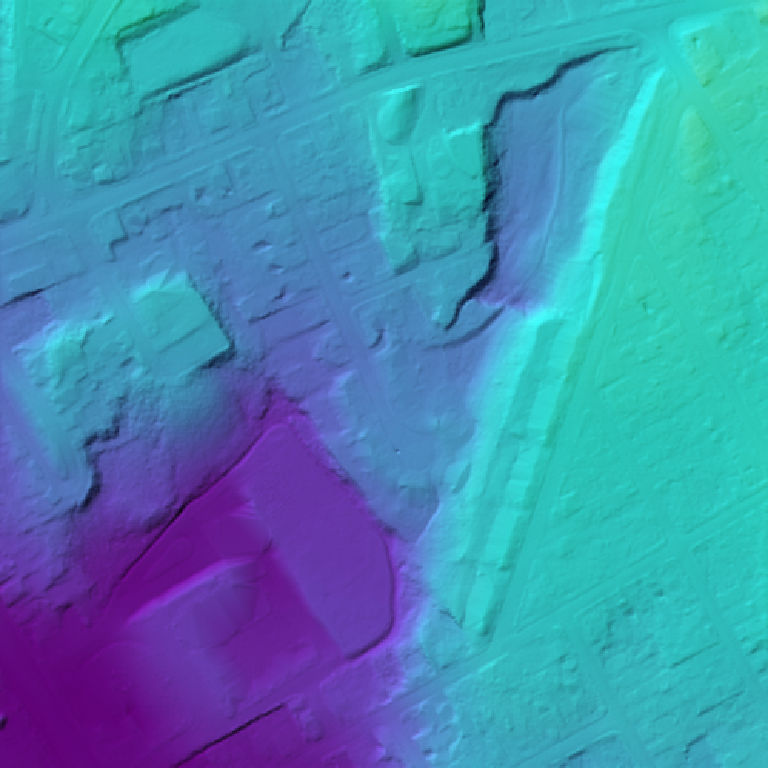
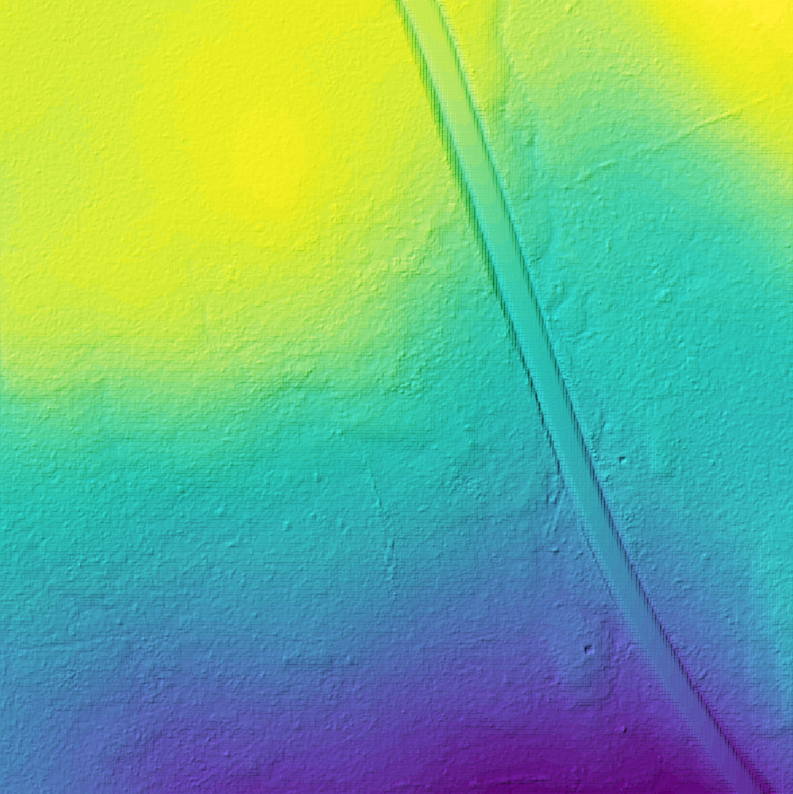
One hindrance for data-driven DTM extraction is the lack of dedicated large-scale datasets. While ground filtering can be formulated as a semantic segmentation problem, where one class is ground and the rest are non-ground, creating ground truth DTMs requires specialized knowledge and tools. To encourage deep-learning-based research in this important field, we introduce a large-scale dataset of ALS point clouds and reference DTMs collected from open data sources (Figure 1). Several well-established methods are compared for benchmarking purposes.
Another challenge to be tackled is the discrepancy of inputs and outputs representations. 3D ALS point clouds inherently lack topological information that 2D image-like DTMs embrace. In this paper, we propose using rasterization techniques to bridge the representation gap, which has proven to largely retain point-cloud information [20]. As such, point-cloud-based DTM extraction can be formulated as an image-to-image translation problem [21] and thus off-the-shelf computer vision methods can be applied. As rasterization is the idea behind rendering networks, e.g\onedot RenderNet [22], it could be extended to an end-to-end solution.
To this end, we endeavor to predict DTM in a unified deep learning framework by concurrently tackle both the elemental problems, ground filtering and elevation interpolation. The proposed baseline employs an off-the-shelf architecture and generative adversarial network (GAN) [23] to predict DTM from point-cloud-based multi-channel rasters. The experimental results show that simple employment of computer vision techniques approaches well-established methods specifically designed for DTM extraction. Extensive analyses are performed to identify the shortcomings and potentials of our data-driven approach for DTM extraction.
The main contributions of this paper are thus as follows:
-
•
the first large-scale dataset combining ALS point cloud and bare-earth elevation (DTM), covering 52 km2 with several well-established methods for benchmarking;
-
•
the first attempt, to the best of our knowledge, to formulate the DTM extraction problem in a unified deep learning framework that could potentially be developed into an end-to-end solution;
-
•
a comparative study of different rasterization strategies for DTM extraction from ALS point clouds.
II Related Work
II-A DTM extraction
DTM extraction is a long-standing problem in geospatial processing. It reconstructs from remote sensing data the bare-earth surface underlying objects, or land covers, both natural (trees, water, etc\onedot) and artificial (buildings, construction, etc\onedot). The typical process composes of 2 steps, ground filtering and surface interpolation [8, 10]. Ground filtering, or terrain extraction, identifies the ground portions from among other entities (water, trees, buildings, etc\onedot) and extracts them from the input geospatial data. The object-free ground portions then have their surface completed by interpolation methods such as regularized splines [18], elevation gridding [24], or using affine-kernel embeddings [8].
Due to high topographical variation and complex structures of terrain types (e.g\onedot flat, valley, hill, mountainous) and objects (e.g\onedot vegetation, construction) in geospatial data, efforts have been focused on exploring ground filtering. One strategy is to rely on terrain elevation and slope to establish rules that separate objects from ground [9, 6, 25, 26], under the assumption of gradual relief and small land covers with respect to land scales. Classification is performed by thresholding over pre-defined values either by chosen manually or from local adaptive filtering based on terrain slope [25].
Another approach is to approximate the terrain surface and identify objects using neighboring information. The progressive morphological filter (PMF) [27] uses sliding windows of increasing size to filter the points with elevation difference. Similarly, the simple morphological filter (SMRF) [28] filters the points with linearly increasing windows and slope thresholding. Such methods still rely on thresholds selection for the size of windows and the elevation functions. One threshold-free alternative named skewness balancing method (SBM) [29] is based on unsupervised statistical analysis of point cloud skewness to filter ground points. The most recent cloth simulation filtering (CSF) [30] is based on cloth simulation to filter ground points by tuning the resolution of the virtual cloth, its rigidness, and gravity parameters. Despite being simple and computationally efficient, choosing optimal threshold remains the hindrance for this strategy.
To overcome window size sensitivity and reduce parameterization, Duan et al\onedot [8] exploit DSMs through a combination of rule-based classification and multiscale morphological analysis and define several different thresholds based on input DSM statistics. The parameters are said to be robust to various DSM types with arbitrary quality and not require tuning. Another DSM-based DTM extraction aims to preserve sharp terrain edges by using anisotropic filtering [31].
In recent years, the paradigm is shifted toward more of learning-based methods [6, 18, 14, 19]. Such methods find their emergence from the breakthroughs of deep networks [32, 33, 15, 16], which, inspired by human neural systems, model and learn parametric nonlinear functions defined by sequentially stacked layers (hence deep network) from massive amount of data. The convolutional neural network (CNN) has proven to be effective for various computer vision tasks, achieving state-of-the-art results from high-level tasks (e.g\onedot classification [15, 33] and segmentation [16]), to low-level (e.g\onedot optical flow [34] and surface normal estimation [35]).
Benefiting from the advancement of computer vision, several research studies have tried to apply deep learning techniques to DTM-related problems. [36, 6] extract DTMs from satellite imagery using fully convolutional network (FCN) [16] and residual network (ResNet) [37] architectures. Ground filtering has also received special attention: [18, 10] extract ground from ALS point clouds by first sampling into image patches before performing image-based classification, while [19] applies dynamic graph convolution techniques [38] and works directly on point clouds to benefit from the geometric structures.
On the other hand, [39, 40, 41] assume the availability of land cover classes, i.e. from ground filtering, and compare various image inpainting methods, among which are the GAN-based [42], in completing the DTMs. Generative adversarial networks (GAN) [23] employ adversarial losses, usually presented as a zero-sum game between 2 networks known as generators and discriminators in which one’s gain is the other’s loss, to improve quality of generated samples. The framework plays as the basis for a wide range of application such as image-to-image translation [21], image inpainting [42], or downstream tasks as DTM extraction from RGB images [40, 43]. Different from our approach, these methods either assume imagery inputs or only focus on a single step in DTM extraction. Our method may share similar traits to an inpainting method for GAN-based constructing DTMs, the main differences are the use of rasterization to accentuate various point cloud features and indirect use of semantic information to examine its benefit. To the best of our knowledge, there is hardly any deep learning-based method that attempts to extract DTM from ALS point clouds data directly. This could be due to the discrepancy between topologically unordered point cloud inputs and the well organized image-like DTMs, which is one of the targets this paper seeks to tackle.
II-B Datasets
Another explanation for the limited deep-learning-based DTM extraction from ALS point clouds is the current shortage of dedicated large-scale labelled datasets. Despite the effectiveness and popularity of deep learning techniques, large-scale datasets play a critical role in their success. Existing datasets with ALS point clouds include Filtertest111https://www.itc.nl/isprs/wgIII-3/filtertest, ISPRS2012 [44], DublinCity [11], LASDU [13], and DALES [12]. However, they are all designed for urban semantic segmentation tasks (with the exception of Filtertest which is small reference data for ground filtering), thus not equipped with DTM data (Table I).
ALS point cloud datasets for deep-learning-based ground filtering were used in [18, 19], yet the data are either not publicly released or limited to single scene types. The most recent OpenGF dataset [14], collected from open data sources, also targets land-level ground filtering only, and does not include elevation information. Other related work including [45, 46] which model large scale urban scenes from MVS Meshes.
In this work, we collect and introduce a large-scale dataset, coined DeepTerRa, including ALS point clouds (1,659M points, covering 52 km2) with semantics and reference DTM data. To assist ongoing research, part of the dataset is augmenting the DALES [12] dataset with elevation data, while the rest are from different regions. To the best of our knowledge, this is the currently first and largest dataset with ALS point clouds with corresponding DTM data, to encourage deep learning research in DTM extraction and remote sensing.
| Dataset | year | #points | coverage | DTM | semantics |
|---|---|---|---|---|---|
| Filtertest | 2003 | 2.3M | 1.1 km2 | 2 classes | |
| ISPRS2012 [44] | 2012 | 1.2M | 9 classes | ||
| DublinCity [11] | 2019 | 260M | 2 km2 | 13 classes | |
| LASDU [13] | 2020 | 3.1M | 1 km2 | 5 classes | |
| DALES [12] | 2020 | 505M | 10 km2 | 8 classes | |
| OpenGF [14] | 2021 | 542.1M | 47.7 km2 | 3 classes | |
| DALES (ours) | 2020 | 505M | 10 km2 | 8 classes | |
| NB (ours) | 2022 | 1153M | 42 km2 | 11 classes |
III DeepTerRa
In this section, we detail the deep-learning-based approach for extracting DTM from ALS point clouds. To bridge the topological gap between unordered point cloud inputs and image-like DTM targets, we employ and elevate the rasterization technique to extract information from point clouds. The rasters then serve as inputs to a CNN-based generator which is trained with an adversarial loss (discriminator) and outputs a DTM. The pipeline overview is shown in Figure 3.
III-A Rasterization
ALS mechanism allows capturing high scene details by projecting laser beams on a scene and recording the returning beams. Due to the penetration ability of laser, a single emitting beam may result in several returns, or echoes, especially in vegetation areas, by interacting with different objects along the height, such as foliage, leaves, branches, ground, etc\onedot. Each echo registers a point with spatial coordinates of the interacted surface, intensity , echo number , etc\onedot.
Rasterization arranges an unordered set of points recorded by ALS in a regular 2D grid, or raster. The raster size is determined by the spatial extension of the points on the ground plane (plane) and the size of each cell into which the points are quantized. Each grid cell, or raster pixel, defines a vertical column in the 3D space, which can be further quantized into cubic cells or voxels. In this paper, a fixed size of 25cm cubed voxels are used.
Depending on the spatial resolution and scene structures, each pixel or voxel may contain zero, one, or several points. Different rasterization strategies apply different methods to make use of the multiple-point information. We propose to derive several rasters to extract most of the information contained in the ALS data (Fig. 2). In particular, 2 levels of rasterization are considered, namely voxel level, treating all points in a cubic cell at a time, and pixel level, the whole vertical column altogether.
Depending on information being rasterized, the resulted rasters can be categorized into 2 groups, elevation and statistic rasters.
Elevation rasters The vertical coordinate of the points are rasterized. Three strategies are proposed, namely (1) pixel-mean which registers the mean of all points in a vertical column, (2) voxel-top storing the mean of the upper points, and (3) voxel-bottom for the lower points. As such, the elevation rasters contain particularly the elevation information of a point cloud, which can be used to infer DTM. In fact, the voxel-top rasters are also known as DSMs.
Statistic rasters The statistic rasters do not specify elevation but the statistics of the scene structures hinting the object types and elevation. In this paper, we propose 3 raster types, all at pixel-level: (1) the density raster provides the number of points at each pixel, which is useful to assess pixel-wise reliability when processing other rasters; (2) the standard deviation (stdev) raster describes the variation of the voxels’ mean elevation in each column; (3) the echoes raster gives the mode of the echo numbers or the most frequent echo number in a column, showing how laser beams interact with the objects encountered at each location. As such, the raster signifies the object types. e.g\onedothigh numbers, or multiple echoes, usually indicate the presence of vegetation.
As such, each raster is a single-channel image-like object representing different aspects and spatial information of the point cloud at each pixel. Hence, different from typical usage of DSM or RGB images for DTM extraction, we do not limit the usage to just 1 type of rasters at a time. To make the best use of various information, the generated rasters are concatenated along the depth channel before being fed to the network. Analyses on the rasters’ contributions are presented in Sec. V.
III-B GAN-based DTM generation
The DTM generation is formulated as an image-to-image translation problem [21]. The pairs of generated rasters and corresponding reference DTMs are used to train a generative adversarial network (GAN). As the paper does not contribute to the GAN architecture but rather on the usage of rasterization for DTM extraction, we briefly describe the architecture and refer interested readers to the original work for more details.
The network includes a generator which tries to produce, from the input rasters , a DTM as close as possible to the reference one , and a discriminator , which is trained to distinguish a generated DTM from the real one . The detailed architecture of each network is shown in Figure 3.
The generator is taken after the off-the-shelf U-Net architecture [47], typically for pixel-to-pixel problems. The input rasters are fed through series of several convolutional layers and non-linearity which reduce the spatial dimensions to learn the raster features before upsampling to the same dimensions (see Fig 3). The generator outputs an estimated DTM of the same width and height as the input rasters.
The output DTMs are compared to the reference DTMs using a L1-loss given by
| (1) |
Euclidean losses such as L1 or L2 are well known for only being able to capture low-frequency information and producing blurry images [48, 21]. On the other hand, the pixel-wise comparison does not guarantee similar statistics of the generated image to the ground truth, hence might distorts the ground surfaces. Thus an adversarial loss is proposed.
The discriminator comprises a simple architecture adapted from [49] with conditional GAN idea from [21] and patchGAN from [50] which has proven to better capture local statistics. In a conditional GAN, the discriminator receives a DTM, generated or ground truth, together with the input rasters and learns to identify the fake from the real DTMs. The extra rasters input allow the discriminator to condition the output based on each particular input and hence improves its judging ability. The patchGAN loss penalizes the discriminator output at the scales of image patches, thus enforcing local statistical correctness. The adversarial loss is computed from the discriminator output as follows
| (2) |
The final loss is
| (3) |
where and are particular weights for each loss, and respectively set to 100 and 1 in [21]. The optimization is alternated between and .
IV Dataset
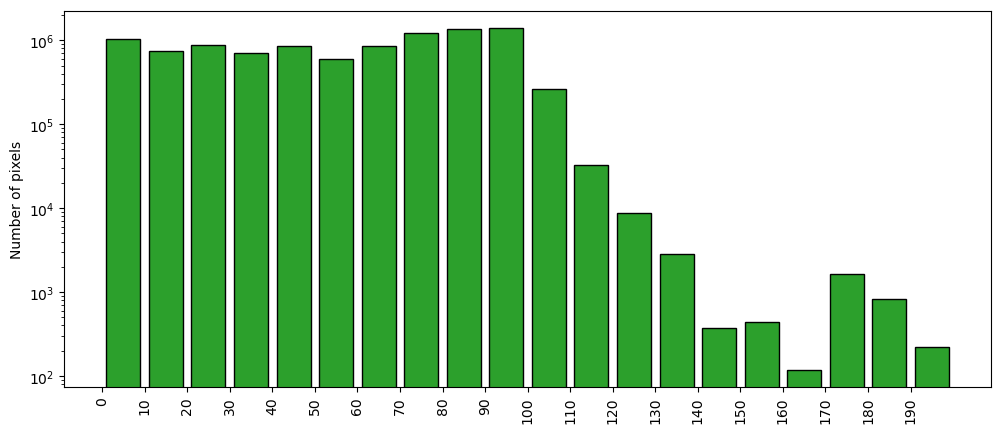
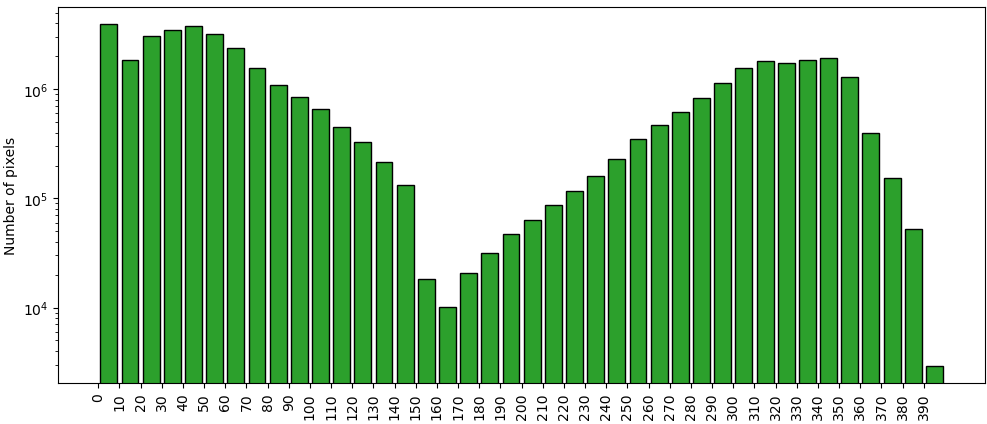
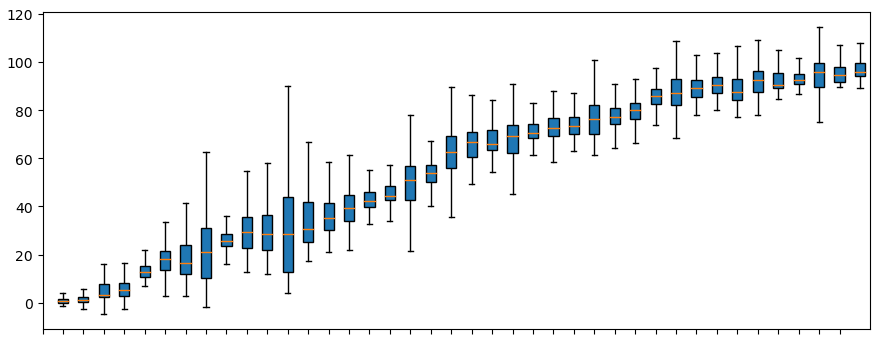
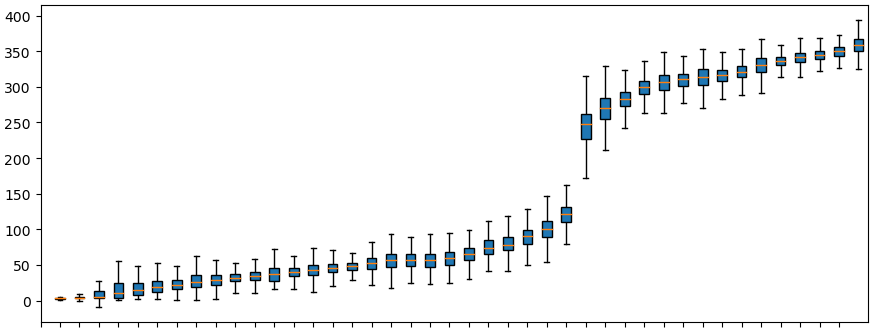
To accommodate CNN training for DTM generation on ALS point clouds, we collect from open sources a large-scale dataset of ALS point clouds with reference DTM correspondences. The dataset contains 2 subsets, DALES and New Brunswick. Table II provides an overview of the data while general and per-tile elevation statistics of each subset are shown in Figure 6 and Figure 7, respectively.
DALES. The Dayton Annotated LiDAR Earth Scan (DALES) dataset was presented to assist on-going research for ALS point clouds [12]. Here we augment it with reference DTM data, collected from the original data source of the City of Surrey222 https://data.surrey.ca/dataset/elevation-grid-2018, Open Government License, City of Surrey .
NB. The second subset is collected from the New Brunswick (NB) region, open data collection, which includes LiDAR333 http://geonb.snb.ca/li/, Open Government License, New Brunswick and corresponding DTM444 http://geonb.snb.ca/nbdem/, Open Government License, New Brunswick, . To vary the elevation, we sample the data tiles around the Saint John regions (urban and rural areas), and the Fundy National Park (forested and mountainous area).
| coverage | #points | tile size | DTM res. | density | semantics | |
|---|---|---|---|---|---|---|
| DALES | 10 km2 | 505M | m | cm | 50.5 ppm2 | |
| NB | 42 km2 | 1153M | km | m | 27.4 ppm2 |
The ALS point clouds are produced using the latest boresight values from the acquiring sensors (Terrascan for DALES) with preliminary quality assurance steps taken to ensure data integrity. Classification is carried out by combination of automatic and manual processes followed by manual and visual QC pass inspection. Several iterations are performed for fine-tuning and separating particular classes. The final bare earth DTMs are produced by creating triangular irregular networks (TIN) on the ground and keypoint classes.
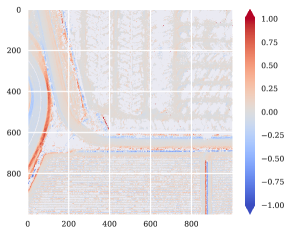
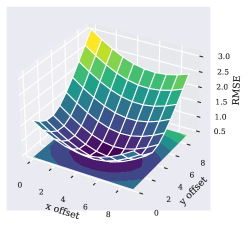
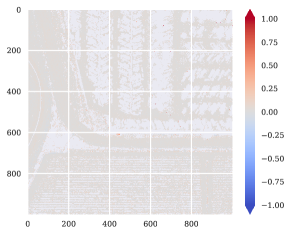
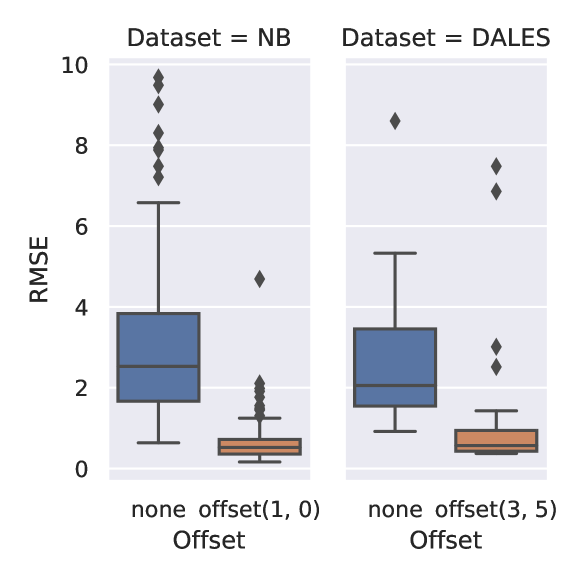
A quality-control step is performed to enforce the alignment between the point cloud rasters and provided DTMs in each subset. Due to possible numerical instability or different rasterizing coordinations, there are small offsets between a point cloud raster and its corresponding DTM. To quantify, the root-mean-square error (RMSE) is computed between a raster and provided DTM on the ground regions using ground truth semantics. Figure 4(a) showcases an example, while Figure 5 (blue boxes) shows the distribution of each subset (median values of 2.13 for NB and 2.53 for DALES). To correct the misalignment, a brute-force grid search is proposed. We search for both vertical and horizontal correction in the integer range of and pick the pairs that minimize the errors.
V Experiments
V-A Setup
For analysis purposes, unless stated otherwise, the validation split of each subset is used. Each experiment is performed three times and the average of the best results are reported. The root-mean-square error (RMSE, in meters) is used for evaluation: lower is better. For reporting on the test splits, the single best iteration (among the 3 runs) from the validation split is used to show generalizability and avoid overfitting.
The network is trained, validated, and tested separately on the DALES and New Brunswick (NB) datasets. As shown in Table II, to mitigate the coverage difference of DALES and NB, the original NB point clouds are split into 4 quarters, of which 2 are chosen randomly for training, 1 for validation, and 1 for testing, resulting in 84, 42, 42 input tiles of 500m squared. The DALES subset contains 29 500-m tiles for training and 11 for testing, provided by the authors [12]. The voxel size for both sets is set to 25-cm cubed, resulting in 2000-pixel rasters which are downsampled 1:4 before inputting to the network.
In all the experiments, unless stated otherwise, the hyper-parameters are set following the default set up from [21], i.e\onedot, Adam optimizer with momentum parameters and learning rate of . The optimization is alternated between and . The networks are trained on a cluster node with 8-core Intel Xeon E5-2620 @ 2.10 GHz, 64GB RAM, and RTX-2080 Ti / 11 GB VRAM.
V-B Elevation rasters as DTM
The pixel-mean, voxel-top, and voxel-bottom rasters particularly provide elevation information, hence can be used directly as prediction for DTMs. Knowing their performance gives more insight into the rasterization strategies and the network processing them. In this experiment, we show their performance on both validation and test splits. The results are given in Table III.
| DALES | NB | |||
|---|---|---|---|---|
| val | test | val | test | |
| pixel-mean | 4.40 | 4.90 | 4.92 | 4.75 |
| voxel-top | 5.80 | 6.31 | 7.00 | 6.76 |
| voxel-bottom | 3.16 | 3.68 | 2.03 | 2.01 |
| - | +density | +echoes | +stdev | +3stat | ||
| DALES | ||||||
| pixel-mean | 1.75 | 1.60 | 1.54 | 1.42 | 1.24 | |
| voxel-top | 1.64 | 1.61 | 1.62 | 1.54 | 1.12 | |
| voxel-bottom | 1.72 | 1.60 | 1.56 | 1.63 | 1.27 | |
| 3elev | 1.39 | 1.31 | 1.27 | 1.45 | 1.23 | |
| NB | ||||||
| pixel-mean | 2.30 | 2.43 | 2.01 | 1.83 | 1.46 | |
| voxel-top | 2.70 | 2.82 | 2.18 | 1.85 | 1.29 | |
| voxel-bottom | 1.97 | 1.81 | 1.55 | 1.85 | 1.22 | |
| 3elev | 2.13 | 2.20 | 1.86 | 2.06 | 1.71 | |
| - | +sem1 | +sem2 | +3stat | ||||
| - | +sem1 | +sem2 | |||||
| DALES | |||||||
| voxel-top | 1.64 | 1.59 | 1.20 | 1.12 | 1.06 | 0.88 | |
| voxel-bottom | 1.72 | 1.17 | 0.88 | 1.27 | 0.97 | 0.91 | |
| NB | |||||||
| voxel-top | 2.70 | 2.03 | 2.02 | 1.29 | 1.25 | 1.22 | |
| voxel-bottom | 1.97 | 1.76 | 1.19 | 1.22 | 1.19 | 1.06 | |
| DALES | NB | ||
|---|---|---|---|
| Rule-based | |||
| PMF [27] | 4.27 | 0.81 | |
| SBM [29] | 3.59 | 4.15 | |
| SMRF [28] | 4.08 | 0.75 | |
| CSF [30] | 1.19 | 0.88 | |
| Deep-learning-based | |||
| Elevation rasters | 1.98 | 2.05 | |
| Elevation+3stat | 1.27 | 1.31 | |
| Elevation+3stat+sem2 | 0.82 | 0.98 | |
From the definitions, it is trivial that voxel-bottom rasters are the closest to DTMs, while voxel-top produces the highest errors, and pixel-mean stays in between. The rasters errors also provide insights of the object types and heights in each set, hinting the object semantics. As laser beams can penetrate well in vegetation areas but are blocked by solid objects, e.g\onedotbuildings, voxel-bottom errors depict the presence of buildings and large constructions. The results show that there are more and/or higher buildings in the DALES subset than in NB. On the other hand, voxel-top rasters pick the highest object points, thus show that NB might comprise more, and/or higher, trees. They agree with the fact that the DALES subset is focused on urban areas and NB contains more forested regions. Such information may be used to quantitatively identify scene category without the availability of semantic labels.
V-C Combination of rasters
In this experiment, the elevation rasters (pixel-mean, voxel-top, and voxel-bottom) are employed for DTM extraction. Several strategies are possible including (1) using each elevation raster individually, (2) in combination, together with (3) one or (4) all statistic rasters (density, stdev, and echoes). The results for different combination strategies are shown in Table IV.
In general, adding all 3 statistics rasters improves the network performance by a large margin. Hence this could be the go-to solution. Regarding the elevation rasters to be used, the current results show the dependency to the type of scenes: as NB contains a dominantly large number of vegetation (mountainous and forested regions), the voxel-bottom rasters provide a close representation to DTMs while it is closer to voxel-top rasters for large constructions in urban areas from the DALES subset. Thus, the combination of all 3 elevation rasters dominates in DALES while voxel-bottom dominates in NB. The performance gap is diminished when adding statistics information. For later experiments, only voxel-top and voxel-bottom are used with statistics rasters.
V-D Loss coefficients
In this experiment, we show how the losses contribute to the network performance. We vary the GAN loss coefficient with respect to 2 values of the L1 loss coefficient . As shown in Table VII, although the 2 coefficients are not completely linearly correlated, the network performs poorly when there is no GAN loss contribution , showing its necessity.
| 0 | 2.98 |
|---|---|
| 0.01 | 2.68 |
| 0.1 | 2.57 |
| 1 | 1.72 |
| 10 | 1.93 |
| 100 | 2.48 |
V-E Semantics
DTM extraction methods generally rely on ground filtering labels. In this experiment, we explore the effects of semantic information to the pipeline. To maintain consistency with the previous setups, we concatenate semantic maps to the rasters as extra channels and leave the exhaustive study of efficient usage of semantics for future work. This is a less direct use of semantic information compared to the more popular way in which objects’ regions are removed and inpainted [39, 40, 41]. The semantic maps are generated by rasterizing the mode of point labels in each vertical column, i.e\onedoteach pixel receives the most frequent label in the vertical column.
The label raster is then binarized as ground/non-ground and converted to one-hot vector format. Although a single-channel binary image (sem1) is, in principle, sufficient for describing binary classes, we also include the complementary channel, making 2-channel semantic maps (sem2), for the sake of comparison The results are shown in Table V.
Adding semantic labels, in general, improves the network performance. Surprisingly, despite the redundant information, using 2-channel complementary binary labels (+sem2) show better performance than when using 1-channel labels, hinting how semantic maps should be handled for DTM extraction. This could be explained that the complementary information might not be trivial to be derived with the current network capacity and show potential improvement when soft-labeling vectors are used, i.e\onedotwhen classes are represented by floating point probabilities instead of binary numbers.
V-F Comparison with state-of-the-art
To evaluate the data-driven approach, we compare and show the test results of our best-validated iteration and those of the well-established ground-filtering methods designed for DTM extraction. Specifically, four baselines are used with default parameters, including PMF [27] (1m cell, exponential window of maximum 33m, distance of 15cm-250cm, and slope of 45°), SMRF [28] (1m cell, max window of 18m, elevation scalar of 1.25m, threshold of 0.5m, and 15% slope tolerance), SBM [29], and CSF [27] (cloth resolution of 0.5m, rigidness of 3, time step of 0.65, 500 iterations, and slope smoothing post-processing). The implementations of PMF, SMRF and SBM are from the Point Data Abstraction Library (PDAL)555https://pdal.io/ while CSF is provided by the original authors666https://github.com/jianboqi/CSF. A triangular irregular network (TIN) is computed using Delaunay triangulation on the extracted ground points before being rasterized to DTMs. The results of rule-based methods provided in Table VI are also meant for benchmarking our dataset.
As a parameter-free method, SBM relies on strong assumptions of flat ground and sacrifices its performance. PMF, SMRF, and CSF perform similarly well on the NB subset with scattered small houses and forested regions. While PMF and SMRF suffer for large buildings and constructions on the DALES subset, CSF shows more robust results even with fixed default parameters.
For comparison with deep-learning-based methods, we use the best iteration on validation set from previous experiments. The deep-learning-based methods show more stable similar results on both DALES and NB subset. Due to independence from fixed parameters, deep-learning-based methods rely only on training set variations, thus can, in principle, be improved when more data are collected.
The image-to-image approach, however, is limited due to the loss of point cloud geometry of which the rule-based methods are designed to take advantage. Yet as more information is provided by the statistical rasters, the agnostic off-the-shelf network’s performance approaches that of the best rule-based designed directly for ground-filtering.
Qualitative results in Figure 8 show that a network with inputs of elevation and statistical rasters is more robust to large objects. Most of the houses and large buildings that left untouched by the rule-based methods on the first 2 rows are removed by the network. As the rule-based methods depend greatly of fixed parameters, they might be effective with objects of certain sizes (small objects on the third row), but failed in other cases: it is well-known that the parameters need to be carefully tuned for separate cases, showing needs for a deep-learning-based and end-to-end solution.
VI Conclusion
This paper attempts to unify the DTM extraction process from ALS point clouds using a deep-learning-based method. By formulating the problem as an image-to-image translation and using rasterization techniques, off-the-shelf computer-vision-designed architectures can be used to tackle this important remote sensing task. To stimulate data-driven approaches on this problem, a large-scale dataset of ALS point clouds and reference DTMs is also introduced and evaluated.
The proposed method, despite being domain-agnostic, shows comparable results to task-dedicated methods and performs on par with state-of-the-art baselines. Experiments show that the various point-cloud-specific qualities can be gathered by simple rasterization techniques, which have proven to be helpful for predicting bare-ground elevation.
Among all types of information to be rasterized, semantic play an important role in extracting DTM due to its ability in identifying objects. Although in the paper, only one-hot vectors ground truth labels are used, the same idea could be applied to softmax-smooth predicted labels. Other effective ways of exploiting semantic information for DTM extract are encouraged for future research.
Effective may it be, rasterization nonetheless squashes geometry-rich 3D point clouds into 2D representations, hence can only depict a certain aspects of a point cloud. As such, this aggressive operation, together with the 2D image-to-image translation approach, does not fully exploit the potential of 3D data. The sub-metric performance gap with other ground filters which rely on point cloud geometry show the room for development of deep-learning-based method for DTM extraction in future research.
Acknowledgment
This work was supported by the ANR SixP project under the reference ANR-19-CE02-0013.
References
- [1] K. Bakuła, “Reduction of DTM obtained from LiDAR data for flood modeling,” Archives of Photogrammetry, vol. 22, pp. 51–61, 2011.
- [2] N. A. Muhadi, A. F. Abdullah, S. K. Bejo, M. R. Mahadi, and A. Mijic, “The Use of LiDAR-Derived DEM in Flood Applications: A Review,” Remote Sensing, vol. 12, no. 14, 2020.
- [3] M. Muthusamy, M. Rivas Casado, D. Butler, and P. Leinster, “Understanding the effects of Digital Elevation Model resolution in urban fluvial flood modelling,” Journal of Hydrology, p. 126088, 2021.
- [4] V. González-Jaramillo, A. Fries, and J. Bendix, “AGB Estimation in a Tropical Mountain Forest (TMF) by Means of RGB and Multispectral Images Using an Unmanned Aerial Vehicle (UAV),” Remote Sensing, vol. 11, no. 12, 2019.
- [5] Z. Xu, Z. Shen, Y. Li, L. Xia, H. Wang, S. Li, S. Jiao, and Y. Lei, “Road Extraction in Mountainous Regions from High-Resolution Images Based on DSDNet and Terrain Optimization,” Remote Sensing, vol. 13, no. 1, 2021.
- [6] C. M. Gevaert, C. Persello, F. Nex, and G. Vosselman, “A deep learning approach to DTM extraction from imagery using rule-based training labels,” ISPRS Journal of Photogrammetry and Remote Sensing, vol. 142, pp. 106–123, 2018.
- [7] C. A. Rokhmana and A. R. Sastra, “DTM generation from aerial photo and Worldview-3 images by using different DSM filtering methods,” in Sixth Geoinformation Science Symposium, vol. 11311. SPIE, 2019, pp. 152–158.
- [8] L. Duan, M. Desbrun, A. Giraud, F. Trastour, and L. Laurore, “Large-Scale DTM Generation From Satellite Data,” in Proceedings of the IEEE/CVF Conference on Computer Vision and Pattern Recognition Workshop (CVPRw), 2019.
- [9] M. Debella-Gilo, “Bare-earth extraction and DTM generation from photogrammetric point clouds including the use of an existing lower-resolution DTM,” International Journal of Remote Sensing (IJRS), vol. 37, no. 13, pp. 3104–3124, 2016.
- [10] W. Ye, “Extraction of Digital Terrain Models from Airborne Laser Scanning Data based on Transfer-Learning,” Master’s thesis, University of Waterloo, 2019.
- [11] I. Zolanvari, S. Ruano, A. Rana, A. Cummins, R. E. da Silva, M. Rahbar, and A. Smolic, “DublinCity: Annotated LiDAR Point Cloud and its Applications,” in Proceedings of the British Machine Vision Conference (BMVC), 2019.
- [12] N. Varney, V. K. Asari, and Q. Graehling, “DALES: A Large-scale Aerial LiDAR Data Set for Semantic Segmentation,” in Proceedings of the IEEE/CVF Conference on Computer Vision and Pattern Recognition Workshop (CVPRw), 2020, pp. 186–187.
- [13] Z. Ye, Y. Xu, R. Huang, X. Tong, X. Li, X. Liu, K. Luan, L. Hoegner, and U. Stilla, “LASDU: A Large-scale Aerial LiDAR Dataset for Semantic Labeling in Dense Urban Areas,” ISPRS International Journal of Geo-Information, vol. 9, no. 7, 2020.
- [14] N. Qin, W. Tan, L. Ma, D. Zhang, and J. Li, “Opengf: An ultra-large-scale ground filtering dataset built upon open ALS point clouds around the world,” Proceedings of the IEEE/CVF Conference on Computer Vision and Pattern Recognition Workshops, 2021.
- [15] A. Krizhevsky, I. Sutskever, and G. E. Hinton, “ImageNet Classification with Deep Convolutional Neural Networks,” in Proceedings of the Conference on Neural Information Processing Systems (NeurIPS), USA, 2012, pp. 1097–1105.
- [16] J. Long, E. Shelhamer, and T. Darrell, “Fully convolutional networks for semantic segmentation,” in Proceedings of the IEEE/CVF Conference on Computer Vision and Pattern Recognition (CVPR), 2015, pp. 3431–3440.
- [17] R. Girshick, J. Donahue, T. Darrell, and J. Malik, “Rich feature hierarchies for accurate object detection and semantic segmentation,” in Proceedings of the IEEE/CVF Conference on Computer Vision and Pattern Recognition (CVPR), 2014, pp. 580–587.
- [18] X. Hu and Y. Yuan, “Deep-Learning-Based Classification for DTM Extraction from ALS Point Cloud,” Remote Sensing, vol. 8, no. 9, 2016.
- [19] J. Zhang, X. Hu, H. Dai, and S. Qu, “DEM Extraction from ALS Point Clouds in Forest Areas via Graph Convolution Network,” Remote Sensing, vol. 12, no. 1, 2020.
- [20] F. Guiotte, M. Pham, R. Dambreville, T. Corpetti, and S. Lefèvre, “Semantic segmentation of lidar points clouds: Rasterization beyond digital elevation models,” IEEE Geoscience Remote Sensing Letters, vol. 17, no. 11, pp. 2016–2019, 2020.
- [21] P. Isola, J.-Y. Zhu, T. Zhou, and A. A. Efros, “Image-to-Image Translation with Conditional Adversarial Networks,” in Proceedings of the IEEE/CVF Conference on Computer Vision and Pattern Recognition (CVPR), 2017, pp. 5967–5976.
- [22] T. Nguyen-Phuoc, C. Li, S. Balaban, and Y.-L. Yang, “RenderNet: A deep convolutional network for differentiable rendering from 3D shapes,” in Proceedings of the Conference on Neural Information Processing Systems (NeurIPS), 2018.
- [23] I. Goodfellow, J. Pouget-Abadie, M. Mirza, B. Xu, D. Warde-Farley, S. Ozair, A. Courville, and Y. Bengio, “Generative Adversarial Nets,” in Proceedings of the Conference on Neural Information Processing Systems (NeurIPS), 2014, pp. 2672–2680.
- [24] M. F. Hutchinson, T. Xu, and J. A. Stein, “Recent Progress in the ANUDEM Elevation Gridding Procedure,” in Geomorphometry 2011, 2011, pp. 19–22.
- [25] G. Sithole, “Filtering of Laser Altimetry Data using a Slope Adaptive Filter,” International Archives of Photogrammetry and Remote Sensing, vol. 34, no. 3, 2001.
- [26] G. Sithole and G. Vosselman, “Experimental comparison of filter algorithms for bare-Earth extraction from airborne laser scanning point clouds,” ISPRS Journal of Photogrammetry and Remote Sensing, vol. 59, no. 1, pp. 85–101, 2004.
- [27] K. Zhang, S.-C. Chen, D. Whitman, M.-L. Shyu, J. Yan, and C. Zhang, “A progressive morphological filter for removing nonground measurements from airborne LIDAR data,” IEEE Transactions on Geoscience and Remote Sensing, vol. 41, no. 4, pp. 872–882, 2003.
- [28] T. J. Pingel, K. C. Clarke, and W. A. McBride, “An improved simple morphological filter for the terrain classification of airborne LIDAR data,” ISPRS Journal of Photogrammetry and Remote Sensing, vol. 77, pp. 21–30, 2013.
- [29] M. Bartels and H. Wei, “Threshold-free object and ground point separation in LIDAR data,” Pattern Recognition Letters, vol. 31, no. 10, pp. 1089–1099, 2010.
- [30] W. Zhang, J. Qi, P. Wan, H. Wang, D. Xie, X. Wang, and G. Yan, “An Easy-to-Use Airborne LiDAR Data Filtering Method Based on Cloth Simulation,” Remote Sensing, vol. 8, no. 6, 2016.
- [31] A. Pijl, J.-S. Bailly, D. Feurer, M. A. El Maaoui, M. R. Boussema, and P. Tarolli, “TERRA: Terrain Extraction from elevation Rasters through Repetitive Anisotropic filtering,” International Journal of Applied Earth Observation and Geoinformation, vol. 84, p. 101977, 2020.
- [32] J. Deng, W. Dong, R. Socher, L.-J. Li, K. Li, and L. Fei-Fei, “ImageNet: A Large-Scale Hierarchical Image Database,” in Proceedings of the IEEE/CVF Conference on Computer Vision and Pattern Recognition (CVPR), 2009.
- [33] K. He, X. Zhang, S. Ren, and J. Sun, “Delving Deep into Rectifiers: Surpassing Human-Level Performance on ImageNet Classification,” in Proceedings of the IEEE/CVF International Conference on Computer Vision (ICCV), 2015.
- [34] D. Sun, X. Yang, M.-Y. Liu, J. Kautz, and J. K. Nvidia, “PWC-Net: CNNs for Optical Flow Using Pyramid, Warping, and Cost Volume,” in Proceedings of the IEEE/CVF Conference on Computer Vision and Pattern Recognition (CVPR), 2018.
- [35] H.-A. Le, A. S. Baslamisli, T. Mensink, and T. Gevers, “Three for one and one for three: Flow, Segmentation, and Surface Normals,” in Proceedings of the British Machine Vision Conference (BMVC), 2018.
- [36] G. Tapper, “Extraction of DTM from Satellite Images Using Neural Networks,” Master’s thesis, Linköping University, Computer Vision, 2016.
- [37] K. He, X. Zhang, S. Ren, and J. Sun, “Deep Residual Learning for Image Recognition,” in Proceedings of the IEEE/CVF Conference on Computer Vision and Pattern Recognition (CVPR), 2016, pp. 770–778.
- [38] Y. Wang, Y. Sun, Z. Liu, S. E. Sarma, M. M. Bronstein, and J. M. Solomon, “Dynamic Graph CNN for Learning on Point Clouds,” ACM Transactions on Graphics (TOG), vol. 38, no. 5, oct 2019.
- [39] B. Ayhan, C. Kwan, J. Larkin, L. Kwan, D. Skarlatos, and M. Vlachos, “Performance comparison of different inpainting algorithms for accurate DTM generation,” in Geospatial Informatics X, vol. 11398. SPIE, 2020, pp. 144–159.
- [40] C. Kwan, D. Gribben, B. Ayhan, and J. Larkin, “Practical Digital Terrain Model Extraction Using Image Inpainting Techniques,” in Recent Advances in Image Restoration with Applications to Real World Problems, C. Kwan, Ed. Rijeka: IntechOpen, 2020, ch. 8.
- [41] S. Crema, M. Llena, A. Calsamiglia, J. Estrany, L. Marchi, D. Vericat, and M. Cavalli, “Can inpainting improve digital terrain analysis? comparing techniques for void filling, surface reconstruction and geomorphometric analyses,” Earth Surface Processes and Landforms, vol. 45, no. 3, pp. 736–755, Mar. 2020.
- [42] J. Yu, Z. Lin, J. Yang, X. Shen, X. Lu, and T. S. Huang, “Generative image inpainting with contextual attention,” in Proceedings of the IEEE Conference on Computer Vision and Pattern Recognition (CVPR), June 2018.
- [43] E. Panagiotou, G. Chochlakis, L. Grammatikopoulos, and E. Charou, “Generating elevation surface from a single RGB remotely sensed image using deep learning,” Remote Sensing, vol. 12, no. 12, p. 2002, Jun. 2020.
- [44] F. Rottensteiner, G. Sohn, J. Jung, M. Gerke, C. Bailard, S. Benitez, and U. Breitkopf, “The ISPRS benchmark on urban object classification and 3D building reconstruction,” in ISPRS Annals of the Photogrammetry, Remote Sensing and Spatial Information Sciences, 2012, pp. 293–298.
- [45] L. Zhu, S. Shen, X. Gao, and Z. Hu, “Large scale urban scene modeling from mvs meshes,” in Proceedings of the European Conference on Computer Vision (ECCV), September 2018.
- [46] J. Han, L. Zhu, X. Gao, Z. Hu, L. Zhou, H. Liu, and S. Shen, “Urban scene lod vectorized modeling from photogrammetry meshes,” IEEE Transactions on Image Processing, vol. 30, pp. 7458–7471, 2021.
- [47] O. Ronneberger, P. Fischer, and T. Brox, “U-Net: Convolutional Networks for Biomedical Image Segmentation,” in Medical Image Computing and Computer-Assisted Intervention (MICCAI), Cham, 2015, pp. 234–241.
- [48] A. B. L. Larsen, S. K. Sønderby, H. Larochelle, and O. Winther, “Autoencoding beyond pixels using a learned similarity metric,” in Proceedings of the 33rd International Conference on International Conference on Machine Learning - Volume 48, ser. ICML’16. JMLR.org, 2016, p. 1558–1566.
- [49] A. Radford, L. Metz, and S. Chintala, “Unsupervised representation learning with deep convolutional generative adversarial networks,” in 4th International Conference on Learning Representations (ICLR), 2016.
- [50] C. Li and M. Wand, “Precomputed Real-Time Texture Synthesis with Markovian Generative Adversarial Networks,” in Proceedings of the European Conference on Computer Vision (ECCV), Cham, 2016, pp. 702–716.
![[Uncaptioned image]](/html/2206.03778/assets/Images/hale2.jpg) |
Hoàng-Ân Lê received the B.Sc. degree in computer science in 2012 from the University of Science, Vietnam National University, Ho Chi Minh city, Vietnam and received the M.Sc. degree in engineering in 2015 from the EURECOM institute, Télécom ParisTech, Paris, France. He received the Ph.D. degree in computer vision and machine learning in 2021 from the University of Amsterdam, Amsterdam, The Netherlands while working on the TrimBot2020 project within the EUHorizon2020 programme. Since then, he has been a postdoctoral researcher with the OBELIX team of IRISA Vannes at the University of South Brittany, Vannes, France. His research interests include computer vision and machine learning, with particular interests in multimodality-multitask learning, 3D understanding, and applications in earth observation and remote sensing. |
![[Uncaptioned image]](/html/2206.03778/assets/Images/fg.jpg) |
Florent Guiotte received the M.Eng. degree in computer science in 2016 from the University Rennes 1, France. He received the Ph.D. degree in computer science in 2021 from the University Rennes 2. He was a post-doctoral fellow at IRISA, OBELIX team in 2021. Since 2022, he works for L’Avion Jaune (lavionjaune.com), Montpellier, France. His research interests include computer vision and machine learning applied to remote sensing images and point clouds. |
![[Uncaptioned image]](/html/2206.03778/assets/Images/mtp.png) |
Minh-Tan Pham obtained his M. Eng and PhD degrees from Telecom Bretagne, France in 2013 and 2016. He was an intern at the Dpt. of Geomatics, Laval University, Canada in 2013 and at the French Space Agency (CNES), France in 2015. From 2016 to 2019, he was a post-doctoral fellow at IRISA laboratory. Since 2019, he is an Assistant Professor at Univ. Bretagne Sud, IUT de Vannes and a researcher at the IRISA, OBELIX team. His research interests include image processing and machine learning applied to remote sensing data with the current focus on mathematical morphology, hierarchical representation and self-supervised deep networks for feature extraction, object detection and classification tasks. |
![[Uncaptioned image]](/html/2206.03778/assets/Images/lefevre.jpg) |
Sébastien Lefèvre (M.Sc 1999, PhD 2002, Hab. 2009) is a Full Professor in Computer Science at Université Bretagne Sud since 2010. He is involved in numerous activities related to Artificial Intelligence for Earth and Environment Observation: founder of the OBELIX team (www.irisa.fr/obelix) within the Institute for Research in Computer Science and Random Systems (IRISA), chair of the GeoData Science track of the EMJMD Copernicus Master in Digital Earth (www.master-cde.eu), co-chair of the ECML-PKDD MACLEAN workshop series on Machine Learning for Earth Observation, etc. He is also an IEEE Senior Member and serves as an Associate Editor for IEEE TGRS. |
![[Uncaptioned image]](/html/2206.03778/assets/Images/corpetti.jpg) |
Thomas Corpetti received the Engineering degree in electrical engineering and the master’s degree in computer vision, in 1999, and the Ph.D. and Habilitation degrees in computer vision and applied mathematics with University Rennes I, France, in 2002 and 2011, respectively. He obtained a Permanent Researcher position at the French National Institute for Scientific Research (CNRS), in 2004, on the analysis of remote sensing image sequences for environmental applications. From 2009 to 2012, he was with LIAMA, a sino-french laboratory in computer sciences, automatics, and applied mathematics at Beijing, China. He is currently with the Observatory for Universe Sciences of Rennes (OSUR), France and Littoral, Environnement, Télédétection, Géomatique (LETG) UMR 6554 as the Director of research, CNRS. His main research interest includes the definition of computer vision tools for the analysis of remote sensing data (low and high resolution) for environmental applications. |