Combined modeling and experimental characterization of Mn segregation and spinodal decomposition along dislocation lines in Fe-Mn alloys
Abstract
In the current work, Mn enrichment at dislocations in Fe-Mn alloys due to segregation and spinodal decomposition along the dislocation line is studied via modeling and experimental characterization. To model these phenomena, both finite-deformation microscopic phase-field chemomechanics (MPFCM) and Monte Carlo molecular dynamics (MCMD) are employed. MPFCM calibration is carried out with the same Fe-Mn MEAM-based potential used in MCMD, as well as CALPHAD data. Simulation results for Mn segregation to, and spinodal decomposition along, straight screw and edge dislocations as well as dislocation loops, are compared with characterization results from atom probe tomography (APT) for two Fe-Mn alloy compositions. In contrast to classical Volterra (linear elastic) dislocation theory, both MPFCM and MCMD predict a non-zero hydrostatic stress field in screw cores. Being of much smaller magnitude than the hydrostatic stress in straight edge cores, much less solute segregates to screw than to edge cores. In addition, the segregated amount in screw cores is below the critical concentration of 0.157 for the onset of spinodal decomposition along the line. On the other hand, results from MPFCM-based modeling imply that the concentration dependence of the solute misfit distortion and resulting dependence of the elastic energy density on concentration have the strongest effect. The maximum amount of Mn segregating to straight edge dislocations predicted by MPFCM agrees well with APT results. On the other hand, the current MPFCM model for Fe-Mn predicts little or no variation in Mn concentration along a straight dislocation line, in contrast to the APT results. As shown by the example of a dislocation loop in the current work, a change in the hydrostatic stress along the line due to changing character of dislocation does lead to a corresponding variation in Mn concentration. Such a variation in Mn concentration can also then be expected along a dislocation line with kinks or jogs.
keywords:
solute segregation, spinodal decomposition, dislocations, phase-field chemomechanics, Monte Carlo molecular dynamics, atom probe tomography1 Introduction
The dependence of material properties on chemical composition, temperature and pressure (stress) is central to the phase relations, thermodynamics, and behavior, of many materials. In the case of engineering alloys, for example, the chemistry-dependence of elastic or magnetic material properties can have a profound influence on thermodynamics and heterogeneity. A classic example of this (also relevant to the current work) is the effect of lattice misfit on spinodal decomposition in such alloys as first discussed by Cahn [1, 2] and later by Khatchaturyan [3].
Even in the defect-free case, spatial variations in chemical composition for any reason result in heterogeneous material properties and behavior; the presence of defects further complicates this. Many experimental studies have documented the strong influence of defects on chemical heterogeneity in alloys. For example, in the case of FCC alloys (e.g., [4, 5, 6, 7, 8]), such defects include dislocations, stacking faults, and grain boundaries and phase interfaces. Their respective influence on solute segregation and chemical heterogeneity differs in general. This is also the case in BCC materials such as the Fe-Mn alloys (e.g., [9, 10, 11]). Here, differences in Mn segregation behavior to grain boundaries [12, 13] and to bulk dislocations [9, 14] have been experimentally observed and characterized, in particular with the help of atom probe tomography (APT). Such a dependence on defect type is related at least in part to the nature of the corresponding defect-solute interaction involved. In the case of grain boundaries or stacking faults, for example, this interaction is of short-range character; for dislocations on the other hand, it is clearly long-range in nature. Since the seminal work of Cottrell [15], it has been known that the interaction of the (long-range) dislocation stress field with solute misfit results in strong solute segregation to such defects. More specifically, as shown by this and later work in the case of solute transport, or by that of Cahn [1] and later work in the case of spinodal decomposition, the chemistry dependence of solute lattice misfit results in a dependence of the solute chemical potential on the elastic energy and hydrostatic stress field. In turn, this results in a dependence of both the driving force for solute transport and spinodal decomposition on these.
Building on this, more recent work has focused on further aspects and details of this type of chemoelastic coupling. For example, in [16], solute segregation and "wetting transition" at stationary and gliding dislocations has been modeled with the help of linear elastic phase-field microelasticity [PFM: 17] and the Cahn-Hilliard (CH) [18] model. They concluded that short-range chemical interaction among solute atoms lies behind a "wetting transition" at the core, depending in particular on temperature and solute concentration. Quite recently, [19] combined the linear elastic chemomechanical model of Cahn [1] with a dependence of the gradient chemical energy on solute concentration due to magnetic transitions to model defect-free spinodal decomposition in Fe-Cr.
The purpose of the current work is comparative modeling and experimental investigation of segregation to, and spinodal decomposition at, dislocations in BCC Fe-Mn. On the modeling side, both microscopic phase-field chemomechanics (MPFCM) and (hybrid) Monte Carlo molecular dynamics (MCMD) [20] are employed. The former represents an application of the phase-field-based methodology developed in [21] for the finite-deformation chemomechanics of multiphase, multicomponent solids to the case of microscopic dislocation-solute interaction. MPFCM has been applied to model such interaction and processes in other alloys as well (e.g., Ni-superalloys like Ni-Al-Co in [5]). As in the case of Fe-Cr mentioned above, the current application to Fe-Mn involves in particular a dependence of the gradient chemical energy on Mn concentration to account for magnetic transition in this system with increasing Mn content.
The work is organized as follows. In Section 2, the form of the MPFCM model relevant to Fe-Mn is briefly summarized. This is followed in Section 3 by identification / calibration of the MPFCM model with the help of an MEAM-based potential as well as Thermo-Calc / CALPHAD data for Fe-Mn. APT characterization results for Mn segregation to dislocations in two Fe-Mn alloys are presented in Section 4. After discussing simulation details in Section 5, the APT and simulation results from MPFCM and MCMD are compared and discussed in detail in Section 6. The work ends with a summary and discussion in Section 7.
2 Microscopic phase-field chemomechanics model for Fe-Mn
Restricting attention to quasi-static, isothermal (i.e., fixed absolute temperature ) conditions, an MPFCM model for Fe-Mn is based in particular on the chemomechanical balance relations
| (1) |
for Mn mass and alloy linear momentum, respectively. These determine the Mn concentration field and the alloy deformation field , respectively. In these relations, is the chemical potential of Mn relative to Fe per unit mass (SI units J kg-1), represents the first Piola-Kirchhoff (PK) stress tensor, and is the mobility of Mn (SI units kg m2 J-1s-1).
Besides the field relations (1), the current model is determined by the form
| (2) |
for the free energy density consisting of (chemically) homogeneous
| (3) |
and chemically inhomogeneous parts. In turn, is determined by elastic and chemical contributions, with the alloy deformation gradient. As indicated by the notation, depends parametrically on and the disregistry field of a stationary dislocation. As discussed in more detail in what follows, is treated as a non-evolving (stationary dislocation) in the current work. The elastic contribution
| (4) |
to is modeled in harmonic form based on the elastic stiffness C and assuming that the lattice (Green) strain is "small", i.e., . The lattice local deformation is determined in the current model by a residual local deformation due to (i) misfit of Mn in the BCC Fe lattice , with the corresponding (infinitesimal) distortion per unit concentration, and (ii) lattice slip due to a single dislocation with Burgers vector , glide-plane normal , and glide-plane spacing . The homogeneous part of the chemical contribution to is determined directly using the ThermoCalc [22] database for Fe-Mn as explained in Section 3.2. In addition, the generalized CH form111Note that in [18] is based on energy per atom, whereas in (5) is based on energy density.
| (5) |
of for cubic symmetry is adopted. In contrast to the non-magnetic pair interaction case [18], higher-order interaction and magnetic effects result here in a composition-dependent [23, 19]. Lastly, the above constitutive forms for and determine in turn those
| (6) |
for the first PK stress and
| (7) |
for the CH chemical potential of Mn (). In this latter relation, is the mass density, and is the Kirchhoff stress. For more details on the current approach and methodology, the interested reader is referred to [21].
3 Model identification
The MPFCM model properties , , , , and are determined for Fe-Mn using the Version 9 database of Thermo-Calc Software TCFE Steels/Fe-alloys [24] and the modified embedded atom method (MEAM) potential for Fe-Mn from [25].
3.1 Misfit distortion and elastic stiffness
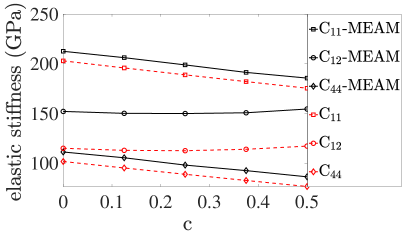
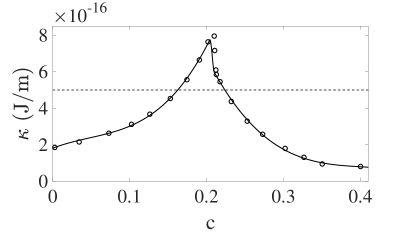
Determination of the local deformation due to Mn misfit is based on the corresponding distortion . Results for this and for the elastic stiffness are shown in Figure 1.
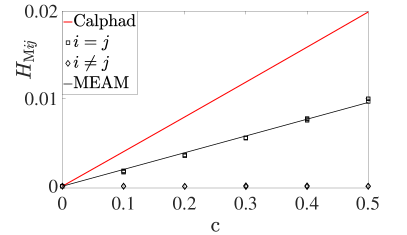
The MEAM results are based on MD simulations at 723 K. In these, Fe atoms are randomly replaced in the simulation cell with Mn atoms up to a given concentration. The cell is then relaxed to zero stress and the relevant change determined as a function of Mn concentration. As shown by the corresponding fit to the MEAM-based results, is well-approximated by
| (8) |
linear in and geometrically linear. This is also true for the fit to Fe-Mn molar volume data in the Thermo-Calc database of CALPHAD (Figure 1, left, red curve). The -dependence of the cubic components of shown in Figure 1 (right) is determined in a similar fashion as that for the components of just discussed.
3.2 Chemical free energy
The homogeneous part
| (9) |
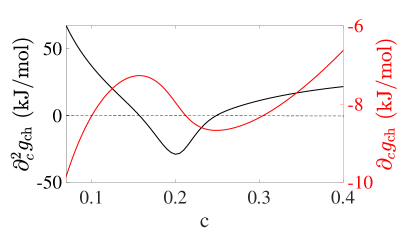
of the chemical free energy density in (3) is determined with the help of the molar volume and the corresponding molar Gibbs free energy from the Thermo-Calc database at room pressure and K. This latter energy and its concentration derivatives are shown in Figure 2.
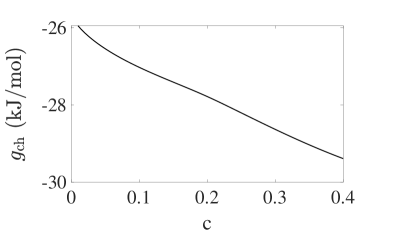
A piecewise-spline fit to 200 discrete data segments exported from Thermo-Calc is used to determine . In turn, this is used to determine using the constant value m3/mol for pure Fe at 723 K. The use of Thermo-Calc data ensures for example accurate spinodal points as well as correct account for magnetic effects at room pressure, not accounted for in the MEAM potential.
3.3 Gradient energy and mobility
Results for the gradient energy coefficient and the mobility as a function of at K are shown in Figure 3.
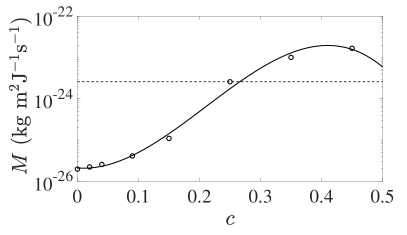
In particular, is obtained from Thermo-Calc mobility data [26] via polynomial fit. Following [23, 19], Thermo-Calc data for including magnetic contributions is fit to the piecewise continuous cubic polynomial
| (10) |
yielding , , and the values listed in Table 1.
| 1.8 | 1.65 | -1.46 | 1.02 | 7.74 | 8.41 |
| -1.63 | 1.66 | 5.97 | -7.61 | 3.83 | -6.63 |
3.4 Dislocation disregistry field
As explained in Section 2, the (fixed) dislocation disregistry field is treated as a material property in the current work and determined using the Fe-Mn MEAM potential. The case of a perfect edge dislocation in BCC Fe is shown in Figure 4.
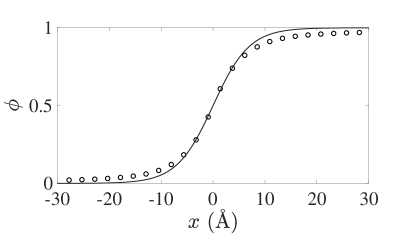
The results in Figure 4 determine . Using the MEAM potential, the dependence of on was studied and found to be minimal. This is assumed in the following for the -dependence as well. On this basis, all required material parameters have been identified for Fe-Mn in the current MPFCM model.
4 Characterization of Mn segregation via atom probe tomography
To investigate the effect of alloy composition on solute segregation to dislocations via atom probe tomography (APT), two Fe-Mn alloys (Fe7Mn and Fe9Mn) were prepared. The alloys were cast into rectangular billets in a vacuum induction furnace, homogenized at temperatures between 1100-1150 C, hot-rolled and quenched to room temperature, resulting in a martensitic microstructure. Both alloys were subsequently annealed at 723 K for 6 hours to facilitate Mn segregation to dislocations. The composition of the alloys is shown in Table 2.
| Mn | C | Si | Al | P | S | |
| Fe7Mn | 7.22 | 0.093 | 0.49 | 0.013 | 0.005 | 0.007 |
| Fe9Mn | 8.46 | 0.0075 | 0.0024 | 0.002 | 0.002 | 0.0047 |
Note that Fe7Mn contains close to 0.1wt.% C, which could strongly affect Mn segregation to dislocations. After 6 hours of annealing at 450 C, however, carbide precipitation [27] substantially depletes the amount of C in the matrix. For further details on these alloys, the reader is referred to [9, 10, 12, 28, 29, 14, 13].
For characterization via atom probe tomography (APT), specimens of these alloys with end radii below 100nm were prepared using a FEI Helios NanoLab600i dual-beam Focused Ion Beam (FIB) / Scanning Electron Microscopy (SEM) instrument. APT was performed using a Cameca Scientific Instruments (CIS) LEAP 5000 XS device. Data was obtained with this instrument (i) at approximately 80% detection efficiency, (ii) at a set-point temperature of 50 K (Fe7Mn) and 60 K (Fe9Mn), (iii) in laser-pulsing mode at 355 nm and a pulsing rate of 500 kHz, and (iv) at a pulse energy of 40 pJ (Fe7Mn) and 30 pJ (Fe9Mn). For (re)construction of 3D atom maps from the data, as well as the visualization and quantification of segregation, the CIS software IVAS was employed following the protocol introduced in [30] and detailed in [31]. The 3D atom maps were obtained by voltage-based reconstruction of the detected ions. Reconstructions were calibrated by the interplanar distance of the crystallographic planes associated with the low-hit density poles. Figure 5 displays resulting reconstructions for Fe7Mn and Fe9Mn.
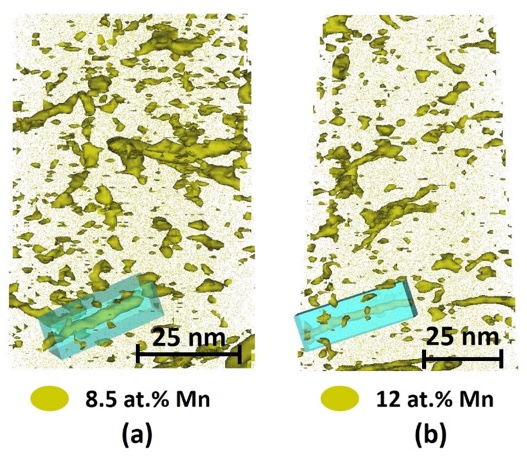
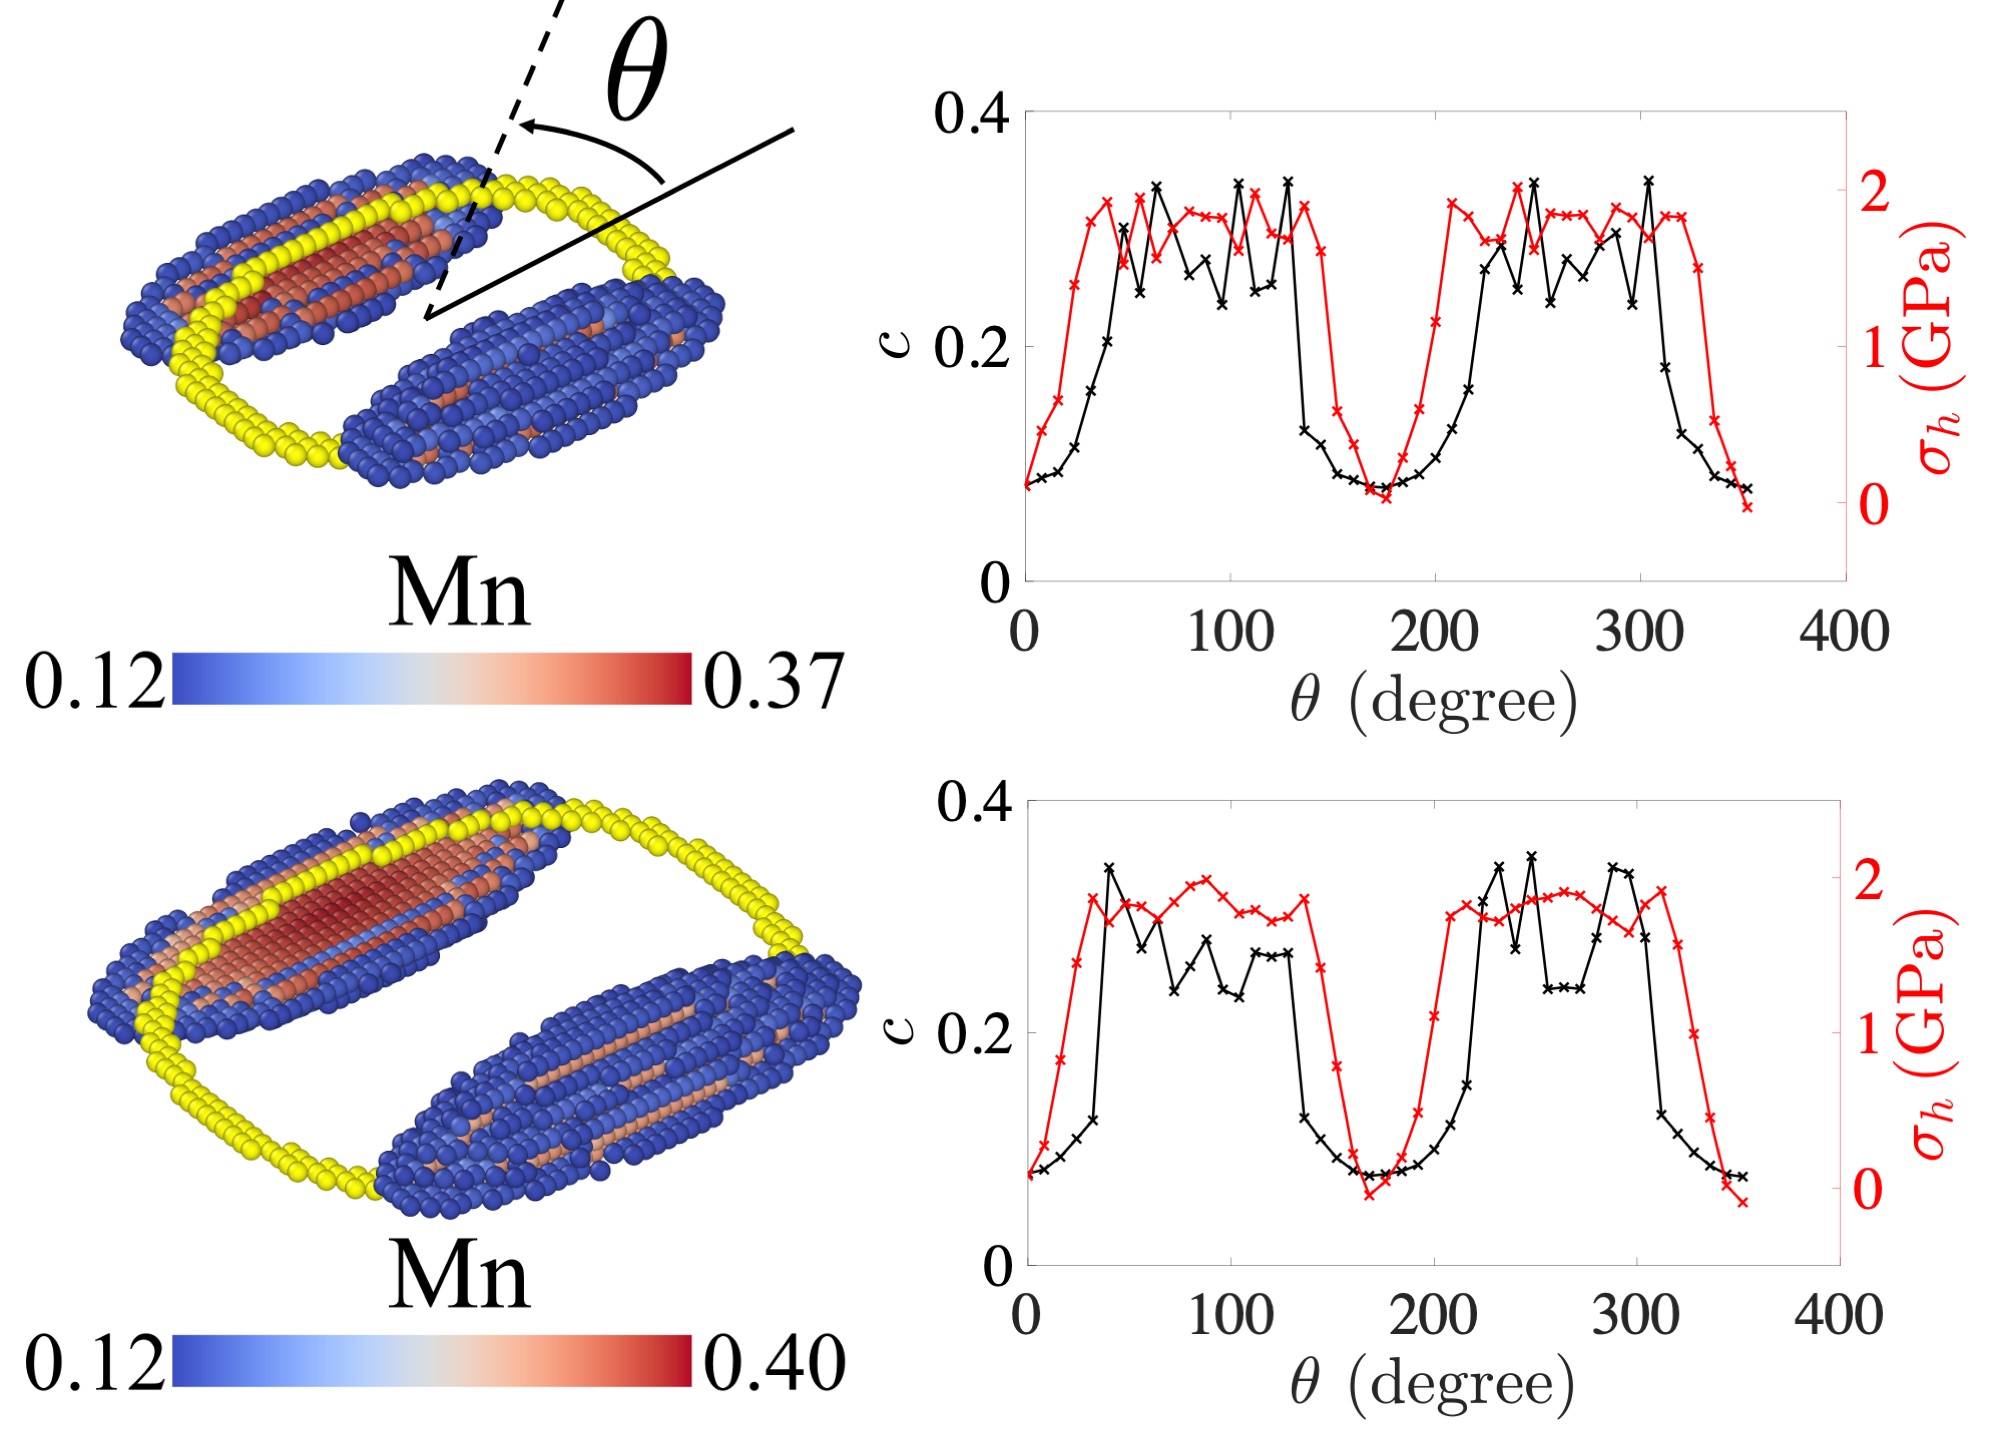
The lenticular distribution of Mn at.% isosurfaces can be interpreted as segregation to dislocation lines. Identification of these as edge dislocations was carried out in previous work via correlated transmission electron microscopy / APT together with atom probe crystallographic analysis [9, 14]. Additional detailed composition analysis has been carried out on the dislocations inside the blue regions in Figure 5. The results of this for Fe7Mn are shown in Figure 6, and for Fe9Mn in Figure 7.
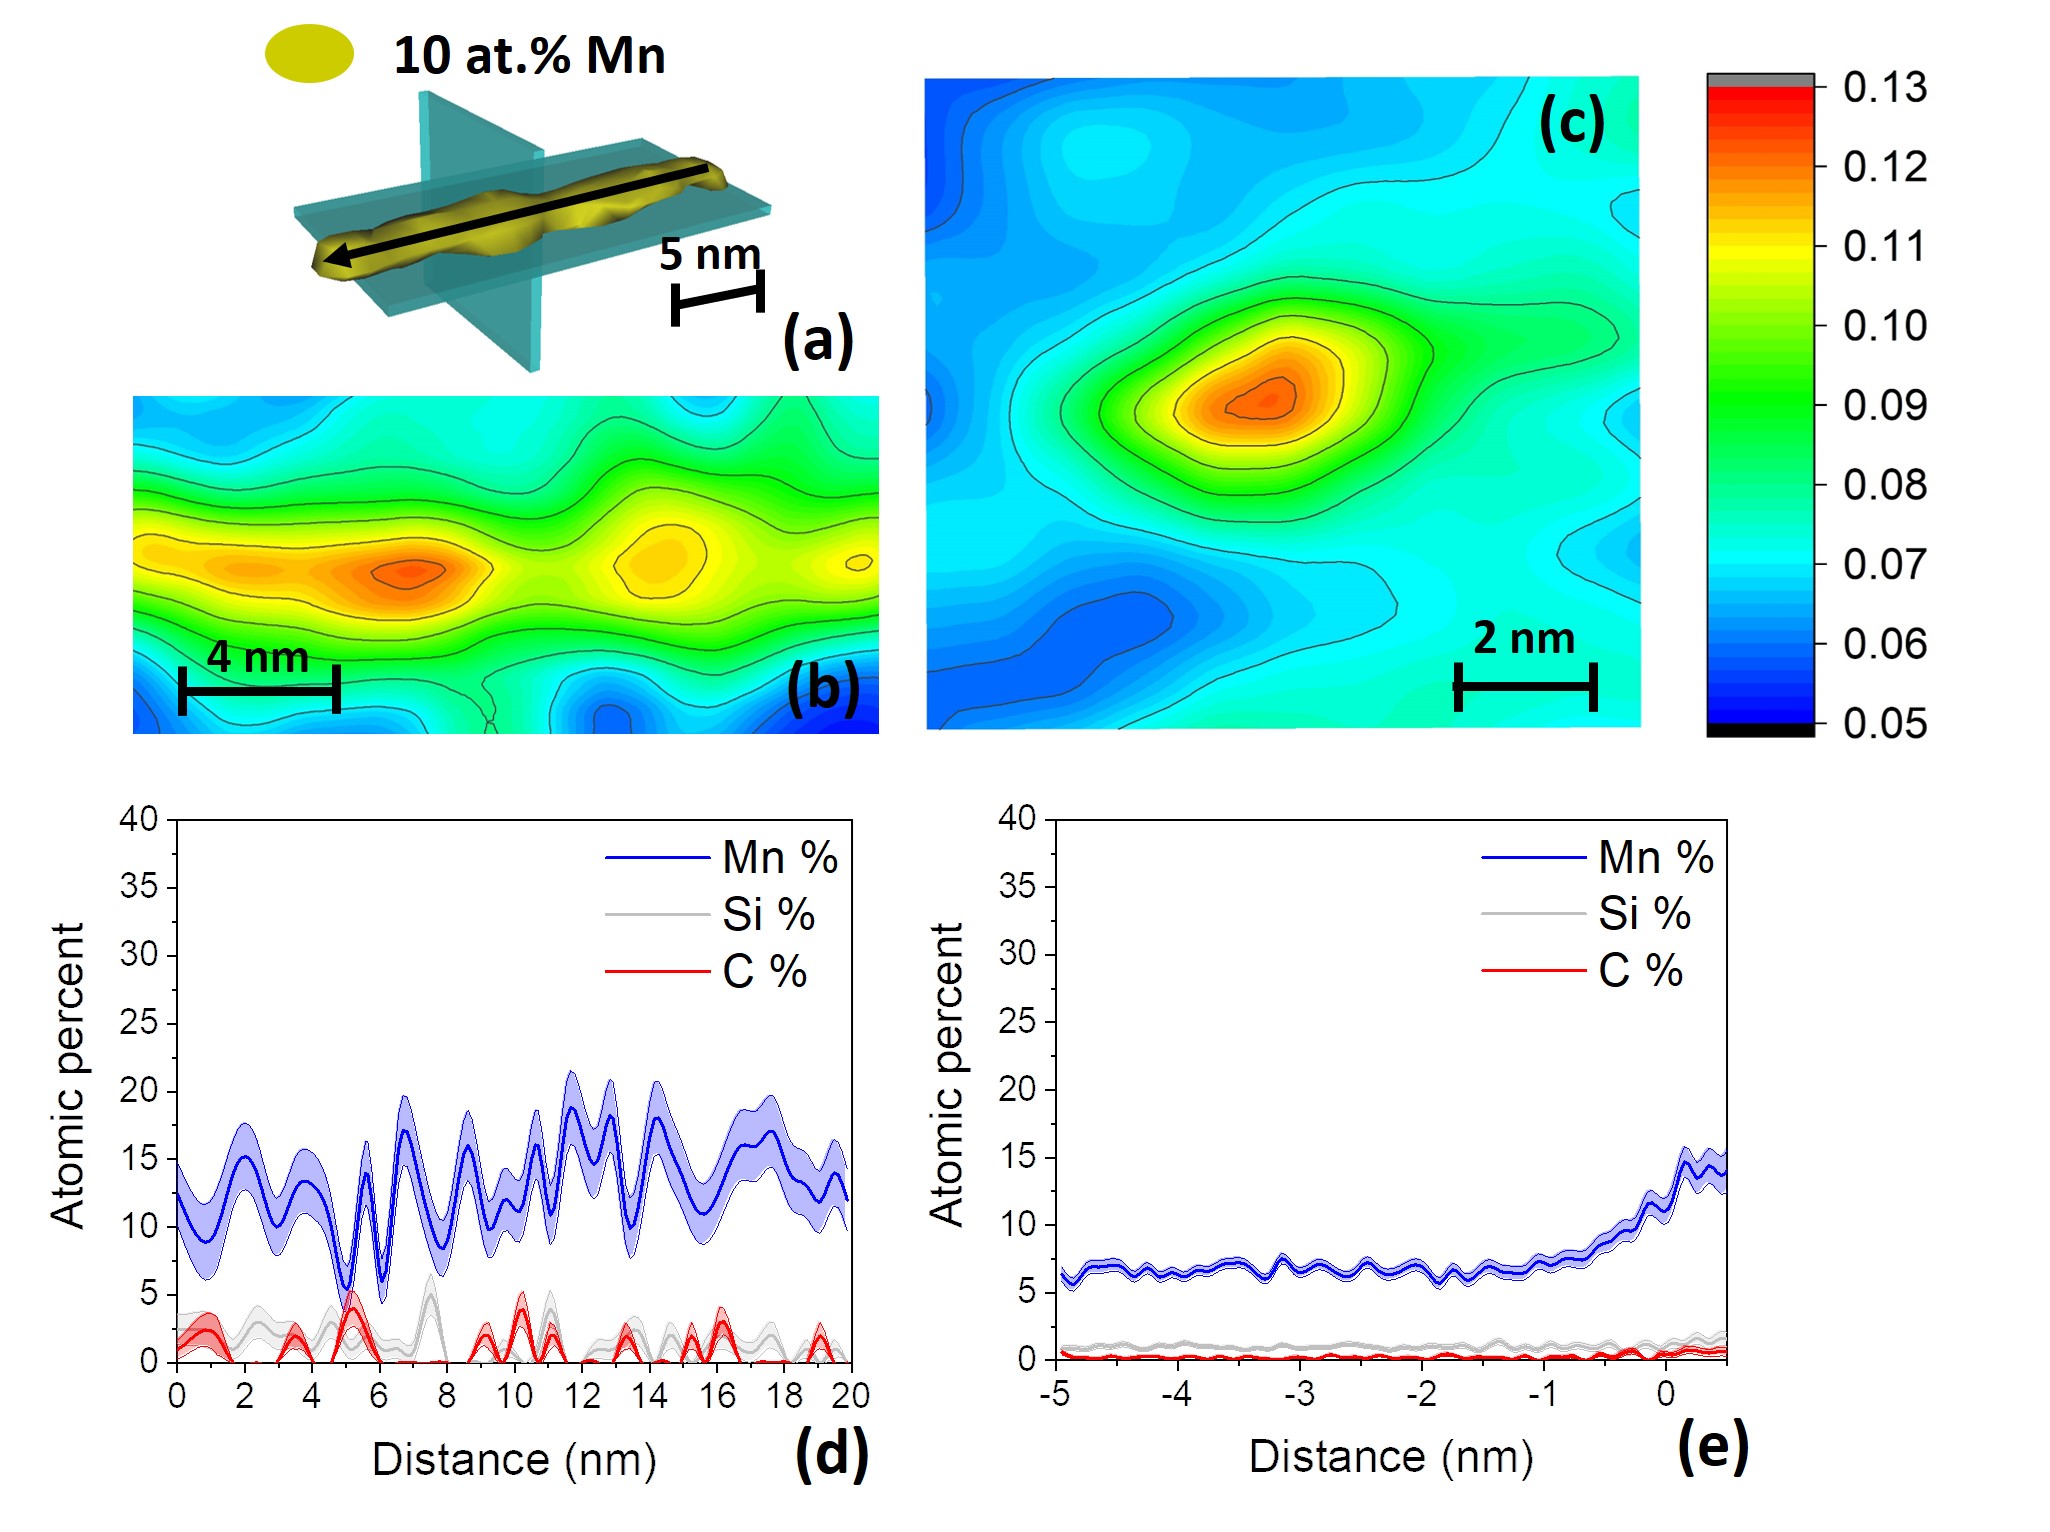
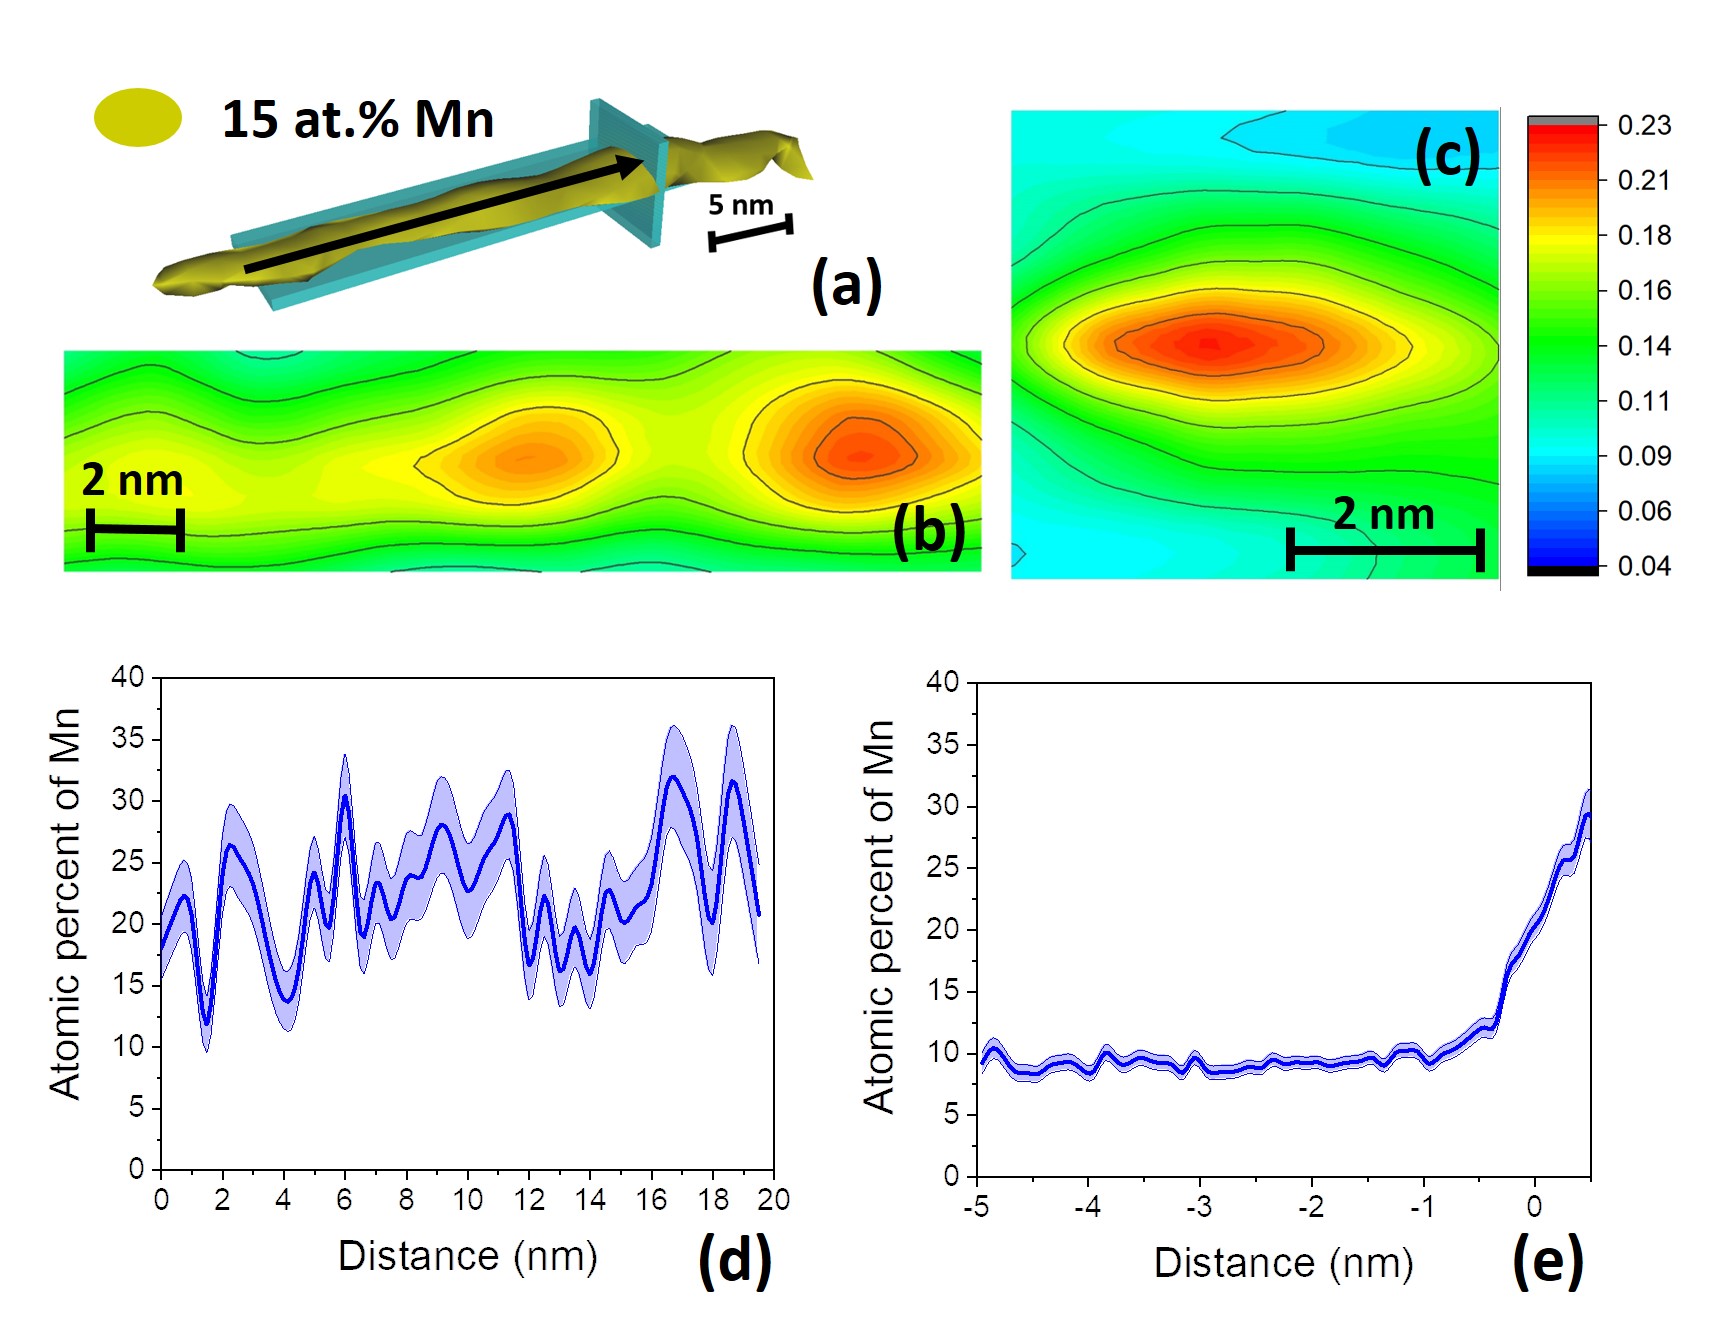
All at.% results from APT reported here are based on an averaging volume of 0.125 nm3. As indicated by these results, the maximum amount of Mn segregated to (bulk edge) dislocations increases from about 16 at.% in Fe7Mn to about 30 at.% in Fe9Mn. In addition, the amount of segregated Mn fluctuates strongly along the line (i.e., between 5-16 at.% in Fe7Mn and 15-30 at.% in Fe9Mn), in agreement with previous observations [10]. Note also the fluctuation of at.% Si and C along the line (Figure 6d) approximately asynchronous to that of Mn.
5 Simulation details
5.1 Numerical solution of initial-boundary-value problems based on MPFCM
This employs in particular the "weak" form [32, 33]
| (11) |
of the gradient energy (5) in terms of the auxiliary field and penalty parameter . In this context, the difference between and is minimized via minimization of the last two terms in (11) with respect to . As usual, the corresponding Euler-Lagrange relation
| (12) |
is necessary for this and provides a field relation for . In the context of (11),
| (13) |
holds for instead of (7). Numerical solution of the field relations (1) and (12) is carried out in a staggered fashion. Initial conditions here include a uniform Mn concentration in each case. Boundary conditions include zero external loading (stress control). Iteration proceeds until . A value of J/m3 for the penalty parameter is employed in all simulations. Changing this value to or has no influence on the simulation results.
5.2 Monte Carlo molecular dynamics
For further comparison, Monte Carlo molecular dynamics (MCMD: e.g., [20]) simulations based on the MEAM potential are also performed. In the current application, each MCMD step consists of 5000 MC steps (with 100 swaps per step) at 723 K followed by 5000 MD steps in the Parinello-Rahmann (NPT) ensemble at zero stress and 723 K. Such MCMD steps are repeated until the system and site occupancy stop changing. Averaging over the corresponding Mn lattice site occupation ensembles then yields the site Mn at.% at zero (simulation cell) stress and 723 K.
It is worth emphasizing that a number of differences exist between MCMD and MPFCM modeling of segregation behavior. These include in particular the energy models and stress measures. An indication of the former is the absence of screw core spreading in the MPFCM core stress field results in Figure 8 (lower middle right) seen in the corresponding MCMD results in Figure 8 (lower right). In the latter case, the atomic (virial) "stress" in MCMD is not a continuum stress measure. In addition, the magnitude of the atomic stress is inversely proportional to the atomic "volume" as based on Voronoi tessellation. Since this volume is physically arbitrary, the absolute value of the atomic stress is also physically arbitrary. Consequently, the comparison of MCMD and MPFCM results in what follows is at best qualitative in character.
5.3 Simulation set-up
Unless otherwise stated, all simulation cells are fully periodic and Cartesian with cell side vectors , , . In the case of edge dislocations, for example,
| (14) |
Analogously,
| (15) |
for screw dislocations. Here, is the lattice constant of BCC Fe (2.586 Å at 0 K). Simulations are based on a perfect dislocation dipole configuration with glide plane normal and monopole separation . System size is chosen large enough to avoid any size dependency in the results.
6 Simulation results and comparison with APT data
6.1 Mn segregation to edge and screw dislocations
For brevity, "APFCM" (atomistic PFCM) refers in what follows to the MPFCM model for Fe-Mn calibrated using MEAM-MD-based results for and C. Analogously, "MPFCM" refers to this model calibrated using Thermo-Calc data from CALPHAD (Figure 1).
APFCM and MCMD results for Mn segregation to edge and screw dislocations are presented in Figure 8.
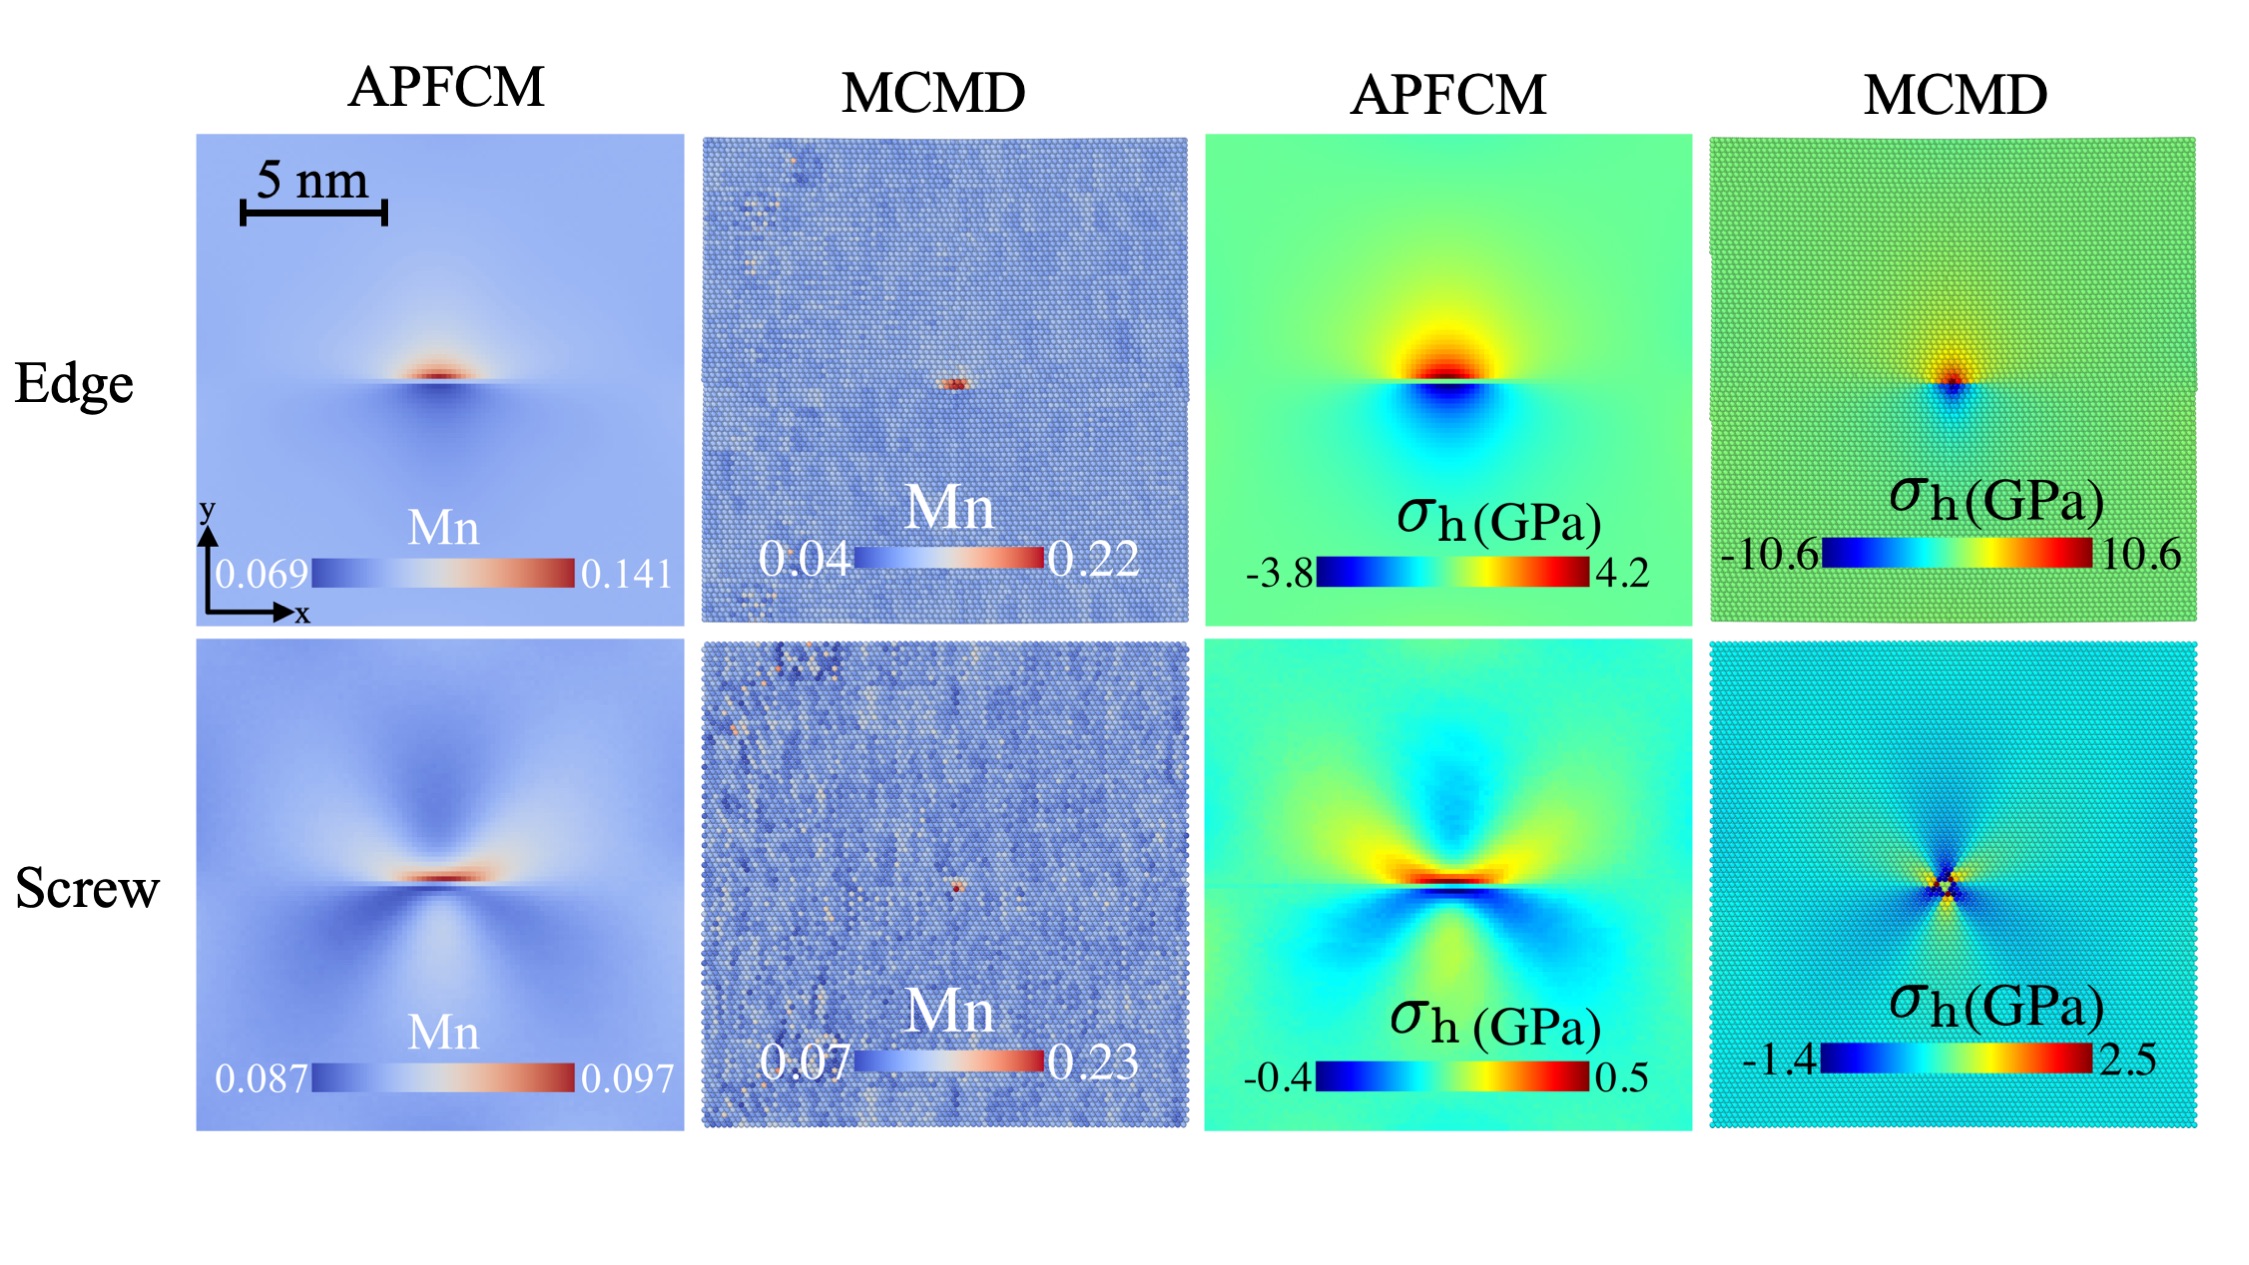
As evident in (7), the driving force for solute flux in (1)1 depends in particular on (the gradient of) Kirchhoff stress . In particular, since the identified form (8) of is dilatational, the model relation (7) for the chemical potential simplifies to the form
| (16) |
depending only on the hydrostatic part of . Besides in the edge core (Figure 8, upper right) as expected, note that both APFCM (Figure 8, lower middle right) and MCMD (Figure 8, lower right) predict non-zero hydrostatic stress in the screw core, resulting in segregation to screws as well. This is in contrast to standard (i.e., Volterra) continuum dislocation theory (e.g., [34]) based on linear elasticity and due in particular to geometric non-linearity. Additional non-linear effects accounted for in MCMD such as screw core spreading or core Kanzaki forces [35] may also play a role here. Especially in the APFCM case, the amount of segregation is clearly correlated with the magnitude of the (positive) hydrostatic stress field. The MCMD segregation results in Figure 8 (middle left) hold for spatial regions smaller than can be resolved with APT. Averaging these "raw" MCMD values over the same volume ( nm3) used to obtain the APT results reduces for example the peak edge value of 22 at.% Mn to about 17 at.%, and the peak screw value of 23 at.% to about 16 at.%, both closer to the corresponding APFCM values.
6.2 Influence of elasticity and defects on segregation and spinodal behavior
Besides segregation to defects such as dislocations, spinodal decomposition is expected to contribute in general as well to spatial fluctuations in solute concentration, both in the bulk and at defects. As discussed above, MPFCM modeling of the driving force for Mn flux and segregation is based on (16) for . This as well as the spinodal region is clearly influenced by the dependence of , C, , and . To discuss this influence in more detail, consider the simulation results in Figure 9.
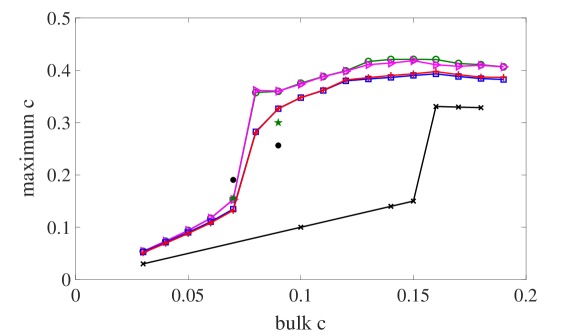
As shown by these results, segregation to (or from), and spinodal decomposition at, a (straight edge) dislocation is most strongly affected by solute misfit, and less so by the -dependence of ; indeed, that of and is minimal. Except in the case of no misfit (and hence no segregation; black crosses), note that maximum Mn concentration values lie above the bulk values in Figure 9 from the start due to segregation. For the cases with misfit and independent of (red crosses, blue squares), note that (i) less pre-spinodal segregation occurs, (ii) spinodal decomposition begins in the core region at slightly lower than the homogeneous chemical value in Figure 2 (right). Account for the dependence of results in (i) more segregation (green circles, violet triangles) and (ii) a shift of the spinodal region in the core to higher concentrations. In this latter case, the MPFCM results agree well with those from APT (green stars) for Fe7Mn (Figure 6(d)), and less so for Fe9Mn (Figure 6(d)).
As shown by the results in Figure 8, the concentration of segregated Mn varies spatially around the dislocation line, related in particular to the corresponding variation in the hydrostatic stress field. The resulting concentration fluctuations along the (straight edge) line are much smaller than those along the line evident in the APT results in Figures 6(d) and 7(d). One possible reason for larger fluctuations could be a change of dislocation character along the line (e.g., due to kinks or wavy dislocation structure) and so a change of hydrostatic stress along the line. A detailed investigation of this possibility is beyond the scope of the current work; as a simple "proof of concept", however, consider the case of Mn segregation to dislocation loops shown in Figure 10.
As expected, segregation resulting in spinodal decomposition is limited to the edge part of the dislocation loop. Note the fluctuation of of about 10 at.% in the edge part, i.e., even though the hydrostatic stress is relatively uniform. In addition, note that the range of concentration fluctuation is comparable to that seen in Fe9Mn in Figure 7(d). Based on these results, changes in dislocation character for other reasons such as kinking can also be expected to result in concentration fluctuations of the type observed in the APT results.
As seen in the modeling results of [36] and [37], under certain conditions, spinodal decomposition may occur along a straight dislocation line. Solute segregation to lines results in an initially uniform solute concentration due to the uniform stress field along the line. Once this uniform concentration reaches the lower spinodal concentration, decomposition occurs between the bulk and dislocation line (Fig. 9). As shown in [36], if there is insufficient solute in the system for the solute concentration to attain the upper spinodal concentration during decomposition, however, the uniform distribution along the line becomes unstable, and further decomposition occurs. The larger the upper spinodal concentration, and the smaller the system size (i.e., solute supply), the more likely this is to occur. Note that these results hold for the case of uniform, constant solute mobility in the system. As shown in [37], a non-uniform solute mobility, i.e., relatively low solute mobility in the bulk, and relative high solute mobility along the dislocation line ("pipe diffusion"), can also lead to spinodal decomposition along the line.
For the Fe-Mn system at 723 K studied in this work, the upper spinodal concentration of (Fig. 2) is relatively small, and the system size is sufficiently large, to result in spinodal decomposition of the uniform solute distribution along the line. Thus, the insufficient supply of solutes and the resulting spinodal breakup along the line is most likely not be the reason for the observed concentration fluctuations in the APT experiments. Furthermore, as measured in APT, the regions neighboring the dislocation lines do not show significant solute depletion, confirming that there is no lack of solute supply. Therefore, the system is not kinematically limited and solute mobility should not play a role in the spinodal morphology. Given the arguments above, we propose that the solute segregation fluctuations around the dislocation line observed in the APT for Fe-Mn system are due to structural fluctuations and dislocation character changes, rather than the spinodal breakup due to insufficient solute [36] or enhanced mobility around the dislocation line [37].
7 Summary and discussion
Segregation- and spinodal-based Mn enrichment of bulk dislocations in BCC Fe has been investigated in the current work with the help of comparative modeling and material characterization. On the modeling side, both microscopic phase-field chemomechanics (MPFCM) [21] and (hybrid) Monte Carlo molecular dynamics (MCMD) [20] have been employed. In the former case, the model is calibrated using both the MEAM potential (resulting in APFCM) employed in MCMD as well as and using Thermo-Calc / CALPHAD data for Fe-Mn. Predictions from these models are compared with characterization results from atom probe tomography (APT) for two Fe-Mn alloys. Both straight edge and screw dislocations, as well as dislocation loops, are considered in the simulations.
In contrast to the case in Volterra (linear elastic) dislocation theory, non-linear effects accounted for in both MPFCM and MCMD result in a non-zero hydrostatic stress field in screw cores. Being of much smaller magnitude than the hydrostatic stress in straight edge cores, much less solute segregates to screw than to edge cores, and the segregated amount in screw cores is always below spinodal. Additional effects captured by MCMD (not accounted for in MPFCM), such as (screw) core spreading, or core Kanzaki forces [35], may also play a role in determining the (screw) core (hydrostatic) stress state as well.
Results from MPFCM-based modeling of Mn segregation to, and spinodal decomposition at, a straight edge dislocation imply that the concentration dependence of the solute misfit distortion and resulting non-linear dependence of the elastic energy density on have the strongest effect. Segregation and spinodal decomposition are less strongly affected by the -dependence of in the chemical gradient energy density . In comparison to these two, the influence of the concentration dependence of the elastic stiffness and solute mobility on this behavior is minimal, in the current case of Fe-Mn.
With respect the maximum amount of Mn segregating to straight edge dislocations, the MPFCM results show good agreement with corresponding APT results. On the other hand, the current MPFCM model for Fe-Mn predicts little or no fluctuation in Mn concentration along the line, in contrast to the APT results. This could be related to the fact that MPFCM predicts a uniform hydrostatic stress along the line. In this case, segregated Mn is expected to exceed the spinodal value in the core uniformly along the line, resulting in the formation of a single precipitate, and minimal concentration fluctuations, along the (straight edge) line. As shown for example by the dislocation loop case in the current work, change in dislocation character (i.e., edge, screw, mixed) along the line, however, does result in significant corresponding fluctuations in solute concentration. Further investigation of this and the related case of kinked dislocations more relevant to the BCC case represent work in progress to be reported on in the future.
Acknowledgements
Financial support of the modeling and simulation work reported on here in Subproject M5 (M8) of the Priority Program 1713 "Strong Coupling of Thermochemical and Thermomechanical States in Applied Materials" of the Deutsche Forschungsgemeinschaft (DFG) is gratefully acknowledged. Part of simulations were performed with computing resources granted by RWTH Aachen University under project rwth0482. PS is grateful to the EPSRC for financial support through the associated programme grant LightFORM (EP/R001715/1).
References
- [1] J. W. Cahn, On spinodal decomposition, Acta Metallurgica 9 (1961) 795–801.
- [2] J. W. Cahn, On spinodal decomposition in cubic crystals, Acta Metallurgica 10 (1962) 179–183.
- [3] A. G. Khachaturyan, Theory of Structural Transformations in Solids, Wiley, New York, 1983.
- [4] P. Kontis, Z. Li, D. M. Collins, J. Cormier, D. Raabe, B. Gault, The effect of chromium and cobalt segregation at dislocations on nickel-based superalloys, Scripta Materialia 145 (2018) 76–80.
- [5] J. R. Mianroodi, P. Shanthraj, P. Kontis, B. Gault, B. Svendsen, D. Raabe, Atomistic phase field chemomechanical modeling of solute segregation and dislocation-precipitate interaction in Ni-Al-Co, Acta Materialia 175 (2019) 1–30.
- [6] X. Wu, S. K. Makineni, C. H. Liebscher, G. Dehm, J. Rezaei Mianroodi, P. Shanthraj, B. Svendsen, D. Bürger, G. Eggeler, D. Raabe, B. Gault, Unveiling the Re effect in Ni-based single crystal superalloys, Nature Communications 11 (2020) 1–13.
- [7] C. Liu, A. Garner, H. Zhao, P. B. Prangnell, B. Gault, D. Raabe, P. Shanthraj, Calphad-informed phase-field modeling of grain boundary microchemistry and precipitation in al-zn-mg-cu alloys, Acta Materialia 214 (2021) 116966.
- [8] X. Zhou, J. R. Mianroodi, A. K. da Silva, T. Koenig, G. B. Thompson, P. Shanthraj, D. Ponge, B. Gault, B. Svendsen, D. Raabe, The hidden structure dependence of the chemical life of dislocations, Science Advances 7 (16) (2021) eabf0563.
- [9] M. Kuzmina, M. Herbig, D. Ponge, S. Sandlöbes, D. Raabe, Linear complexions: Confined chemical and structural states at dislocations, Science 349 (6252) (2015) 1080–1083.
- [10] A. Kwiatkowski Da Silva, D. Ponge, Z. Peng, G. Inden, Y. Lu, A. Breen, B. Gault, D. Raabe, Phase nucleation through confined spinodal fluctuations at crystal defects evidenced in Fe-Mn alloys, Nature Communications 9 (2018) 1–11.
- [11] A. Kwiatkowski da Silva, I. R. Souza Filho, W. Lu, K. D. Zilnyk, M. F. Hupalo, L. M. Alves, D. Ponge, B. Gault, D. Raabe, A sustainable ultra-high strength Fe18Mn3Ti maraging steel through controlled solute segregation and -Mn nanoprecipitation, Nature Communications 13 (1) (2022) 2330.
- [12] M. Kuzmina, D. Ponge, D. Raabe, Grain boundary segregation engineering and austenite reversion turn embrittlement into toughness: example of a 9wt.% medium Mn steel, Acta Materialia 86 (2015) 182–192.
- [13] A. Kwiatkowski da Silva, R. D. Kamachali, D. Ponge, B. Gault, J. Neugebauer, D. Raabe, Thermodynamics of grain boundary segregation, interfacial spinodal and their relevance for nucleation during solid-solid phase transitions, Acta Materialia 168 (2019) 109–120.
- [14] A. Kwiatkowski da Silva, G. Leyson, M. Kuzmina, D. Ponge, M. Herbig, S. Sandlöbes, B. Gault, J. Neugebauer, D. Raabe, Confined chemical and structural states at dislocations in Fe-9wt%Mn steels: A correlative tem-atom probe study combined with multiscale modelling, Acta Materialia 124 (2017) 305–315.
- [15] A. H. Cottrell, B. A. Bilby, Dislocation Theory of Yielding and Strain Ageing of Iron, Proceedings of the Physical Society. Section A 62 (1) (1949) 49.
- [16] N. Ma, C. Shen, S. A. Dregia, Y. Wang, Segregation and wetting transition at dislocations, Metallurgical and Materials Transactions A 37 (2006) 1773–1783.
- [17] Y. U. Wang, Y. M. Jin, A. M. Cutiño, A. G. Khachaturyan, Nanoscale phase field microelasticity theory of dislocations: model and 3D simulations, Acta Materialia 49 (2001) 1847–1857.
- [18] J. W. Cahn, J. E. Hilliard, Free energy of a non-uniform system. I. Interfacial energy., Journal of Chemical Physics 28 (1958) 258–267.
- [19] T. Barkar, L. Höglund, J. Odqvist, J. Ågren, Effect of concentration dependent gradient energy coefficient on spinodal decomposition in the Fe-Cr system, Computational Materials Science 143 (2018) 446–453.
- [20] B. Sadigh, P. Erhart, A. Stukowski, A. Caro, E. Martinez, L. Zepeda-Ruiz, Scalable parallel Monte Carlo algorithm for atomistic simulations of precipitation in alloys, Physical Review B 85 (2012) 184203.
- [21] B. Svendsen, P. Shanthraj, D. Raabe, Finite-deformation phase-field chemomechanics for multiphase, multicomponent solids, Journal of the Mechanics and Physics of Solids 112 (2018) 619–636.
- [22] J. O. Andersson, T. Helander, L. Höglund, P. Shi, B. Sundman, Thermo-Calc & DICTRA, computational tools for materials science, Calphad: Computer Coupling of Phase Diagrams and Thermochemistry (2002).
- [23] Z.-K. Liu, J. Ågren, M. Suehiro, Thermodynamics of interfacial segregation in solute drag, Materials Science and Engineering: A 247 (1) (1998) 222–228.
- [24] Thermodynamic databases - Thermo-Calc software, www.thermocalc.com/products-services/databases/thermodynamic, accessed: 2020-09-21.
- [25] Y. M. Kim, Y. H. Shin, B. J. Lee, Modified embedded-atom method interatomic potentials for pure Mn and the Fe-Mn system, Acta Materialia 57 (2009) 474–482.
- [26] Diffusion data for multi-component alloys - Thermo-Calc software, www.thermocalc.com/products-services/databases/mobility, accessed: 2020-09-21.
- [27] A. Kwiatkowski da Silva, G. Inden, A. Kumar, D. Ponge, B. Gault, D. Raabe, Competition between formation of carbides and reversed austenite during tempering of a medium-manganese steel studied by thermodynamic-kinetic simulations and atom probe tomography, Acta Materialia 147 (2018) 165–175.
- [28] J. Han, J.-H. Nam, Y.-K. Lee, The mechanism of hydrogen embrittlement in intercritically annealed medium mn trip steel, Acta Materialia 113 (2016) 1–10.
- [29] J. Han, A. K. da Silva, D. Ponge, D. Raabe, S.-M. Lee, Y.-K. Lee, S.-I. Lee, B. Hwang, The effects of prior austenite grain boundaries and microstructural morphology on the impact toughness of intercritically annealed medium mn steel, Acta Materialia 122 (2017) 199–206.
- [30] B. P. Geiser, D. J. Larson, E. Oltman, S. Gerstl, D. Reinhard, T. F. Kelly, T. Prosa, Wide-field-of-view atom probe reconstruction, Microscopy and Microanalysis 15 (2009) 292–293.
- [31] B. Gault, D. Haley, F. de Geuser, M. Moody, E. Marquis, D. Larson, B. Geiser, Advances in the reconstruction of atom probe tomography data, Ultramicroscopy 111 (2011) 448–457.
- [32] R. L. J. M. Ubachs, P. J. G. Schreurs, M. G. D. Geers, A nonlocal di use interface model for microstructure evolution of tin-lead solder, Journal of the Mechanics and Physics of Solids 52 (2004) 1763–1792.
- [33] P. Shanthraj, C. Liu, A. Akbarian, B. Svendsen, D. Raabe, Multi-component chemo-mechanics based on transport relations for the chemical potential, Computer Methods in Applied Mechanics and Engineering 365 (2020) 113029.
- [34] J. P. Hirth, J. Lothe, Theory of Dislocations, 2nd Edition, Wiley, New York, 1982.
- [35] B. Gurrutxaga-Lerma, J. Verschueren, Elastic models of dislocations based on atomistic Kanzaki forces, Physical Review B 98 (2018) 134104.
- [36] J. R. Mianroodi, P. Shanthraj, B. Svendsen, D. Raabe, Phase-field modeling of chemoelastic binodal/spinodal relations and solute segregation to defects in binary alloys, Materials 14 (7) (2021).
- [37] A. V. R, P. Pant, M. P. Gururajan, Dislocation assisted phase separation: a phase field study, arXiv 2107.12703 (2021).