Network Report: A Structured Description for Network Datasets
Abstract.
The rapid development of network science and technologies depends on shareable datasets. Currently, there is no standard practice for reporting and sharing network datasets. Some network dataset providers only share links, while others provide some contexts or basic statistics. As a result, critical information may be unintentionally dropped, and network dataset consumers may misunderstand or overlook critical aspects. Inappropriately using a network dataset can lead to severe consequences (e.g., discrimination) especially when machine learning models on networks are deployed in high-stake domains. Challenges arise as networks are often used across different domains (e.g., network science, physics, etc) and have complex structures. To facilitate the communication between network dataset providers and consumers, we propose network report. A network report is a structured description that summarizes and contextualizes a network dataset. Network report extends the idea of dataset reports (e.g., Datasheets for Datasets) from prior work with network-specific descriptions of the non-i.i.d. nature, demographic information, network characteristics, etc\xperiod We hope network reports encourage transparency and accountability in network research and development across different fields.
1. Introduction
Scientists use networks as representation to understand and model complex systems including social, biological, neural, and technological systems (Newman, 2003). Networks are also at the heart of industrial applications, empowering products from Google (Page et al., 1999) to Facebook, CISCO, and Twitter. Recently, machine (deep) learning on graphs and networks has received increasing attention in major conferences, driving real-world applications such as drug discovery (You et al., 2018), recommender systems (Ying et al., 2018) and protein structure prediction (Jumper et al., 2021).
Sharing and using standard datasets accelerate advancements in science and technology (Barabsi, 2016). Through our random investigation on over 10 papers presenting new network datasets (including their associated websites), we found that they describe network datasets in only 1-2 short paragraphs listing the genre and basic statistics. As different network dataset providers make their own
effort in documenting the datasets, important information is often unintentionally omitted. Various data quality issues in common network benchmarks have been pointed out recently (Toutanova et al., 2015; Hu et al., 2020).
In natural language processing (NLP), researchers have found that critical information such as ‘what language is included’ is often omitted (Bender, 2011). Proposals have been made and adopted to standardize how to document NLP datasets (Bender and Friedman, 2018). To address the gap in documenting datasets for machine learning (ML) more broadly, Gebru et al. (2018) proposed Datasheets for Datasets, which quickly became the norm for data reporting in industry and academia.
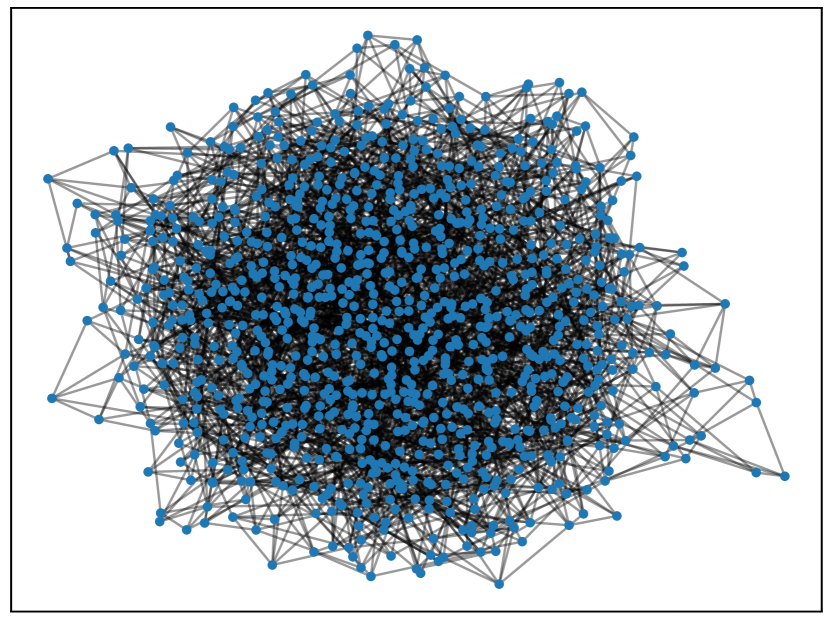
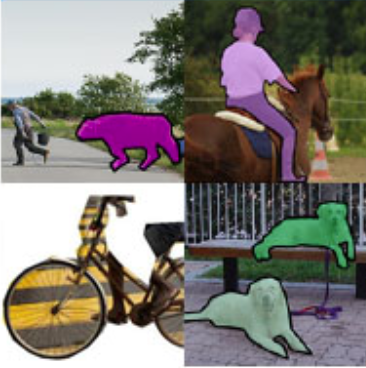
However, networks are ubiquitous and have unique properties that warrant an extension of these formats. First, networks are created and researched across different areas and domains (e.g., computer science, physics, biology, etc). Assumptions and practices are not always shared across these communities, therefore increasing the need for structured communication. Take for example a social network dataset. Social science researchers build the social network through surveys, interviews, etc, and conduct social science research. Network science researchers study the community structure. ML researchers study how to predict links. High performance computing researchers study how to compute social networks efficiently. Thus reporting network datasets should generalize to different areas and domains. Second, networks have complex structures and (often) contain thousands (millions) of nodes, so it is hard to communicate what a network ‘looks like’. Lists and tables are often easier to illustrate. Often one can show a representative instances of e.g., a computer vision dataset (images with object annotations as shown in Figure 2). In contrast, for networks, visualizing an instance (entity/node) and its neighbourhood does not reveal the structure of the whole network (sometimes even visualizing the neighbourhood could be hard). Another way to communicate what a network ‘looks like’ is to visualize the whole network. Unfortunately, visualizing large networks has proven to be difficult (as shown in Figure 2) (Landesberger et al., 2011). Thus, basic statistics (e.g., degree) over networks are used as a tool to communicate network characteristics. Moreover, the relational nature of networks make data collection and preparation more complex. There are data preparation operations unique to networks that are not covered by previous proposals for reporting datasets. For example, dataset providers can transform a network dataset based on its structure (e.g., extracting k-cores). Some data preparation operations that may be less emphasized in tabular data preparation could have unintended and complex effects on the network structure due to the non-i.i.d. nature of networks (i.e., nodes/samples are not observed i.i.d.). For instance, randomly sampling a scale-free network (i.e., degree distributions that roughly follow a power law) could result in a sub-network that is not scale-free (Stumpf et al., 2005). These statistical pitfalls should be documented by network providers.
Current practice in reporting network datasets could result in inappropriate documentation leading to information gaps between network dataset providers and consumers. Thus, (unintentional) dataset misuse and misunderstanding could increase, adversely affecting science and society. Deployment of applications evaluated or trained with inappropriate networks could have serious consequences such as discrimination against minority groups (Stoica et al., 2018).
To address the information gap between network dataset providers and consumers, we design network reports as practice for documenting network datasets. Our development was driven by formative interviews with 12 network practitioners (including faculty, graduate students, research scientists, and engineers in industry). We sought to understand what they would like to see when they encounter a new network dataset. A network report is a structured description following a particular template that summarizes and contextualizes a network dataset. To handle the unique challenges of reporting networks, we advocate for standard measures (e.g., degree) of the network structure, demographics information (if the dataset is related to people), potential bias that already exists or was introduced during data processing, and potential or known errors in the dataset. For network dataset providers, we anticipate that network report could relieve the burden of thinking about what to include and how to present the dataset intuitively. We anticipate that network dataset consumers can assess whether the dataset is appropriate for their task, compare different datasets, and understand limitations. We hope that network reports prevents unintentional misuse of network datasets and mitigate bias in high-stakes applications. While we think that the proposed format of network report covers the most important properties of networks, we see it as a living format that the community continues to refine.
2. Related Work
A growing body of literature designs and evaluates structured documents or checklists for datasets, models, and services. One of the most prominent works is ‘Datasheets for Datasets’ (Gebru et al., 2018). The authors proposed to accompany documentation with datasets to encourage transparency and accountability for data used by the ML community. The framework advocates for systematically documenting datasets’ purpose, composition, collection process, preprocessing, uses, distribution, and maintenance. A similar proposal is ‘Data statements for NLP’, which focuses on NLP datasets and addresses ethics, exclusion, and bias issues in NLP datasets and systems (Bender and Friedman, 2018). ‘Dataset nutrition labels’ describes the concept of nutrition label to assess the quality and robustness of a dataset before it is used in model development (Yang et al., 2018; Holland et al., 2018). Recent studies have also investigated various aspects of documentation in data science lifecycle such as data readiness (Beretta et al., 2018), industrial data practices for computer vision datasets (Miceli et al., 2021), academic dataset usage (Geiger et al., 2020), accountability for ML datasets (Hutchinson et al., 2021) etc. Beyond datasets, ‘model cards’ were proposed to accompany trained ML models including information like intended use cases, evaluation data, performance measures etc (Mitchell et al., 2019). The goal of ‘model cards’ is to improve transparency between stakeholders of ML models. ‘Factsheets’ and ‘AI fairness checklists’ have a similar motivation, but were targeted at documenting AI services and systems (Hind et al., 2019; Madaio et al., 2020).
Complementing existing work, we primarily focus on networks, and develop a structured way to communicate network datasets. Our work is functionally similar to ‘Datasheets’ and ‘Data statements’ in the context of ML, but we also consider challenges outside ML as networks are used and shared across different areas and domains.
3. Preliminaries
We briefly discuss some terms and symbols in this section. “Graph” is more prevalent in the ML community, but “network” has been popular in the data mining and network science communities. We primarily use “network” in this paper, and use “graph” for specific terms (e.g., knowledge graph). The reason is that network analysis is generally concerned with the properties of real-world data, whereas graph theory is concerned with the theoretical properties of the mathematical graph abstraction.
A network is represented as a tuple , where is the set of nodes, is the set of edges, is the attribute matrix of nodes, is the attribute matrix of edges. Nodes represent entities, and edges represent relationships between entities. represents node attributes. represents edge attributes. Each row of () represents one node (edge), and each column of () represents one attribute. denotes the degree matrix, where the degree of each node is on the diagonal. , denote the adjacency matrix, the Laplacian matrix of the network respectively. We will use this terminology throughout the rest of the paper.
Based on edge properties: - directed or undirected network - simple or multi-graph where an edge can repeat - weighted or unweighted network - signed network - temporal network Based on node properties: - homogeneous or heterogeneous Based on hybrid (node and edge) properties: - knowledge graph - bipartite network - multilayer network Dataset Collection, Preprocessing and Annotation • Data collection – Data collection mechanism and raw data description – Network sampling • Data preprocessing – Network construction (e.g., parcellation of brain scans) – Data cleaning (e.g., removing inaccurate nodes) – Data filtering (e.g., extracting k-cores) – Network transformation (e.g., bipartite graph projection) – Attribute transformation (e.g., anonymize attribute values) – Data splits • Instance demographics • Data annotation • Annotator demographics Uses • Primary intended uses • Other uses Network Statistics • Point statistics – Size of nodes and edges – Proportion of nodes in largest connected components – Average degree – (Tail) Power-law exponent (N/A for non power law networks) – Spectral radius and algebraic connectivity – Average triangle count – Average clustering coefficient – Degree assortativity coefficient – Max k-core • Distributions of network statistics and attributes – Degree distribution – Pagerank distribution – Singular value distribution (or eigenvalue distribution) – Clustering distribution – Node attribute(s) distribution – Edge attributes(s) distribution
4. Development Process
We started with formative interviews with 12 network practitioners including faculty, graduate students, research scientists, and engineers in industry. We asked interviewees at least: what kind of network data they would use; what kind of graph problems they are (have been) working on, and what action they would take when encountering a new network dataset.
Next, using our experience as network researchers, we analyzed potential use cases of networks in academic and industrial contexts. In academic contexts, the network report should provide readers enough relevant information to understand the academic work. Given an arbitrary network, the best algorithm for an analytical problem (e.g., community detection) depends on the characteristics (e.g., size, cohesion, spectrum etc.) of the network. For instance, community detection based on asymptotical Surprise (Traag et al., 2015) works well for many small communities, while Louvain community detection (Blondel et al., 2008) based on modularity favours networks with few large communities. This is due to the no free-lunch theorem, which states that any two optimization algorithms are equivalent when averaged across all possible problems (datasets) (Joyce and Herrmann, 2018). As network algorithms could favor certain types of networks as opposed to others, when reading scientific work, researchers need sufficient information of the network datasets to understand the performance of the proposed methods, and how the proposed methods can or cannot be expected to achieve similar results on other datasets. The aforementioned examples highlight the need to include network characteristics measures.
In industrial contexts, deployment of applications evaluated or trained with inappropriate networks could have serious consequences (Stoica et al., 2018). A recommender system trained and deployed with different demographics, inappropriate time window or shifted customer inclinations could result in bad user experience and revenue lost (Koren, 2009). Recent studies revealed that ML models reproduce or amplify unwanted societal biases reflected in training data (Buolamwini and Gebru, 2018). For example, knowledge graph embeddings have been shown to encode that men are more likely to be bankers, and women more likely to be homekeepers (Fisher, 2019). A question answering system empowered by the knowledge graph may discriminate female. Adding a standardized documentation can make application developers be aware of the potential consequences when using the data and infer what additional steps are necessary. These examples highlight the need to document population, bias and fairness (for applications) when sharing a network dataset.
We prototyped a template for network reports based on what we learned. We then “tested” the template by creating the network report for the EU email dataset (Leskovec et al., 2007). While creating the network report, we noted problems like non-intuitive orders, lack of clarity, lack of coverage, and redundancies. We then refined our initial template and recreated the above network report. We incorporated feedback from other network practitioners with two cases (https://tinyurl.com/mwwunkae#case) and finally created the template present in the next section. Finally, we conducted an initial user study in section 7, and incorporated the feedback from participants in the final version presented here.
5. Proposed Template
Figure 3 shows the skeleton of the proposed template. We include four sections in network report: (i) Curation Rationale contains the metadata and the contexts of the dataset; (ii) Dataset Collection, Preprocessing and Annotation contains the data preparation information; (iii) Uses contains the usage information; (iv) Network Statistics contains the statistical properties of the dataset. The proposed sections are not intended to be exhaustive. Additional details may include domain-specific information, legal information, etc. Network dataset providers are also encouraged to review and integrate information in datasheets (Gebru et al., 2018). Here we focus on network aspects of documenting a dataset.
5.1. Curation Rationale
This section helps network dataset consumers understand the basic metadata of the dataset, and sets the context for the remaining sections. After reading this section in the report, readers should have a good overview of the dataset.
Author(s) and reference of the network dataset:
This acknowledges the authors who share the network. If the network dataset in an academic paper, it is encouraged to list the reference.
Purpose: Why was the network dataset created? Was there a specific usage in mind? Network dataset providers typically create the dataset primarily for a specific use case.
This point could inform users of the reasons for certain decisions (such as collection, preprocessing and annotation).
Domain: Which domain does the network lie in?
Domains include online social networks, metabolic networks, citation networks, etc.
Node and edge semantics:
What does each node and each edge mean? For instance, in a Twitter who-follows-who network, a node is a user, while an edge is the following relationship. Node and edge semantics form the cornerstone for all tasks (e.g., link prediction, node classification, etc.).
Contents:
This includes a brief plain text description on dataset contents. Indicating if the network is a snapshot sets the context for network sampling (Section 5.2.1), and affects tasks like parameter estimation and simulation (Leskovec and Faloutsos, 2006; Ahmed et al., 2013).
Types of network(s):
Many tools and algorithms expect certain types of networks, so it is necessary to provide a precise description of the network types.
Networks can be categorized based on node properties, edge properties and hybrid properties.
We provide a taxonomy of network types in Figure 3, where each entry is a possible tag for the network type.
5.2. Dataset Collection, Preprocessing and Annotation
This section explains how the author(s) created the network dataset. After reading this section, network dataset consumers should know whether the dataset is compatible with their tasks. For example, if the provider removed the timestamp of a Twitter who-follows-who dataset, then this dataset is not suitable for modeling time-evolving behavior. Through our investigation and interviews with network practitioners on network dataset creation, we present frequent operations on network data preparation, and emphasize how certain operations on a network dataset could have unintended impacts on different tasks. We also advocate for including demographic information in this section if the network is related to people or the annotation process is conducted by people.
5.2.1. Data collection
How was the data collected? Was there any known error or bias introduced in the data collection process? The ideal collected data would be a census or enumeration of the network (e.g., a friendship network within a 50-people company), which includes every node, and every edge between nodes. Unfortunately, this is not feasible under most circumstances. As a result, a typical collection includes sampling, which refers to selecting a sampled network that can represent the population. Since network sampling is often part of data collection, we explicitly include network sampling in the data collection. We refer to ‘raw data’ the collected data prior to any processing.
Data collection mechanism and raw data description: What was the data collection mechanism? Was there any error (e.g., missing nodes, erroneously omitted edges) or bias (e.g., bias to high-degree nodes) introduced by the data collection mechanism? The data collection mechanism determines the format, the semantics, and the quality of the raw data, thus affecting all downstream data processing choices. In some domains, nodes or/and edges do not naturally exist in the raw data, and network dataset providers construct networks from the raw data. For instance, some brain networks are constructed from multiple time series signals, where each time series represents the activity for one region in the brain (Rubinov and Sporns, 2010). However, in tabular data, the meaning of each instance (sample) does not change (e.g., an image collected from the web is always an image in the dataset). Dataset providers should describe the raw data.
The data collection mechanism is a significant source of error when making measurements over network structures. In biology, metabolic, protein, and regulatory networks are typically measured in a lab environment. Suffering from natural variation in biological systems and inconsistent measurement conditions, experiments usually don’t give the same results every time, meaning that any individual measurement may be an error (Newman, 2018). Social networks collected from surveys or questionnaires could suffer from missing data, where participants may decline to answer some or all questions (Marsden, 1990; Bernard and Killworth, 1977). The error or/and bias introduced in the data collection should be included in network reports, thus network dataset consumers could infer whether the error or/and bias would influence their tasks.
Network sampling: Was there any sampling process when collecting the network dataset? What sampling strategy has been chosen? What was the reason for the sampling strategy? Network sampling often inherently happens when the data is collected. For example, researchers use breadth first search to crawl online social networks automatically (Mislove et al., 2007). Many factors make it difficult to study networks in their entirety. Some networks are not completely visible to the public (e.g., Facebook), or can be accessed only through crawling (e.g., the Web). In other cases, the measurements required to observe the underlying networks are costly (e.g., experiments in biological network). Moreover, many networks are continuously changing (e.g., telecommunication interactions, user-product interactions) and can never recorded in their entirety.For these networks, providers should describe the collection time frames.
The non-i.i.d. nature of networks makes network sampling complex. For example, given a population network, randomly sampling a set of nodes versus randomly sampling a set of edges would result in very different network structures. Network sampling could introduce sampling bias to the network, which makes it hard to correctly estimate the parameters of the whole network. For instance, sampling in a breadth-first manner is biased as high‐degree nodes have a higher chance of being sampled (Kurant et al., 2010). People who intend to study hard-to-reach communities should not use breadth-first sampled social networks.
With the detailed sampling information, network dataset consumers could examine whether the network dataset is biased towards particular properties and whether it is still suitable for their task, and what additional processing steps are needed. For instance, researchers have used Metropolis-Hasting random walk to induce an unbiased sample of Facebook users (Gjoka et al., 2010).
5.2.2. Data preprocessing
How was the network dataset generated from raw data? Preprocessing converts raw data to a structured network format. Steps may appear in different orders or can be repeated (Hameed and Hasso, 2020). Here we discuss six typical steps to preprocess a network dataset: network construction, data cleaning, data filtering, network transformation, attribute transformation, and data split. Data split is common for ML tasks, while the others are common in data preparation. There is no strict order for these steps, thus network dataset providers can interchange them under different circumstances. If network dataset providers provide the raw data, the data preprocessing part in network report allows network dataset consumers to replicate the steps.
Network construction: What strategies were used to transform raw data to nodes and edges? What are the reasons for choosing these strategies? When the raw data does not naturally include nodes or/and edges, network construction is a crucial step to set up nodes or/and edges. Essentially, network construction is to set up and in the network. This step is unique to network datasets as tabular data does not have relations between instances. Network construction determines the semantics of nodes or/and edges, so it should be consistent with ‘node and edge semantics’ in ‘Curation Rationale’. Different network construction methods fundamentally change the network structure and the compatible tasks. For example, in brain networks, the edges could represent anatomical tracts or functional associations, and the semantics largely determines the neurobiological interpretation of network topology (Rubinov and Sporns, 2010).
Data cleaning: How were nodes, edges, or networks (in a multi-network dataset) edited or augmented? Data cleaning refers to the removal, addition, or replacement of less accurate (or inaccurate) data values with more suitable, accurate, or representative values (Hameed and Hasso, 2020). Research on data cleaning for networks has shown that inappropriate data cleaning strategies could lead to a high error rate in wireless sensor networks due to power exhaustion and environmental noise (Cheng et al., 2018). Thus, including data cleaning details in a network report is necessary for network dataset consumers to examine if the data quality is appropriate for the tasks and if they need to conduct additional data cleaning steps. Typical operations of data cleaning on networks include: removal of nodes, removal of edges, removal of attributes, node deduplication, etc. Data cleaning has a direct impact on data quality and data usage. Removal of specific attributes like timestamps could limit the applicability of the network dataset.
Data filtering: What nodes or/and edges have been filtered out? What was the reason for filtering? Data filtering refers to generating a subset of nodes or/and edges (Hameed and Hasso, 2020). Data cleaning focuses on removing inaccurate values, while data filtering focuses on simplifying the contents of the data. Different from tabular data, where data filtering is done based on attribute value(s) (value filtering), in networks, data filtering could be based on the network structure (structural filtering). Value filtering is to simplify contents based on and , while structural filtering is based on and . Structural data filtering could be a potential source of bias in the network. For instance, extracting k-cores of a large network, a common method (Safavi and Koutra, 2020; Ni et al., 2019), biases to high-degree nodes. Both value filter (on nodes or/and edges) and structural filter should be detailed in this part.
Network transformation: How was the network transformed? Network transformation refers to converting the network from one format to another. Typical operations include the projection of a bipartite network (e.g., constructing a user similarity network based on the number of co-purchased items), the projection of a multilayer network, and aggregation of nodes for hypergraphs. For projection, we encourage network dataset providers to carefully think about the weighting scheme, because the redistribution of weights has a strong effect on the community structure (especially in dense networks) (Fan et al., 2007).
Attribute transformation: How were the node or/and edge attributes transformed? Network transformation is based on network structure, while attribute transformation focuses on attributes of nodes or/and edges ( and ). Typical transformations include value normalization, value scaling, dimension reduction, change of attribute names, etc.
Data split: How was the data split to train/validation/test sets? What was the splitting ratio? ML researchers use data splits to train and evaluate their models. Tabular datasets are often split to train/validation/test sets by random selection. However, randomly selecting nodes and edges for training and testing leads to overly optimistic accuracy due to the non-i.i.d. nature of graphs (Lohr, 1999).
One common mistake in data splits is unintentional data leakage. Leakage refers to the use of information in the model training process that would not be expected to be available at prediction time, causing the predictive scores (metrics) to overestimate the model’s utility when run in a production environment (Kaufman et al., 2011). We want to highlight it in data splits because network related tasks often train and test on a single network, thus having a high probability of leakage. Researchers have found that leakage existed in a common knowledge graph completion (link prediction) benchmark (Toutanova et al., 2015), where the relation set of inverse entity pairs is almost the same e.g., comparing entity pairs for relation to the entity pairs for relation (reverse ). Thus including relation between entity pairs in the training set leaks information because in real use cases, would not exist in the knowledge graph. As a result, prior models were not fairly evaluated. The main reason for this mistake is that the links between entities were split randomly into train/validate/test set.
Besides leakage, the notion of ‘transductive learning’ and ‘inductive learning’ brings additional ambiguity when evaluating ML models on graphs and networks. In the context of graph machine learning, ‘transductive learning’ refers to seeing the whole graph (including the test set but without the labels of the test set) beforehand, while ‘inductive learning’ assumes there are unseen nodes added to the graph during test time. In an inductive node classification task, researchers have found duplicated nodes (near 5%), edges and labels in training and testing sets (Hu et al., 2020) due to data splitting. This violates the inductive assumption as the duplicated nodes in test sets cannot be viewed as newly added. To avoid similar issues, we encourage network dataset providers to carefully examine the data splitting strategy and provide details on how the strategies are implemented. We also encourage network dataset consumers, especially ML researchers, to check if the data is split appropriately for their tasks.
5.2.3. Instance Demographics
In case the network dataset is related to people, what are the demographic characteristics of the instances? Possible demographic information include but not limited to age, gender, race/ethnicity, and socioeconomic status. Including instance demographics is important for ML applications in real-world deployments. Researchers found that models can reproduce or amplify unwanted societal biases reflected in training data (Buolamwini and Gebru, 2018). In real-world deployments, biased data can result in unfair decisions and discrimination of minority groups, which can lead to severe consequences in high-stakes domains. For instance, recommender systems that make predictions based on observed data can easily inherit bias that may already exist (Yao and Huang, 2017). Knowledge graph embeddings have been shown to encode that men are more likely to be bankers, and women are more likely to be homekeepers (Fisher, 2019). To mitigate bias and improve fairness, sensitive attributes (e.g., age in a loan and debt network; gender in a job posting network (Blommaert et al., 2020; Bose and Hamilton, 2019)) involving discrimination should be available to network dataset consumers.
5.2.4. Data annotation
Who annotated the data (e.g., crowds, domain experts)? How was the data annotated? Was there a shareable user interface? Were the labels noisy or clean? How are labels derived from multiple noisy labels? The description of data annotation process is detailed in this part. Including details at the data annotation process in network reports is useful for network dataset consumers who would like to use the labels.
5.2.5. Annotator Demographics
What are the demographic characteristics of the annotators? Possible demographic information include but not limited to age, gender, race/ethnicity, socioeconomic status, native language, and expert level. In social networks measured using surveys or questionnaire, subjectivity is a notable source of error when measuring network structure (Newman, 2018), especially when respondents give ambiguous answers and some interpretation is required to decide what those answers mean. Annotators’ native language could impact converting qualitative answers to quantitative metrics. To curate a knowledge graph of political data, annotators’ demographics information could influence their political stands, thus resulting in disputable annotations. Expertise level matters for domain-specific network annotations. For instance, domain experts need to perform biology experiments to annotate whether a protein-protein interaction network is an enzyme. The annotator demographics could help network dataset consumers assess the quality of the annotations and potential sources of errors.
5.3. Uses
This section allows network dataset consumers to quickly grasp what the dataset
should and should not be used for. We include three parts: primary use and other uses. We understand that the use space of the network dataset could be huge, and it is impossible to list every use case. We encourage network dataset providers to list typical ones in this section.
Primary intended uses:
This part details the use cases and tasks that the network dataset providers have in mind when creating the dataset.
For machine learning datasets, this part should include the task type (e.g., classification, regression), task category (e.g., node, link or graph) and the evaluation metric(s) for the task.
When there are no particular tasks for network dataset providers (e.g., A social network company releases part of the user network data to the public), the primary intended uses could be broad.
Other uses:
This part details the potential uses cases of the network dataset. Examples include offline anomaly detection on a streaming network dataset, benchmarking HPC platforms on an online social network dataset, etc.
5.4. Network Statistics
This section includes point statistics and distributions of the network(s). The complex structure of networks makes it hard for people to understand whether the dataset is appropriate for their tasks by eyeballing the plain text description, a small subset (e.g., the egonet of one node), or one network plot. Network statistics could partially reveal such complexity with a few numerical values and visualizations of a few distributions. This section is inspired by the electronics industry, where standard characteristics (e.g., operating temperature) shown by numerical values and visualization of essential properties (e.g., time vs. frequency) are available in datasheets (Passive Components, 2007). The electronics industry set such standards because small deviations that may seem insignificant can have severe consequences for the system as a whole (Gebru et al., 2018). However, the generative process of networks is even more complex, as the same configuration in graph models could result in significantly different networks. Similar to the datasheet in the electronics industry, we propose that a network report includes point statistics and visualizations. We list point statistics in Section 5.4.1, where each measure is a numerical value. We list distributions in Section 5.4.2, where visualization of distributions are shown.
Given the rich literature in network science, numerous statistical properties could be included in this section. We design the list through our formative interview, runtime concerns and diversity concerns. We prefer fundamental, well-studied measures over complex, domain-specific ones. Practically, network datasets could be massive (e.g., a billion nodes). Thus computationally heavy properties (yet important) like betweenness centrality and diameter are not included in the list, as both of the properties involve calculating the shortest paths of all pairs of nodes. We also prefer statistical properties that can cover diverse aspects of networks. Thus we choose point statistics and distributions that can cover (i) node and edge characteristics (size, degree, attributes); (ii) spectral properties (spectral radius, algebraic connectivity, singular value distribution, pagerank distribution); and (iii) network cohesion (connected components, average clustering coefficient, clustering coefficient distribution, degree assortativity coefficients, max k-core). Those point statistics and distributions could reveal fundamental phenomenons of the underlying graph (e.g., the scale-free property, the small-world phenomenon).
Visualizations help network dataset consumers to understand distributions. Patterns in the visualization reveal the dynamics of the network. Abnormal patterns in the visualization (e.g., a spike) could help network dataset consumers understand the networks’ anomalies and further infer whether the anomalies would influence their tasks. We discuss common practices of visualizing network statistics in Section 5.4.2.
5.4.1. Point statistics
: Point statistics map a network’s structure to a simple numerical space. For a multi-network dataset, network dataset providers can provide the average (and standard deviation) point statistics of all the networks in the dataset. Other point statistics beyond our list are also encouraged (e.g., structural balance for signed networks).
Number of nodes () and number of edges () describe the size of the network. Network dataset consumers can roughly understand how much computation resources are necessary for processing the network.
Proportion of nodes in the largest connected component reveals the basic network connectivity. For directed networks, both weakly connected and strongly connected components should be considered.
Average degree () is defined as , where the function denotes a degree measure (e.g., in degree) of a node. For undirected networks, . For directed networks, the average out degree equals the average in degree, and both can be calculated as It quantifies the extent to which a node is connected to other vertices within the network.
(Tail) power-law exponent () characterizes the degree distribution of the network. Many networks follow a degree distribution power law, i.e., the number of nodes with degree is proportional to the power , for a constant larger than one. There are multiple ways of estimating , we recommend estimating using the robust method defined as where denotes the minimal degree (Newman, 2018). For networks that do not follow a power-law degree distribution, network dataset providers can indicate N/A for this item. N/A also informs network dataset consumers that the dataset is not scale-free.
Spectral radius () and Algebraic connectivity () reveal mathematical properties on graph spectrum. Let be the (real or complex) eigenvalues of . Then . Algebraic connectivity is the second smallest eigenvalue of .
Average triangle count () counts how many triangles one node is involved in. Triangles have been used in spam detection, link recommendation, and graph random graph models, etc (Tsourakakis, 2010). We recommend to calculate it as , because it is independent of the orientation of edges when the network is directed. Here
Average clustering coefficient () quantifies the extent to which pairs of nodes with a common neighbor are also themselves neighbors. It extends the triangle count of a node by normalizing the triangle count with the number of pairs of nodes in its neighbourhood. It is used as an indicator of “structural holes” in a network, which has rich applications in social networks (Newman, 2018). As betweenness centrality (BC) is computationally intensive, average clustering coefficient can also be thought of as akin. Betweenness measures a node’s control over information flowing between all pairs of nodes in its component, while clustering clustering is a local version of betweenness that measures control over flows between just a node’s immediate neighbors (Newman, 2018). Mathematically, it can be calculated as .
Degree assortativity coefficient () quantifies the extent to which connected nodes have similar degrees. It is the Pearson correlation between the degree of connected nodes. Mathematically, it can be calculated as . Besides, network dataset providers can also provide assortativity mixing by other measures of interests (e.g., Pearson correlation between the attribute of connected nodes). Some technologies related to networks such as graph convolution neural networks would fail if the network is not near homophily (i.e., connected nodes are similar) (Kipf and Welling, 2017), thus providing one measure of homophily could help prevent misuse of those network technologies.
Max -core () is the maximum such that core exists in the network, and a core is the maximal subgraph where all vertices have degree at least . core has been applied to diverse areas such as hierarchical structure analysis, network visualization and network clustering (Shin et al., 2016). Max core also provides the upper bound for max clique (i.e., another important structure in networks).
5.4.2. Distributions of node/edge statistics and attributes
We now discuss the distributions in network report and common design choices for visualization. For a multi-network dataset, network dataset providers can treat the dataset as a whole network, where each component is one network inside the dataset.
Degree distribution (): The degree distribution is typically a skewed distribution, as there are more small-degree nodes than large-degree nodes. If the tail degree distribution follows a power law, then it’s typical to plot degree distributions on a log-log scale (i.e., both axes have a logarithmic scale) (Newman, 2018). Histograms, line charts and point charts are common encoding choices. Histogram involves binning, and inappropriate binning can hide the trend in the data. For simplicity, we recommend point charts or line charts with degree on the x-axis and frequency (or probability mass function, or inverse cumulative distribution function 111Let be a random variable with cumulative distribution function (CDF) . The inverse CDF is defined as (Wasserman, 2004).) on the y-axis.
Pagerank distribution () (Page et al., 1999): Pagerank distribution can be thought of as an extended form of degree distribution, which considers how many neighbors a node has and how important those neighbors are. It can be calculated as where . Given its similarity to degree distribution, similar design choices in axes (e.g., log-log scale for scale-free networks) could be used. One significant difference is that pagerank is a continuous variable, while degree is a discrete variable, where the value is an integer at most the max degree. So we recommend point charts or line charts with pagerank value on the x-axis and inverse cumulative distribution function on the y-axis.
Singular value () (or eigenvalue ()) distribution: Singular values (and eigenvalues) reveal the spectral properties of the graph. Spectral graph properties have broad applications in graph partitioning (clustering, community detection), dynamical systems (Newman, 2018). There are variations of graph matrices (, , ) and spectral decomposition (eigenvalue decomposition, singular value decomposition, ) that characterize spectral properties. One common way to reveal the graph spectrum is to use the eigenvalues of the adjacency matrix (Newman, 2018). However, for directed graphs, the eigenvalues are complex numbers, which brings additional difficulty in visualization. We recommend using the singular values of the adjacency matrix, which bypasses the complex number problem, and gives a unified view on both undirected and directed networks. Calculating the exact solution of all singular values is computationally expensive, so we recommend computing the approximate top-k singular values. The distribution can be plotted as a line chart or a point chart can be the encoding choices.
Clustering coefficient distribution (): Clustering coefficient (i.e., local clustering coefficient) is the fraction of pairs of neighbors of node that are themselves neighbors. , Clustering coefficient distribution is closely related to the small-world phenomenon of real-world networks (Watts and Strogatz, 1998). It is a continuous variable with values between 0 and 1. A common practice to visualize clustering coefficients as a cumulative distribution function on points or lines with linear scales (Newman, 2018).
Node attributes: For a quantitative attribute, a common practice is to use histograms. For an ordered attribute, a bar chart can be used to show the frequency of each category. For a categorical attribute, network dataset providers can use a bar chart to indicate the frequency of each category, and arrange the categories according to the frequency. Horizontal bar charts make it easier to have readable labels than vertical bar charts. If there are too many categories, one typical practice is to list top-k categories in the bar charts, and use ‘others‘ to indicate the remaining categories.
Edge attributes: Visualization of an edge attribute is similar to that of a node attribute for a quantitative/ordered/categorical one. For temporal networks, where each edge contains a timestamp, we commend a line plot with the relative time stamp on x-axis and number of edges within a fixed time window on the y-axis.
6. Implementation Consideration
The first and primary consideration for implementing network report is the time cost. Documentation could be a burden (Miceli et al., 2021). We analyze the time cost of the network report in terms of objective information (Network Statistics) and subjective information (Curation Rationale; Dataset Collection, Preprocessing and Annotation; Uses). The contents of subjective information require input from people, while the objective information could be automatically created. For large organizations, standard internal software could be adopted to automatically create the objective information. The software could also be tailored for the organization’s design style in visualization, graph storage infrastructure, network analysis tools, etc. If there is a centralized platform to submit datasets, certain checks could be automated when submitting the datasets, similarly to CI checks on software repositories. For small organizations or individuals, spending a significant time developing standard software could be overwhelming. Network dataset providers could write code for the dataset in an ad-hoc manner. Nevertheless, if the dataset would update frequently, the code could be reused over time. As researchers in the network field, one of the authors spent around 2.5 hours creating the objective information in an ad-hoc manner and around 1 hour creating the subjective information. When the author started to create more network reports for other datasets, she improved the code to maximize code reuse. We make our code publicly available for reference (https://tinyurl.com/mwwunkae). Compared with the time overhead in data collection and processing, we believe this time for documentation is appropriate.
The second concern is information availability. A lot of network datasets are not created ‘from the ground up’ (Gebru et al., 2018) (such as those in TUDataset (Morris et al., 2020)), so it is hard to gather all the necessary information. In this case, network dataset providers should explicitly indicate Unknown (as opposed to skipping it). Besides, some of the demographic information, such as gender, is sensitive. Following a similar concern in model cards, we encourage network dataset providers to use self-identified labels or using labels clearly designated as perceived (as opposed to self-identified) (Mitchell et al., 2019). Looking forward, efforts aimed at collecting fined-grained information and annotation should serve as a key step to strengthen fairness, accountability, and transparency in network technology.
The third concern is how to encourage implementing network reports. Publication venues related to networks could encourage the community to release a network report alongside new datasets. Excitedly, “Datasets and Benchmarks Track” in NeurIPS 2021 enforces dataset documentation and intended uses accompanying the main paper, and recommends authors to follow existing frameworks such as Datasheets (Gebru et al., 2018), Data Statements for NLP (Bender and Friedman, 2018), and Nutrition Label (Holland et al., 2018). Microsoft, Google, and IBM are adopting similar reports for general AI datasets (Gebru et al., 2018). Besides, funding agencies could require network reports in data management plans. We believe that the network report is a good complement for the above efforts in reporting datasets. Ultimately, implementing network report can dramatically improve the utility of the datasets for others, and benefit both direct stakeholders (e.g., application developers, funding agencies) and indirect stakeholders (e.g., users of recommender systems).
7. Initial User Study
7.1. Study Design
We conducted an initial qualitative user study to explore the functionality of the network report in an academic environment. We hypothesized that network reports facilitate dataset communication and paper understanding.
Datasets and Paper We used the paper “Higher-Order Label Homogeneity and Spreading in Graphs”, and the POKEC dataset (Eswaran et al., 2020). This version of POKEC dataset was built on top of the original POKEC dataset present in (Takac, 2012). This mimics a common academic scenario, where datasets augment other datasets.
Study Protocol Each session began with a 15-minute tutorial on the main idea of the paper. We then asked participants to read the dataset description, followed by the network report in Figure 4. After that, we asked them to read through the experimental result section in the paper. During the study, we answered questions regarding the paper, but we did not answer questions regarding the dataset. Finally, we did an semi-structured checkout interview. Audio was recorded via Zoom.
Participants We recruited 6 participants (3 females, 3 males), all graduate students (1 MS, 5 PhD), with prior ML experience. 4/6 participants have research experience in networks. 2/6 participants have industrial experience related to network data. One of the participants had a hard time understanding the paper, so we discarded this session in analysis.
7.2. Analysis & Results
After transcribing the interviews, two of the authors did a line-by-line open coding on one transcript and produced a coding guide. Then the two authors coded separately on all transcripts, and discussed the codes to produce the results.

7.2.1. Gain deeper understanding of academic papers
We found that all participants have expressed difficulty in understanding network datasets under academic scenarios. P3 mentioned that “it’s hard to mentally visualize the dataset by just reading the description in the paper”. 4/5 participants mentioned that the network report helps them verify assumptions of a given paper on the dataset. During the study, all participants have attempted to explain the experimental phenomenon with the information in the network report. Participants either confirmed that the dataset aligns with the paper’s assumption, or started to critique the assumption. P3 said that “All [the network report] helps is explaining why this algorithm may succeed because it gives you a visual description of the dataset”. We also found that providing the network report with the paper could drive people to think critically about the data and the paper. P4 said that “If there are some ways for me to look at the stats, and how they differ from what I normally expect, probably I would look deeper into the dataset to see if there are some issues in the data generation pipeline.” P4 subsequently mentioned that he would not check the assumptions unless he had the report.
7.2.2. Build trust in academic papers
3/5 participants mentioned trust in academic papers in the network domain. P3 said that “if a paper is claiming things, then I would like to look at some statistics around the claimed things, which are not in the paper”. P5 said that “people don’t want to explain [datasets] more, or don’t want to waste paper real estate to speak about basic stats, like the network report, so I have hard time in paper understanding”. 2/5 participants mentioned that documentation like network reports are important for building trust especially when the data is not publicly available.
7.2.3. Create a structured channel to communicate network datasets
All participants mentioned that the network report helps people communicate network datasets. P5 emphasized that it creates transparency, and said that “There are a thousand ways that I could construct a graph from […] data. Whatever format I am deciding on, I should explain what I have done in detail and the rationale for why I have done it. Otherwise, it seems not genuine enough. And I think it is a great step towards more transparency in the network domain, which is needed. ” 3/5 participants said that the network report allows for comparison and using data from other domains. 4/5 participants mentioned that the network report saves researchers’ time. P3 said that “Section 3 (Dataset Collection, Preprocessing and Annotation) is useful to me. … I didn’t think of [network sampling and data filtering] until I saw it.” P1 said that “[The network report] saves time. … And if you have a bunch of [network datasets], and you are deciding which dataset to use for your own research. And you can go to the uses section, and the data collection section, and find out which one is most specific to me. ”. 2/5 participants mentioned that they would open a Jupyter notebook to make some visualizations, so the section of Network Statistics is very useful. As participants find almost all sections of the network report useful, we conclude that the network report creates a structured way to communicate network datasets.
7.3. Limitations
The qualitative study was conducted in an academic environment, so the above results and analysis may bias towards academic use cases. As the user study is an initial study to explore the functionality and usability of the network report, it is not intended to be a complete evaluation of the network report.
8. Discussion and Conclusion
We have proposed the network report as a structured template to report information about network datasets. The network report includes network characteristics, information that captures population, bias and fairness, and detailed data preparation information. Our qualitative study suggests that the network report could help facilitate structured communication between network dataset providers and consumers.
Although network reports are designed to be flexible across different domains and use cases, the usefulness of network reports still relies on the integrity of the creators. In the near term, it is unlikely that the full contents of network reports could be automatically created and standardized to prevent all inappropriate use. We envision a standardized export formats and data loaders for networks accompanying network reports in the future. Besides, network reports are just one approach to increase transparency in network related technologies, which could include, for example, model cards for pre-trained graph neural network models (Mitchell et al., 2019) and vulnerability and robustness testing (Freitas et al., 2021). Future work includes accelerating the creation of network reports, studying how the information in network reports is interpreted and used by different network dataset consumers: researchers, developers, policy makers, etc, and how network reports could be integrated with other transparent tools.
References
- (1)
- Ahmed et al. (2013) Nesreen Ahmed, Jennifer Neville, and R. Kompella. 2013. Network Sampling: From Static to Streaming Graphs. ArXiv abs/1211.3412 (2013).
- Barabsi (2016) Albert-Lszl Barabsi. 2016. Network Science.
- Bender (2011) Emily M. Bender. 2011. On Achieving and Evaluating Language-Independence in NLP. Linguistic Issues in Language Technology 6 (2011).
- Bender and Friedman (2018) Emily M. Bender and Batya Friedman. 2018. Data Statements for Natural Language Processing: Toward Mitigating System Bias and Enabling Better Science. Transactions of the Association for Computational Linguistics 6 (2018), 587–604.
- Beretta et al. (2018) E. Beretta, Antonio Vetrò, B. Lepri, and Juan Carlos De Martin. 2018. Ethical and Socially-Aware Data Labels. In SIMBig.
- Bernard and Killworth (1977) H. Bernard and P. Killworth. 1977. INFORMANT ACCURACY IN SOCIAL NETWORK DATA II. Human Communication Research 4 (1977), 3–18.
- Blommaert et al. (2020) L. Blommaert, Roza Meuleman, Stefan Leenheer, and Anete Butkevica. 2020. The gender gap in job authority: Do social network resources matter? Acta Sociologica 63 (2020), 381 – 399.
- Blondel et al. (2008) V. Blondel, Jean-Loup Guillaume, R. Lambiotte, and E. Lefebvre. 2008. Fast unfolding of communities in large networks. Journal of Statistical Mechanics: Theory and Experiment 2008 (2008), 10008.
- Bose and Hamilton (2019) A. Bose and William L. Hamilton. 2019. Compositional Fairness Constraints for Graph Embeddings. In ICML.
- Buolamwini and Gebru (2018) Joy Buolamwini and Timnit Gebru. 2018. Gender Shades: Intersectional Accuracy Disparities in Commercial Gender Classification. In FAT.
- Cheng et al. (2018) Hongju Cheng, Da quan Feng, Xiaobin Shi, and Chongcheng Chen. 2018. Data quality analysis and cleaning strategy for wireless sensor networks. EURASIP Journal on Wireless Communications and Networking 2018 (2018), 1–11.
- Eswaran et al. (2020) Dhivya Eswaran, Srijan Kumar, and Christos Faloutsos. 2020. Higher-Order Label Homogeneity and Spreading in Graphs. Proceedings of The Web Conference 2020 (2020).
- Fan et al. (2007) Ying Fan, M. Li, P. Zhang, Jinshan Wu, and Z. Di. 2007. The effect of weight on community structure of networks. Physica A-statistical Mechanics and Its Applications 378 (2007), 583–590.
- Fisher (2019) Joseph Fisher. 2019. Measuring Social Bias in Knowledge Graph Embeddings. ArXiv abs/1912.02761 (2019).
- Freitas et al. (2021) Scott Freitas, Diyi Yang, Srijan Kumar, Hanghang Tong, and Duen Horng Chau. 2021. Graph Vulnerability and Robustness: A Survey. ArXiv abs/2105.00419 (2021).
- Gebru et al. (2018) Timnit Gebru, Jamie H. Morgenstern, Briana Vecchione, Jennifer Wortman Vaughan, H. Wallach, Hal Daumé, and Kate Crawford. 2018. Datasheets for Datasets. ArXiv abs/1803.09010 (2018).
- Geiger et al. (2020) R. Geiger, Kevin Yu, Yanlai Yang, Mindy Dai, Jie Qiu, Rebekah Tang, and Jenny Huang. 2020. Garbage in, garbage out?: do machine learning application papers in social computing report where human-labeled training data comes from? Proceedings of the 2020 Conference on Fairness, Accountability, and Transparency (2020).
- Gjoka et al. (2010) Minas Gjoka, M. Kurant, C. Butts, and A. Markopoulou. 2010. Walking in Facebook: A Case Study of Unbiased Sampling of OSNs. 2010 Proceedings IEEE INFOCOM (2010), 1–9.
- Hameed and Hasso (2020) M. Hameed and Hasso. 2020. Data Preparation: A Survey of Commercial Tools.
- Hind et al. (2019) M. Hind, S. Mehta, A. Mojsilovic, R. Nair, K. Ramamurthy, Alexandra Olteanu, and K. Varshney. 2019. Increasing Trust in AI Services through Supplier’s Declarations of Conformity. IBM J. Res. Dev. 63 (2019), 6:1–6:13.
- Holland et al. (2018) Sarah Holland, A. Hosny, Sarah Newman, Joshua Joseph, and Kasia Chmielinski. 2018. The Dataset Nutrition Label: A Framework To Drive Higher Data Quality Standards. ArXiv abs/1805.03677 (2018).
- Hu et al. (2020) Weihua Hu, Matthias Fey, M. Zitnik, Yuxiao Dong, H. Ren, Bowen Liu, Michele Catasta, and J. Leskovec. 2020. Open Graph Benchmark: Datasets for Machine Learning on Graphs. ArXiv abs/2005.00687 (2020).
- Hutchinson et al. (2021) B. Hutchinson, A. Smart, A. Hanna, Emily L. Denton, Christina Greer, Oddur Kjartansson, P. Barnes, and Margaret Mitchell. 2021. Towards Accountability for Machine Learning Datasets: Practices from Software Engineering and Infrastructure. Proceedings of the 2021 ACM Conference on Fairness, Accountability, and Transparency (2021).
- Joyce and Herrmann (2018) T. Joyce and J. Herrmann. 2018. A Review of No Free Lunch Theorems, and Their Implications for Metaheuristic Optimisation.
- Jumper et al. (2021) J. Jumper, Richard Evans, A. Pritzel, Tim Green, Michael Figurnov, O. Ronneberger, Kathryn Tunyasuvunakool, Russ Bates, Augustin Zídek, Anna Potapenko, A. Bridgland, Clemens Meyer, Simon A A Kohl, Andy Ballard, A. Cowie, B. Romera-Paredes, Stanislav Nikolov, Rishub Jain, J. Adler, T. Back, Stig Petersen, D. Reiman, Ellen Clancy, Michal Zielinski, Martin Steinegger, Michalina Pacholska, Tamas Berghammer, S. Bodenstein, D. Silver, Oriol Vinyals, A. Senior, K. Kavukcuoglu, P. Kohli, and D. Hassabis. 2021. Highly accurate protein structure prediction with AlphaFold. Nature (2021).
- Kaufman et al. (2011) Shachar Kaufman, S. Rosset, and Claudia Perlich. 2011. Leakage in data mining: formulation, detection, and avoidance. In KDD.
- Kipf and Welling (2017) Thomas Kipf and M. Welling. 2017. Semi-Supervised Classification with Graph Convolutional Networks. ArXiv abs/1609.02907 (2017).
- Koren (2009) Y. Koren. 2009. Collaborative filtering with temporal dynamics. In KDD.
- Kurant et al. (2010) M. Kurant, A. Markopoulou, and P. Thiran. 2010. On the bias of BFS (Breadth First Search). 2010 22nd International Teletraffic Congress (lTC 22) (2010), 1–8.
- Landesberger et al. (2011) T. V. Landesberger, Arjan Kuijper, T. Schreck, J. Kohlhammer, J. V. Wijk, Jean-Daniel Fekete, and D. Fellner. 2011. Visual Analysis of Large Graphs: State‐of‐the‐Art and Future Research Challenges. Computer Graphics Forum 30 (2011).
- Leskovec and Faloutsos (2006) J. Leskovec and C. Faloutsos. 2006. Sampling from large graphs. In KDD ’06.
- Leskovec et al. (2007) J. Leskovec, J. Kleinberg, and C. Faloutsos. 2007. Graph evolution: Densification and shrinking diameters. ACM Trans. Knowl. Discov. Data 1 (2007), 2.
- Lin et al. (2014) Tsung-Yi Lin, M. Maire, Serge J. Belongie, James Hays, P. Perona, D. Ramanan, Piotr Dollár, and C. L. Zitnick. 2014. Microsoft COCO: Common Objects in Context. In ECCV.
- Lohr (1999) S. Lohr. 1999. Sampling: Design and Analysis.
- Madaio et al. (2020) Michael A. Madaio, Luke Stark, Jennifer Wortman Vaughan, and H. Wallach. 2020. Co-Designing Checklists to Understand Organizational Challenges and Opportunities around Fairness in AI. Proceedings of the 2020 CHI Conference on Human Factors in Computing Systems (2020).
- Marsden (1990) P. V. Marsden. 1990. NETWORK DATA AND MEASUREMENT. Review of Sociology 16 (1990), 435–463.
- Miceli et al. (2021) Milagros Miceli, Tianling Yang, Laurens Naudts, M. Schuessler, Diana Serbanescu, and A. Hanna. 2021. Documenting Computer Vision Datasets: An Invitation to Reflexive Data Practices. Proceedings of the 2021 ACM Conference on Fairness, Accountability, and Transparency (2021).
- Mislove et al. (2007) A. Mislove, M. Marcon, K. Gummadi, P. Druschel, and Bobby Bhattacharjee. 2007. Measurement and analysis of online social networks. In IMC ’07.
- Mitchell et al. (2019) Margaret Mitchell, Simone Wu, Andrew Zaldivar, P. Barnes, Lucy Vasserman, B. Hutchinson, Elena Spitzer, Inioluwa Deborah Raji, and Timnit Gebru. 2019. Model Cards for Model Reporting. Proceedings of the Conference on Fairness, Accountability, and Transparency (2019).
- Morris et al. (2020) Christopher Morris, Nils M. Kriege, Franka Bause, K. Kersting, Petra Mutzel, and Marion Neumann. 2020. TUDataset: A collection of benchmark datasets for learning with graphs. ArXiv abs/2007.08663 (2020).
- Newman (2003) M. Newman. 2003. The Structure and Function of Complex Networks. SIAM Rev. 45 (2003), 167–256.
- Newman (2018) Mark Newman. 2018. Networks. Oxford university press.
- Newman and Watts (1999) M. Newman and D. Watts. 1999. Renormalization Group Analysis of the Small-World Network Model. Physics Letters A 263 (1999), 341–346.
- Ni et al. (2019) Jianmo Ni, Jiacheng Li, and Julian McAuley. 2019. Justifying Recommendations using Distantly-Labeled Reviews and Fine-Grained Aspects. In EMNLP/IJCNLP.
- Page et al. (1999) Lawrence Page, S. Brin, R. Motwani, and T. Winograd. 1999. The PageRank Citation Ranking : Bringing Order to the Web. In WWW 1999.
- Passive Components (2007) XICON Passive Components. 2007. Miniature Aluminum Electrolytic Capacitors XRL Series. https://www.mouser.com/catalog/specsheets/XC-600178.pdf
- Rubinov and Sporns (2010) M. Rubinov and O. Sporns. 2010. Complex network measures of brain connectivity: Uses and interpretations. NeuroImage 52 (2010), 1059–1069.
- Safavi and Koutra (2020) Tara Safavi and Danai Koutra. 2020. CoDEx: A Comprehensive Knowledge Graph Completion Benchmark. In EMNLP.
- Shin et al. (2016) Kijung Shin, Tina Eliassi-Rad, and C. Faloutsos. 2016. CoreScope: Graph Mining Using k-Core Analysis — Patterns, Anomalies and Algorithms. 2016 IEEE 16th International Conference on Data Mining (ICDM) (2016), 469–478.
- Stoica et al. (2018) Ana-Andreea Stoica, Christopher J. Riederer, and A. Chaintreau. 2018. Algorithmic Glass Ceiling in Social Networks: The effects of social recommendations on network diversity. Proceedings of the 2018 World Wide Web Conference (2018).
- Stumpf et al. (2005) M. Stumpf, C. Wiuf, and R. May. 2005. Subnets of scale-free networks are not scale-free: sampling properties of networks. Proceedings of the National Academy of Sciences of the United States of America 102 12 (2005), 4221–4.
- Takac (2012) Lubos Takac. 2012. DATA ANALYSIS IN PUBLIC SOCIAL NETWORKS.
- Toutanova et al. (2015) Kristina Toutanova, Danqi Chen, P. Pantel, Hoifung Poon, Pallavi Choudhury, and M. Gamon. 2015. Representing Text for Joint Embedding of Text and Knowledge Bases. In EMNLP.
- Traag et al. (2015) V. Traag, R. Aldecoa, and J. Delvenne. 2015. Detecting communities using asymptotical Surprise. Physical review. E, Statistical, nonlinear, and soft matter physics 92 2 (2015), 022816.
- Tsourakakis (2010) Charalampos E. Tsourakakis. 2010. Counting triangles in real-world networks using projections. Knowledge and Information Systems 26 (2010), 501–520.
- Wasserman (2004) L. Wasserman. 2004. All of Statistics: A Concise Course in Statistical Inference.
- Watts and Strogatz (1998) D. Watts and S. Strogatz. 1998. Collective dynamics of ‘small-world’ networks. Nature 393 (1998), 440–442.
- Yang et al. (2018) Ke Yang, Julia Stoyanovich, Abolfazl Asudeh, Bill Howe, H. V. Jagadish, and G. Miklau. 2018. A Nutritional Label for Rankings. Proceedings of the 2018 International Conference on Management of Data (2018).
- Yao and Huang (2017) Sirui Yao and Bert Huang. 2017. Beyond Parity: Fairness Objectives for Collaborative Filtering. In NIPS.
- Ying et al. (2018) Rex Ying, Ruining He, K. Chen, Pong Eksombatchai, William L. Hamilton, and J. Leskovec. 2018. Graph Convolutional Neural Networks for Web-Scale Recommender Systems. Proceedings of the 24th ACM SIGKDD International Conference on Knowledge Discovery & Data Mining (2018).
- You et al. (2018) Jiaxuan You, B. Liu, Rex Ying, V. Pande, and J. Leskovec. 2018. Graph Convolutional Policy Network for Goal-Directed Molecular Graph Generation. In NeurIPS.