The discovery of a rotating radio transient J19180449 with intriguing emission properties with the five hundred meter aperture spherical radio telescope
Abstract
In this study, we report on a detailed single pulse analysis of the radio emission from a rotating radio transient (RRAT) J19180449 which is the first RRAT discovered with the five hundred meter aperture spherical radio telescope (FAST). The sensitive observations were carried out on 30 April 2021 using the FAST with a central frequency of 1250 MHz and a short time resolution of 49.152 s, which forms a reliable basis to probe single pulse emission properties in detail. The source was successively observed for around 2 hours. A total of 83 dispersed bursts with significance above 6 are detected over 1.8 hours. The source’s DM and rotational period are determined to be 116.10.4 pc cm-3 and 2479.210.03 ms, respectively. The share of registered pulses from the total number of observed period is 3.12%. No underlying emission is detected in the averaged off pulse profile. For bursts with fluence larger than 10 Jy ms, the pulse energy follows a power-law distribution with an index of , suggesting the existence of bright pulse emission. We find that the distribution of time between subsequent pulses is consistent with a stationary Poisson process and find no evidence of clustering over the 1.8 h observations, giving a mean burst rate of one burst every 66 s. Close inspection of the detected bright pulses reveals that 21 pulses exhibit well-defined quasi-periodicities. The subpulse drifting is present in non-successive rotations with periodicity of periods. Finally, possible physical mechanisms are discussed.
1 Introduction
Rotating radio transients (RRATs) are characterized by short radio bursts with a typical duration of a few milliseconds. The bursts occur sporadically at irregular and infrequent intervals of minutes to hours, which results in undiscovered periodicities using standard Fourier or periodogram techniques (Keane et al., 2011). The nulling fraction of RRATs can exceed 99 per cent. The dedicated timing observations of the bursts reveal underlying regularity of the order of seconds and they have comparable spin-down rates to canonical pulsars (McLaughlin et al., 2006). The detection of the thermal X-ray spectrum from RRAT J18191458 further illustrates the true nature of the star as a cooling neutron star (Reynolds et al., 2006). The average magnetic fields of RRATs and the averaged period derivatives are higher than those of ordinary pulsars (Cui et al., 2017). The log-normal pulse energy distribution and power-law frequency dependence of the mean flux are both consistent with those for the rotation powered pulsars (Keane & McLaughlin, 2011). However, the nature of RRAT’s emission is still to be fully understood. Potential links between RRATs and the other pulsar populations have been identified. A post-glitch over-recovery in the frequency derivative for RRAT J18191458 was found by Bhattacharyya et al. (2018), which typifies a magnetar. PSR B0656+14 is a nearby middle-aged pulsar with strong pused high-energy emission (Weltevrede et al., 2010). In the radio band, it is possibly classifiable as a RRAT, because the profile instabilities are observed to be caused by very bright and narrow pulses (Weltevrede et al., 2006b). Additionally, RRATs exhibit an extreme nulling phenomenon, staying in the quiet state for most of the time. The high nulling fractions in pulsars are speculated to be more related to large characteristic age than long period (Wang et al., 2007). In order to further probe the connection between RRATs and other neutron star populations and the nature of the emission, the discovery of additional RRATs is required. Since the serendipitous discovery of RRAT in a search for isolated radio bursts in the Parkes multibeam pulsar survey data (McLaughlin et al., 2006), a total of 112 RRATs111http://astro.phys.wvu.edu/rratalog have been detected at constant DM so far with identified periodicities in the range 0.125 7.7 s.
The RRATs were initially thought to be a distinct population of Galactic neutron stars. However, a problem is raised that the Galactic supernova rate appears to be insufficient to account for the inferred number of neutron stars (Keane & Kramer, 2008). An evolutionary link between the whole population of neutron stars was proposed to be satisfactory to resolve this problem (Keane et al., 2011). And the RRATs probably settle into a stable existence on the neutron star evolution. Up to present, the neutron star spin evolutionary framework has not been established. The discovery of additional RRATs help bridge populations in the so-called neutron star zoo in an attempt to understand their origins and evolution. To further reveal the nature of RRAT emission and uncover connections between RRATs and canonical pulsar population, it is also important to investigate their pulse energy distributions, timing periodicities and pulse clustering, microstructure, and subpulse modulation. The radio pulses from RRATs are detected at rates as low as once per three hours to as frequently as one every few minutes (McLaughlin et al., 2006). The question of interest is whether the sources are truly ‘off’ during the rotation periods where the emission ceases suddenly or whether they still have some weak underlying emission. The FAST sensitivity allow for unprecedented potential to discover a substantial proportion of RRATs, and thus shed insight into their physical emission mechanism and the evolutionary paths of neutron stars.
RRAT J19180449 is the first RRAT discovered in the commensal radio astronomy FAST survey (CRAFTS222http://crafts.bao.ac.cn; Nan et al., 2011; Li et al., 2018; Qian et al., 2019; Zhang et al., 2019; Cameron et al., 2020; Cruces et al., 2021; Wang et al., 2021a, b) using a single pulse search technique (Zhu et al., 2014). In this paper, we present the discovery and analysis of the intriguing emission behavior of RRAT J19180449 observed with the FAST, which is organized as follows. The observations are discussed in Section 2 along with description of the data reduction methods. In Section 3, we present the results, namely the determination of the rotational period and dispersion measure from detected bursts, and the analysis of the emission properties. The implication of our findings are discussed in Section 4. Section 5 summarizes the results and discussion.
2 Observations and data processing
RRAT J19180449 was originally discovered with the FAST on 2018 August 9 in the drift-scan survey using a 19-beam receiver to search for bright single pulses. The dispersion measure (DM) was measured to be 119 pc cm-3. The follow-up observations of RRAT J19180449 were carried out with the FAST on 2021 April 30 at 20:37:59 UT using the 19-beam receiver with frequency covering from 1000 to 1500 MHz (Jiang et al., 2020). The orthogonal linear polarizations from all beams were received and amplified using a low-noise cryogenic amplifier in the cabin and then transferred to the control room through fibers. At the control room, the radio frequency signals were down converted using a local oscillator with frequency of 1 GHz, producing intermediate frequency (IF) signals with bandwidth of 500 MHz. The properly-amplified IF signals were then sent to the pulsar machine, which was developed on a ROACH2333https://casper.berkeley.edu/wiki/ROACH2 platform, for further processing. The IF signals were converted into raw voltage signals and digitized using the high speed analog-to-digital converters. The digital signals were then processed on the field programmable gate array (FPGA). Across the entire 500 MHz passband, 1024 frequency channels were produced, using a polyphase filterbank, and correlated to compute the coherency matrices. The channelized data were integrated in time for 49.152 s per spectrum before recording in a search mode PSRFITS format (Hotan et al., 2004) with 8 bit quantization. The source was successively observed for around 2 hours.
In the off-line data processing, the raw filterbank data were initially processed to mitigate spurious radio frequency interference (RFI). Following the technique described by Wen et al. (2021), the bandpass was removed by dividing each sample in a channel by the average value in that channel as calculated over 2 s intervals. The narrowband and broadband RFI was identified and mitigated by deploying the statistical method suggested by ter Veen et al. (2019). Subsequently, incoherent dedispersion was applied to correct for the dispersive delay induced by free electrons on the arrival time of radio waves. To determine the accurate value of DM, a search over this parameter ranging from 100 to 130 pc cm-3 in steps of 0.1 pc cm-3 was performed. Each of these dispersive corrected time series was searched for significant signals above a threshold, over different integration times, using a boxcar profile. The detection threshold was set to be 6, where is the standard deviation.
Since our observations were not absolutely flux calibrated based on a noise generator, to convert our data to a Jansky scale, the flux density () of each burst pulse was estimated using the radiometer equation
| (1) |
where Jy is the system equivalent flux density, is the number of polarizations, s is the integration time, and MHz is the observing bandwidth. It is worth noting that this equation is only applicable for pulses that are longer than the time resolution. Our detection threshold corresponds to a flux density of 54.13 mJy for a minimum signal-to-noise ratio (S/N) of 6.
3 Results
3.1 Burst detection
A total of 83 burst pulses were detected in only a single beam (Beam 15) of the 19-beam receiver using the HEIMDALL single pulse processing software444http://sourceforge.net/projects/heimdall-astro. The remaining 18 beams show no clear candidates, nor RFI around the times of the bursts. Therefore, the precise position of the source cannot be provided by fitting the relative signal strength in each beam to the side-lode pattern of the multiple beams (Ravi et al., 2016). The pointing position of the Beam 15 at the reference epoch with J2000 coordinates is simply derived to be: right ascension = and declination = , according to the angular distance of the beam center to that of the central beam M01 (Jiang et al., 2020). The topocentric arrival times of detected bursts were recorded, along with other properties including S/N, DM, and matched filter width. In order to reject the false positives, a visual inspection was carried out on the generated diagnostic plots.
Figure 1 shows a diagnostic plot, containing a DM versus time color-coded graph (upper-left panel), a S/N versus DM graph (upper-right panel), a waterfall diagram of dedispersed dynamic spectra (middle panel), and a dedispersed time series diagram (lower panel). In DM-time space, a burst is detected as a vertical strip of pulses at multiple DMs ranging from 110 to 120 pc cm-3. The strip is gradually broadening and finally smears out with the DM either increasing or decreasing. The burst is clearly visible in the DM versus time and the S/N versus DM diagrams with maximum S/N around DM of 116.1 pc cm-3, indicating that it is astrophysical. There is no smearing shown in the waterfall image of dedispersed dynamic spectra, which confirms that the value of DM is correct. It is noted that there is no single pulse exhibiting the same narrow-band frequency structure that is shown in FRB 121102 (Gajjar et al., 2018). The lower panel shows its integrated pulse profile after being dedispersed at the optimal DM value. The corresponding flux density scale is applied to the single-pulse time series.
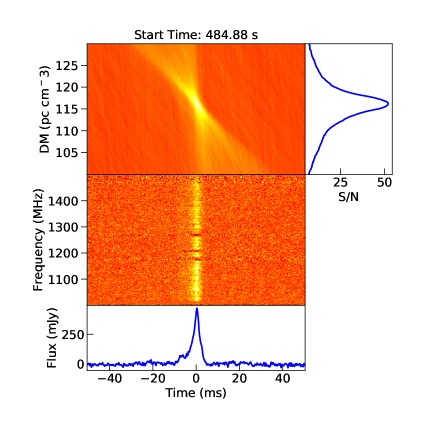
In order to determine the DM of this source, the averaged S/N versus DM diagram is produced by averaging all S/Ns in each DM step of all 83 bursts. The mean value of DM is estimated to be pc cm-3 , which is adopted for dedispersion in the following analysis. The DM-based distance is estimated to be 3.72 kpc from the NE2001 model for the Galactic free electron distribution (Cordes & Lazio, 2002).
3.2 Pulse energy and width
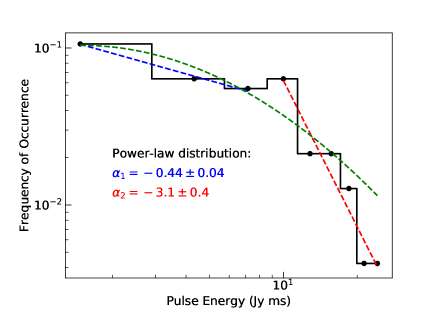
The pulse energy distribution provides a meaningful way to characterize the frequency of occurrence of bursts, as well as a window into the state of the plasma in the pulsar magnetosphere. In order to study the pulse energy distribution, the fluence is measured by integrating all the flux densities within a time interval of each detected burst. The most energetic pulse has a width of 21.09 ms, a fluence of 25.61 Jy ms, and a peak flux density of 453.55 mJy. The fluence distribution of all burst pulses is shown Figure 2. It is evident that a broken power-law fitting is necessary with -square of 0.99. The break of the power-law occurs at 10 Jy ms. The power-law indices of the fluence distribution are determined to be and for low and high energies, respectively. In addition we fit the pulse energy distribution with a pure log-normal model, giving -square of 0.89.
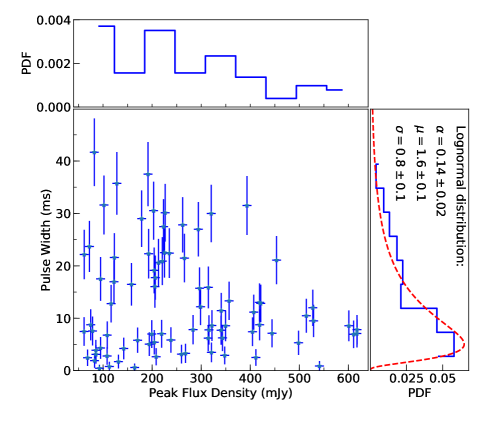
The main panel of Figure 3 shows a scatter plot of peak flux density and the pulse width for all detected bursts. The uncertainty of the peak flux density is estimated using the rms value within the off-pulse window. The probability density function (PDF) for the peak flux densities is shown in the upper panel. The pulse widths are determined by convolving each individual burst with a series of boxcar filters with varying widths. The matched boxcar filter size is calculated as the pulse width when the best fit produces the optimum response. The error of the pulse width is simply determined by the square root of its value. The pulse width PDF is given in the right panel, which clearly presents a logarithmic normal distribution centered at 5.1 ms.
3.3 Waiting-time distribution
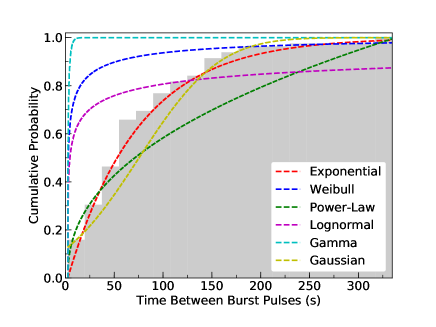
The burst pulses from RRAT J19180449 seem to happen in an irregular fashion. The distribution of intervals between subsequent pulses (wait times) may contain hints to the emission mechanism. Figure 4 shows the cumulative density function of the these wait times. An exponential reduction in the separation time between the pulses is presented, The arrival time separation may follow a Poisson process by assuming that the bursts are mutually exclusive events independent of each other. The probability of a burst occurring in the interval is described as , where is the mean occurrence rate. To quantify the fit, the Kolmogorov-Smirnov statistics (K-S test) of the sample versus its exponential distribution fit is performed. The obtained value is greater than the threshold value of 0.05, which indicates that the observed distribution is consistent with a exponential distribution. The waiting-time distribution is fitted to the exponential model using a least-square fitting method, which is shown in the red dashed curve. The function with an exponential decay with time constant determined to be is in excellent agreement with the observed data. The mean burst rate is estimated to be one burst every 66 s observed above our threshold limit. We also attempt to model this population as a pure Weibull, power-law, Gaussian, log-normal and Gamma, respectively, which cannot describe the observed distribution well. In addition, there is no significant correlation between the wait time and the fluence of the detected pulses, which implies that the emission is not a consequence of the process through which the energy is stored up, such as magnetic recombination in the pulsar magnetosphere (Lyutikov, 2002).
3.4 Rotational period determination
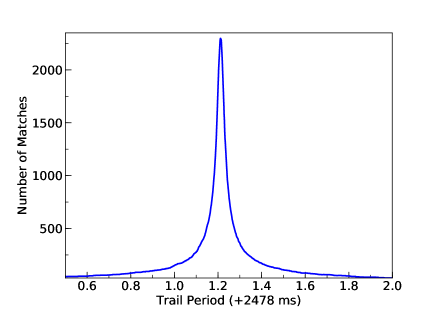
The RRAT emission has an underlying periodicity, even though the interval between individual pulses varies widely. The spin-period of a particular RRAT is generally determined by finding the greatest common denominator of the intervals between pulses. Due to the limited number of pulses, a multiple of the period is generated instead of the true period of the neutron star by using this method. To search for the periodic pulsations from RRAT J19180449 , the burst arrival times are folded and grouped with different periods from 0.1 to 50 s in steps of 0.01 ms using the epoch folding technique described by Leahy et al. (1983). Figure 5 shows the number of matches with tolerance of 10% in phase. It is noticed that a distinct peak is shown at ms, corresponding to the rotational period of the neutron star. The calculated error corresponds to the FWHM of the peak in the periodogram.
3.5 Pulse shapes
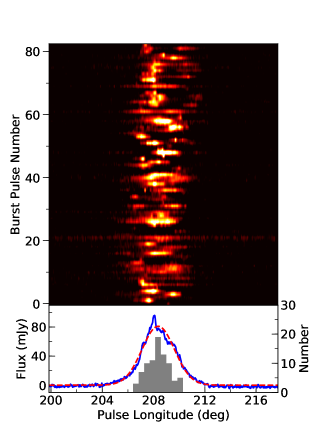
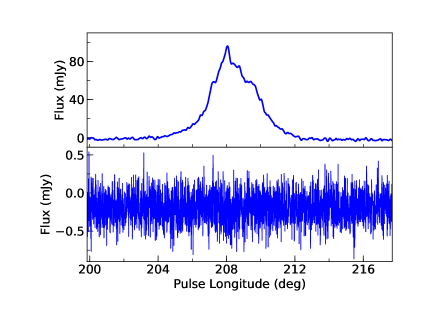
All detected burst pulses from the observations are extracted and folded at the period of 2479.21 ms. The upper panel of Figure 6 displays the individual pulse sequence as a colour-map plot, where the bursts are aligned in longitude. The lower panel shows the histogram of the longitudes of the detected burst pulses superimposed on the average pulse profile by integrating all burst pulses. The pseudo-integrated profile shows the presence of a single component with measured FWMH of 17.450.03 ms (2.5340.004) by fitting with a Gaussian profile. It is noted that the folded profile is not well defined by virtue of a small sample of sporadic bursts. The bursts all fall within the pulsar emission window, with a higher occurrence preferred in the center of the pulse profile. It is essential to confirm whether there are weak pulses with S/Ns lower than the threshold that are not detectable by the single-pulse search pipeline. Figure 7 presents the integrated pulse profiles obtained from all classified bursts and nulls. The weak pulse profile is constructed by subtracting all detected pulses from the composite profile. No emission in the weak pulse profile is detected with significance above 3.
3.6 Microstructure
The average pulse profile in Figure 6 shows no obvious signatures of microstructure at any given longitude, since the averaging process washes out any such structure that can be seen in individual pulses. The sensitive observations with sufficiently high time resolution are performed with FAST, forming a reliable basis for detection of micropulses. As shown in the upper panel of Figure 6, the presence of some pulses with narrow bursty features is evident. The structure in single pulses varies dramatically on a timescale down to almost the resolution interval from pulse to pulse.
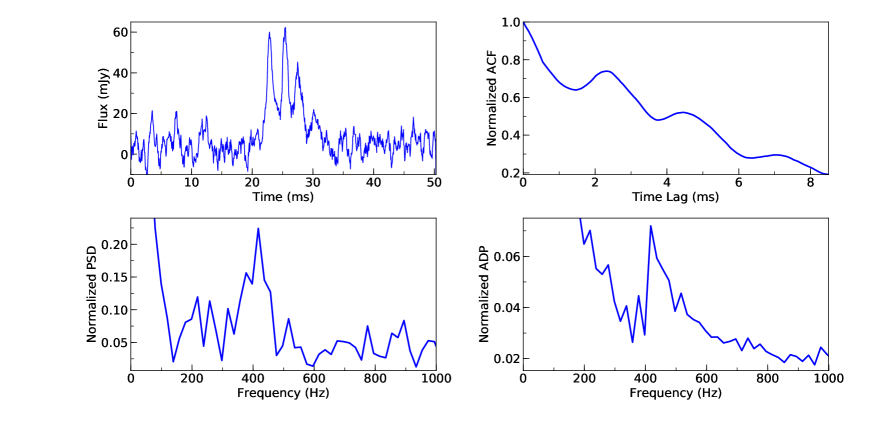
To quantify the characteristic timescales of subpulses and micropulses, the standard analysis procedure is the computation of autocorrelation functions (ACFs) for detected bright pulses. Furthermore, the power spectrum of the data (PSD) and the power spectrum of the ACF derivative (ADP) are calculated to determine quasi-periodicities (Lange et al., 1998). Figure 8 shows a typical example of the microstructure analysis on a detected burst from RRAT J19180449 . The ACF shows a variation in slope at the time lag corresponding to the micropulse width of ms. The typical subpulse width of ms is indicated with a further slope change, that is the second-order turn-off point. The characteristic separation of subpulses of ms, particularly evident for drifting subpulses, is given by the time lag of the peak of a second subpulse feature. The uncertainty of timescales is calculated from the effective time resolution , where s is the dispersion smearing in an interchannel. The feature near zero time lag represents the autocorrelation of the noise relative to the pulsar signal, which decorrelates on an inverse bandwidth time scale. The existence of a quasi-periodicity within the pulse is noticeable as equally spaced peaks in the ACF, the time lag of the first peak indicates the periodicity of ms. Furthermore, the frequency peaks in the PSD and ADP are recorded along with the value found from the ACF analysis.
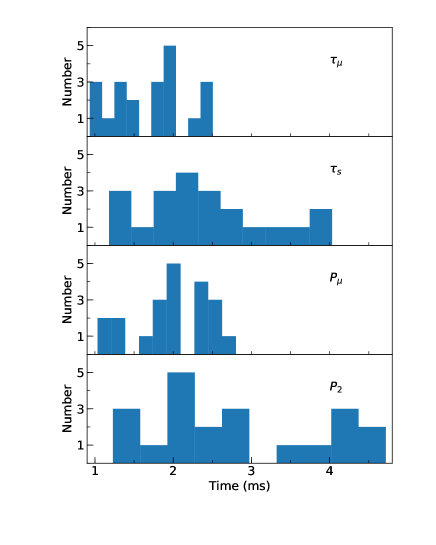
A careful visual inspection of the detected bursts and their corresponding ACF, PSD, and ADP were carried out to decide which of the pulses have periodicities that are strong enough to be evaluated. The quasiperiodic microstructure features are detected in 21 individual pulses. Nevertheless, no preferred width for the micropulses could be obtained from either the averaged ACF or the width histogram. Figure 9 presents the calculated histograms of micropulse width, subpulse width, microstructure quasi-periodicity, and subpulse separation for RRAT J19180449.
3.7 Subpulse drifting
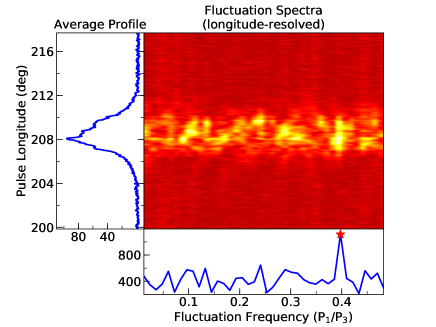
It is well known that at least one-third of the pulsars show systematic drifting of subpulses across the emission window for normal pulse emission (Weltevrede et al., 2006a, 2007). To investigate whether the detected burst pulses from RRAT J19180449 present similar subpulse modulation in a systematic or a disordered fashion, a pulse sequence is artificially formed from the discrete bursts in chronological order. Following the technique described by Backer (1970), the longitude-resolved fluctuation spectra (LRFS) is adopted to characterize the subpulse modulation. The LRFS is computed by performing discrete Fourier transforms over each individual longitude bins. Figure 10 shows the spectral power of fluctuations as a function of rotational longitude. Peak frequency in the fluctuation spectra represents periodicity of subpulse repetition at any given pulse longitude, which is expressed as . It is noted that a distinct region of the LRFS with excess of power is confined in the emission window, which indicates that the bursts from the RRAT is modulated with a frequency of 0.400.01 cycles/period or a cycle of 2.510.06 rotational periods. The periodicity and its corresponding uncertainty are estimated by fitting a Gaussian function with 90% confidence limit on the observed spectral line.
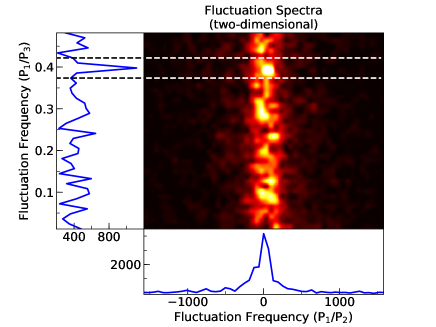
Although, the LRFS is a sensitive method to determine the time-averaged properties of periodic subpulse modulation, it is still in a state of uncertainty whether the above determined modulation is originated from intensity or phase variation. In order to turn uncertainty into reality, the two-dimensional fluctuation spectrum (2DFS) is calculated (Edwards & Stappers, 2002). Following the same procedure used while calculating the LRFS, the two-dimensional discrete Fourier transform is carried out on the emission window (shown in Figure 11). The pattern repetition frequency along the pulse longitude is denoted in the horizontal axis of the 2DFS, which is expressed as . The value of is measured to be infinite since no significant phase offsets corresponding to the peak frequency are presented, which may suggest that the emission is longitude stationary across the pulse window but periodically changes in intensity. Furthermore, the drifting is probably confined within a narrow phase region, which is insensitive to the 2DFS technique. As noted from the analysis of quasi-periodic microstructure, the characteristic separation of subpulses is measured to be 0.650.04 degrees, which is much narrower than the pulse profile.
In order to rule out the possibility that the occasional occurrence of strong subpulses are dominating the spectra and therefore lead to misleading conclusions, a similar method is carried out to further demonstrate the authenticity of periodic fluctuations (Weltevrede et al., 2006a). The order of the pulse sequence is randomized and then the LRFS is calculated from the newly formed pulse stack. No well-defined drifting periodicity in this process is detected in the emission window and noise window, which proves the significance of drift features.
4 Discussion
The sporadic nature of the emission from RRATs remains unclear currently, even several conjectures linked to intermittent pulsars and the nulling phenomenon have been put forward. Li (2006) suggested that RRATs can be extinct pulsars that are re-activated due to the interaction between the neutron star magnetosphere and the fallback of material from a supernova debris disk. The asteroidal or circumpulsar debris that migrates into the pulsar light cylinder before evaporating, ionizing, and perturbing particle acceleration regions can disrupt current flows and electromagnetic radiation (Cordes & Shannon, 2008). Alternatively, RRATs are proposed to represent an extreme form of pulse nulling within the framework of the standard canonical pulsar model (Wang et al., 2007). A sharp change in the primary plasma density or the conditions of emission propagation in the magnetosphere is proposed to be responsible for the character of RRAT emission (Timokhin, 2010). It is shown that the profile changes are accompanied by changes in the spin-down rate of the pulsar (Kramer et al., 2006), which further indicates the global changing in the magnetospheric configuration.
In the context of the general pulsar population, examples of clustering have been noted for nulling (Redman & Rankin, 2009), mode changing(Wen et al., 2020) and bright pulses (Wen et al., 2021). Additionally, the waiting-time distribution of FRB 121102 is well described by a Weibull distribution (Oppermann et al., 2018) as well, it is not as apt for the RRAT wait-time distributions. The single-pulse emission is produced by a pure random process for RRATs J1913+1330 (Shapiro-Albert et al., 2018) and J23250530 (Meyers et al., 2019), which are reasonably consistent with what we find for RRAT J19180449 . However, it is unclear whether this is the case for RRAT emission in general due to the limited number of single-pulse detections.
Generally, the pulse energy distribution is considered as a useful metric for comparing different pulsar emission modes. The standard pulsar emission often results in log-normal distributions (Burke-Spolaor et al., 2012), while the so-called giant radio pulses (GRPs) exhibit power-law distributions and are thought to be originated from a different emission mechanism (Cordes et al., 2004). Cui et al. (2017) found that the single-pulse amplitude distributions of RRATs could be described by either a log-normal, or a log-normal plus a power-law tail. The constructed energy distribution of detected bursts for RRAT J19180449 shows a broken power-law distribution. Considering the small sample of single pulses, we are unable to draw concrete conclusions. Ignoring the fact that the fluence cut-off is employed, the measured power-law index is similar to that seen for Crab GRPs (Bhat et al., 2008). However, the Crab GRPs are constrained in a narrow longitude range with timescales on the order of a few microseconds and structure down to 10 ns (Hankins et al., 2003), which do not follow the values found for RRAT J19180449 . We conclude that RRAT emission is not consistent with Crab GRP emission.
The rapid intensity fluctuations indicates a fundamental integral feature of pulsar radio emission (Rickett et al., 1975). The investigation of micropulses and their quasi-periodicities are helpful to understand pulsar magnetospheric geometry and the longitudinally modulated emission pattern (Benford, 1977). The periodic effects may arise in the production and acceleration of charged particles at the stellar surface (Cheng & Ruderman, 1980). Harding & Tademaru (1981) proposed that the quasi-periodicity in the microstructure is the result of radiative transfer effects in the magnetosphere. An evident dependence between the pulsar rotational period and the micropulse width is identified, which indicates that the microstructure may arise from the sweeping of beams of emission (Kramer et al., 2002).
The phenomenon of subpulse drifting was first noted in the earliest days of pulsar research (Drake & Craft, 1968), which has historically been strongly linked to magnetospheric phenomena, and thence, to the as-yet poorly understood radio emission mechanism. Ruderman & Sutherland (1975) proposed a carousel model in the seminal polar gap theory. The pattern of radio waves are characterized by a set of discrete pockets of quasi-stable electrical activity (sparks) localized very near the pulsar surface. The particles are accelerated through the polar gap region in the sites of sparks, generating the secondary pair plasma. The curvature radiation are produced by an avalanche of secondary particles that stream along the magnetic field lines at relativistic speeds. The electric potential along the magnetic field at the stellar surface are partially screened by the charged particles, which leads to the relative motion of the sparks to the polar gap surface around the magnetic axis. The magnetic azimuthal arrangement of sparks on the polar gap reflects the spatial structure of the emission beam, which is constituted of discrete beamlets. With each rotation, an Earth-bound observer perceives a different intensity pattern as the line of sight cuts through a slightly rotated emission cone. However, the observed drifting in RRAT J19180449 shows the systematic way that subpulses arrive earlier in time than their predecessors (positive drifting in the classification scheme of Basu et al. (2019)) in non-successive rotations. The information regarding the positions of the marching subpulses is somehow stored during the nulls, and it is subsequently used to provide a starting point for the drifting pattern when emission of radio radiation recommences. The persistence of drifting subpulse phase memory observed during pulsar nulling has been noted in several pulsars. Unwin et al. (1978) reported the particular behavior of subpulse phase during pulse nulling observed from PSR B0809+74, in which the remarkable retention through a null of the subpulse phase immediately prior to the onset of nulling. After the null, the emission once again appears in drifting subpulses whose phase is expected for the first null pulse. Such memory behavior is also significant in PSR B003107 with longer nulling duration than PSR B0809+74 Huguenin et al. (1970). For RRAT J19180449 , the pulses are emitted randomly, which implies that the occurrence of bursts is restricted to specific portions of the integrated pulse window by the memory mechanism.
5 Conclusions and summary
We have reported the first RRAT discovery of CRAFTS. RRAT J19180449 has a rotational period of 2479.210.03 ms, and a dispersion measure of 116.10.4 pc cm-3. It is characterized by dispersed radio bursts of prominent duration 5.1 ms with one burst detected about every 1.3 min. Even with the relatively small sample of single pulses presently at our disposal, RRAT J19180449 clearly exhibits many interesting single pulse behaviors, such as exponential waiting-time distribution, quasi-periodic microstructure, and subpulse drifting in non-successive rotations.
The intriguing emission properties presented in RRAT J19180449 indicate that RRATs are not a homogeneous sample, but a mixture of different kinds of pulsars. Further follow-up and multi-wavelength observations are required to carry out an in-depth analysis of the timing, polarization properties of large sample of RRATs, which are vital in understanding the physical emission mechanism. The observations taken over many years has the added benefit of allowing us to obtain statistically significant results on long timescales. The characteristic age, surface magnetic field, spin-down luminosity and precise position will be implied from the timing solutions. The magnetospheric geometries can be constrained through high quality polarimetric profiles.
Acknowledgements
We would like to thank the anonymous referee for providing constructive suggestions to improve the article. This work is partially supported by the National Natural Science Foundation of China (NSFC grant No. U1631106, 11988101, U1838109, 12041304, 12041301, 11873080), the National SKA Program of China (2020SKA0120100), and the Chinese Academy of Sciences Foundation of the young scholars of western (grant No. 2020-XBQNXZ-019). Z.G.W. is supported by the 2021 project Xinjiang uygur autonomous region of China for Tianshan elites. J.L.C. is supported by the Natural Science Foundation of Shanxi Province (20210302123083) and the Scientific and Technological Innovation Programs of Higher Education Institutions in Shanxi (grant No. 2021L470). D.L. is supported by the 2020 project of Xinjiang uygur autonomous region of China for flexibly fetching in upscale talents. W.M.Y. is supported by the CAS Jianzhihua project. H.G.W. is supported by the 2018 project of Xinjiang uygur autonomous region of China for flexibly fetching in upscale talents. We thank members of the Pulsar Group at XAO for helpful discussions. This work made use of the data from the Five-hundred-meter Aperture Spherical radio Telescope, which is a Chinese national mega-science facility, operated by National Astronomical Observatories, Chinese Academy of Sciences. We thank the observers in setting up the observations.
References
- Backer (1970) Backer, D. C. 1970, Nature, 227, 692, doi: 10.1038/227692a0
- Basu et al. (2019) Basu, R., Mitra, D., Melikidze, G. I., & Skrzypczak, A. 2019, MNRAS, 482, 3757, doi: 10.1093/mnras/sty2846
- Benford (1977) Benford, G. 1977, MNRAS, 179, 311, doi: 10.1093/mnras/179.3.311
- Bhat et al. (2008) Bhat, N. D. R., Tingay, S. J., & Knight, H. S. 2008, ApJ, 676, 1200, doi: 10.1086/528735
- Bhattacharyya et al. (2018) Bhattacharyya, B., Lyne, A. G., Stappers, B. W., et al. 2018, MNRAS, 477, 4090, doi: 10.1093/mnras/sty923
- Burke-Spolaor et al. (2012) Burke-Spolaor, S., Johnston, S., Bailes, M., et al. 2012, MNRAS, 423, 1351, doi: 10.1111/j.1365-2966.2012.20998.x
- Cameron et al. (2020) Cameron, A. D., Li, D., Hobbs, G., et al. 2020, MNRAS, 495, 3515, doi: 10.1093/mnras/staa1328
- Cheng & Ruderman (1980) Cheng, A. F., & Ruderman, M. A. 1980, ApJ, 235, 576, doi: 10.1086/157661
- Cordes et al. (2004) Cordes, J. M., Bhat, N. D. R., Hankins, T. H., McLaughlin, M. A., & Kern, J. 2004, ApJ, 612, 375, doi: 10.1086/422495
- Cordes & Lazio (2002) Cordes, J. M., & Lazio, T. J. W. 2002, arXiv e-prints, astro. https://arxiv.org/abs/astro-ph/0207156
- Cordes & Shannon (2008) Cordes, J. M., & Shannon, R. M. 2008, ApJ, 682, 1152, doi: 10.1086/589425
- Cruces et al. (2021) Cruces, M., Champion, D. J., Li, D., et al. 2021, MNRAS, 508, 300, doi: 10.1093/mnras/stab2540
- Cui et al. (2017) Cui, B. Y., Boyles, J., McLaughlin, M. A., & Palliyaguru, N. 2017, ApJ, 840, 5, doi: 10.3847/1538-4357/aa6aa9
- Drake & Craft (1968) Drake, F. D., & Craft, H. D. 1968, Nature, 220, 231, doi: 10.1038/220231a0
- Edwards & Stappers (2002) Edwards, R. T., & Stappers, B. W. 2002, A&A, 393, 733, doi: 10.1051/0004-6361:20021067
- Gajjar et al. (2018) Gajjar, V., Siemion, A. P. V., Price, D. C., et al. 2018, ApJ, 863, 2, doi: 10.3847/1538-4357/aad005
- Hankins et al. (2003) Hankins, T. H., Kern, J. S., Weatherall, J. C., & Eilek, J. A. 2003, Nature, 422, 141, doi: 10.1038/nature01477
- Harding & Tademaru (1981) Harding, A. K., & Tademaru, E. 1981, ApJ, 243, 597, doi: 10.1086/158625
- Hotan et al. (2004) Hotan, A. W., van Straten, W., & Manchester, R. N. 2004, PASA, 21, 302, doi: 10.1071/AS04022
- Huguenin et al. (1970) Huguenin, G. R., Taylor, J. H., & Troland, T. H. 1970, ApJ, 162, 727, doi: 10.1086/150704
- Jiang et al. (2020) Jiang, P., Tang, N.-Y., Hou, L.-G., et al. 2020, Research in Astronomy and Astrophysics, 20, 064, doi: 10.1088/1674-4527/20/5/64
- Keane & Kramer (2008) Keane, E. F., & Kramer, M. 2008, MNRAS, 391, 2009, doi: 10.1111/j.1365-2966.2008.14045.x
- Keane et al. (2011) Keane, E. F., Kramer, M., Lyne, A. G., Stappers, B. W., & McLaughlin, M. A. 2011, MNRAS, 415, 3065, doi: 10.1111/j.1365-2966.2011.18917.x
- Keane & McLaughlin (2011) Keane, E. F., & McLaughlin, M. A. 2011, Bulletin of the Astronomical Society of India, 39, 333. https://arxiv.org/abs/1109.6896
- Kramer et al. (2002) Kramer, M., Johnston, S., & van Straten, W. 2002, MNRAS, 334, 523, doi: 10.1046/j.1365-8711.2002.05478.x
- Kramer et al. (2006) Kramer, M., Lyne, A. G., O’Brien, J. T., Jordan, C. A., & Lorimer, D. R. 2006, Science, 312, 549, doi: 10.1126/science.1124060
- Lange et al. (1998) Lange, C., Kramer, M., Wielebinski, R., & Jessner, A. 1998, A&A, 332, 111
- Leahy et al. (1983) Leahy, D. A., Darbro, W., Elsner, R. F., et al. 1983, ApJ, 266, 160, doi: 10.1086/160766
- Li et al. (2018) Li, D., Wang, P., Qian, L., et al. 2018, IEEE Microwave Magazine, 19, 112, doi: 10.1109/MMM.2018.2802178
- Li (2006) Li, X.-D. 2006, ApJ, 646, L139, doi: 10.1086/506962
- Lyutikov (2002) Lyutikov, M. 2002, ApJ, 580, L65, doi: 10.1086/345493
- McLaughlin et al. (2006) McLaughlin, M. A., Lyne, A. G., Lorimer, D. R., et al. 2006, Nature, 439, 817, doi: 10.1038/nature04440
- Meyers et al. (2019) Meyers, B. W., Tremblay, S. E., Bhat, N. D. R., et al. 2019, PASA, 36, e034, doi: 10.1017/pasa.2019.30
- Nan et al. (2011) Nan, R., Li, D., Jin, C., et al. 2011, International Journal of Modern Physics D, 20, 989, doi: 10.1142/S0218271811019335
- Oppermann et al. (2018) Oppermann, N., Yu, H.-R., & Pen, U.-L. 2018, MNRAS, 475, 5109, doi: 10.1093/mnras/sty004
- Qian et al. (2019) Qian, L., Pan, Z., Li, D., et al. 2019, Science China Physics, Mechanics, and Astronomy, 62, 959508, doi: 10.1007/s11433-018-9354-y
- Ravi et al. (2016) Ravi, V., Shannon, R. M., Bailes, M., et al. 2016, Science, 354, 1249, doi: 10.1126/science.aaf6807
- Redman & Rankin (2009) Redman, S. L., & Rankin, J. M. 2009, MNRAS, 395, 1529, doi: 10.1111/j.1365-2966.2009.14632.x
- Reynolds et al. (2006) Reynolds, S. P., Borkowski, K. J., Gaensler, B. M., et al. 2006, ApJ, 639, L71, doi: 10.1086/502648
- Rickett et al. (1975) Rickett, B. J., Hankins, T. H., & Cordes, J. M. 1975, ApJ, 201, 425, doi: 10.1086/153904
- Ruderman & Sutherland (1975) Ruderman, M. A., & Sutherland, P. G. 1975, ApJ, 196, 51, doi: 10.1086/153393
- Shapiro-Albert et al. (2018) Shapiro-Albert, B. J., McLaughlin, M. A., & Keane, E. F. 2018, ApJ, 866, 152, doi: 10.3847/1538-4357/aae2b2
- ter Veen et al. (2019) ter Veen, S., Enriquez, J. E., Falcke, H., et al. 2019, A&A, 621, A57, doi: 10.1051/0004-6361/201732515
- Timokhin (2010) Timokhin, A. N. 2010, MNRAS, 408, L41, doi: 10.1111/j.1745-3933.2010.00924.x
- Unwin et al. (1978) Unwin, S. C., Readhead, A. C. S., Wilkinson, P. N., & Ewing, W. S. 1978, MNRAS, 182, 711, doi: 10.1093/mnras/182.4.711
- Wang et al. (2007) Wang, N., Manchester, R. N., & Johnston, S. 2007, MNRAS, 377, 1383, doi: 10.1111/j.1365-2966.2007.11703.x
- Wang et al. (2021a) Wang, S., Zhu, W.-W., Li, D., et al. 2021a, Research in Astronomy and Astrophysics, 21, 251, doi: 10.1088/1674-4527/21/10/251
- Wang et al. (2021b) Wang, S. Q., Wang, J. B., Wang, N., et al. 2021b, ApJ, 922, L13, doi: 10.3847/2041-8213/ac365c
- Weltevrede et al. (2006a) Weltevrede, P., Edwards, R. T., & Stappers, B. W. 2006a, A&A, 445, 243, doi: 10.1051/0004-6361:20053088
- Weltevrede et al. (2007) Weltevrede, P., Stappers, B. W., & Edwards, R. T. 2007, A&A, 469, 607, doi: 10.1051/0004-6361:20066855
- Weltevrede et al. (2006b) Weltevrede, P., Stappers, B. W., Rankin, J. M., & Wright, G. A. E. 2006b, ApJ, 645, L149, doi: 10.1086/506346
- Weltevrede et al. (2010) Weltevrede, P., Abdo, A. A., Ackermann, M., et al. 2010, ApJ, 708, 1426, doi: 10.1088/0004-637X/708/2/1426
- Wen et al. (2020) Wen, Z. G., Yan, W. M., Yuan, J. P., et al. 2020, ApJ, 904, 72, doi: 10.3847/1538-4357/abbfa3
- Wen et al. (2021) Wen, Z. G., Yuen, R., Wang, N., et al. 2021, ApJ, 918, 57, doi: 10.3847/1538-4357/ac0e90
- Zhang et al. (2019) Zhang, L., Li, D., Hobbs, G., et al. 2019, ApJ, 877, 55, doi: 10.3847/1538-4357/ab1849
- Zhu et al. (2014) Zhu, W. W., Berndsen, A., Madsen, E. C., et al. 2014, ApJ, 781, 117, doi: 10.1088/0004-637X/781/2/117