Current address: ]Max Planck Institut für Mikrostrukturphysik, Weinberg 2, 06120 Halle, Germany Current address: ]Department of Physics, Birla Institute of Technology, Ranchi 835215 Jharkhand, India
Current address: ]Max Planck Institut für Mikrostrukturphysik, Weinberg 2, 06120 Halle, Germany Current address: ] Key Laboratory of Polar Materials and Devices (MOE), School of Physics and Electronic Science, East China Normal University, Shanghai 200241, China
Hydrogen-impurity induced unconventional magnetism in semiconducting molybdenum ditelluride
Abstract
Layered transition-metal dichalcogenides are proposed as building blocks for van der Waals (vdW) heterostructures due to their graphene-like two dimensional structure. For this purpose, a magnetic semiconductor could represent an invaluable component for various spintronics and topotronics devices. Here, we combine different local magnetic probe spectroscopies with angle-resolved photoemission and density-functional theory calculations to show that 2H-MoTe2 is on the verge of becoming magnetic. Our results present clear evidence that the magnetism can be “switched on” by a hydrogen-like impurity. We also show that this magnetic state survives up to the free surface region, demonstrating the material’s potential applicability as a magnetic component for thin-film heterostructures.
Layered transition-metal dichalcogenides (TMDs) are a promising class of materials featuring interesting optoelectronic, superconducting, catalytic, and topological properties. They can also be exfoliated down to monolayers, making them suitable for potential applications in complex van der Waals (vdW) heterostructures Geim and Grigorieva (2013); Rajamathi et al. (2017). Among the TMDs, polymorphic MoTe2, exhibits a variety of electronic and magnetic properties: Its metallic 1T’ phase turns into a Td-phase at Clarke et al. (1978). The latter is a topological Weyl semimetal that features unconventional superconductivity at low temperature Sun et al. (2015); Qi et al. (2016); Xu et al. (2018). The 2H-phase, the most stable one at ambient conditions, is an indirect band gap semiconductor and has been successfully integrated in transistors and photo-detectors Lezama et al. (2014); Xu et al. (2015); Ding et al. (2018). Moreover, it has been demonstrated that the 2H-phase can be distorted into the 1T’-phase as a function of strain or gate voltage Song et al. (2016); Wang et al. (2017). In addition, room temperature (RT) magnetic hysteresis has been observed for small amounts of vanadium deposited on 2H-MoTe2 Coelho et al. (2019). However, most interestingly, 2H-MoTe2 was shown by muon spin spectroscopy (SR) to be a magnetic semiconductor, exhibiting a long-range magnetic order in the bulk at low temperatures, which was tentatively attributed to Mo anti-site defects Guguchia et al. (2018). However, no other technique has reported such long range magnetic order and the origin of this magnetism remains still unclear. In fact, theoretical calculations also predict that, apart from anti-site defects, hydrogen and transition-metal dopants are able to induce spin polarization in MoTe2 in the monolayer limit Ma et al. (2011); Kanoun (2018). Since a muon can be considered to be a light hydrogen isotope, one possible explanation is that the magnetism observed in SR is not intrinsic, but rather induced by the muon itself. Another important consideration is that in order to exploit these magnetic properties, e.g. in thin-film heterostructures, one should first elucidate their origin and evolution as a function of depth in the vicinity of an interface (with vacuum or other materials).
Here, we address these questions by utilizing complementary local spin probe measurements, with implanted muons, as well as with the host’s 125Te-NMR to reveal the origin of the reported magnetism. We find that while some of the implanted muons, which form a hydrogen-like state in 2H-MoTe2, detect magnetism in this material, 125Te-NMR shows no evidence of any intrinsic magnetic order. These findings were then confirmed by detailed density-functional theory (DFT) calculations, reproducing the experimental 3D electronic band structure. When including isolated hydrogen (i.e., muon like) impurities, the DFT unveils an induced magnetic moment at the impurity. Furthermore, we show that this hydrogen-induced magnetic state remains unchanged towards the crystal surface, establishing 2H-MoTe2 as a switchable magnetic semiconductor by hydrogen doping, thus paving the path towards new possibilities for integrating this intriguing TMD into future applications in thin-film heterostructures.
In order to gain a better understanding of the nature of the previously observed magnetic signal in 2H-MoTe2, we combine different local magnetic spectroscopies, (i) SR which uses individually implanted, spin-polarized muons, stopping at interstitial sites in the lattice, and (ii) 125Te-NMR on the tellurium atoms, intrinsic to the host compound. This is illustrated in Fig. 1(a).
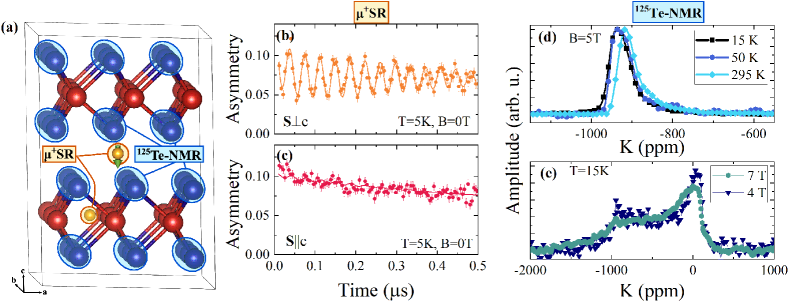
Both the muon and the 125Te nuclei have a spin of and are, therefore, unaffected by quadrupolar interactions and thus act as purely magnetic probes of the system. The 2H-MoTe2 single crystals used in this study were grown by the Chemical Vapour Transport technique, using TeCl4 as the transporting agent. In contrast, the previously studied samples from Ref. Guguchia et al. (2018) were prepared using Te flux. Therefore, we expect the density and nature of native defects in our samples to be different. This subtle difference should affect their magnetic properties, if long-range magnetism were induced by structural defects.
Indeed we observe a coherent precession of the muon spin in zero magnetic field and at low temperature, see Fig. 1(b). However, our SR measurements show identical results to those published earlier, namely yielding the same transition temperature and the same internal magnetic field magnitude. The precession frequency at in Fig. 1(b) corresponds to an internal magnetic field of , consistent with the previously reported value of Guguchia et al. (2018). Additional measurements as a function of temperature and using low-energy muons stopping within from the surface are presented in Supplementary Fig. S8 and show a similar behavior SI . Therefore, the local magnetic properties observed with SR in 2H-MoTe2 are robust and do not change in the near-surface region of the crystals, nor do they depend on the details of the sample synthesis. This is an indication that the previously reported structural defects Guguchia et al. (2018) are unlikely to be the origin of long-range magnetic order.
Furthermore, measurements as a function of the angle between the -axis and initial muon spin polarization, as shown in Fig. 1(b,c), reveal that the internal magnetic field sensed by the muon is oriented along the -axis. A maximal Larmor precession amplitude is detected when the initial muon spin -axis (Fig. 1(b)) while it almost vanishes for -axis (Fig. 1(c)). This is a clear indication that the local magnetic field sensed by the implanted muons points along the crystallographic -axis. A detailed analysis of the full angular dependence between the initial muon spin and the -axis is presented in Supplementary Fig. S6 and supports this conclusion SI .
Contrary to the SR results, we find no signatures of intrinsic magnetism when we investigate 2H-MoTe2 with 125Te-NMR. Example spectra on single crystalline 2H-MoTe2 in a field of are shown in Fig. 1(d). The spectra neither exhibit a significant broadening nor a resonance shift as a function of temperature, which is strong evidence that the 125Te nuclear spin experiences no significant changes in the local spin susceptibility. This is in stark contrast to the typical NMR hallmarks of magnetic ordering, which consist of a temperature-dependent NMR line shift and broadening, caused by the emergence of an internal magnetic field near the magnetic transition, as observed for example in unenriched Fe Budnick et al. (1961) or in the RAlGe material family Tay et al. (2020). Similar distinctive NMR magnetic signatures are also expected for defect-induced magnetism, as has been observed e.g. in the 2D system SiC Zhang et al. (2017).
Furthermore, we exclude the presence of a static magnetic field at the 125Te site, by measuring powder line shapes at in different applied fields, see Fig. 1(e). These spectra are significantly broader than those of single crystals, a broadening which we attribute to an anisotropic chemical shift. However, apart from a small change in the line shape, the line width scales perfectly with the applied field. This lack of field dependence is indicative of the non-magnetic origin of the line broadening, as it excludes the presence of a static internal magnetic field at the 125Te site. Therefore, these results clearly show that an intrinsic spin probe exhibits no evidence of any long-range magnetic order in 2H-MoTe2. This is in clear contrast to our observation with SR and a strong indication that the local static fields observed with muons originate from a muon-induced effect.
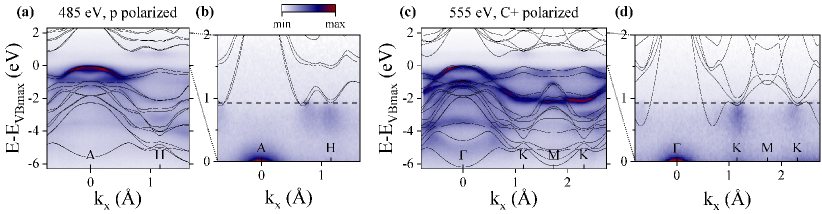
In order to reveal the origin of this effect, we use DFT to calculate the ground state of 2H-MoTe2 and how it is affected by an individual implanted muon. We start by refining our DFT calculation to reproduce the electronic structure of 2H-MoTe2. For this purpose, we determine the three dimensional electronic band dispersion with soft X-ray angle-resolved photoemission spectroscopy (ARPES). Spectra along high symmetry directions at photon energies corresponding to the and A planes are shown in Fig. 2(a-e).
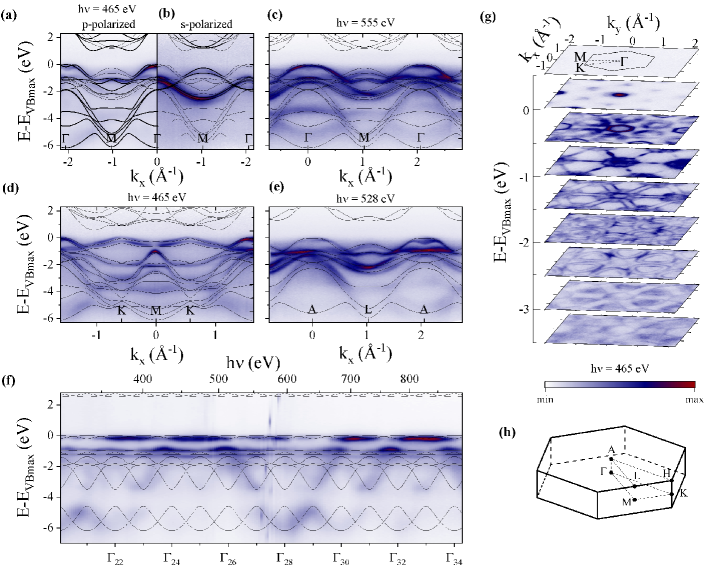
These reveal sharp bands over the whole range of binding energies. We find that the valence band maximum is formed at the point by a band derived from states that are symmetric along . In addition, we measure the band dispersions in along as a function of photon energy (Fig. 2(f)). Along this direction we expect that a two dimensional state forms a flat band with no clear dispersion. In contrast, the dispersive spectral weight in Fig. 2(f) reveals that most bands hybridize across the vdW gap and gain a strong 3D character, despite the 2D layered structure of 2H-MoTe2. Interestingly, the spectral weight exhibits modulations with longer periodicity in than the period of the reciprocal lattice. Such an effect has been previously observed in other 2H-TMDs and is connected with the non-symmorphic symmetry group of the 2H structure of MoTe2 Weber et al. (2018).
We compare the spectral weight in Fig. 2 to the calculated band structure. Note that in general, ab-initio DFT of vdW materials with strong spin-orbit coupling can be misleading, as exemplified by Td-MoTe2, where an on-site correlation term () had to be introduced, to correctly reproduce the experimental results Rhodes et al. (2017); Xu et al. (2018); Aryal and Manousakis (2019). However, our DFT calculations, performed without a term, are in excellent agreement with the experimental bands. This indicates that, unlike Td-MoTe2, in 2H-MoTe2 there are only weak correlations. We further note that there are no signatures of intrinsic magnetism in the calculations of bulk 2H-MoTe2.
By correctly reproducing the 3D band dispersions, we have identified a reliable representation of 2H-MoTe2’s electronic structure and charge density within DFT. We can now employ it to predict the behavior of implanted spin probes, introduced as isolated impurities at interstitial positions within a supercell. We consider two charge states of the muon by adding a charge on the supercell ( for a diamagnetic and for a neutral muon state) Möller et al. (2013); Bernardini et al. (2013). The electrically neutral state of a muon corresponds to a muonium (Mu), a hydrogen-like bound state between a muon and an electron. Figure 3 shows the resulting stable stopping sites and the diffusion energy barrier along the most energetically favorable paths between them.
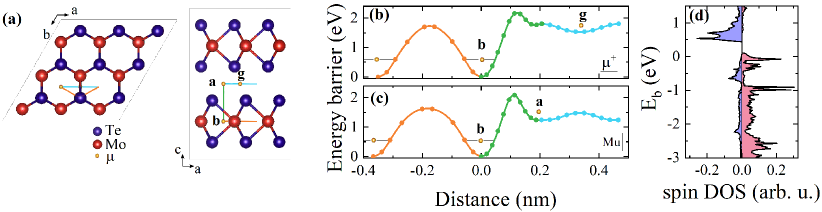
In particular, we find that the diamagnetic has a stable site b (denoted by its Wyckoff letter) inside the Mo-layer and a meta-stable site g in the vdW gap. On the other hand, the neutral muonium state can be stable in b or meta-stable in a.
Finally, we consider Mu- and muon-induced magnetism in these sites. Indeed, for the Mu at the site a, and when employing a finite Hubbard term on the hydrogen (i.e. Mu) potential, a significant spin density is induced in the material, Fig. 3(d), while all other sites remain nonmagnetic (Supplementary Fig. S5) SI . Such muon-induced magnetism is very similar to what was found for hydrogen adsorbed on a monolayer of 2H-MoTe2 or on graphene Ma et al. (2011); González-Herrero et al. (2016). As we discuss in more detail in the Supplementary SI , such a magnetic muonium state is consistent with both the zero-field as well as the transverse field behavior (Supplementary Fig. S7) of the observed SR signals. Therefore, we conclude that the 2H-MoTe2 does not exhibit an intrinsic magnetic order and that the magnetic signal observed with SR originates from a magnetic muonium state in site a. As the muon can be considered a light hydrogen isotope, this induced magnetic state should be the same for a hydrogen atom located at site a.
To conclude, using local magnetic probe measurements, ARPES and theoretical DFT calculations, we are able to reveal that 2H-MoTe2 is a semiconductor on the verge of becoming magnetic. The comparison of the intrinsic 125Te-NMR probe with the implanted muon spin probe confirms that the observed local field in SR does not reflect an intrinsic long-range magnetic order. Instead, we find that the muonium, being a hydrogen-like isolated impurity, can be used to “switch-on” a local magnetic moment in this system.
Importantly, we find that the effect of muonium on the local magnetic properties remains unchanged up to the surface of the crystals. This paves the path towards the use of hydrogen impurities to transform 2H-MoTe2 into a magnetic semiconductor building block for vdW heterostructures. We expect that the use of such a material is not limited to applications in spintronics devices Baltz et al. (2018) but may also include, e.g., Majorana heterostructures Sau et al. (2010) or introduction of magnetic proximity at the surface of topological materials Hesjedal and Chen (2017).
Acknowledgements
This work is partially based on experiments performed at the Swiss Muon Source (SS) and Swiss Light Source (SLS), Paul Scherrer Institute, Villigen, Switzerland. J.A.K. acknowledges support by the Swiss National Science Foundation (SNF-Grant No. 200021_165910). I.P.R. acknowledges support from the Ministry of Education and Science of the Russian Federation within State Task Nr. 0721-2020-0033. The work at the University of Warwick was supported by EPSRC, UK, through through Grants EP/M028771/1 and EP/T005963/1. The magnetization measurements were supported by the Swiss National Science Foundation (SNF-Grant No. 206021_139082). We are grateful to C. W. Schneider for help with single crystal XRD measurements. We thank Z. Guguchia, and S. Holenstein from PSI, CH, and A. Chatzichristos, D. Fujimoto, V. L. Karner, R. M. L. McFadden, J. O. Ticknor, W. A. MacFarlane, and R. F. Kiefl from the University of British Columbia, CA, for helpful discussions. Further, we note that a preliminary version of these results was published as part of a PhD thesis, Ref. Krieger (2020).
References
- Geim and Grigorieva (2013) A. K. Geim and I. V. Grigorieva, Nature 499, 419 (2013).
- Rajamathi et al. (2017) C. R. Rajamathi, U. Gupta, N. Kumar, H. Yang, Y. Sun, V. Süß, C. Shekhar, M. Schmidt, H. Blumtritt, P. Werner, et al., Advanced Materials 29, 1606202 (2017).
- Clarke et al. (1978) R. Clarke, E. Marseglia, and H. P. Hughes, Philosophical Magazine B 38, 121 (1978).
- Sun et al. (2015) Y. Sun, S.-C. Wu, M. N. Ali, C. Felser, and B. Yan, Physical Review B 92, 161107(R) (2015).
- Qi et al. (2016) Y. Qi, P. G. Naumov, M. N. Ali, C. R. Rajamathi, W. Schnelle, O. Barkalov, M. Hanfland, S.-C. Wu, C. Shekhar, Y. Sun, et al., Nature Communications 7, 11038 (2016).
- Xu et al. (2018) N. Xu, Z. W. Wang, A. Magrez, P. Bugnon, H. Berger, C. E. Matt, V. N. Strocov, N. C. Plumb, M. Radovic, E. Pomjakushina, K. Conder, J. H. Dil, J. Mesot, R. Yu, H. Ding, and M. Shi, Physical Review Letters 121, 136401 (2018).
- Lezama et al. (2014) I. G. Lezama, A. Ubaldini, M. Longobardi, E. Giannini, C. Renner, A. B. Kuzmenko, and A. F. Morpurgo, 2D Materials 1, 021002 (2014).
- Xu et al. (2015) H. Xu, S. Fathipour, E. W. Kinder, A. C. Seabaugh, and S. K. Fullerton-Shirey, ACS Nano 9, 4900 (2015).
- Ding et al. (2018) Y. Ding, N. Zhou, L. Gan, X. Yan, R. Wu, I. H. Abidi, A. Waleed, J. Pan, X. Ou, Q. Zhang, et al., Nano Energy 49, 200 (2018).
- Song et al. (2016) S. Song, D. H. Keum, S. Cho, D. Perello, Y. Kim, and Y. H. Lee, Nano Letters 16, 188 (2016).
- Wang et al. (2017) Y. Wang, J. Xiao, H. Zhu, Y. Li, Y. Alsaid, K. Y. Fong, Y. Zhou, S. Wang, W. Shi, Y. Wang, et al., Nature 550, 487 (2017).
- Coelho et al. (2019) P. M. Coelho, H.-P. Komsa, K. Lasek, V. Kalappattil, J. Karthikeyan, M.-H. Phan, A. V. Krasheninnikov, and M. Batzill, Advanced Electronic Materials 0, 1900044 (2019).
- Guguchia et al. (2018) Z. Guguchia, A. Kerelsky, D. Edelberg, S. Banerjee, F. v. Rohr, D. Scullion, M. Augustin, M. Scully, D. A. Rhodes, Z. Shermadini, et al., Science Advances 4, eaat3672 (2018).
- Ma et al. (2011) Y. Ma, Y. Dai, M. Guo, C. Niu, J. Lu, and B. Huang, Physical Chemistry Chemical Physics 13, 15546 (2011).
- Kanoun (2018) M. B. Kanoun, Journal of Alloys and Compounds 748, 938 (2018).
- (16) Additional details are available in the Supplementary Information, containing Refs. Amato et al. (2017); Yaouanc and de Réotier (2011); Suter and Wojek (2012); Prokscha et al. (2008); Eckstein (1991); Harris et al. (2002); Strocov et al. (2010, 2014, 2012); Böker et al. (2001); Kresse and Furthmüller (1996); Kresse and Joubert (1999); Perdew et al. (1996); Möller et al. (2013); Bernardini et al. (2013); Henkelman and Jónsson (2000); Ozaki (2003); Momma and Izumi (2011); Guguchia et al. (2018); Tongay et al. (2012); Ma et al. (2011); González-Herrero et al. (2016); Herak et al. (2013); Patterson (1988); Cox (2003); Tian et al. (2020, 2021).
- Budnick et al. (1961) J. I. Budnick, L. J. Bruner, R. J. Blume, and E. L. Boyd, Journal of Applied Physics 32, S120 (1961).
- Tay et al. (2020) D. Tay, T. Shang, P. Puphal, E. Pomjakushina, H.-R. Ott, and T. Shiroka, Physical Review B 102, 241109(R) (2020).
- Zhang et al. (2017) Z. T. Zhang, D. Dmytriieva, S. Molatta, J. Wosnitza, Y. Wang, M. Helm, S. Zhou, and H. Kühne, Physical Review B 95, 085203 (2017).
- Weber et al. (2018) F. Weber, R. Hott, R. Heid, L. L. Lev, M. Caputo, T. Schmitt, and V. N. Strocov, Physical Review B 97, 235122 (2018).
- Rhodes et al. (2017) D. Rhodes, R. Schönemann, N. Aryal, Q. Zhou, Q. R. Zhang, E. Kampert, Y.-C. Chiu, Y. Lai, Y. Shimura, G. T. McCandless, J. Y. Chan, D. W. Paley, J. Lee, A. D. Finke, J. P. C. Ruff, S. Das, E. Manousakis, and L. Balicas, Physical Review B 96, 165134 (2017).
- Aryal and Manousakis (2019) N. Aryal and E. Manousakis, Physical Review B 99, 035123 (2019).
- Möller et al. (2013) J. S. Möller, D. Ceresoli, T. Lancaster, N. Marzari, and S. J. Blundell, Physical Review B 87, 121108(R) (2013).
- Bernardini et al. (2013) F. Bernardini, P. Bonfà, S. Massidda, and R. De Renzi, Physical Review B 87, 115148 (2013).
- González-Herrero et al. (2016) H. González-Herrero, J. M. Gómez-Rodríguez, P. Mallet, M. Moaied, J. J. Palacios, C. Salgado, M. M. Ugeda, J.-Y. Veuillen, F. Yndurain, and I. Brihuega, Science 352, 437 (2016).
- Baltz et al. (2018) V. Baltz, A. Manchon, M. Tsoi, T. Moriyama, T. Ono, and Y. Tserkovnyak, Reviews of Modern Physics 90, 015005 (2018).
- Sau et al. (2010) J. D. Sau, S. Tewari, R. M. Lutchyn, T. D. Stanescu, and S. Das Sarma, Physical Review B 82, 214509 (2010).
- Hesjedal and Chen (2017) T. Hesjedal and Y. Chen, Nature Materials 16, 3 (2017).
- Krieger (2020) J. A. Krieger, Doctoral Thesis, ETH Zurich (2020), URL https://dx.doi.org/10.3929/ethz-b-000460760.
- Amato et al. (2017) A. Amato, H. Luetkens, K. Sedlak, A. Stoykov, R. Scheuermann, M. Elender, A. Raselli, and D. Graf, Review of Scientific Instruments 88, 093301 (2017).
- Yaouanc and de Réotier (2011) A. Yaouanc and P. de Réotier, Muon Spin Rotation, Relaxation, and Resonance: Applications to Condensed Matter, International Series of Monographs on Physics (OUP Oxford, 2011), ISBN 978-0-19-959647-8.
- Suter and Wojek (2012) A. Suter and B. M. Wojek, Physics Procedia 30, 69 (2012).
- Prokscha et al. (2008) T. Prokscha, E. Morenzoni, K. Deiters, F. Foroughi, D. George, R. Kobler, A. Suter, and V. Vrankovic, Nuclear Instruments and Methods in Physics Research Section A: Accelerators, Spectrometers, Detectors and Associated Equipment 595, 317 (2008).
- Eckstein (1991) W. Eckstein, Computer Simulation of Ion-Solid Interactions, Springer Series in Materials Science (Springer-Verlag, Berlin Heidelberg, 1991), ISBN 978-3-642-73515-8.
- Harris et al. (2002) R. K. Harris, E. D. Becker, S. M. C. d. Menezes, R. Goodfellow, and P. Granger, Magnetic Resonance in Chemistry 40, 489 (2002).
- Strocov et al. (2010) V. N. Strocov, T. Schmitt, U. Flechsig, T. Schmidt, A. Imhof, Q. Chen, J. Raabe, R. Betemps, D. Zimoch, J. Krempasky, et al., Journal of Synchrotron Radiation 17, 631 (2010).
- Strocov et al. (2014) V. N. Strocov, X. Wang, M. Shi, M. Kobayashi, J. Krempasky, C. Hess, T. Schmitt, and L. Patthey, Journal of Synchrotron Radiation 21, 32 (2014).
- Strocov et al. (2012) V. N. Strocov, M. Shi, M. Kobayashi, C. Monney, X. Wang, J. Krempasky, T. Schmitt, L. Patthey, H. Berger, and P. Blaha, Physical Review Letters 109, 086401 (2012).
- Böker et al. (2001) T. Böker, R. Severin, A. Müller, C. Janowitz, R. Manzke, D. Voß, P. Krüger, A. Mazur, and J. Pollmann, Physical Review B 64, 235305 (2001).
- Kresse and Furthmüller (1996) G. Kresse and J. Furthmüller, Physical Review B 54, 11169 (1996).
- Kresse and Joubert (1999) G. Kresse and D. Joubert, Physical Review B 59, 1758 (1999).
- Perdew et al. (1996) J. P. Perdew, K. Burke, and M. Ernzerhof, Physical Review Letters 77, 3865 (1996).
- Henkelman and Jónsson (2000) G. Henkelman and H. Jónsson, The Journal of Chemical Physics 113, 9978 (2000).
- Ozaki (2003) T. Ozaki, Physical Review B 67, 155108 (2003).
- Momma and Izumi (2011) K. Momma and F. Izumi, Journal of Applied Crystallography 44, 1272 (2011).
- Tongay et al. (2012) S. Tongay, S. S. Varnoosfaderani, B. R. Appleton, J. Wu, and A. F. Hebard, Applied Physics Letters 101, 123105 (2012).
- Herak et al. (2013) M. Herak, A. Zorko, M. Pregelj, O. Zaharko, G. Posnjak, Z. Jagličić, A. Potočnik, H. Luetkens, J. van Tol, A. Ozarowski, H. Berger, and D. Arcon, Physical Review B 87, 104413 (2013).
- Patterson (1988) B. D. Patterson, Reviews of Modern Physics 60, 69 (1988).
- Cox (2003) S. F. J. Cox, Journal of Physics: Condensed Matter 15, R1727 (2003).
- Tian et al. (2020) Y. Tian, N. Ghassemi, and J. H. Ross, Physical Review B 102, 165149 (2020).
- Tian et al. (2021) Y. Tian, Y. Zhu, R. Li, Z. Mao, and J. H. Ross, Physical Review B 104, L041105 (2021).
Supplemental Material: Hydrogen-impurity induced unconventional magnetism in semiconducting molybdenum ditelluride
Sample growth and characterization
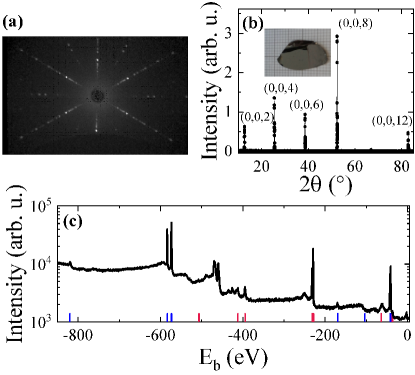
High-quality single crystals of 2H-MoTe2 were grown by chemical vapor transport method. Stoichiometric amounts of the starting materials, Mo and Te, along with the transport agent TeCl4 (), were mixed together in a quartz ampule and sealed in vacuum. The quartz tube was then placed for 3 weeks in a two-zone horizontal tube furnace with the charge end at and the end where the crystals form at . The high quality of the single crystals and the crystal structure was confirmed by x-ray diffraction (XRD) and x-ray photoelectron spectroscopy (XPS), as shown in Figure S1. The additional XPS peaks around are the Te M4,5-N4,5N4,5 Auger lines.
Magnetization measurements
Magnetometry measurements have been performed with a Quantum Design superconducting quantum interference device (SQUID) magnetic properties measurement system (MPMS) and are shown in Fig. S2.
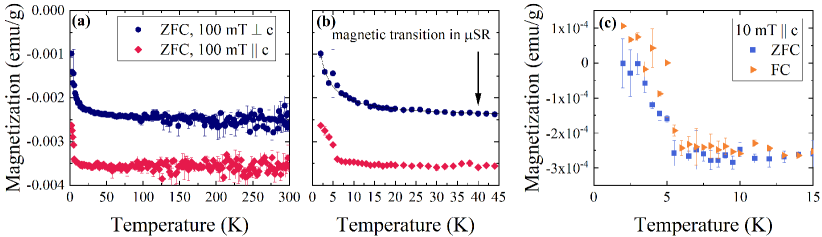
For an applied in-plane field of , the sample shows a Curie-Weiss like behavior. In contrast, if the field is applied out-of-plane there is a signature of a transition around , see Fig. S2(b). Moreover, for an out-of-plane field of this transition features a small hysteresis in the magnetization signal, Fig. S2(c). Its magnitude is too small for an intrinsically ferromagnetic sample and it cannot account for the observed magnetic transition in SR, which appears at much higher temperatures (). However, it could be attributed to various origins, including magnetic defects Guguchia et al. (2018) or magnetic grain-boundaries Tongay et al. (2012).
ARPES
The soft X-ray ARPES experiments were performed on the X03MA beamline at the Swiss Light Source of the Paul Scherrer Institute, Villigen, Switzerland Strocov et al. (2010, 2014). The analyzer slit was oriented along the incoming beam direction and the photon energy was tuned in the range of to . The high photon energies allow a better resolution Strocov et al. (2012) than in previous investigations of 2H-MoTe2 Böker et al. (2001). The combined beamline and analyzer resolution was better than at and better than around . The samples were cleaved in-situ and kept at in a vacuum lower than . We only present the binding energy with respect to the valence band maximum, because 2H-MoTe2 tends to statically charge upon x-ray illumination, which causes a rigid shift of the spectrum, see below.
Out-of plane dispersion
In the soft X-rays energy range the photoelectrons have a larger escape depth compared to standard ultraviolet ARPES. This reduces the broadening and allows to determine the out-of plane dispersion. For a measured photoelectron kinetic energy , the perpendicular momentum is given by:
| (S1) |
where is the electron mass, the in-plane momentum, the inner potential and the component of the photon momentum () perpendicular to the sample surface 111The formulas for the specific measurement geometry can be found in Ref. Strocov et al. (2014). The inner potential is a material and energy dependent parameter. We have estimated it by comparing the measured band structure with the expected periodicity of the Brillouin zone (cf. Fig. 1(f) in the main paper). We used a value of , which gives a fair agreement between theory and experiment, but slightly differs from the previously used Böker et al. (2001) .
Static charging
Because 2H-MoTe2 is a semiconductor, it tends to statically charge upon x-ray irradiation at low temperature. This is shown in Fig. S3, which displays the binding energy of several features in the band structure as a function of photon flux.
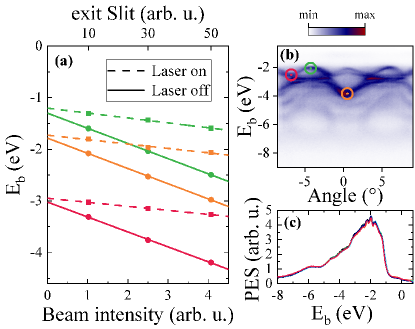
The binding energies were calibrated by measuring the Fermi level of Au. For some measurements the sample was additionally irradiated with a near UV laser. This excites some charge carriers and helps to significantly reduce the charging (Fig S3(a)). In both cases, the charging can be assumed to be a rigid shift of the spectrum. This is evident from the linear dependence on the flux in Fig S3(a) and from the collapse of angle integrated spectra after alignment of the valence band maximum in Fig S3(c). Therefore, in the main paper we only show the binding energy with respect to the valence band maximum.
n-type samples
All measurements shown in the main text were performed on samples that were freshly cleaved in-situ at directly before the measurement. However, after a couple of hours of ARPES measurements the 2H-MoTe2 samples usually degrade and the material becomes slightly -type. This is exemplified by the spectra in Fig. S4, where a small spectral weight above the valence band was observed.
These measurements clearly confirm that the band gap in 2H-MoTe2 is indirect.
Density-functional theory calculations
The electronic structure was calculated with Density-Functional Theory (DFT) and the Projected Augmented Wave (PAW) method from the VASP code Kresse and Furthmüller (1996); Kresse and Joubert (1999). Spin-orbit coupling was treated within the scalar-relativistic approach by the second variation method. The structure was relaxed and the exchange-correlation functional was chosen to be Perdew-Burke-Ernzerhof (PBE) Perdew et al. (1996). The parameter for the relaxed cell used in the ARPES calculation were given by , , where the Mo and Te sit at the and Wyckoff positions of space group 194, respectively, with relative -coordinates and for Te. Along -M an orbital decomposition into symmetric (,,,,) and antisymmetric (,,) orbitals was preformed. The orbital character does not fully separate into symmetric and antisymmetric bands because of spin-orbit coupling. Nevertheless, when using () polarized light [Fig. 2(a) (2(b)) in the main text], only the symmetric (antisymmetric) part of the electronic wave function, which primarily consists of these orbitals, will be probed.
Muon site determination
In order to simulate a single muon impurity, we used a hydrogen pseudopotential in the relaxed supercell of 2H-MoTe2. The assumed lattice constants in the supercell, c and a corresponding a, were the same as for the band structure calculations. The charge state of the muon is accounted for by assuming a neutral/charged supercell Möller et al. (2013); Bernardini et al. (2013). Therein, we preformed nudged elastic band (NEB) Henkelman and Jónsson (2000) as well as density of states calculations on the basis of the Linear Combination of Pseudo Atomic Orbitals (LCPAO) approach as implemented in the OPENMX code Ozaki (2003). The muon ground state energies were estimated by approximating the NEB diffusion energy barriers with an anisotropic harmonic oscillator potential. The crystal structures were visualized with VESTA Momma and Izumi (2011). Some further details regarding the stable muon positions are listed in Tab. 1.
| Species | Wyckoff position | frac. coordinates | ZPE | |||
| 0 | 0 | 0.25 | 0 | 0.57 | ||
| 0.5 | 0 | 0.5 | 1.5 | 0.22 | ||
| Mu | 0 | 0 | 0.25 | 0 | 0.54 | |
| Mu | 0 | 0 | 0.5 | 1.24 | 0.26 | |
We further show the local spin density of states at the different stopping sites in Fig. S5.
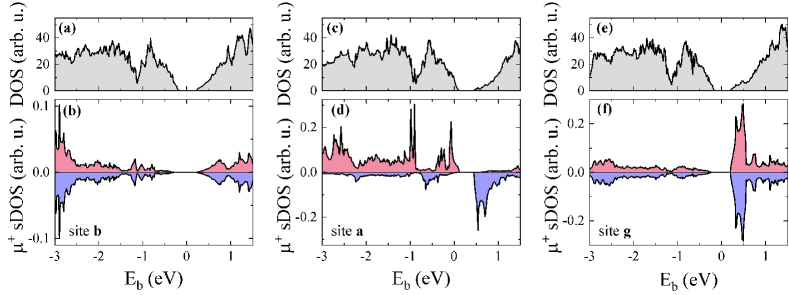
It is evident from this figure, that there is no induced magnetism at the stable muon stopping site b and g, see Fig. S5(b,f). For site b, the absence of an induced spin polarization can be understood because of the strong pairwise interaction of the muon with the neighboring Mo atoms. However, in the case of a muonium (and also a muon) sitting at the hexagonal site inside the vdW gap (site a) and when employing a finite Hubbard term , a significant spin density is induced, see Fig. S5(c,d). This is very similar to what was found for hydrogen adsorbed on a monolayer 2H-MoTe2 or on graphene Ma et al. (2011); González-Herrero et al. (2016). Note that site a is only a stable stopping site of muonium but not of a muon. As argued in more detail in the main text and below, such a muonium induced magnetic state can explain the observed coherent muon spin precession, while being consistent with the absence of a magnetic signal in magnetization and 125Te-NMR.
Muon spin spectroscopy
The SR experiments were performed on the general purpose spectrometer (GPS) at the Swiss Muon Source, Paul Scherrer Institute, Switzerland Amato et al. (2017). The temperature was controlled using a 4He flow cryostat. In order to vary the orientation of the sample with respect to the initial muon spin direction, the sample was mounted on a mechanical rotation-stage. Nearly spin polarized muons were implanted. The asymmetric emission of the muon’s decay positrons (lifetime ) enables us to use them as a local magnetic probe Yaouanc and de Réotier (2011). Note, that at any given moment, there is only one muon in the sample. Therefore, we can exclude that a muon probes magnetism induced by a nearby Mu or . The data were analyzed with musrfit software suite Suter and Wojek (2012).
Zero field angle dependence
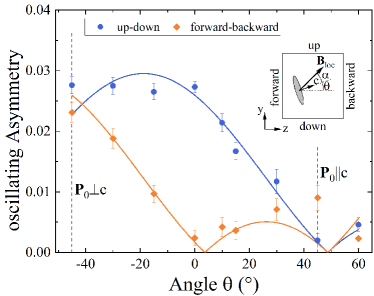
In order to determine the variation in the zero field (ZF) SR spectra as a function of sample orientation, the asymmetry spectra (such as the ones shown in Fig. 1(b,c) of the main paper) were fitted to a sum of a Gaussian damped oscillating part and two exponentially damped components:
| (S2) |
We further assumed that the internal field and the depolarization rate of the oscillating part to be independent of the measured projection of the polarization. Figure S6 shows the resulting oscillating ZF asymmetry in different sets of detectors (corresponding to different projections of the muon spin polarization) as a function of the sample orientation.
In order to understand this rotation dependence, one has to consider the Larmor precession of the muon polarization , defined as
| (S3) |
Here, denotes the local magnetic field vector and is the gyromagnetic ratio of the muon. The resulting precession can be written as Herak et al. (2013); Yaouanc and de Réotier (2011):
| (S4) | ||||
| (S5) |
where is initial polarization vector and denotes the magnitude of the field.
We choose the coordinate system depicted in the inset of Fig. S6, with , and the local field . The angle denotes the rotation of the sample’s -axis with respect to the detectors and is a hypothetical offset between the local magnetic field seen by the muon and the -axis of the crystal.
The asymmetry probed by a set of opposite detectors is proportional to the projection of the polarization along that direction. Therefore, in the inset of Fig. S6 the asymmetry in the up-down detectors is , and the one in the forward backward detectors , where and are the unit vectors in the and directions.
Inserting these conventions into Eq. S4, we find that the oscillating part of the asymmetry is given by and that accordingly
| (S6) | ||||
| (S7) |
These curves are depicted as solid lines in Fig. S6, where was determined using nonlinear least-squares optimization. As the sample was aligned with respect to the detector frame by hand, this small value of could easily correspond to a small misalignment of the sample. Therefore, we conclude that within our measurement precision, the local field points along the -axis of the crystal.
Field dependence in transverse field
We have also determined the evolution of the muon oscillation frequencies as a function of a transverse field applied along the crystallographic -axis. The fast Fourier transforms of representative spectra are shown in Fig. S7(a).
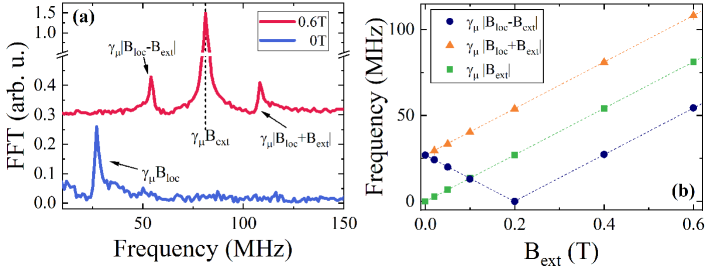
We find that there is one component in the spectra, which oscillates at a frequency corresponding to the applied field, and which allows an accurate calibration of applied field (). This component is partially attributed to a background contribution from a silver plate, onto which the sample was mounted. Other contributions to this component could also include some diamagnetic muons, which experience no strong magnetic field in 2H-MoTe2. In addition, we observe other oscillating components which split up into peaks at , where is the field corresponding to the ZF oscillation. The accurate values of these frequencies were extracted by fitting the SR time spectra to a sum of Gaussian damped oscillating components plus a non-oscillating Gaussian damped contribution:
| (S8) |
The resulting field values are shown in Fig. S7(b). We note that the internal field seems to point equally likely along the positive and negative -axis direction. At a first glance, this seems incompatible with a muonium state, to which we attribute this signal in the main part of the paper. Usually the behavior of muonium in a field is dominated by the hyperfine coupling and described by the Hamiltonian
| (S9) |
where is the hyperfine coupling tensor, , and are the spins of the muon and the bound electron and is the electron’s gyromagnetic ratio. In a system without locally induced magnetism, this results in the presence of four different oscillation frequencies, which scale non-linearly as a function of field, see e.g. Refs. Patterson (1988); Cox (2003); Yaouanc and de Réotier (2011).
However, in the case of muonium induced magnetism, we can assume that the electron spin is locked along its local easy axis, and remains unaffected by the (relatively small) applied fields. Then Eq. S9 can be simplified to,
| (S10) |
where is an effective local magnetic field characterizing the ZF oscillation. The field dependence of the oscillation frequencies resulting from Eq. S10 is fully consistent with our observation presented in Figs. S6, S7, with , where is a unit vector along the -axis.
Low-energy SR
We also investigate the evolution of the observed magnetism within from the surface using low energy SR at the E4 beamline of the Swiss Muon Source, Paul Scherrer Institute, Switzerland Prokscha et al. (2008). For these measurements, multiple single crystals were glued on a Ni coated sample plate with the -axis parallel to the applied field, but perpendicular to the initial muon spin. The implantation depth was controlled by varying the kinetic energy, , of the incident muon beam. The resulting stopping profiles were calculated with the Trim.SP software Eckstein (1991) and are shown in Fig. S8(b).
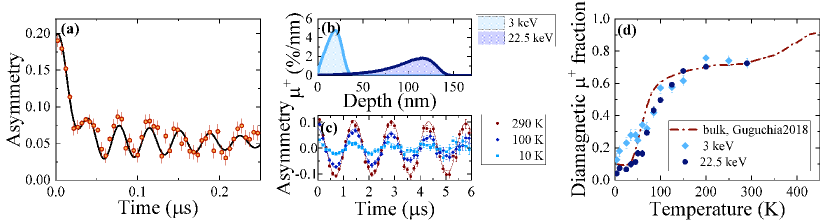
At and (corresponding to an average implantation depth of ), the muon spins exhibit a coherent precession in zero field (ZF) similar to what we observed in the bulk, see Fig. S8(a). This spectrum was fitted to the following function:
| (S11) |
The first term describes the muons that oscillate in a local magnetic field . The second term represents the slowly depolarized (nonmagnetic) signal and the third accounts for the strongly damped part due to background contribution from muons stopping in the Ni coated sample plate. This analysis is similar to that used in Ref. Guguchia et al. (2018), except for the background contribution. We find that the oscillation frequency in Fig. S8(a) corresponds to an internal static field . Within the statistical error of the measurement, this is consistent with what is found in the bulk Guguchia et al. (2018).
We then use a small magnetic field (, transverse to the initial muon spin) to identify the fraction of diamagnetic muons, which is proportional to the non-magnetic fraction of the sample [Fig. S8(c,d)]. These spectra were fitted with a single, Gaussian damped oscillating polarization.
| (S12) |
This function only describes the muons in a nonmagnetic environment oscillating at a frequency close to the Larmor frequency in the applied field. Any magnetic or strongly damped signal (cf. Eq. S11) leads to an effective loss of . The background contribution to was determined by measuring an empty Ni plate with the same beamline settings. This temperature independent value was subtracted from the measured and the resulting curve is shown in Fig. S8(d). Independent of depth and within the experimental uncertainties, all points in Fig. S8(d) closely follow the bulk behavior reported in Ref. Guguchia et al. (2018). Therefore, we conclude that the bulk magnetic properties observed with SR in 2H-MoTe2 do not change in the near-surface region of the crystals.
125Te-NMR
The 125Te-NMR signals were collected by means of spin-echo detection in a – sequence, using a duplexer, with a preamplifier. The line shapes were then extracted via a fast Fourier transformation of those signals. Typical pulse widths of and repetition times of were used, with each line shape corresponding to more than 20’000 records. Measurements on a single crystal were performed in a field of perpendicular to the -axis, while those on powders were performed in fields of and . The 125Te reference frequencies were calibrated using 27Al-NMR on aluminum foil, which is known to have a very small shift as a function of temperature Harris et al. (2002).
Powder line shapes
Figure S9 shows the detailed temperature dependence of the powder line shape of 2H-MoTe2 in . Similar to the spectra of the single crystal measurements shown in the main part of the paper, here, too, we observe no significant peak-shift or broadening, that would be the two common fingerprints of a magnetic transition.
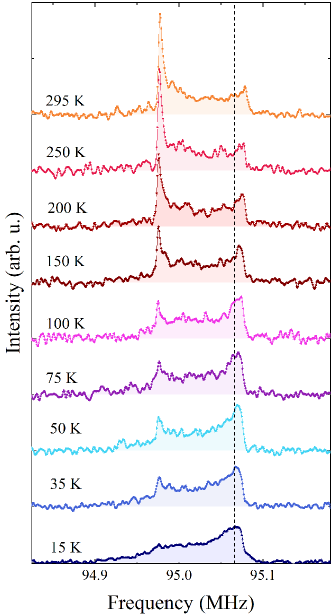
We note that there are some small changes in the line shape as a function of temperature. However, these are most likely due to a change in spectral weight between different portions of the resonance line, owing to a difference in their spin-lattice relaxation (SLR) temperature dependence.
Spin-lattice relaxation
The spin-lattice relaxation rate of the 125Te moments is shown in Fig. S10.
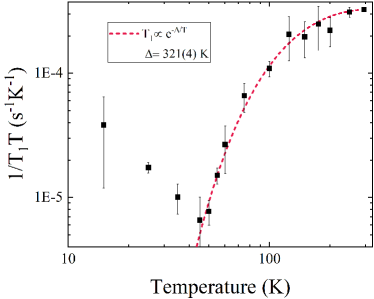
At high temperature, the SLR shows an exponential dependence on temperature (). This is a typical behavior observed in semiconductors. However, we find that here the gap is much smaller than the spectroscopic band gap, which is on the order of , cf. Fig. S4. This difference is likely due to, e.g., the presence of a small amount of impurity-induced in-gap states, which have too little spectral weight to be detected with ARPES, but still can depolarize the 125Te nuclear spins. At present, we are unable to determine the mechanism for the increase in relaxation rate at low temperatures in 2H-MoTe2. However, we note that a similar increase in relaxation was observed in the analogue compounds ZrTe2 and ZrSiTe Tian et al. (2020, 2021). In both cases, the increase in relaxation rate is suggested to arise from a contribution from Dirac electrons. However, 2H-MoTe2 is not a Dirac system, so the fact that there is a similar increase in relaxation rate suggests that the true origin of this effect might be due to some new mechanism, yet to be understood. Finally, we note that the SLR has a minimum around , i.e., the onset temperature of the magnetic oscillations observed by SR. However, in the presence of an intrinsic magnetic transition, the SLR should instead show a peak at this temperature due to critical magnetic fluctuations. This finding confirms once more that the observed local magnetic field in SR is not intrinsic to 2H-MoTe2.
References
- Guguchia et al. (2018) Z. Guguchia, A. Kerelsky, D. Edelberg, S. Banerjee, F. v. Rohr, D. Scullion, M. Augustin, M. Scully, D. A. Rhodes, Z. Shermadini, et al., Science Advances 4, eaat3672 (2018).
- Tongay et al. (2012) S. SITongay, S. S. Varnoosfaderani, B. R. Appleton, J. Wu, and A. F. Hebard, Applied Physics Letters 101, 123105 (2012).
- Strocov et al. (2010) V. N. Strocov, T. Schmitt, U. Flechsig, T. Schmidt, A. Imhof, Q. Chen, J. Raabe, R. Betemps, D. Zimoch, J. Krempasky, et al., Journal of Synchrotron Radiation 17, 631 (2010).
- Strocov et al. (2014) V. N. Strocov, X. Wang, M. Shi, M. Kobayashi, J. Krempasky, C. Hess, T. Schmitt, and L. Patthey, Journal of Synchrotron Radiation 21, 32 (2014).
- Strocov et al. (2012) V. N. Strocov, M. Shi, M. Kobayashi, C. Monney, X. Wang, J. Krempasky, T. Schmitt, L. Patthey, H. Berger, and P. Blaha, Physical Review Letters 109, 086401 (2012).
- Böker et al. (2001) T. Böker, R. Severin, A. Müller, C. Janowitz, R. Manzke, D. Voß, P. Krüger, A. Mazur, and J. Pollmann, Physical Review B 64, 235305 (2001).
- Kresse and Furthmüller (1996) G. Kresse and J. Furthmüller, Physical Review B 54, 11169 (1996).
- Kresse and Joubert (1999) G. Kresse and D. Joubert, Physical Review B 59, 1758 (1999).
- Perdew et al. (1996) J. P. Perdew, K. Burke, and M. Ernzerhof, Physical Review Letters 77, 3865 (1996).
- Möller et al. (2013) J. S. Möller, D. Ceresoli, T. Lancaster, N. Marzari, and S. J. Blundell, Physical Review B 87, 121108(R) (2013).
- Bernardini et al. (2013) F. Bernardini, P. Bonfà, S. Massidda, and R. De Renzi, Physical Review B 87, 115148 (2013).
- Henkelman and Jónsson (2000) G. Henkelman and H. Jónsson, The Journal of Chemical Physics 113, 9978 (2000).
- Ozaki (2003) T. SIOzaki, Physical Review B 67, 155108 (2003).
- Momma and Izumi (2011) K. Momma and F. Izumi, Journal of Applied Crystallography 44, 1272 (2011).
- Ma et al. (2011) Y. Ma, Y. Dai, M. Guo, C. Niu, J. Lu, and B. Huang, Physical Chemistry Chemical Physics 13, 15546 (2011).
- González-Herrero et al. (2016) H. González-Herrero, J. M. Gómez-Rodríguez, P. Mallet, M. Moaied, J. J. Palacios, C. Salgado, M. M. Ugeda, J.-Y. Veuillen, F. Yndurain, and I. Brihuega, Science 352, 437 (2016).
- Amato et al. (2017) A. Amato, H. Luetkens, K. Sedlak, A. Stoykov, R. Scheuermann, M. Elender, A. Raselli, and D. Graf, Review of Scientific Instruments 88, 093301 (2017).
- Yaouanc and de Réotier (2011) A. Yaouanc and P. de Réotier, Muon Spin Rotation, Relaxation, and Resonance: Applications to Condensed Matter, International Series of Monographs on Physics (OUP Oxford, 2011), ISBN 978-0-19-959647-8.
- Suter and Wojek (2012) A. Suter and B. M. Wojek, Physics Procedia 30, 69 (2012).
- Herak et al. (2013) M. Herak, A. Zorko, M. Pregelj, O. Zaharko, G. Posnjak, Z. Jagličić, A. Potočnik, H. Luetkens, J. Van Tol, A. Ozarowski, et al., Physical Review B 87, 104413 (2013).
- Patterson (1988) B. D. Patterson, Reviews of Modern Physics 60, 69 (1988).
- Cox (2003) S. F. J. Cox, Journal of Physics: Condensed Matter 15, R1727 (2003).
- Prokscha et al. (2008) T. Prokscha, E. Morenzoni, K. Deiters, F. Foroughi, D. George, R. Kobler, A. Suter, and V. Vrankovic, Nuclear Instruments and Methods in Physics Research Section A: Accelerators, Spectrometers, Detectors and Associated Equipment 595, 317 (2008).
- Eckstein (1991) W. Eckstein, Computer Simulation of Ion-Solid Interactions, Springer Series in Materials Science (Springer-Verlag, Berlin Heidelberg, 1991), ISBN 978-3-642-73515-8.
- Harris et al. (2002) R. K. Harris, E. D. Becker, S. M. C. d. Menezes, R. Goodfellow, and P. Granger, Magnetic Resonance in Chemistry 40, 489 (2002).
- Tian et al. (2020) Y. Tian, N. Ghassemi, and J. H. Ross, Physical Review B 102, 165149 (2020).
- Tian et al. (2021) Y. Tian, Y. Zhu, R. Li, Z. Mao, and J. H. Ross, Physical Review B 104, L041105 (2021).