Probing cold gas in a massive, compact star-forming galaxy at
Abstract
Observations of low order transitions represent the most direct way to study galaxies’ cold molecular gas, the fuel of star formation. Here we present the first detection of CO(=21) in a galaxy lying on the main-sequence of star-forming galaxies at . Our target, G09-83808 at , has a short depletion time-scale of and a relatively low gas fraction of that contrasts with those measured for lower redshift main-sequence galaxies. We conclude that this galaxy is undergoing a starburst episode with a high star formation efficiency that might be the result of gas compression within its compact rotating disk. Its starburst-like nature is further supported by its high star formation rate surface density, thus favoring the use of the Kennicutt-Schmidt relation as a more precise diagnostic diagram. Without further significant gas accretion, this galaxy would become a compact, massive quiescent galaxy at .
In addition, we find that the calibration for estimating ISM masses from dust continuum emission satisfactorily reproduces the gas mass derived from the CO(21) transition (within a factor of ). This is in line with previous studies claiming a small redshift evolution in the gas-to-dust ratio of massive, metal-rich galaxies.
In the absence of gravitational amplification, this detection would have required of order h of observing time. The detection of cold molecular gas in unlensed star-forming galaxies at high redshifts is thus prohibitive with current facilities and requires a ten-fold improvement in sensitivity, such as that envisaged for the ngVLA.
1 Introduction
The evolution of the star formation activity and, consequently, the cosmic mass assembly history and the metal enrichment of the universe are tightly linked to the molecular gas content of galaxies throughout cosmic time (e.g. Walter et al. 2020). How much gas was present in these ‘cosmic ecosystems’ at different epochs is a fundamental question in galaxy formation and evolution studies.
, the most abundant molecule in the Universe, lacks dipole moments and therefore is a very inefficient radiator; thus the cool molecular gas’ best observable tracer is thought to be carbon monoxide (; hereafter, CO), the second most abundant molecule in the universe. Since a few years after its first astronomical detection — half a century ago (Wilson et al. 1970; Penzias et al. 1971), it was clear that this rotational emission line was a useful tool to constrain the molecular gas content in extragalactic sources and to map its distribution and kinematics (e.g. Rickard et al. 1975; Solomon & de Zafra 1975) since it is easily excited even at very low temperatures.
The estimation of the total molecular gas from the CO line luminosity relies on the CO–to–H2 conversion factor, , usually calibrated for the transition111This relation has the form of ; where has units of , and , the CO line luminosity, is expressed in units of . (see review by Bolatto et al. 2013). When only higher order transitions are available, an assumption on the excitation ladder (or a modeling if several lines are available) has to be done as an additional step to first infer the CO ground transition line luminosity. The shape of the spectral line energy distribution (SLED), however, depends on the excitation of the CO molecules (and therefore on the temperature and density of the gas), which might vary significantly between galaxies and even between regions of the same galaxy. This introduces significant uncertainty when inferring the low-J line luminosities from high-J transitions, at the level of making gas mass estimations unreliable, particularly when only one high-order line is available222The CO(65)/CO(10) flux line ratios found in submillimeter-selected galaxies vary, for example, by up to factors of six, or even up to a factor of ten if quasars are included (see review by Carilli & Walter 2013).. This is particularly true at given the sensitivity and frequency coverage of current facilities and the typical SLED of star-forming galaxies, which bias the observations towards the brighter high-J CO emission lines.
Despite these difficulties, hundreds of CO studies in galaxies from to have been published to-date, allowing us to constrain the physical properties and redshift evolution of galaxies’ interstellar medium (see recent review by Tacconi et al. 2020 and references therein). Moreover, these observations (in addition to other dynamical studies) have been used to calibrate alternative tracers of the molecular gas component such as far–infrared (FIR) atomic fine structure lines (e.g. Valentino et al. 2018; Dessauges-Zavadsky et al. 2020) and dust continuum emission (e.g. Magdis et al. 2012; Scoville et al. 2016).
At higher redshifts, however, our understanding of the physical conditions of the cold star-forming interstellar medium is much more limited. And, while recent observational programs, such as the ALPINE survey (Béthermin et al. 2020; Le Fèvre et al. 2020) have made a significant leap forward in our understanding of these quantities up to (e.g. Dessauges-Zavadsky et al. 2020), primarily through observations of [CII], the number of galaxies with low-J CO detections at these high redshifts is limited to a handful (e.g. Strandet et al. 2017; Pavesi et al. 2018). At , the situation is even more critical. The only detections of and come from a very extreme starburst galaxy, whose star formation rate is thought to be among the highest observed at any epoch (Riechers et al. 2013). The gas properties of normal star-forming galaxies at are thus completely unexplored.
The reason behind this relies mainly on the limitations of existing instrumentation since the current facilities covering the radio wavebands at which these low-J CO transitions are redshifted () lack the required sensitivity to detect the expected CO emission from typical star-forming galaxies at . Future large radio arrays are currently being designed to specifically address this issue. The Next-Generation Very Large Array (ngVLA), for example, will provide an order-of-magnitude improvement in depth and area (Carilli et al. 2015; Murphy et al. 2018; Selina et al. 2018) allowing us to conduct surveys of cold gas from these critical low-J transitions in normal galaxies within the Epoch of Reionzation (Casey et al. 2015, 2018; Decarli et al. 2018).
Nevertheless, such facilities are not expected to be operational until the end of this decade, at the earliest. Furthermore, the capability of such a facility to detect cold gas at high redshifts () has been called into question due to the potentially strong dimming effects caused by the Cosmic Microwave Background (e.g. da Cunha et al. 2013).
Here, we exploit the gravitational amplification effect, to demonstrate the feasibility of detecting cold gas in normal galaxies within the Epoch of Reionization via the first detection of in a main-sequence star-forming galaxy at . The detection of this line, from which the ground line luminosity can be estimated with little extrapolation, enable us to characterize the cold ISM in a galaxy formed Gyr after the Big Bang. This allows us to test the applicability of scaling relations derived for lower redshift galaxies and test whether or not other widely used methods to infer gas masses are also valid for this system.
This work provides us the first insights of what is expected to come with future facilities such as the ngVLA (Carilli et al. 2015) and the new Band-1 ALMA detectors (Huang et al. 2016).
In this manuscript, we assume and (Planck Collaboration et al. 2016).
2 Target and observations
2.1 G09-83808: a massive, main-sequence star forming galaxy at ?
The target, G09-83808, was first detected by the Herschel space telescope and identified as a high-redshift galaxy candidate in Ivison et al. (2016) due to its red far-infrared colors (i.e. ). The source was then followed-up with several telescopes including the Atacama Large submillimeter/Millimeter Array (ALMA), the James Clerk Maxwell Telescope (JCMT), the Large Millimeter Telescope (LMT), NOEMA, Spitzer, and the Submillimeter Array (SMA). The galaxy’s redshift was determined to be through the detection of multiple emission lines (including , , and ) in its LMT 3 mm spectrum and a subsequent detection of the [CII]() transition with the SMA (Zavala et al. 2018; see also Fudamoto et al. 2017). Zavala et al. (2018) also presents high-angular resolution ALMA observations of the dust continuum emission at . The high resolution dust continuum observations were used for modelling the gravitational lensing effect in the uv plane using the visilens code (Spilker et al. 2016b). The best-fit gravitational magnification of the source was found to be .
Using this magnification factor and the combined Herschel/SPIRE (250, 350, and ), JCMT/SCUBA-2 , and LMT/AzTEC 1.1 mm photometry, an intrinsic star formation rate (SFR) of was derived in Zavala et al. (2018).
The and Spitzer/IRAC observations were also used along with the FIR photometry to constrain the stellar mass of the galaxy through a spectral energy distribution (SED) fitting technique using the energy balance code magphys (da Cunha et al. 2008). First, since the emission of G09-83808 is blended with that from the foreground lensing galaxy in the IRAC bands (see Zavala et al. 2018), the light distribution of the foreground galaxy was modeled using galfit (Peng et al. 2002) and a Sérsic profile (Sérsic 1963). Then, the emission from the foreground galaxy was subtracted from each image, and the photometry of the background source was measured from the galfit generated residual images using SExtractor (Bertin & Arnouts 1996). Finally, combining the deblended Spitzer photometry, which probes the rest-frame optical stellar emission, with the FIR data, the best-fit SED for G09-83808 was derived, from which a stellar mass of was inferred (after correcting for gravitational magnification).
With these measurements in hand, we can place our target in the context of the main-sequence of star forming galaxies.
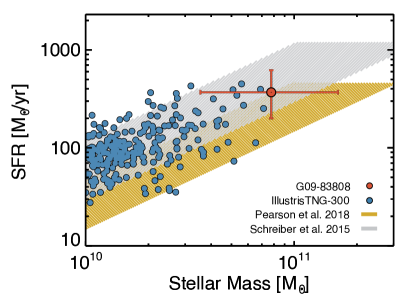
As it can be seen from Figure 1, G09-83808 lies on the high-mass end of the main-sequence of star forming galaxies when compared to the extrapolated relation of Schreiber et al. (2015), or slightly above (with ) if compared to the relation of Pearson et al. (2018) or Khusanova et al. (2021) – note that the cuts at high SFRs in the figure are imposed to represent the typical turnover at high masses (e.g. Tomczak et al. 2016).
Since this relationship is still not well determined at , we make use of results from simulations to further explore the place of our galaxy in the context of typical star-forming galaxies. To do this, we plot in Figure 1 the star-forming galaxies from the IllustrisTNG project (Pillepich et al. 2018). These galaxies are in relatively good agreement with the adopted main-sequence relationships, ruling out any significant bias in our comparison. As shown in this figure, the properties of our target are similar to those of the most massive galaxies in IllustrisTNG. Therefore, we can conclude that G09-83808 probes the high-end of the main sequence of star-forming galaxies.
This contrasts with the only other two galaxies discovered in blind (sub-)millimeter surveys, SPT0311-58 and HFLS3, which show SFRs of of and are considered to be extreme starburst galaxies (Riechers et al. 2013; Marrone et al. 2018).
Finally, we highlight that the metallicity of this galaxy has recently been constrained to be () via the detection of [NII] and [OIII] in Tadaki et al. (2022). Interestingly, the mass-metallicity relation of Genzel et al. (2015) predicts a value of , in very good agreement with Tadaki et al. (2022).
2.2 VLA observations
Observations were taken using the Karl G. Jansky Very Large Array (VLA) in the C array configuration as part of project 20A-386 (PI: J. Zavala). Three different executions were performed on 2020 June 10, 14, and 19 for a total integration time of 15 h.
The WIDAR correlator setup was designed for simultaneous continuum and spectral line observations in the Ka-band, with mixed 3-bit and 8-bit samplers, resulting in a total bandwidth of 5.12 GHz subdivided into forty 128 MHz dual-polarization sub-bands with 1 MHz channels. During each execution, the source (aka 3C-286) served as band-pass and absolute flux calibrator, while J was used as pointing source and complex gain calibrator. A few scans from some antennas were flagged before data calibration due to phase or amplitude issues or because they were affected by radio frequency interference (although they do not represent more than a few percent of all data). Data reduction and calibration were done using the VLA pipeline following the standard procedures. Then, the data from the three executions were combined during the imaging procedure, which was done using natural weighting of the visibilities in order to maximize the sensitivity at the expense of angular resolution (producing a synthesized beam size of , PAdeg). This results in an r.m.s noise level of for a channel width for the sub-band centered at the expected position of the line.
3 Analysis and Results
3.1 The line and the lensing model
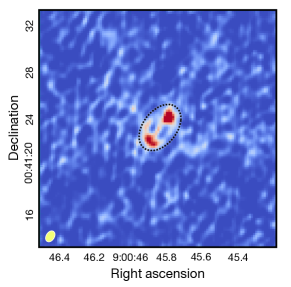
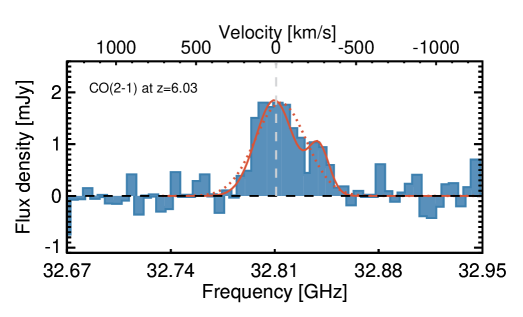
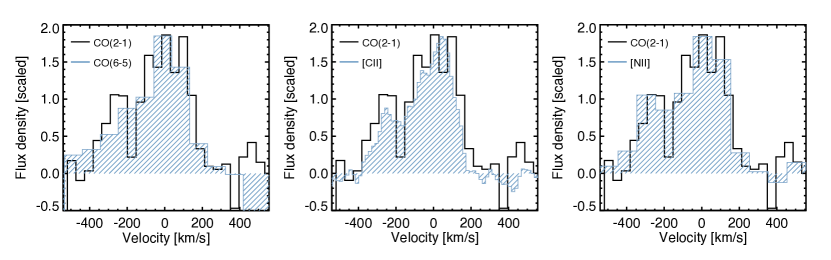
Figure 2 shows the line detection (moment-0 map and 1D extracted spectrum) from G09-83808. To measure the total flux density of the line we fit either one or two Gaussian profiles to the extracted spectrum (see Figure 2), and we measure it directly from the clean moment-0 map. These methods give us a statistically consistent integrated line flux of , which implies a line luminosity of (following Solomon et al. 1992).
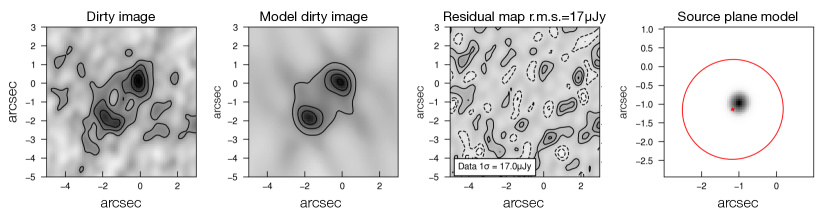
To measure the gravitational amplification factor on the line, we use the lens modelling code visilens (Spilker et al. 2016b), which directly models the visibilities in the uv plane. The modelling was done in a similar way as for the m dust continuum emission previously reported in Zavala et al. (2018), parameterizing the lens mass profile as a singular isothermal ellipsoid and the background source as a Sérsic profile. While this modelling provides a good fit to the data (see Figure 3), we acknowledge that the data alone cannot constrain the source profile. The assumed Sérsic profile is however supported by the modelling of high-SNR, high-angular resolution observations of the dust continuum emission (Zavala et al. 2018; Tadaki et al. 2022.
After marginalizing over the different parameter space explored by the code, we derive a best-fit magnification factor of and a source-plane (intrinsic) size of (). These values are in good agreement with the results presented in Zavala et al. (2018), who derived a magnification of and a size of for the dust continuum emission, and with Tadaki et al. (2022) who found and for the mm continuum, despite using a different lensing code. This suggests that there is no significant differential magnification between the and the dust thermal emission and implies similar and co-spatial source plane areas.
Based on the magnification factor of described above, we derive a corrected line luminosity of .
3.1.1 The effect of the CMB
The systematic increase of the temperature of the Cosmic Microwave Background (CMB) with increasing redshift () affects the physical conditions and detectability of galaxies’ dust and molecular gas emission. As detailed in da Cunha et al. (2013), these effects are more important when the CMB temperature ( at ) is close to the dust or gas temperature ( or , respectively).
Harrington et al. (2021) and Jarugula et al. (2021) have recently reported high kinetic temperatures () for dusty star-forming galaxies. If this holds at higher redshifts, it would imply that the CMB effects on the measured CO line fluxes are relatively minor (note that the CMB also affects the kinetic and dust temperatures; da Cunha et al. 2013). G09-83808, the source studied in this work, indeed shows a bright detection as expected for a high kinetic temperature. Nevertheless, a detailed modelling of its SLED (including the , , , and transitions) suggests that the line is almost totally dominated by a relatively cold component with K (Tsujita et al. submitted).
Assuming this kinetic temperature and following da Cunha et al. (2013), we infer a CMB correction factor of (note that we used the dust temperature as the minimum kinetic temperature in this calculation). The intrinsic flux density is then estimated to be , which translates into an intrinsic line luminosity of . These values, which have been corrected by the gravitational amplification, will be adopted for the rest of the analysis.
3.2 Total molecular gas content
The –to– line ratios reported in the literature show a small scatter of less than a factor of 2 (e.g. Harrington et al. 2021). This contrasts with the high dispersion in the line ratios between the ground transition and higher-J lines, which could differ by up to a factor of (see the CO SLED of DSFGs reported in Casey et al. 2014; see also Carilli & Walter 2013). This implies that the CO ground state luminosity, and thus the molecular gas mass, can be inferred with relatively little extrapolation from the detection.
Adopting a line brightness temperature ratio of (e.g. Bothwell et al. 2013; Carilli & Walter 2013; Genzel et al. 2015; Harrington et al. 2021), we infer a line luminosity of (after correcting for gravitational amplification).
As mentioned in Section 1, the total molecular gas mass can be directly inferred from the line luminosity via the CO-to-H2 conversion factor, . However, this conversion factor suffers from large uncertainties and might depend on several physical parameters of a galaxy’s ISM (e.g. Bolatto et al. 2013). A value of is typically adopted for nearby nuclear starburst galaxies333Historically, the ULIRG value was adopted to be , nevertheless, a value of aligns better with the more recent review by Bolatto et al. 2013. (i.e. ULIRGs; Downes & Solomon 1998), while a higher value of is thought to be more appropriate for more moderate galaxies (including the Milky Way; see review by Bolatto et al. 2013). These two extreme values would bracket the molecular gas of G09-83808 between and .
Very high could, however, lead to a molecular gas mass estimate larger than the dynamical mass (e.g. Bryant & Scoville 1999). Such dynamical information can thus be used to constrain the CO-to-H2 conversion factor in individual systems (e.g. Bothwell et al. 2010; Engel et al. 2010). In this work we exploit the dynamical information encoded in the emission line that traces the cold gas reservoir to restrict the CO-to-H2 conversion factor of our target.
The dynamical mass is estimated by:
| (1) |
where is the effective circularized radius, is the velocity dispersion, and G the gravitational constant (e.g. Casey et al. 2019). To correct for the unknown inclination, , we multiply by a factor of (the reciprocal of the expectation value of ). Based on this equation, we infer a dynamical mass of (note that a similar value is obtained if we use instead the isotropic viral estimator equation, e.g. Engel et al. 2010). This places an upper limit on the conversion factor of (taking into account uncertainties), which justifies the adoption of , as typically measured for ULIRGs (Bolatto et al. 2013). The total de-lensed molecular gas mass of G09-83808 is then estimated to be .
3.2.1 A Test on the dust continuum method
Scoville et al. 2016 presented a relationship between the specific luminosity at rest-frame , , and the CO line luminosity, . Such a relation serves as the base for an empirical calibration aimed at inferring galaxies’ molecular gas content via dust continuum observations that probe the Rayleigh-Jeans tail of dust black-body emission. While this time-efficient approach has been revolutionary for the measurement of ISM masses — because dust continuum is observationally cheaper than spectral observations of CO transitions, its calibration and validity have not been tested beyond (even when studies using this method extends up to ; e.g. Liu et al. 2019).
Thanks to the detection in G09-83808, here we test whether or not the - calibration holds at for this system. Note that we decide to test this relation rather than the final molecular gas recipe of Scoville et al. 2016 to avoid possible differences in the assumptions.
To mimic the typical procedure adopted in the literature, we calculate the specific luminosity from one single data-point close to the Rayleigh-Jeans tail (in this case, the gravitationally-corrected flux density of reported in Zavala et al. 2018). This calculation assumes a dust emissivity index of and a mass-weighted dust temperature of (see details in Scoville et al. 2016).
The Scoville et al. 2016 calibration predicts a line luminosity of . This is a factor of above the -derived value of .
As mentioned above, the alternative approach typically adopted in the literature to estimate the line luminosity from high-J transitions might result in larger discrepancies than the one observed here. Therefore, although larger samples are imperative to derive any firm conclusions, this result supports the empirical approach of using single band continuum observations as a proxy for molecular gas content up to (modulo an appropriate )444The reader should keep in mind, though, that the final Scoville et al. equation to translate from dust continuum to interstellar medium mass should be modified appropriately if a different value wants to be adopted.. We highlight, though, that the CMB effects could be more pronounced in galaxies at higher redshift and/or with colder temperatures.
An important corollary that can be inferred from this, is that the gas-to-dust abundance ratio at is similar to that found in lower redshift galaxies, at least for this massive (and relatively metal-rich) galaxy. This is in line with some recent simulations which predict a modest redshift evolution on the gas-to-dust ratio (e.g. Li et al. 2019; Popping & Péroux 2022).
3.3 Gas depletion timescale, gas-to-dust ratio, and gas fraction
With a gas mass measurement in hand, we can now explore other parameters such as the gas-to-dust ratio and gas fraction, and the gas depletion timescale, and compare them to those measured in other galaxies. In addition, we can test whether or not the scaling relations found for lower redshift systems still hold at . This is the main goal of this section.
For this comparison we use the recent compilation by Tacconi et al. (2020) of galaxies with gas measurements and their derived relationships, which are built upon previous significant efforts (e.g. Genzel et al. 2015; Scoville et al. 2017; Tacconi et al. 2018). Although this collection includes galaxies up to , the low number of galaxies at high redshifts limits the analysis and the derived relationships to . Hence, our observations allow us to investigate the evolution of these parameters within an unexplored redshift range and test the validity of the extrapolated scaling relations at .
It is important to highlight that Tacconi et al. (2020) used a CO conversion factor of and a gas-to-dust ratio of to re-calibrate all the gas mass measurements from the literature homogeneously. This is justified since their analysis is focused on galaxies around the main-sequence (), for which little to no systematic variation of these parameters have been found (see detailed discussion in Genzel et al. 2015; Scoville et al. 2017; Tacconi et al. 2020). Nevertheless, this has been shown not to be the case for extreme outliers with log (which represent only % of their sample). Therefore, for those extreme galaxies with gas mass estimates based on , we have scaled the gas masses down by a factor of 4.36, and propagated this to other measurements, to reflect our assumption of . The appropriateness and the implications of this choice are discussed below.
3.3.1 Gas-to-dust ratio
To calculate the gas-to-dust ratio, we adopt the amplification-corrected gas mass reported above in §3.2 and the demagnified dust mass of reported by Zavala et al. (2018). Using these values, we estimate a gas-to-dust ratio of , which is in excellent agreement with the widely adopted ratio of 100:1 for massive galaxies with close to solar metallicities (e.g. Leroy et al. 2011; Rémy-Ruyer et al. 2014) and consistent within with the value of adopted in the recent review by Tacconi et al. (2020).
Given that G09-83808 was shown to have a near-solar-metallicity ISM (Tadaki et al. 2022), this result supports the conclusion by Rémy-Ruyer et al. (2014) who claimed that the metallicity is the main physical property driving the gas-to-dust ratio (see also Li et al. 2019; Popping & Péroux 2022), and it suggests that this relation does not significantly evolve with redshift (c.f. Saintonge et al. 2013).
In addition, this supports our assumption of for the gas estimation. Adopting a higher value (as the typical Milky Way value) would not only result in a gas mass in excess of the dynamical mass, but also in an relatively high gas-to-dust ratio of around .
3.3.2 Depletion time
The depletion timescale, which expresses the time in which the molecular gas reservoir would be consumed at the current SFR (in the absence of inflows or outflows of molecular gas), is calculated as (note that the inverse of this quantity is usually referred to as the star formation efficiency, ). For this calculation we assume the molecular gas mass derived above (§3.2) and the SFR of reported by Zavala et al. (2018). Combining these measurements we infer a gas depletion time of for G09-83808.
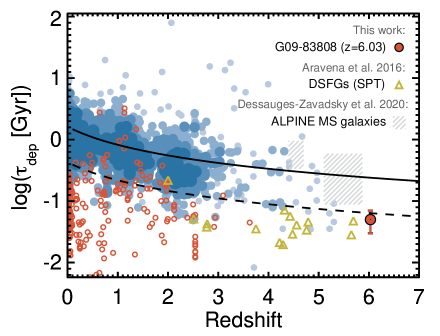
In Figure 4 we compare the gas depletion time of G09-83808 with the large compilation of Tacconi et al. (2020) and their scaling relation. Tacconi et al. (2020) found that the integrated depletion time scale depends mainly on redshift and offset from the main-sequence (). This trend has been confirmed to extend up to thanks to the ALPINE survey (Dessauges-Zavadsky et al. 2020). The inferred depletion time of our target is indeed consistent with this trend of decreasing depletion time with redshift, although significantly shorter than the expected relation for main-sequence galaxies. Surprisingly, its depletion of is in better agreement with the extrapolated relation for starburst galaxies (see Figure 4), despite being located on the main-sequence of star-forming galaxies (as discussed in §2.1).
To extend our comparison to other high-redshift dusty star-forming galaxies, we also include in Figure 4 the seventeen sources reported in Aravena et al. (2016), which cover a redshift range of with a median SFR of . All these galaxies, including G09-83808 and the most extreme galaxies in the Tacconi et al. (2020) compilation (with ; open red circles in the figure), are in better agreement with the Tacconi et al. relation for starburst galaxies (see dashed black line on the left panel of Figure 4).
By looking carefully at Figure 4, one can realize, though, that a significant fraction of these extreme galaxies lie even below this starburst relationship. This is true for almost all of the ULIRGs and the SPT galaxies, which suggests that all these extreme galaxies might have even higher star formation efficiencies. Aravena et al. (2016) concluded that most of the galaxies in their sample are indeed experiencing a starburst phase likely triggered by major mergers. This triggering mechanism could thus explain the shorter depletion times (i.e. higher star formation efficiencies) of these galaxies compared to galaxies around the main-sequence. Similarly, local ULIRGs and other outlier objects are also known to be almost invariably mergers with very compact nuclei (Sanders et al. 1991), which supports the existence of a starburst mode of star formation (e.g. Sargent et al. 2012; Silverman et al. 2015).
The double-peak profile in the lines of G09-83808 (see Figure 2 and Appendix A) might indeed be indicative of a merger activity, as in the case of the core of Arp 220 (Downes & Solomon 1998) and other DSFGs (e.g. Bothwell et al. 2013). Nevertheless, Tsujita et al. (submitted) showed, based on a source-plane reconstruction of the [OIII]88 and [NII]205 emission lines across different velocity channels, that this galaxy is well-modelled by a rotating disk with some compact star-forming clumps. It is thus likely that the high star formation efficiency of this galaxy and its starburst-like properties are the consequence of gas compression induced by its compact size (e.g. Elbaz et al. 2011; Gómez-Guijarro et al. 2022).
3.3.3 Gas fraction
Here, we explore the gas fraction (in terms of the gas-to-stellar mass ratio) of our target and place it in the context of previous studies.
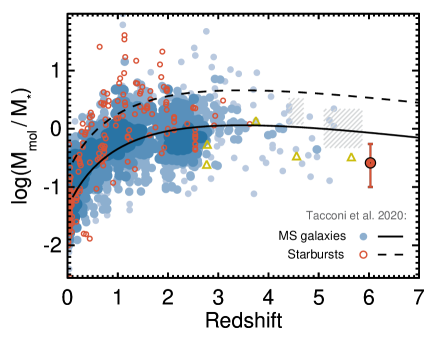
The redshift evolution of this quantity, and its dependency with other parameters, was also studied and parameterized in the recent review by Tacconi et al. (2020). They concluded that the redshift evolution of is better described by a quadratic function, with a steep rise between and , the redshift at which the galaxies show the largest molecular fractions (at fixed ), and with a subtle turnover at higher redshifts (Figure 4). This flattening (or slight turnover) at high redshift is also supported by the recent results of Dessauges-Zavadsky et al. (2020), who measured an average gas fraction of over (although with a relatively large scatter driven likely by galaxies’ stellar masses, as can bee seen in the figure). To lesser degree, this parameter also depends on the vertical location of a galaxy along the main-sequence plane as seen in Figure 4. Such a relation implies that the increase in galaxies’ SFRs with redshift (at fixed ) and with offset from the main sequence (at fixed redshift) is due primarily to increased gas content, and secondarily to an increased efficiency for converting gas to stars – at least for those ‘normal’ galaxies around the main-sequence (the focus of the Tacconi et al. 2020 study).
Figure 4 reveals that some starbursts do also have high gas fractions, suggesting that their high SFRs could also be the result of having a large gas mass reservoir, as seen for modestly star-forming galaxies. Nevertheless, most of the local ULIRGs do not show enhanced gas fractions. The same is true for the few SPT-selected galaxies with stellar mass measurements (Ma et al. 2015), whose gas-to-stellar mass ratios are in agreement with ‘normal’ star-forming galaxies (see Figure 4). Starburst galaxies could thus have a large range of gas fractions, implying that their high SFRs are not always caused by their high gas masses but also by other mechanisms that enhance their star formation efficiencies, as discussed before in the literature (e.g. Scoville et al. 2017).
The galaxy studied in this work has, interestingly, a relatively low gas fraction of (see red solid circle in Figure 4), comparable to those of the SPT sample. This supports the scenario discussed above: G09-83808 shows a starburst mode of star formation with a high star formation efficiency driven likely by its internal properties such as gravitational instabilities or gas compression.
3.4 An alternative scenario with a Milky Way-like CO-to-H2 conversion factor
While a low ULIRG-like CO-to-H2 conversion factor () is favored by the current analysis thanks to the limits placed by the dynamical mass, we cannot totally discard the possibility of a higher value, particularly if the system is experiencing a merger (since the dynamical mass assumes a virialized system). The source-plane reconstruction of this galaxy is well-modelled with a disk profile though (see §3.1 and Tadaki et al. 2022 who used higher angular resolution observations with a physical spatial resolution below in the source plane). In addition, the [OIII]88 and [NII]205 emission lines show evidence of a monotonic velocity gradient consistent with a rotating disk (Tsujita et al. submitted). This backs the applicability of a dynamical estimator for the total gas of G09-838083 and the inferred upper limit on the conversion factor of .
Assuming a larger value of would not only imply a molecular gas mass exceeding the dynamical mass but also a gas-to-dust ratio of (if assuming the Milky Way conversion factor reported in Bolatto et al. 2013); at odds with the typical values measured for massive and metal-rich star-forming galaxies. A galaxy with would be expected to have a relatively low metallicity in the range of (according to the -metallicity relations of Rémy-Ruyer et al. 2014; Tacconi et al. 2018; Boogaard et al. 2021). This contrasts with the metallicity of G09-838083 which was constrained to by Tadaki et al. (2022). Therefore, given the current constraints, the possibility of G09-83808 having a large Milky Way-like CO-to-H2 conversion factor seems unlikely.
4 Discussion and conclusions
Taking advantage of gravitational amplification, here we present the first detection of in a galaxy lying on the main-sequence of the plane and the characterization of its cold ISM and star formation.
While G09-83808 lies around the scatter of the main-sequence of star-forming galaxies at (see Figure 1), it shows properties that resemble those from local ULIRGs and other starbursts, including a compact (dust and gas) size of kpc (§3.1), a relatively high dust temperature (; Zavala et al. 2018), a low of (§3.2), and a short depletion time (; §3.3.2). All this suggests that galaxies with starburst-like ISM properties and star formation modes could also be hidden within the main-sequence population (see also Gómez-Guijarro et al. 2022).
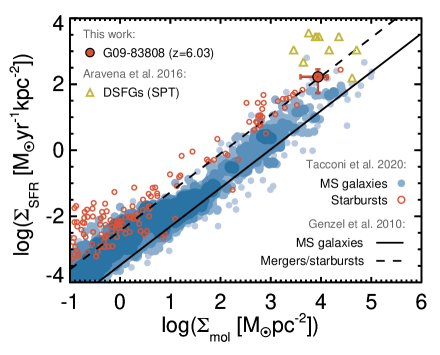
The starburst-like nature of G09-83808 is further revealed by the Kennicutt-Schmidt relation (Figure 5). This galaxy shows a high star formation rate surface density () in agreement with what is expected for merger/starburst galaxies, according to the relation of Genzel et al. 2010 (see dashed black line in the figure). Previous studies have found that galaxies with high show shorter depletion timescales, smaller gas fractions, warmer dust temperatures, and high excitation conditions (e.g. Narayanan & Krumholz 2014; Franco et al. 2020; Burnham et al. 2021; Puglisi et al. 2021) in line with the properties of our target. We thus hypothesize that the star formation rate surface density can be a better indicator of starburst-like galaxies than the main-sequence offset (or at least, alternative to).
Despite its starburst-like nature, this high-redshift ULIRG analog, shows a relatively low gas fraction of (see Figure 4 and Section 3.3.3), implying that its starburst episode is not produced by an increased gas supply, but rather by a physical triggering mechanism that enhances its star formation efficiency. Typical mechanisms cited in the literature to explain this starburst mode of star formation include major/minor mergers, compactness, and disk instabilities. While higher angular resolutions are required to precisely determine the causes of the high star formation efficiency in G09-83808, we attribute it to its internal properties, such as compactness and/or gravitational instabilities which facilitate gas compression (see further discussion in Tsujita et al. submitted, who found evidence of star-forming clumps within the rotating disk of this system). This is in line with recent results from Gómez-Guijarro et al. (2022), who found that the most compact galaxies show the shortest depletion time and a starburst-like modes of star formation.
Without further significant gas accretion, we estimate, following Casey et al. (2021), that G09-83808 will finish its star formation episode at with a final stellar mass on the order of . This is well aligned with the derived masses of massive quiescent galaxies discovered at high redshifts (e.g. Tanaka et al. 2019; Marsan et al. 2020; Valentino et al. 2020; Santini et al. 2021; Stevans et al. 2021), which also show compact sizes similar to the size of our target. This hints at a progenitor-descendant scenario between these populations of galaxies, and support other results from the literature suggesting that compact galaxies with low gas fractions and short depletion times are likely in the latest stages of a starburst episode and on the verge of quenching (e.g. van Dokkum et al. 2015; Spilker et al. 2016a; Puglisi et al. 2021; Gómez-Guijarro et al. 2022; Ikarashi et al. 2022).
The determination of the molecular gas mass via direct detection of a low-J CO line transition also allows us to test whether or not other widely used methods to infer gas masses are also valid at . We found that the relationship between the rest-frame specific luminosity and CO line luminosity (), on which the Scoville et al. 2016 calibration for estimating ISM masses from dust continuum emission is built on, satisfactorily predicts the line luminosity for this system within a factor of . Therefore, single band continuum observations seem to be a promising way to constrain galaxies’ gas masses even at this early epoch (modulo the assumption of a similar ). A corollary that could follow this result is that the gas-to-dust ratio, , in massive (metal-rich) star-forming galaxies does not significantly evolve with redshift, as predicted by recent simulations (e.g. Li et al. 2019; Popping & Péroux 2022). This is independently confirmed for our target using the gas and dust estimates, from which we derive a . This value is also in relatively good agreement with the expected given its high metallicity of (if assuming a linear correlation between gas-to-dust ratio and metallicity, as those reported in Tacconi et al. 2018 and Boogaard et al. 2021).
This experiment would not have been possible without the gravitational amplification effect on this galaxy, as of order h on the VLA would have been required. In the near future, the ALMA Band-1 receiver (Huang et al. 2016) might be able to detect in similar unlensed galaxies with observations on the order of a few of hours although limited to . The detection of cold molecular gas in ‘normal’, unlensed star-forming galaxies at higher redshifts is thus prohibitive with current facilities and requires a ten-fold improvement in sensitivity. This stresses the necessity of new generation facilities such as the next-generation VLA (ngVLA, Carilli et al. 2015) to directly pin down the molecular gas content of galaxies within the epoch of reionization and to calibrate alternative tracers.
Given that the gravitational amplification factor in this galaxy is similar to the expected increase in sensitivity of the ngVLA, this work can be seen as a preview of the unique expected capabilities of the ngVLA to study the cold ISM in galaxies within the first billion years of the Universe. At the same time, this detection solves previous concerns about the detectability of such emission lines due to the increasing temperature of the CMB, anticipating the success of future radio facilities, although we note that the CMB impact could be higher in more extended sources with lower gas kinetic temperatures.
Appendix A Double-peak line profiles
References
- Aravena et al. (2016) Aravena, M., Spilker, J. S., Bethermin, M., et al. 2016, MNRAS, 457, 4406, doi: 10.1093/mnras/stw275
- Bertin & Arnouts (1996) Bertin, E., & Arnouts, S. 1996, A&AS, 117, 393, doi: 10.1051/aas:1996164
- Béthermin et al. (2020) Béthermin, M., Fudamoto, Y., Ginolfi, M., et al. 2020, A&A, 643, A2, doi: 10.1051/0004-6361/202037649
- Bolatto et al. (2013) Bolatto, A. D., Wolfire, M., & Leroy, A. K. 2013, ARA&A, 51, 207, doi: 10.1146/annurev-astro-082812-140944
- Boogaard et al. (2021) Boogaard, L. A., Bouwens, R. J., Riechers, D., et al. 2021, ApJ, 916, 12, doi: 10.3847/1538-4357/ac01d7
- Bothwell et al. (2010) Bothwell, M. S., Chapman, S. C., Tacconi, L., et al. 2010, MNRAS, 405, 219, doi: 10.1111/j.1365-2966.2010.16480.x
- Bothwell et al. (2013) Bothwell, M. S., Smail, I., Chapman, S. C., et al. 2013, MNRAS, 429, 3047, doi: 10.1093/mnras/sts562
- Bryant & Scoville (1999) Bryant, P. M., & Scoville, N. Z. 1999, AJ, 117, 2632, doi: 10.1086/300879
- Burnham et al. (2021) Burnham, A. D., Casey, C. M., Zavala, J. A., et al. 2021, ApJ, 910, 89, doi: 10.3847/1538-4357/abe401
- Carilli & Walter (2013) Carilli, C. L., & Walter, F. 2013, ARA&A, 51, 105, doi: 10.1146/annurev-astro-082812-140953
- Carilli et al. (2015) Carilli, C. L., McKinnon, M., Ott, J., et al. 2015, arXiv e-prints, arXiv:1510.06438. https://arxiv.org/abs/1510.06438
- Casey et al. (2014) Casey, C. M., Narayanan, D., & Cooray, A. 2014, Phys. Rep., 541, 45, doi: 10.1016/j.physrep.2014.02.009
- Casey et al. (2015) Casey, C. M., Hodge, J. A., Lacy, M., et al. 2015, arXiv e-prints, arXiv:1510.06411. https://arxiv.org/abs/1510.06411
- Casey et al. (2018) Casey, C. M., Narayanan, D., Carilli, C., et al. 2018, in Astronomical Society of the Pacific Conference Series, Vol. 517, Science with a Next Generation Very Large Array, ed. E. Murphy, 629. https://arxiv.org/abs/1810.08258
- Casey et al. (2019) Casey, C. M., Zavala, J. A., Aravena, M., et al. 2019, ApJ, 887, 55, doi: 10.3847/1538-4357/ab52ff
- Casey et al. (2021) Casey, C. M., Zavala, J. A., Manning, S. M., et al. 2021, ApJ, 923, 215, doi: 10.3847/1538-4357/ac2eb4
- da Cunha et al. (2008) da Cunha, E., Charlot, S., & Elbaz, D. 2008, MNRAS, 388, 1595, doi: 10.1111/j.1365-2966.2008.13535.x
- da Cunha et al. (2013) da Cunha, E., Groves, B., Walter, F., et al. 2013, ApJ, 766, 13, doi: 10.1088/0004-637X/766/1/13
- Decarli et al. (2018) Decarli, R., Carilli, C., Casey, C., et al. 2018, in Astronomical Society of the Pacific Conference Series, Vol. 517, Science with a Next Generation Very Large Array, ed. E. Murphy, 565. https://arxiv.org/abs/1810.07546
- Dessauges-Zavadsky et al. (2020) Dessauges-Zavadsky, M., Ginolfi, M., Pozzi, F., et al. 2020, A&A, 643, A5, doi: 10.1051/0004-6361/202038231
- Downes & Solomon (1998) Downes, D., & Solomon, P. M. 1998, ApJ, 507, 615, doi: 10.1086/306339
- Elbaz et al. (2011) Elbaz, D., Dickinson, M., Hwang, H. S., et al. 2011, A&A, 533, A119, doi: 10.1051/0004-6361/201117239
- Engel et al. (2010) Engel, H., Tacconi, L. J., Davies, R. I., et al. 2010, ApJ, 724, 233, doi: 10.1088/0004-637X/724/1/233
- Franco et al. (2020) Franco, M., Elbaz, D., Zhou, L., et al. 2020, A&A, 643, A30, doi: 10.1051/0004-6361/202038312
- Fudamoto et al. (2017) Fudamoto, Y., Ivison, R. J., Oteo, I., et al. 2017, MNRAS, 472, 2028, doi: 10.1093/mnras/stx1956
- Genzel et al. (2010) Genzel, R., Tacconi, L. J., Gracia-Carpio, J., et al. 2010, MNRAS, 407, 2091, doi: 10.1111/j.1365-2966.2010.16969.x
- Genzel et al. (2015) Genzel, R., Tacconi, L. J., Lutz, D., et al. 2015, ApJ, 800, 20, doi: 10.1088/0004-637X/800/1/20
- Gómez-Guijarro et al. (2022) Gómez-Guijarro, C., Elbaz, D., Xiao, M., et al. 2022, A&A, 659, A196, doi: 10.1051/0004-6361/202142352
- Harrington et al. (2021) Harrington, K. C., Weiss, A., Yun, M. S., et al. 2021, ApJ, 908, 95, doi: 10.3847/1538-4357/abcc01
- Huang et al. (2016) Huang, Y. D. T., Morata, O., Koch, P. M., et al. 2016, in Society of Photo-Optical Instrumentation Engineers (SPIE) Conference Series, Vol. 9911, Modeling, Systems Engineering, and Project Management for Astronomy VI, ed. G. Z. Angeli & P. Dierickx, 99111V, doi: 10.1117/12.2232193
- Ikarashi et al. (2022) Ikarashi, S., Ivison, R. J., Cowley, W. I., & Kohno, K. 2022, A&A, 659, A154, doi: 10.1051/0004-6361/202141196
- Ivison et al. (2016) Ivison, R. J., Lewis, A. J. R., Weiss, A., et al. 2016, ApJ, 832, 78, doi: 10.3847/0004-637X/832/1/78
- Jarugula et al. (2021) Jarugula, S., Vieira, J. D., Weiß, A., et al. 2021, arXiv e-prints, arXiv:2108.11319. https://arxiv.org/abs/2108.11319
- Khusanova et al. (2021) Khusanova, Y., Bethermin, M., Le Fèvre, O., et al. 2021, A&A, 649, A152, doi: 10.1051/0004-6361/202038944
- Le Fèvre et al. (2020) Le Fèvre, O., Béthermin, M., Faisst, A., et al. 2020, A&A, 643, A1, doi: 10.1051/0004-6361/201936965
- Leroy et al. (2011) Leroy, A. K., Bolatto, A., Gordon, K., et al. 2011, ApJ, 737, 12, doi: 10.1088/0004-637X/737/1/12
- Li et al. (2019) Li, Q., Narayanan, D., & Davé, R. 2019, MNRAS, 490, 1425, doi: 10.1093/mnras/stz2684
- Liu et al. (2019) Liu, D., Schinnerer, E., Groves, B., et al. 2019, ApJ, 887, 235, doi: 10.3847/1538-4357/ab578d
- Ma et al. (2015) Ma, J., Gonzalez, A. H., Spilker, J. S., et al. 2015, ApJ, 812, 88, doi: 10.1088/0004-637X/812/1/88
- Magdis et al. (2012) Magdis, G. E., Daddi, E., Béthermin, M., et al. 2012, ApJ, 760, 6, doi: 10.1088/0004-637X/760/1/6
- Marrone et al. (2018) Marrone, D. P., Spilker, J. S., Hayward, C. C., et al. 2018, Nature, 553, 51, doi: 10.1038/nature24629
- Marsan et al. (2020) Marsan, Z. C., Muzzin, A., Marchesini, D., et al. 2020, arXiv e-prints, arXiv:2010.04725. https://arxiv.org/abs/2010.04725
- Murphy et al. (2018) Murphy, E. J., Bolatto, A., Chatterjee, S., et al. 2018, in Astronomical Society of the Pacific Conference Series, Vol. 517, Science with a Next Generation Very Large Array, ed. E. Murphy, 3. https://arxiv.org/abs/1810.07524
- Narayanan & Krumholz (2014) Narayanan, D., & Krumholz, M. R. 2014, MNRAS, 442, 1411, doi: 10.1093/mnras/stu834
- Pavesi et al. (2018) Pavesi, R., Riechers, D. A., Sharon, C. E., et al. 2018, ApJ, 861, 43, doi: 10.3847/1538-4357/aac6b6
- Pearson et al. (2018) Pearson, W. J., Wang, L., Hurley, P. D., et al. 2018, A&A, 615, A146, doi: 10.1051/0004-6361/201832821
- Peng et al. (2002) Peng, C. Y., Ho, L. C., Impey, C. D., & Rix, H.-W. 2002, AJ, 124, 266, doi: 10.1086/340952
- Penzias et al. (1971) Penzias, A. A., Jefferts, K. B., & Wilson, R. W. 1971, ApJ, 165, 229, doi: 10.1086/150893
- Pillepich et al. (2018) Pillepich, A., Springel, V., Nelson, D., et al. 2018, MNRAS, 473, 4077, doi: 10.1093/mnras/stx2656
- Planck Collaboration et al. (2016) Planck Collaboration, Ade, P. A. R., Aghanim, N., et al. 2016, A&A, 594, A13, doi: 10.1051/0004-6361/201525830
- Popping & Péroux (2022) Popping, G., & Péroux, C. 2022, arXiv e-prints, arXiv:2203.03686. https://arxiv.org/abs/2203.03686
- Puglisi et al. (2021) Puglisi, A., Daddi, E., Valentino, F., et al. 2021, MNRAS, 508, 5217, doi: 10.1093/mnras/stab2914
- Rémy-Ruyer et al. (2014) Rémy-Ruyer, A., Madden, S. C., Galliano, F., et al. 2014, A&A, 563, A31, doi: 10.1051/0004-6361/201322803
- Rickard et al. (1975) Rickard, L. J., Palmer, P., Morris, M., Zuckerman, B., & Turner, B. E. 1975, ApJ, 199, L75, doi: 10.1086/181852
- Riechers et al. (2013) Riechers, D. A., Bradford, C. M., Clements, D. L., et al. 2013, Nature, 496, 329, doi: 10.1038/nature12050
- Saintonge et al. (2013) Saintonge, A., Lutz, D., Genzel, R., et al. 2013, ApJ, 778, 2, doi: 10.1088/0004-637X/778/1/2
- Sanders et al. (1991) Sanders, D. B., Scoville, N. Z., & Soifer, B. T. 1991, ApJ, 370, 158, doi: 10.1086/169800
- Santini et al. (2021) Santini, P., Castellano, M., Merlin, E., et al. 2021, A&A, 652, A30, doi: 10.1051/0004-6361/202039738
- Sargent et al. (2012) Sargent, M. T., Béthermin, M., Daddi, E., & Elbaz, D. 2012, ApJ, 747, L31, doi: 10.1088/2041-8205/747/2/L31
- Schreiber et al. (2015) Schreiber, C., Pannella, M., Elbaz, D., et al. 2015, A&A, 575, A74, doi: 10.1051/0004-6361/201425017
- Scoville et al. (2016) Scoville, N., Sheth, K., Aussel, H., et al. 2016, ApJ, 820, 83, doi: 10.3847/0004-637X/820/2/83
- Scoville et al. (2017) Scoville, N., Lee, N., Vanden Bout, P., et al. 2017, ApJ, 837, 150, doi: 10.3847/1538-4357/aa61a0
- Selina et al. (2018) Selina, R. J., Murphy, E. J., McKinnon, M., et al. 2018, in Astronomical Society of the Pacific Conference Series, Vol. 517, Science with a Next Generation Very Large Array, ed. E. Murphy, 15. https://arxiv.org/abs/1810.08197
- Sérsic (1963) Sérsic, J. L. 1963, Boletin de la Asociacion Argentina de Astronomia La Plata Argentina, 6, 41
- Silverman et al. (2015) Silverman, J. D., Daddi, E., Rodighiero, G., et al. 2015, ApJ, 812, L23, doi: 10.1088/2041-8205/812/2/L23
- Solomon & de Zafra (1975) Solomon, P. M., & de Zafra, R. 1975, ApJ, 199, L79, doi: 10.1086/181853
- Solomon et al. (1992) Solomon, P. M., Downes, D., & Radford, S. J. E. 1992, ApJ, 398, L29, doi: 10.1086/186569
- Spilker et al. (2016a) Spilker, J. S., Bezanson, R., Marrone, D. P., et al. 2016a, ApJ, 832, 19, doi: 10.3847/0004-637X/832/1/19
- Spilker et al. (2016b) Spilker, J. S., Marrone, D. P., Aravena, M., et al. 2016b, ApJ, 826, 112, doi: 10.3847/0004-637X/826/2/112
- Stevans et al. (2021) Stevans, M. L., Finkelstein, S. L., Kawinwanichakij, L., et al. 2021, ApJ, 921, 58, doi: 10.3847/1538-4357/ac0cf6
- Strandet et al. (2017) Strandet, M. L., Weiss, A., De Breuck, C., et al. 2017, ApJ, 842, L15, doi: 10.3847/2041-8213/aa74b0
- Tacconi et al. (2020) Tacconi, L. J., Genzel, R., & Sternberg, A. 2020, ARA&A, 58, 157, doi: 10.1146/annurev-astro-082812-141034
- Tacconi et al. (2018) Tacconi, L. J., Genzel, R., Saintonge, A., et al. 2018, ApJ, 853, 179, doi: 10.3847/1538-4357/aaa4b4
- Tadaki et al. (2022) Tadaki, K.-i., Tsujita, A., Tamura, Y., et al. 2022, arXiv e-prints, arXiv:2202.09945. https://arxiv.org/abs/2202.09945
- Tanaka et al. (2019) Tanaka, M., Valentino, F., Toft, S., et al. 2019, ApJ, 885, L34, doi: 10.3847/2041-8213/ab4ff3
- Tomczak et al. (2016) Tomczak, A. R., Quadri, R. F., Tran, K.-V. H., et al. 2016, ApJ, 817, 118, doi: 10.3847/0004-637X/817/2/118
- Valentino et al. (2018) Valentino, F., Magdis, G. E., Daddi, E., et al. 2018, ApJ, 869, 27, doi: 10.3847/1538-4357/aaeb88
- Valentino et al. (2020) Valentino, F., Tanaka, M., Davidzon, I., et al. 2020, ApJ, 889, 93, doi: 10.3847/1538-4357/ab64dc
- van Dokkum et al. (2015) van Dokkum, P. G., Nelson, E. J., Franx, M., et al. 2015, ApJ, 813, 23, doi: 10.1088/0004-637X/813/1/23
- Walter et al. (2020) Walter, F., Carilli, C., Neeleman, M., et al. 2020, ApJ, 902, 111, doi: 10.3847/1538-4357/abb82e
- Wilson et al. (1970) Wilson, R. W., Jefferts, K. B., & Penzias, A. A. 1970, ApJ, 161, L43, doi: 10.1086/180567
- Zavala et al. (2018) Zavala, J. A., Montaña, A., Hughes, D. H., et al. 2018, Nature Astronomy, 2, 56, doi: 10.1038/s41550-017-0297-8