Hubble Space Telescope Imaging Reveals That SN 2015bh Is Much Fainter than Its Progenitor
Abstract
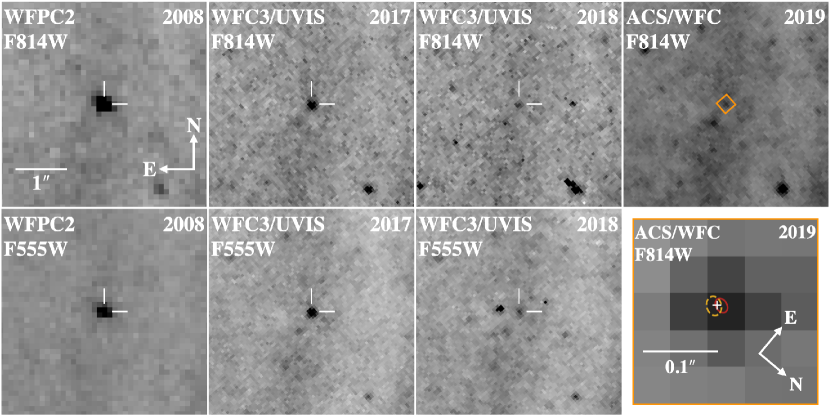
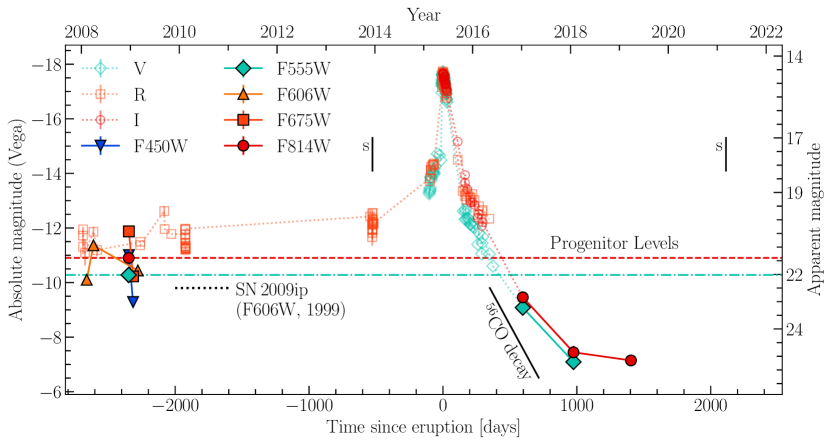
We present Hubble Space Telescope (HST) imaging of the site of SN 2015bh in the nearby spiral galaxy NGC 2770 taken between 2017 and 2019, nearly four years after the peak of the explosion. In 2017–2018, the transient fades steadily in optical filters before declining more slowly to mag in 2019, 4 mag below the level of its eruptive luminous blue variable (LBV) progenitor observed with HST in 2008–2009. The source fades at a constant color of mag until 2018, similar to SN 2009ip and consistent with a spectrum dominated by interaction of the ejecta with circumstellar material (CSM). A deep optical spectrum obtained in 2021 lacks signatures of ongoing interaction ( erg s-1 for broadened emission 2000 km s-1), but indicates the presence of a nearby H II region (300 pc). The color evolution of the fading source makes it unlikely that emission from a scattered-light echo or binary OB companion of the progenitor contributes significantly to the flattening of the late-time light curve. The remaining emission in 2019 may plausibly be attributed an evolved/inflated companion or an unresolved (3 pc), young stellar cluster. Importantly, the color evolution of SN 2015bh rules out scenarios in which the surviving progenitor is obscured by nascent dust and does not clearly indicate a transition to a hotter, optically faint state. The simplest explanation is that the massive progenitor did not survive. SN 2015bh likely represents a remarkable example of the terminal explosion of a massive star preceded by decades of end-stage eruptive variability.
1 Introduction
Many massive stars (8 ) end their lives as core-collapse (CC) supernovae (SNe). Some fraction of massive stars may instead collapse directly to black holes, but the ranges of initial mass and evolutionary details that lead to these fates are debated. There is also mounting evidence that these cataclysms can be preceded by months to years of tumult. Type IIn SNe (the “n” signifies narrow emission features; Schlegel, 1990; Filippenko, 1997; Smith, 2017), in particular, show spectral signatures and high luminosities that require strong shock interaction with large masses of circumstellar material (CSM). This material may have been shed in violent eruptive events decades prior to the SN (see Smith 2014 for a review) or in an enhanced wind in the last 103 yr of the progenitor’s life (e.g. Yoon & Cantiello, 2010; Smith et al., 2017). In some cases, as we discuss further below, outbursts have in fact been detected in the years directly preceding an SN. Massive star models connect this pre-SN variability to the late nuclear-burning phases that occur in the final few years of a massive star’s life (Quataert & Shiode, 2012; Smith & Arnett, 2014; Fuller, 2017). For very massive stars (70 ), the pulsational pair-instability mechanism predicts luminous and diverse nonterminal events (Woosley, 2017).
Observationally, there is a diverse class of intermediate-luminosity transients found in nearby galaxies dubbed “SN impostors,” so named because they were originally seen in surveys for SNe. Their spectra mimic Type IIn SNe, although SN impostors typically have even narrower emission lines and lower luminosities (Smith et al., 2011). They have been interpreted as nonterminal events linked to luminous blue variable (LBV) stars (e.g., Van Dyk et al., 2000), but the physical mechanisms behind these outbursts remain unsatisfactorily explained. An important test to distinguish true CC SNe from impostors is to obtain deep, late-time imaging to search for a surviving star. This can be difficult to constrain in practice for extragalactic sources, as ejected material may form obscuring dust, while ongoing CSM interaction may resemble a surviving star or mask the usual signatures of a CC SN (see, e.g., the recent debate surrounding SN 1961V; Kochanek et al., 2011; Smith et al., 2011; Van Dyk & Matheson, 2012; Patton et al., 2019; Woosley & Smith, 2022).
Precursor outbursts during the months to years before an apparent SN explosion have now also been seen in several instances (e.g., Foley et al., 2007; Pastorello et al., 2007; Fraser et al., 2013a; Mauerhan et al., 2013; Ofek et al., 2013; Margutti et al., 2014; Ofek et al., 2014; Elias-Rosa et al., 2016; Ofek et al., 2016; Tartaglia et al., 2016; Thöne et al., 2017; Nyholm et al., 2017; Pastorello et al., 2018; Reguitti et al., 2019; Ho et al., 2019; Strotjohann et al., 2021). Perhaps the most well-studied example of this phenomenon is the enigmatic SN 2009ip. The object was first identified as a bright outburst in 2009 of a massive (50–60 ) blue supergiant (BSG) star (Smith et al., 2010; Foley et al., 2011). Subsequent observations revealed a series of outbursts and erratic variability that culminated in a much more luminous, Type IIn SN-like event in 2012 with broad spectral features (FWHM 8000 km s-1, 13,000 km s-1 P Cygni absorption; Fraser et al., 2013b; Mauerhan et al., 2013; Pastorello et al., 2013; Prieto et al., 2013; Smith et al., 2014). The main brightening of SN 2009ip had a distinctive double-peaked light curve, the first reaching mag and the second reaching mag around 40 days later. Monitoring of the event revealed the presence of dense, complex CSM (Graham et al., 2014; Margutti et al., 2014; Mauerhan et al., 2014; Martin et al., 2015), possibly with a disk-like geometry pointing to the influence of binary interactions (e.g., Mauerhan et al., 2013, 2014; Levesque et al., 2014; Smith, 2014; Reilly et al., 2017). A class of objects with similar properties has been identified in recent years, including SN 2010mc (Ofek et al., 2013; Smith et al., 2013), LSQ13zm (Tartaglia et al., 2016), AT 2016jbu (or Gaia16crf; Kilpatrick et al., 2018; Brennan et al., 2022b, c), SN 2016bdu (Pastorello et al., 2018), and the main subject of this work, SN 2015bh (Elias-Rosa et al., 2016; Ofek et al., 2016; Thöne et al., 2017).
The nature of these SN 2009ip-like objects is debated and a range of physical scenarios has been proposed. In one nonterminal scenario, an eruptive outburst powers the first peak and subsequent interactions with previously ejected material powers the main peak (e.g., Pastorello et al., 2013; Fraser et al., 2015; Moriya, 2015). Comparisons have also been drawn between the rapid pre-SN variability of SN 2009ip and the periastron collisions of an eccentric binary seen preceding the Great Eruption of Car (e.g., Smith et al., 2011; Smith & Frew, 2011), in which case the main event may have been powered by the final merger (Smith et al., 2018; Hirai et al., 2021). A merge-burst scenario has therefore also been suggested for SN 2009ip-like objects (Kashi et al., 2013; Soker & Kashi, 2013, 2016). Terminal scenarios have been proposed involving a relatively faint CC SN from a BSG (first peak) followed by strong circumstellar interaction (second peak) (Mauerhan et al., 2013; Smith et al., 2014), with noted similarities between the first peak of SN 2015bh and SN 1987A (Elias-Rosa et al., 2016). Alternatively, the first peak may represent a last-gasp precursor outburst followed by the final CC SN (Ofek et al., 2013; Tartaglia et al., 2016; Thöne et al., 2017). An inherent feature in all of these scenarios is long-lived CSM interaction that dominates observations at late times, masking the ultimate fate of the progenitor. Despite this complication, both SN 2009ip and AT 2016jbu have continued to fade below the level of their progenitors, indicating that the massive LBV stars are now gone (Smith et al., 2022; Brennan et al., 2022a).
Among the SN 2009ip-like events, SN 2015bh is remarkable for its exceptionally well-characterized progenitor and comprehensive monitoring of the evolving transient. The transient occurred in the nearby spiral galaxy NGC 2770 (we adopt Mpc; mag, see Appendix A) with ample archival Hubble Space Telescope (HST) and ground-based data spanning decades. The pre-SN light curve of SN 2015bh reveals a highly variable source since at least 1994 and episodes of rapid variability that were well documented in 2008, 2009, and 2013 (Elias-Rosa et al., 2016; Ofek et al., 2016; Thöne et al., 2017; Boian & Groh, 2018). A bright counterpart was identified in multiepoch, multifilter HST imaging in 2008–2009, indicating large variations in both temperature (– K) and luminosity (–6.6) consistent with a very massive star experiencing LBV-like outbursts (Elias-Rosa et al., 2016). A rare progenitor spectrum was obtained at the onset of the 2013 outburst that showed narrow H emission ( km s-1) with a 1300 km s-1 P Cygni absorption feature (Ofek et al., 2016). Based on radiative-transfer modeling of the spectrum, Boian & Groh (2018) propose that the progenitor was an LBV, possibly 35 , with an optically thick wind. These prior studies note that if the event was nonterminal, the surviving star should be observable as a similarly luminous object in late-time imaging.
In this paper, we confront these predictions with photometric data from HST taken between 2017 and 2019, nearly four years after the peak of the explosive transient. Following Thöne et al. (2017), we adopt the time of the observed peak on UT 2015 May 24.28 (MJD 57166.28) as the reference point for the phase of the transient ( days) throughout. We also assume a total (Milky Way and host) extinction of mag and employ the reddening law of Fitzpatrick (1999) with (see Appendix A). Our main result is that the source has faded well below the level of the progenitor in postexplosion, broadband imaging (see Figure 1). SN 2015bh joins SN 2009ip (Smith et al., 2022) and AT 2016jbu (Brennan et al., 2022a) in this respect, likely pointing to a terminal explosion, as has also been seen for at least some other Type IIn SNe, such as SN 1961V (Patton et al., 2019) and SN 2005gl (Gal-Yam & Leonard, 2009).
2 Observations
Here, we present late-time HST imaging and photometry of SN 2015bh, along with a deep optical spectrum at the transient location, in order to track and constrain associated emission as it fades below the progenitor level. All of the HST data presented in this paper were obtained from the Mikulski Archive for Space Telescopes (MAST) at the Space Telescope Science Institute. The specific observations analyzed can be accessed via https://doi.org/10.17909/ksn7-y471.
2.1 Late-time HST Imaging
The location of SN 2015bh has been imaged by HST multiple times since the main SN-like event in 2015. The available late-time data include imaging with the Wide Field Camera 3 (WFC3) UVIS imager in the and filters taken on 2017 January 9.6, the and filters on 2017 February 17.9, and again in and on 2018 January 23.2 (PI: A. Filippenko, PIDs: 14668, 15166). Additional deep imaging with the Advanced Camera for Surveys (ACS) Wide Field Channel (WFC) in the filter was obtained on 2019 March 28.7 as part of an HST search for disappearing massive stars as failed SNe that form black holes (PI D. Sand, PID 15645; Jencson et al., 2022). We describe the image processing steps and use of the DOLPHOT package (Dolphin, 2000, 2016) to extract photometry of SN 2015bh in Appendix B. We also confirm the positional association of the faint source detected in 2019 with SN 2015bh with an astrometric analysis (Appendix C). In the unlikely case of a chance coincidence with an unrelated source (0.03%), then the magnitudes reported here give upper limits on the SN or any remnant, as there are no other plausible counterparts in the vicinity. Our photometry (Vega magnitudes) is presented in Table 1 and the long-term, multiband light curves are shown in Figure 2.
| UT Date | MJD | Inst. | Band | App. MagnitudeaaObserved Vega magnitudes. No extinction corrections applied. 1 uncertainties are given in parentheses. |
|---|---|---|---|---|
| 2017 Jan 09.59 | 57762.59 | WFC3/UVIS | 23.24 (0.11) | |
| 2017 Jan 09.60 | 57762.60 | WFC3/UVIS | 23.95 (0.06) | |
| 2017 Feb 17.88 | 57801.88 | WFC3/UVIS | 24.47 (0.15) | |
| 2017 Feb 17.88 | 57801.88 | WFC3/UVIS | 23.37 (0.08) | |
| 2018 Jan 23.21 | 58141.21 | WFC3/UVIS | 25.25 (0.24) | |
| 2018 Jan 23.22 | 58141.22 | WFC3/UVIS | 25.94 (0.14) | |
| 2019 Mar 28.69 | 58570.69 | ACS/WFC | 25.55 (0.20) |
2.2 Spectroscopy
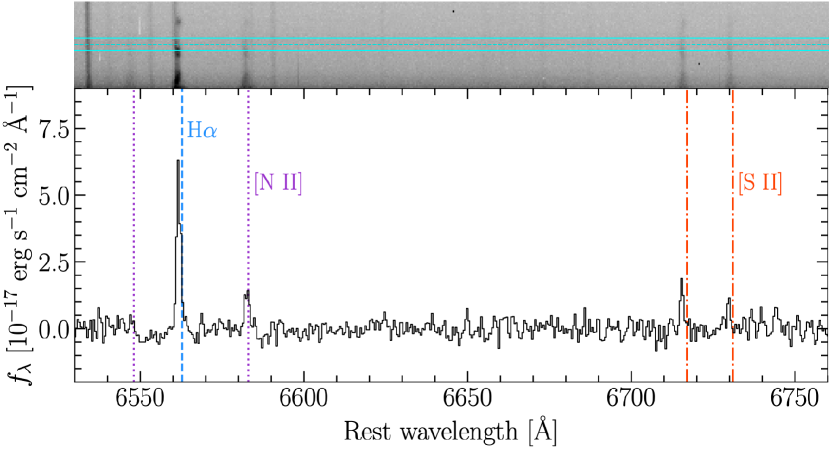
We obtained a moderate-resolution optical spectrum on 2021 March 7.3, more than 5 yr after the explosion, with the Blue Channel Spectrograph at MMT Observatory on Mount Hopkins in Arizona. We used a 1200 l mm-1 grating with a central wavelength of 6362 Å and a slit. This provides a wavelength coverage of – Å and a resolving power of . As SN 2015bh was faint at this phase (see light curves in Figure 2), we first obtained a short 120 s exposure on a nearby reference star. We then performed a blind offset to acquire the position of SN 2015bh, where we obtained a total of s exposures. Standard reduction procedures were carried out using IRAF (Tody, 1986). We used the reference star observation to determine the position of SN 2015bh on the slit and the shape of the spectral trace for extraction. We performed flux calibration of the 1D spectrum using observations of a spectrophotometric standard taken at a similar airmass on the same night. The reduced spectrum in shown in Figure 3.
3 Analysis and Results
3.1 Late-time Photometric Evolution
The long-term evolution in the light curves of SN 2015bh is shown in Figure 2, from the earliest HST detections of the progenitor star in 2008–2009 (Elias-Rosa et al., 2016), through several precursor eruptions, the multiphase main outburst in 2015 (Goranskij et al., 2016; Ofek et al., 2016; Elias-Rosa et al., 2016), and the very late-time fading of the SN in our newly presented HST photometry extending nearly four years after the explosion. A comprehensive photometric history of the source up to 2016, including precursor variability observed since 1994 is also presented in Thöne et al. (2017). The primary result of the present work is that between 2017 and 2019 the SN has faded significantly below the level of the 2008 progenitor detections in broadband filters, notably by mag at as of March 2019.
Between 2017–2018 (–975 days), the source fades at a rate of mag day-1 at (). There is essentially no observed color evolution between and during this time, with at days. This is somewhat bluer than the latest ground-based photometry reported by Thöne et al. (2017) in 2016 at a phase of days in comparable filters of mag and bluer than the 2008 progenitor source at mag (Elias-Rosa et al., 2016). Between 2018 and the latest observation in 2019 (–1404 days), the fade rate at slows to mag day-1, nominally consistent with a flat evolution. Correcting for foreground extinction, the source reaches its faintest ever observed magnitude of mag ( mag) in the final observation.
3.1.1 Spectral Energy Distribution Evolution
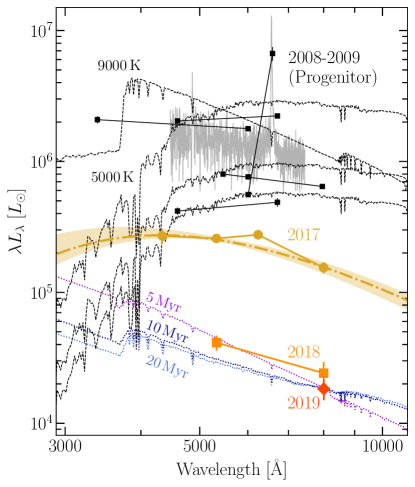
We constructed multiepoch spectral energy distributions (SEDs) of SN 2015bh from the available pre- and postexplosion HST photometry, as shown in Figure 4. The photometric magnitudes were converted to band luminosities using the filter zero-points and effective wavelengths available in the pysynphot package (STScI Development Team, 2013). We reproduce the characterization by Elias-Rosa et al. (2016) of the 2008–2009 progenitor photometry with ATLAS synthetic stellar spectra (Castelli & Kurucz, 2003) with effective temperatures – K and bolometric luminosities – erg s-1 (–). This characterization is mostly illustrative, as the observed 2013 progenitor showed strong emission lines indicative of intense mass loss (Ofek et al., 2016; Boian & Groh, 2018).
In 2017 ( and 635.6 days), the source has already faded well below any of the available progenitor photometry in broadband optical filters. We fit a blackbody spectrum to the data, excluding the point that we expect is contaminated by H emission. We performed a Markov chain Monte Carlo (MCMC) simulation with the lightcurve_fitting package (Hosseinzadeh & Gomez, 2022)111https://griffin-h.github.io/lightcurve_fitting/index.html, from which we adopt the 16th and 84th percentiles of the posterior distributions as estimates of the uncertainties in the fitting parameters. We obtained K and , corresponding to a luminosity of erg s-1 (). In 2018, the blackbody temperature of the source is poorly constrained with and measurements alone (the MCMC yields –44,000 K). Requiring that in 2018 be lower than the 2019 upper bound, however, constrains 20,000 K in 2018. Still, given the lack of observed color evolution, it seems unlikely that the SED has changed significantly. Simply scaling the 2017 blackbody with K to the 2018 photometry, we find erg s-1 (). This is a factor of 13 fainter in luminosity than the faintest level inferred from the 2008–2009 progenitor photometry. These estimates should be viewed with additional caution, as the spectrum of the fading source is likely dominated by emission features related to ongoing CSM interaction (see Section 4.1), in which case a blackbody approximation may not be appropriate.
3.2 Late-time spectrum
As shown in Figure 3, the late-time spectrum, taken at days, shows only narrow emission lines characteristic of H II regions, namely H, [N II] ( 6548, 6583), and [S II] ( 6717, 6731). The observed width of the lines, km s-1, is consistent with the instrumental resolution, and we see no evidence of shock-broadened features associated with the SN. We constrain the integrated H flux from the SN to erg s-1 cm-2 (3), using the broadened (2000 km s-1) double-peaked profile from the latest available spectrum at days from Thöne et al. (2017) as a template. This corresponds a limit on the broad H luminosity of erg s-1 (Galactic extinction only) or erg s-1 (host extinction included). This limit is conservative if the line profile narrows as the SN evolves.
In the 2D spectral image shown in Figure 3, the narrow emission within our extraction aperture appears to be dominated by an extended H clump, whose brightest point is 2 below the expected position of SN 2015bh on the slit (280 pc projected separation). This may indicate that the emission arises primarily from a nearby, but likely not directly associated, H II region. We perform additional analyses of this emission to characterize the nearby environment of SN 2015bh in Appendix D.
4 Discussion
As described above, SN 2015bh has now faded far below the level of its well-characterized progenitor star in broadband optical filters. Here, we discuss the possibilities for the source of the fading emission and implications for the fate of the progenitor.
4.1 Ongoing Circumstellar Interaction
The previously published, late-phase spectra of SN 2015bh (–290 days) were dominated by strong H emission with an irregular, double-peaked profile and velocities 2000 km s-1, along with emission features of [Ca II], the Ca II IR triplet, narrow (500 km s-1) emission features of He I and Fe I, and the emergence of a pseudo-continuum blueward of 5450 Å attributable to a forest of Fe emission lines. Altogether, these features indicate the continued influence of interaction with asymmetric CSM (Elias-Rosa et al., 2016; Thöne et al., 2017). Strong H emission and signs of CSM interaction at late phases appear to be ubiquitous in objects similar to SN 2015bh, including SN 2009ip through at least 726–1196 days after peak (Fraser et al., 2015; Smith et al., 2016a), AT 2016jbu up to 419 days after peak (Brennan et al., 2022b), and SN 2011fh up to 1359 days after peak (Pessi et al., 2022). As noted too by Kilpatrick et al. (2018), the double-peaked asymmetric H profiles of AT 2016jbu and SN 2015bh at late times are particularly similar.
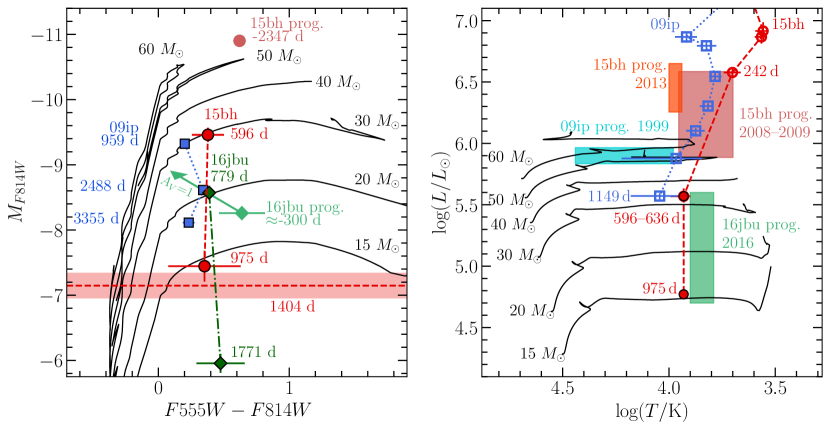
The light from SN 2015bh in 2017 must be dominated by the explosion and related interactions, as it continued to fade significantly by the time of the 2018 observations. As discussed in Section 3.1 and shown in Figure 2, the source continued to fade through 2018 in and at a similar rate to the earlier ground-based photometry (0.005 mag day-1). This is notably slower than the predicted rate for the decay of 56Co, which, as pointed out by Elias-Rosa et al. (2016), likely points to the continued contribution of CSM interaction. As shown in the CMD in Figure 5, the fading of SN 2015bh at a constant color mag is remarkably similar that of other objects in the SN 2009ip-like class, namely, SN 2009ip itself (Smith et al., 2016a, 2022) and AT 2016jbu (Brennan et al., 2022a, c). We note, too, that the late-time detections of all three sources are bluer than the available progenitor detections of SN 2015bh and AT 2016jbu at mag, though as noted by Kilpatrick et al. (2018), the progenitor of AT 2016jbu may have suffered circumstellar extinction at the level of mag. This color may reflect the numerous emission lines produced by ongoing CSM interaction in the spectra of these events, specifically the Fe pseudo-continuum blueward of 5450 Å that contributes to the flux, but also the Ca II IR triplet emission in the band.
Between 2018 and 2019, the light curve flattens out considerably. If the light curve is still primarily powered by CSM interaction, this may indicate a change in the density profile of the CSM. While we do not see any signs of interaction ( erg s-1 for broadened emission; Section 3.2) in our 2021 optical spectrum at days (710 days after the last image), these observations do not constrain the presence of interaction at earlier phases. We discussion alternative scenarios to explain the slowing decline rate below, including contributions from a scattered-light echo (Section 4.2) or the settling of the light curve onto a persistent, quiescent source, i.e., a possible binary companion or host stellar cluster (Section 4.3), or (less likely) the surviving remnant of the progenitor (Section 4.4).
4.2 Scattered-light Echo
In the light-echo scenario, additional light from the transient is scattered by circumstellar or more distant dust into the line of sight of the observer. The echo has a time delay because of the longer light path compared to direct, unscattered light from the transient. For SNe with CSM from recent pre-explosion mass loss, a scattered-light echo from circumstellar dust will lead to a flatting of the optical light curve and is also expected to accompany a thermal echo, as the heated dust will reradiate light absorbed from the transient into the IR (Chevalier, 1986). This argument has been used, for example, to explain the late-time optical emission of the CSM-interacting SN 2006gy (Smith et al., 2008; Miller et al., 2010; Fox et al., 2015). Scattered-light echoes may also arise from a foreground distribution of dust, as claimed, e.g., in the cases of the Type IIb SN 2011dh (Maund, 2019) and the Type Ia SN 1998bu (Cappellaro et al., 2001). The SED of a scattered-light echo will resemble the luminosity-weighted average of the time-varying SED of the transient, which will be dominated by the spectrum of the transient at peak. An echo may also appear bluer owing to the enhanced scattering efficiency of dust grains at shorter wavelengths.
At peak, the optical colors of SN 2015bh are relatively blue at mag (Elias-Rosa et al., 2016). In 2017 and 2018, the comparable color stays largely constant at 0.4 mag, though the uncertainty in 2018 is larger (0.3 mag). This argues against an echo as the dominant source of the emission in 2018, though it cannot be conclusively ruled out as the SED of the echo will depend on the grain properties of the dust and its geometry (see, e.g., Maund, 2019). We lack color information to derive further constraints on the echo scenario in 2019, but note that our 2021 spectrum does not display any features (e.g., broad H) reminiscent of the transient at peak. Lastly, the 2019 source is well fit by an ACS/WFC PSF, implying a projected size 0.5 WFC pixels or –. An echo will become more obvious as a spatially extended source with time, a scenario that could be tested with future HST imaging.
4.3 Binary companion or Stellar Cluster
In the absence of a light echo, the flattening of the light curve may suggest that SN 2015bh is fading below the level of a persistent source. If we assume a constant rate of decline (in magnitudes) of the CSM-interaction-powered source (see section 4.1), the late-time light curve would imply a constant underlying source at mag. This is consistent with the 2019 brightness at , suggesting that the photometry at this phase is dominated by the flux of the persistent source.
One possibility is that the flux of the persistent source arises primarily from the binary companion of the progenitor. This may be expected given the proposed binary origins of SN 2015bh and has been claimed previously for two stripped-envelope SN IIb (SN 1993J, Maund et al., 2004; Fox et al., 2014; SN 2011dh, Folatelli et al., 2014; Maund, 2019). The CMD position in 2018 ( days) is similar to that of a 15 star evolving across the Hertzsprung gap (Figure 5).
An evolving 15 star will spend 105 yr in the Hertzsprung gap and 104 yr the observed CMD position, compared to its main-sequence lifetime of 107 yr (Choi et al., 2016; see tracks in Figure 5). For most SNe then, a companion is more likely to still be on the main sequence as an O- or B-type star. Any such star 30 would have mag, too faint to contribute much flux to the persistent source inferred above. A more massive O-type companion at mag would be too blue with mag, inconsistent with the 2018 measurement at mag. Still, a secondary star may plausibly appear in the Hertzsprung gap for binary mass ratios close to one (see, e.g., SN 1993J, Maund et al., 2004; SN 2006jc, Sun et al., 2020; SN 2019yvr Sun et al., 2022). Alternatively, a main-sequence companion may appear cooler and more luminous if it is temporarily inflated by interaction with the SN ejection (e.g., Hirai et al., 2018).
It is also possible that the residual flux is from low-mass cluster or star-forming region. In Figure 4, we show simulated Starburst99 (Leitherer et al., 1999) star cluster SEDs222Starburst99 simulations can be generated at https://www.stsci.edu/science/starburst99/docs/default.html at ages of 5, 10, and 20 Myr, scaled to this level at . These correspond to main-sequence turnoff masses of 54, 21, and 12 and luminosities , , and mag. This suggests that the light from the persistent source may be dominated by a relatively small number of the brightest stars.333Proper treatments of low-mass clusters, where stochastic effects in sampling the IMF are important, can be performed with, e.g., SLUG (Stochastically Lighting Up Galaxies; da Silva et al., 2012). We have implicitly assumed that the potential cluster suffers the same host extinction as SN 2015bh itself ( mag); if the average extinction to the cluster were lower, its inferred luminosity would be lower as well. The persistent source is well fit with an ACS/WFC PSF (see Section 2.1), implying a projected size 0.5 WFC pixels or 3 pc at the assumed distance to NGC 2770.
Based on the latest photometry of SN 2009ip up to 3355 days postexplosion, Smith et al. (2022) suggest the presence of a cluster with mag, possibly similar in scale to Trumpler 14, a 1–2 Myr-old, cluster in the Carina Nebula (Vazquez et al., 1996). They infer an older age of 4–5 Myr, however, based on the lack of a bright, resolved H nebula that would be associated with a younger cluster. Our constraints on the host cluster of SN 2015bh () would then imply a smaller, less massive association. For example, the Trapezium cluster ( mag) within the 1800 , 2 Myr-old Orion Nebula hosts a single O-type star of mass (Hillenbrand & Hartmann, 1998); the host cluster of SN 2015bh may plausibly lie somewhere in between these two examples. The luminosity of the nearby (300 pc) H clump of – erg s-1 (Appendix D) is in the range of classical (e.g., Orion; 1037 erg s-1) up to giant star-forming regions (e.g., SMC N66; erg s-1; Crowther, 2013). In contrast, SN 2009ip is largely isolated from other signs of star-formation (Smith et al., 2016a, 2022). Narrowband H imaging would provide valuable insight to the spatial morphology of this region and any possible emission associated with SN 2015bh. Now that SN 2015bh appears to have faded below the level of a persistent source, multiband photometry from the UV to the IR can test for the presence of an evolved or inflated companion and probe the age and stellar content of the host population. This will provide important constraints on evolutionary pathways that could have produced the progenitor system.
4.4 Did the Progenitor Star Survive?
The late-time data presented here show that SN 2015bh is now 4 mag fainter than its eruptive progenitor in optical filters and rule out a scenario in which the source has simply returned to its pre-explosion state. An essential question is whether the star survived the explosion, but is now in a dramatically altered state (e.g., hot and optically faint), or if it is truly gone. The most important new clues are (1) the substantial fading of the source below the observed level of the progenitor in broadband optical filters (by nearly 4 mag at ), and (2) the source is observed to fade in the and bands at identical rates. Importantly, this strongly indicates that the optical fading is not the result of postshock dust formation, which is seen in some Type IIn supernova (e.g., Jencson et al., 2016) and would cause the source to appear redder with time. This is extremely similar to the late-time evolution of SN 2009ip recently presented by Smith et al. (2022), and we come to similar conclusions about the fate of the progenitor of SN 2015bh.
The substantial fading of SN 2015bh below its progenitor level is easily explained if the progenitor star has simply vanished. The pre-explosion observations of the progenitor, however, indicate a luminous, highly variable star in outburst (see Section 3.1.1 and discussions of the progenitor in, e.g., Elias-Rosa et al., 2016; Thöne et al., 2017), and it is important to consider that the quiescent star may be fainter. Boian & Groh (2018), for example, infer a progenitor mass 35 from their detailed modeling of the 2013 progenitor spectrum as an optically thick wind—if the observed luminosity of the star is at the Eddington limit in outburst—but they do not rule out the possibility of an lower-mass, intrinsically fainter progenitor with a dynamic super-Eddington wind (see, e.g., Shaviv, 2001; Owocki et al., 2004; van Marle et al., 2009). A well-known example of this is the LBV NGC 2363-V1, which underwent a multiyear, super-Eddington outburst at 3.5 mag brighter than its comparatively faint progenitor ( mag), though this outburst was significantly hotter (11,000 K) than the pre-explosion outbursts of SN 2015bh (Drissen et al. 2001; Petit et al. 2006, and see Smith et al. 2010 for a direct comparison to SN 2009ip). Carina also faded below its pre-eruption state in the visible following the “Great Eruption” (Smith & Frew, 2011). This may have been associated with dust formation (Smith et al., 2018), also a ubiquitous feature of merger-related transients (e.g., Martini et al., 1999; Tylenda & Kamiński, 2016; Smith et al., 2016b; Blagorodnova et al., 2017, 2020), but again, we do not see evidence for this in SN 2015bh.
Boian & Groh (2018) describe a possible scenario in which the surviving star settles back into a hot, quiescent LBV state or becomes a Wolf-Rayet star. While our analysis in Section 3.1.1 does not explicitly rule this out, we do not see clear evidence for a marked change in the SED to support this. This is reflected in the Hertzsprung–Russel diagram (HRD) evolution that we depict in Figure 5, in which SN 2015bh fades well below the luminosity of its massive progenitor. This interpretation is supported by the remarkable similarity with SN 2009ip, where the optical fading was not accompanied by a UV brightening that would indicate a shift of the SED to higher temperatures (Smith et al., 2022). SN 2015bh is also now much fainter than the detection of the believed quiescent progenitor of SN 2009ip in 1999 ( mag; see Figure 2). The simplest and, we argue, most likely explanation is that SN 2015bh was a terminal explosion and the progenitor is now gone.
5 Summary and Conclusions
We have presented newly analyzed, late-time HST imaging of SN 2015bh that extends the optical light curves to nearly four years after the explosion. The source fades at a rate of 0.005 mag day-1 between 2017 and 2018 (–975 days) at both and with little to no color evolution. This is strikingly similar to the late-time evolution of SN 2009ip and another member of its class, AT 2016jbu, and can most likely be attributed to the continued contribution of CSM interaction to the light curves. By 2019 ( days), the light curve slowed its decline rate and may have started to level out, consistent with a scenario where the transient has faded below the level of a persistent, unresolved source at mag. The most important result of this work is that the source is now much fainter than its massive, LBV-like progenitor star in broadband optical filters observed with HST in 2008–2009, notably by 3.8 mag at , pointing to a scenario where the progenitor did not survive the explosion.
We performed a detailed astrometric analysis showing that the remaining source in 2019 is fully consistent with the position of SN 2015bh and is highly likely to be associated. One possible scenario is that the observed flux is dominated by an unresolved, scattered-light echo, though the observed color evolution and lack of broad emission features similar to the transient at peak in our 2021 optical spectrum argue against this. The observed colors of the remaining source are inconsistent with a main-sequence OB companion star, but we do not rule out the presence of an evolving or inflated companion. Another possible scenario is that the source is settling down to the luminosity level of a relatively small (3 pc) and low-mass young cluster. The late-time spectrum of the site indicates the presence of nearby star-forming regions but shows no evidence of shock-broadened emission from the continued interactions of the SN with dense CSM by days. Additional multiband photometry (including narrowband H imaging) with HST or large ground-based facilities will provide context on the progenitor’s host population and thereby, valuable constraints on its evolutionary history. The data presented here disfavor a scenario in which the progenitor survived but is obscured by newly formed dust. A surviving star in transition to a hotter, quiescent state is not yet conclusively ruled out. Still, SN 2015bh joins SN 2009ip as an important example of CSM-interacting Type IIn SNe with increasing evidence for the terminal explosion of their LBV progenitors preceded by decades of eruptive instability. These objects constitute challenges to models of the evolution of massive stars and continue to provide important constraints in unraveling their tumultuous final years.
6 acknowledgements
We thank the anonymous referee for their comments and suggestions, which helped improve the paper.
Observations reported here were obtained at the MMT Observatory, a joint facility of the University of Arizona and the Smithsonian Institution.
Based on observations made with the NASA/ESA Hubble Space Telescope, obtained at the Space Telescope Science Institute, which is operated by the Association of Universities for Research in Astronomy, Inc., under NASA contract NAS5-26555. These observations are associated with programs #HST-SNAP-14668, #HST-SNAP-15166, and #HST-GO-15645. Support for program #HST-GO-15645 was provided by NASA through a grant from the Space Telescope Science Institute, which is operated by the Association of Universities for Research in Astronomy, Inc., under NASA contract NAS5-26555.
Time domain research by the University of Arizona team and D.J.S. is supported by NSF grants AST-1821987, 1813466, 1908972, & 2108032, and by the Heising-Simons Foundation under grant #2020-1864. J.S. acknowledges support from NASA grant HST-GO-15645.003-A and from the Packard Foundation. Research by S.V. is supported by NSF grants AST-1813176 and AST-2008108.
Supported by the international Gemini Observatory, a program of NSF’s NOIRLab, which is managed by the Association of Universities for Research in Astronomy (AURA) under a cooperative agreement with the National Science Foundation, on behalf of the Gemini partnership of Argentina, Brazil, Canada, Chile, the Republic of Korea, and the United States of America.
Appendix A Host Distance and Extinction
The NASA/IPAC Extragalactic Database (NED)444NED is operated by the Jet Propulsion Laboratory, California Institute of Technology, under contract with the National Aeronautics and Space Administration. lists several distance estimates to NGC 2770 based on the Tully–Fisher relation, the most recent of which is listed as mag ( Mpc; Sorce et al., 2014). Elias-Rosa et al. (2016) adopted a distance modulus of mag ( Mpc) based on the recession velocity of NGC 2770 and correcting for the Local Group infall into the Virgo Cluster from NED, while Thöne et al. (2017) assumed mag ( Mpc) and Ofek et al. (2016) assumed mag ( Mpc). Each of these is consistent with the Sorce et al. (2014) Tully–Fisher estimate. In this work, we adopt mag ( Mpc) as an average between the Tully–Fisher and recession-velocity-based estimates.
For the Galactic extinction to the position of SN 2015bh in NGC 2770, we adopt the value from the NASA/IPAC Infrared Science Archive (IRSA) of mag, based on the Schlafly & Finkbeiner (2011) recalibration of the Schlegel et al. (1998) dust maps. Thöne et al. (2017) estimated the extinction from the host galaxy from the depth of the Na I D absorption in a high-resolution spectrum of SN 2015bh taken on 2015 June 4 and using the relation of Poznanski et al. (2012) to be mag. Boian & Groh (2018) obtained an independent and similar estimate of the total (Galactic and host) extinction of mag by modeling the 2013 progenitor spectrum. In this work, we assume a total extinction to SN 2015bh of mag, consistent with that assumed by Thöne et al. (2017), and employ the reddening law of Fitzpatrick (1999) with throughout.
Appendix B HST Image Processing and Dolphot Photometry
We downloaded the calwf3 or calacs calibrated and charge-transfer-efficiency (CTE)-corrected flc frames for the available observations (Section 2.1) from the Mikulski Archive for Space Telescopes. We processed the images using the AstroDrizzle software package, including automated cosmic-ray rejection, subpixel alignments with TweakReg, and final combination into drizzled mosaics at a pixel scale of for each visit and filter.
We then used DOLPHOT (Dolphin, 2000, 2016) to obtain PSF-fitting photometry of SN 2015bh and the sources in its vicinity. We employ the parameter settings used for the Panchromatic Hubble Andromeda Treasury project (PHAT; Dalcanton et al., 2012; Williams et al., 2014). As inputs to DOLPHOT, we use the CTE-corrected flc frames (preprocessed with AstroDrizzle to flag cosmic-ray hits). We ran different instrumental setups separately but processed multiple epochs with the same instrument and filter setups together. We used the 2019 drizzled ACS/WFC image as the input reference image for alignment for all runs. DOLPHOT achieved good alignments at the level of 0.3 pixel rms for all of the , and images and 0.4 pixel rms for the images. DOLPHOT computes and applies aperture corrections to a radius of for the reported photometry. We then applied the appropriate corrections to infinite apertures from Bohlin (2016) for ACS and from Calamida et al. (2021) for WFC3.555See https://www.stsci.edu/hst/instrumentation/wfc3/data-analysis/photometric-calibration We find that the statistical uncertainties reported by DOLPHOT are typically much smaller than the spread in individual measurements from each frame that comprises an HST observing visit for a given source. Therefore, we compute the rms deviations of the individual measurements comprising a given observing visit for all objects (500 stars) within a 1000 pixel radius around SN 2015bh as a function of magnitude and adopt this as a more realistic estimate of the uncertainty. To check for consistency across the multiple epochs and instrument setups, we also examined the light curves of these stars in our catalogs. We find the 16th–84th percentile deviations between epochs are within and mag for our and photometry, respectively, indicating good consistency.
A clear point source (, indicating a “good” star) is detected in all of the 2017 WFC3/UVIS images at the location of SN 2015bh. This source has faded significantly in 2018 at and (see Figure 1), confirming it to be the SN. A matching radius of reference-image pixels was used to associate measurements from individual frames in the output source catalogs over the two epochs. A source is also detected by DOLPHOT in our 2019 ACS/WFC catalog at nearly the same location (within pixels) with and , indicating that the object is well fit and consistent with a point-like source (“good” stars have ).
Appendix C Astrometric Analysis
We performed precise alignments of the 2017 WFC3/UVIS and images, where SN 2015bh is unambiguously detected, to the deep 2019 ACS/WFC image to confirm that the faint source detected in 2019 is coincident with the SN position. We measured the centroid positions of a set of 42 stars in common between each of the 2017 frames and the 2019 frame and used the IRAF geomap task to determine an alignment solution. We allowed for third-order polynomial fits in both the and directions and their cross-terms to account for the field distortion between the sets of images. We then registered the 2017 images to the 2019 images using geotran, and visually examined the resulting images to verify the quality of the registration. We achieved excellent alignments with rms residuals of ACS/WFC pixels (8.5 mas) in and pixels (9.5 mas) in for the image and ACS/WFC pixels (10 mas) in and pixels (13 mas) in for the image. In Figure 1, we show the 1 confidence ellipses (assuming 2D Gaussian-distributed alignment residuals) of SN 2015bh measured in the aligned and 2017 images overlaid on the source detected in 2019. The position of the 2019 source from DOLPHOT (indicated by a white cross in the figure) is fully consistent with the SN position from both 2017 frames within 1.
Based on this analysis, we estimate the probability that the source detected in 2019 is a chance coincidence with an unrelated object. The density of star-like sources within of the position of SN 2015bh detected by DOLPHOT with is 20.4 arcsec-2. The separation between SN 2015bh as measured in the aligned 2017 and the 2019 source detected by DOLPHOT is 0.12 pixels (6 mas), from which we estimate the likelihood of a chance coincidence with an unrelated source to be only 0.2%. For sources as bright as the putative 2019 counterpart, the density drops to 2.5 arcsec-2. The corresponding chance-coincidence probability is then 0.03%. Moreover, as the source fades slightly between 2018 and 2019, the likelihood of a chance coincidence with an unrelated, fading variable is even smaller. We therefore conclude that the source detected in 2019 is most likely to be associated with SN 2015bh.
Appendix D Spectral Analysis of the Nearby H II Region
We fit a Gaussian profile to the H emission in our spectrum at the location of SN 2015bh to estimate the integrated line flux at erg s-1 cm2 (Galactic extinction correction only). We performed 1000 individual fits, allowing the flux in each spectral bin to vary with Gaussian-distributed noise that encapsulated the 1 fluctuations in line-free regions of the spectrum and the photon-counting source noise in the line itself to estimate the measurement uncertainty. This corresponds to a H luminosity of – erg s-1 depending on the assumed extinction, from no additional host extinction up to the value assumed for SN 2015bh. For an aperture of the same width but centered on the nearby H clump, the corresponding luminosities are – erg s-1.
The [S II]/H line ratio can also be used to diagnose the presence of emission from an SN remnant. A threshold value [S II]/H is commonly adopted to indicate the presence of shock heating as the SN remnant interacts with the surrounding medium. Nebular emission from H II regions typically have [S II]/H–0.2 (e.g., Mathewson & Clarke, 1973; Levenson et al., 1995; Long, 2017), as the photoionization from the UV emission of hot, young stars keeps a high fraction of atomic species in higher-ionization states. We fit Gaussian line profiles to the components of the [S II] doublet (as described above for H) to measure this ratio in our spectrum at the location of SN 2015bh. We find [S II]/H for Galactic extinction only or [S II]/H including the host extinction to SN 2015bh. These values are near the assumed threshold, but they are consistent with other H II regions on the slit. Thus, we do not find compelling evidence for emission from an SN remnant at the location of SN 2015bh.
References
- Blagorodnova et al. (2017) Blagorodnova, N., Kotak, R., Polshaw, J., et al. 2017, ApJ, 834, 107, doi: 10.3847/1538-4357/834/2/107
- Blagorodnova et al. (2020) Blagorodnova, N., Karambelkar, V., Adams, S. M., et al. 2020, MNRAS, 496, 5503, doi: 10.1093/mnras/staa1872
- Bohlin (2016) Bohlin, R. C. 2016, AJ, 152, 60, doi: 10.3847/0004-6256/152/3/60
- Boian & Groh (2018) Boian, I., & Groh, J. H. 2018, A&A, 617, A115, doi: 10.1051/0004-6361/201731794
- Brennan et al. (2022a) Brennan, S. J., Elias-Rosa, N., Fraser, M., Van Dyk, S. D., & Lyman, J. D. 2022a, arXiv e-prints, arXiv:2206.06365. https://arxiv.org/abs/2206.06365
- Brennan et al. (2022b) Brennan, S. J., Fraser, M., Johansson, J., et al. 2022b, MNRAS, 513, 5642, doi: 10.1093/mnras/stac1243
- Brennan et al. (2022c) —. 2022c, MNRAS, 513, 5666, doi: 10.1093/mnras/stac1228
- Calamida et al. (2021) Calamida, A., Mack, J., Medina, J., et al. 2021, New time-dependent WFC3 UVIS inverse sensitivities, Space Telescope WFC Instrument Science Report
- Cappellaro et al. (2001) Cappellaro, E., Patat, F., Mazzali, P. A., et al. 2001, ApJ, 549, L215, doi: 10.1086/319178
- Castelli & Kurucz (2003) Castelli, F., & Kurucz, R. L. 2003, in Modelling of Stellar Atmospheres, ed. N. Piskunov, W. W. Weiss, & D. F. Gray, Vol. 210, A20. https://arxiv.org/abs/astro-ph/0405087
- Chevalier (1986) Chevalier, R. A. 1986, ApJ, 308, 225, doi: 10.1086/164492
- Choi et al. (2016) Choi, J., Dotter, A., Conroy, C., et al. 2016, ApJ, 823, 102, doi: 10.3847/0004-637X/823/2/102
- Crowther (2013) Crowther, P. A. 2013, MNRAS, 428, 1927, doi: 10.1093/mnras/sts145
- da Silva et al. (2012) da Silva, R. L., Fumagalli, M., & Krumholz, M. 2012, ApJ, 745, 145, doi: 10.1088/0004-637X/745/2/145
- Dalcanton et al. (2012) Dalcanton, J. J., Williams, B. F., Lang, D., et al. 2012, ApJS, 200, 18, doi: 10.1088/0067-0049/200/2/18
- Dolphin (2016) Dolphin, A. 2016, DOLPHOT: Stellar photometry, Astrophysics Source Code Library. http://ascl.net/1608.013
- Dolphin (2000) Dolphin, A. E. 2000, PASP, 112, 1383, doi: 10.1086/316630
- Drissen et al. (2001) Drissen, L., Crowther, P. A., Smith, L. J., et al. 2001, ApJ, 546, 484, doi: 10.1086/318264
- Elias-Rosa et al. (2016) Elias-Rosa, N., Pastorello, A., Benetti, S., et al. 2016, MNRAS, 463, 3894, doi: 10.1093/mnras/stw2253
- Filippenko (1997) Filippenko, A. V. 1997, ARA&A, 35, 309, doi: 10.1146/annurev.astro.35.1.309
- Fitzpatrick (1999) Fitzpatrick, E. L. 1999, PASP, 111, 63, doi: 10.1086/316293
- Folatelli et al. (2014) Folatelli, G., Bersten, M. C., Benvenuto, O. G., et al. 2014, ApJ, 793, L22, doi: 10.1088/2041-8205/793/2/L22
- Foley et al. (2011) Foley, R. J., Berger, E., Fox, O., et al. 2011, ApJ, 732, 32, doi: 10.1088/0004-637X/732/1/32
- Foley et al. (2007) Foley, R. J., Smith, N., Ganeshalingam, M., et al. 2007, ApJ, 657, L105, doi: 10.1086/513145
- Fox et al. (2014) Fox, O. D., Azalee Bostroem, K., Van Dyk, S. D., et al. 2014, ApJ, 790, 17, doi: 10.1088/0004-637X/790/1/17
- Fox et al. (2015) Fox, O. D., Smith, N., Ammons, S. M., et al. 2015, MNRAS, 454, 4366, doi: 10.1093/mnras/stv2270
- Fraser et al. (2013a) Fraser, M., Magee, M., Kotak, R., et al. 2013a, ApJ, 779, L8, doi: 10.1088/2041-8205/779/1/L8
- Fraser et al. (2013b) Fraser, M., Inserra, C., Jerkstrand, A., et al. 2013b, MNRAS, 433, 1312, doi: 10.1093/mnras/stt813
- Fraser et al. (2015) Fraser, M., Kotak, R., Pastorello, A., et al. 2015, MNRAS, 453, 3886, doi: 10.1093/mnras/stv1919
- Fuller (2017) Fuller, J. 2017, MNRAS, 470, 1642, doi: 10.1093/mnras/stx1314
- Gal-Yam & Leonard (2009) Gal-Yam, A., & Leonard, D. C. 2009, Nature, 458, 865, doi: 10.1038/nature07934
- Goranskij et al. (2016) Goranskij, V. P., Barsukova, E. A., Valeev, A. F., et al. 2016, Astrophysical Bulletin, 71, 422, doi: 10.1134/S1990341316040052
- Graham et al. (2014) Graham, M. L., Sand, D. J., Valenti, S., et al. 2014, ApJ, 787, 163, doi: 10.1088/0004-637X/787/2/163
- Hack et al. (2012) Hack, W. J., Dencheva, N., Fruchter, A. S., et al. 2012, in American Astronomical Society Meeting Abstracts, Vol. 220, American Astronomical Society Meeting Abstracts #220, 135.15
- Hillenbrand & Hartmann (1998) Hillenbrand, L. A., & Hartmann, L. W. 1998, ApJ, 492, 540, doi: 10.1086/305076
- Hirai et al. (2021) Hirai, R., Podsiadlowski, P., Owocki, S. P., Schneider, F. R. N., & Smith, N. 2021, MNRAS, 503, 4276, doi: 10.1093/mnras/stab571
- Hirai et al. (2018) Hirai, R., Podsiadlowski, P., & Yamada, S. 2018, ApJ, 864, 119, doi: 10.3847/1538-4357/aad6a0
- Ho et al. (2019) Ho, A. Y. Q., Goldstein, D. A., Schulze, S., et al. 2019, ApJ, 887, 169, doi: 10.3847/1538-4357/ab55ec
- Hosseinzadeh & Gomez (2022) Hosseinzadeh, G., & Gomez, S. 2022, Light Curve Fitting, v0.5.1, Zenodo, doi: 10.5281/zenodo.6363688
- Jencson et al. (2016) Jencson, J. E., Prieto, J. L., Kochanek, C. S., et al. 2016, MNRAS, 456, 2622, doi: 10.1093/mnras/stv2795
- Jencson et al. (2022) Jencson, J. E., Sand, D. J., Andrews, J. E., et al. 2022, ApJ, 930, 81, doi: 10.3847/1538-4357/ac626c
- Kashi et al. (2013) Kashi, A., Soker, N., & Moskovitz, N. 2013, MNRAS, 436, 2484, doi: 10.1093/mnras/stt1742
- Kilpatrick et al. (2018) Kilpatrick, C. D., Foley, R. J., Drout, M. R., et al. 2018, MNRAS, 473, 4805, doi: 10.1093/mnras/stx2675
- Kochanek et al. (2011) Kochanek, C. S., Szczygiel, D. M., & Stanek, K. Z. 2011, ApJ, 737, 76, doi: 10.1088/0004-637X/737/2/76
- Leitherer et al. (1999) Leitherer, C., Schaerer, D., Goldader, J. D., et al. 1999, ApJS, 123, 3, doi: 10.1086/313233
- Levenson et al. (1995) Levenson, N. A., Kirshner, R. P., Blair, W. P., & Winkler, P. F. 1995, AJ, 110, 739, doi: 10.1086/117558
- Levesque et al. (2014) Levesque, E. M., Stringfellow, G. S., Ginsburg, A. G., Bally, J., & Keeney, B. A. 2014, AJ, 147, 23, doi: 10.1088/0004-6256/147/1/23
- Long (2017) Long, K. S. 2017, in Handbook of Supernovae, ed. A. W. Alsabti & P. Murdin, 2005, doi: 10.1007/978-3-319-21846-5_90
- Margutti et al. (2014) Margutti, R., Milisavljevic, D., Soderberg, A. M., et al. 2014, ApJ, 780, 21, doi: 10.1088/0004-637X/780/1/21
- Márquez et al. (2002) Márquez, I., Masegosa, J., Moles, M., et al. 2002, A&A, 393, 389, doi: 10.1051/0004-6361:20021036
- Martin et al. (2015) Martin, J. C., Hambsch, F. J., Margutti, R., et al. 2015, AJ, 149, 9, doi: 10.1088/0004-6256/149/1/9
- Martini et al. (1999) Martini, P., Wagner, R. M., Tomaney, A., et al. 1999, AJ, 118, 1034, doi: 10.1086/300951
- Mathewson & Clarke (1973) Mathewson, D. S., & Clarke, J. N. 1973, ApJ, 180, 725, doi: 10.1086/152002
- Mauerhan et al. (2014) Mauerhan, J., Williams, G. G., Smith, N., et al. 2014, MNRAS, 442, 1166, doi: 10.1093/mnras/stu730
- Mauerhan et al. (2013) Mauerhan, J. C., Smith, N., Filippenko, A. V., et al. 2013, MNRAS, 430, 1801, doi: 10.1093/mnras/stt009
- Maund (2019) Maund, J. R. 2019, ApJ, 883, 86, doi: 10.3847/1538-4357/ab2386
- Maund et al. (2004) Maund, J. R., Smartt, S. J., Kudritzki, R. P., Podsiadlowski, P., & Gilmore, G. F. 2004, Nature, 427, 129
- Miller et al. (2010) Miller, A. A., Smith, N., Li, W., et al. 2010, AJ, 139, 2218, doi: 10.1088/0004-6256/139/6/2218
- Moriya (2015) Moriya, T. J. 2015, ApJ, 803, L26, doi: 10.1088/2041-8205/803/2/L26
- Nyholm et al. (2017) Nyholm, A., Sollerman, J., Taddia, F., et al. 2017, A&A, 605, A6, doi: 10.1051/0004-6361/201629906
- Ofek et al. (2013) Ofek, E. O., Sullivan, M., Cenko, S. B., et al. 2013, Nature, 494, 65, doi: 10.1038/nature11877
- Ofek et al. (2014) Ofek, E. O., Sullivan, M., Shaviv, N. J., et al. 2014, ApJ, 789, 104, doi: 10.1088/0004-637X/789/2/104
- Ofek et al. (2016) Ofek, E. O., Cenko, S. B., Shaviv, N. J., et al. 2016, ApJ, 824, 6, doi: 10.3847/0004-637X/824/1/6
- Owocki et al. (2004) Owocki, S. P., Gayley, K. G., & Shaviv, N. J. 2004, ApJ, 616, 525, doi: 10.1086/424910
- Pastorello et al. (2007) Pastorello, A., Smartt, S. J., Mattila, S., et al. 2007, Nature, 447, 829, doi: 10.1038/nature05825
- Pastorello et al. (2013) Pastorello, A., Cappellaro, E., Inserra, C., et al. 2013, ApJ, 767, 1, doi: 10.1088/0004-637X/767/1/1
- Pastorello et al. (2018) Pastorello, A., Kochanek, C. S., Fraser, M., et al. 2018, MNRAS, 474, 197, doi: 10.1093/mnras/stx2668
- Patton et al. (2019) Patton, R. A., Kochanek, C. S., & Adams, S. M. 2019, MNRAS, 489, 1986, doi: 10.1093/mnras/stz2282
- Pessi et al. (2022) Pessi, T., Prieto, J. L., Monard, B., et al. 2022, ApJ, 928, 138, doi: 10.3847/1538-4357/ac562d
- Petit et al. (2006) Petit, V., Drissen, L., & Crowther, P. A. 2006, AJ, 132, 1756, doi: 10.1086/506512
- Poznanski et al. (2012) Poznanski, D., Prochaska, J. X., & Bloom, J. S. 2012, MNRAS, 426, 1465, doi: 10.1111/j.1365-2966.2012.21796.x
- Prieto et al. (2013) Prieto, J. L., Brimacombe, J., Drake, A. J., & Howerton, S. 2013, ApJ, 763, L27, doi: 10.1088/2041-8205/763/2/L27
- Quataert & Shiode (2012) Quataert, E., & Shiode, J. 2012, MNRAS, 423, L92, doi: 10.1111/j.1745-3933.2012.01264.x
- Reguitti et al. (2019) Reguitti, A., Pastorello, A., Pignata, G., et al. 2019, MNRAS, 482, 2750, doi: 10.1093/mnras/sty2870
- Reilly et al. (2017) Reilly, E., Maund, J. R., Baade, D., et al. 2017, MNRAS, 470, 1491, doi: 10.1093/mnras/stx1228
- Schlafly & Finkbeiner (2011) Schlafly, E. F., & Finkbeiner, D. P. 2011, ApJ, 737, 103, doi: 10.1088/0004-637X/737/2/103
- Schlegel et al. (1998) Schlegel, D. J., Finkbeiner, D. P., & Davis, M. 1998, ApJ, 500, 525, doi: 10.1086/305772
- Schlegel (1990) Schlegel, E. M. 1990, MNRAS, 244, 269
- Shaviv (2001) Shaviv, N. J. 2001, MNRAS, 326, 126, doi: 10.1046/j.1365-8711.2001.04574.x
- Smith (2014) Smith, N. 2014, ARA&A, 52, 487, doi: 10.1146/annurev-astro-081913-040025
- Smith (2017) —. 2017, in Handbook of Supernovae, ed. A. W. Alsabti & P. Murdin, 403, doi: 10.1007/978-3-319-21846-5_38
- Smith et al. (2022) Smith, N., Andrews, J. E., Filippenko, A. V., et al. 2022, MNRAS, 515, 71, doi: 10.1093/mnras/stac1669
- Smith et al. (2016a) Smith, N., Andrews, J. E., & Mauerhan, J. C. 2016a, MNRAS, 463, 2904, doi: 10.1093/mnras/stw2190
- Smith & Arnett (2014) Smith, N., & Arnett, W. D. 2014, ApJ, 785, 82, doi: 10.1088/0004-637X/785/2/82
- Smith & Frew (2011) Smith, N., & Frew, D. J. 2011, MNRAS, 415, 2009, doi: 10.1111/j.1365-2966.2011.18993.x
- Smith et al. (2011) Smith, N., Li, W., Silverman, J. M., Ganeshalingam, M., & Filippenko, A. V. 2011, MNRAS, 415, 773, doi: 10.1111/j.1365-2966.2011.18763.x
- Smith et al. (2013) Smith, N., Mauerhan, J. C., Kasliwal, M. M., & Burgasser, A. J. 2013, MNRAS, 434, 2721, doi: 10.1093/mnras/stt944
- Smith et al. (2014) Smith, N., Mauerhan, J. C., & Prieto, J. L. 2014, MNRAS, 438, 1191, doi: 10.1093/mnras/stt2269
- Smith et al. (2008) Smith, N., Foley, R. J., Bloom, J. S., et al. 2008, ApJ, 686, 485, doi: 10.1086/590141
- Smith et al. (2010) Smith, N., Miller, A., Li, W., et al. 2010, AJ, 139, 1451, doi: 10.1088/0004-6256/139/4/1451
- Smith et al. (2016b) Smith, N., Andrews, J. E., Van Dyk, S. D., et al. 2016b, MNRAS, 458, 950, doi: 10.1093/mnras/stw219
- Smith et al. (2017) Smith, N., Kilpatrick, C. D., Mauerhan, J. C., et al. 2017, MNRAS, 466, 3021, doi: 10.1093/mnras/stw3204
- Smith et al. (2018) Smith, N., Andrews, J. E., Rest, A., et al. 2018, MNRAS, 480, 1466, doi: 10.1093/mnras/sty1500
- Soker & Kashi (2013) Soker, N., & Kashi, A. 2013, ApJ, 764, L6, doi: 10.1088/2041-8205/764/1/L6
- Soker & Kashi (2016) —. 2016, MNRAS, 462, 217, doi: 10.1093/mnras/stw1686
- Sorce et al. (2014) Sorce, J. G., Tully, R. B., Courtois, H. M., et al. 2014, MNRAS, 444, 527, doi: 10.1093/mnras/stu1450
- Strotjohann et al. (2021) Strotjohann, N. L., Ofek, E. O., Gal-Yam, A., et al. 2021, ApJ, 907, 99, doi: 10.3847/1538-4357/abd032
- STScI Development Team (2013) STScI Development Team. 2013, pysynphot: Synthetic photometry software package. http://ascl.net/1303.023
- Sun et al. (2022) Sun, N.-C., Maund, J. R., Crowther, P. A., et al. 2022, MNRAS, 510, 3701, doi: 10.1093/mnras/stab3768
- Sun et al. (2020) Sun, N.-C., Maund, J. R., Hirai, R., Crowther, P. A., & Podsiadlowski, P. 2020, MNRAS, 491, 6000, doi: 10.1093/mnras/stz3431
- Tartaglia et al. (2016) Tartaglia, L., Pastorello, A., Sullivan, M., et al. 2016, MNRAS, 459, 1039, doi: 10.1093/mnras/stw675
- Thöne et al. (2017) Thöne, C. C., de Ugarte Postigo, A., Leloudas, G., et al. 2017, A&A, 599, A129, doi: 10.1051/0004-6361/201629968
- Tody (1986) Tody, D. 1986, in Proc. SPIE, Vol. 627, Instrumentation in astronomy VI, ed. D. L. Crawford, 733, doi: 10.1117/12.968154
- Tody (1993) Tody, D. 1993, in Astronomical Society of the Pacific Conference Series, Vol. 52, Astronomical Data Analysis Software and Systems II, ed. R. J. Hanisch, R. J. V. Brissenden, & J. Barnes, 173
- Tylenda & Kamiński (2016) Tylenda, R., & Kamiński, T. 2016, A&A, 592, A134, doi: 10.1051/0004-6361/201527700
- Van Dyk & Matheson (2012) Van Dyk, S. D., & Matheson, T. 2012, ApJ, 746, 179, doi: 10.1088/0004-637X/746/2/179
- Van Dyk et al. (2000) Van Dyk, S. D., Peng, C. Y., King, J. Y., et al. 2000, PASP, 112, 1532, doi: 10.1086/317727
- van Marle et al. (2009) van Marle, A. J., Owocki, S. P., & Shaviv, N. J. 2009, MNRAS, 394, 595, doi: 10.1111/j.1365-2966.2008.14366.x
- Vazquez et al. (1996) Vazquez, R. A., Baume, G., Feinstein, A., & Prado, P. 1996, A&AS, 116, 75
- Williams et al. (2014) Williams, B. F., Lang, D., Dalcanton, J. J., et al. 2014, ApJS, 215, 9, doi: 10.1088/0067-0049/215/1/9
- Woosley (2017) Woosley, S. E. 2017, ApJ, 836, 244, doi: 10.3847/1538-4357/836/2/244
- Woosley & Smith (2022) Woosley, S. E., & Smith, N. 2022, arXiv e-prints, arXiv:2205.06386. https://arxiv.org/abs/2205.06386
- Yoon & Cantiello (2010) Yoon, S.-C., & Cantiello, M. 2010, ApJ, 717, L62, doi: 10.1088/2041-8205/717/1/L62