Dynamical Unification of Tidal Disruption Events
Abstract
About a hundred tidal disruption events (TDEs) have been observed and they exhibit a wide range of emission properties both at peak and over their lifetimes. Some TDEs peak predominantly at X-ray energies while others radiate chiefly at UV and optical wavelengths. While the peak luminosities across TDEs show distinct properties, the evolutionary behavior can also vary between TDEs with similar peak emission properties. At late time, some optical TDEs rebrighten in X-rays, while others maintain strong UV/optical emission components. In this Letter, we conduct three-dimensional general relativistic radiation magnetohydrodynamics simulations of TDE accretion disks at varying accretion rates ranging from a few to a few tens of the Eddington accretion rate. We make use of Monte Carlo radiative transfer simulations to calculate the reprocessed spectra at various inclinations and at different evolutionary stages. We confirm the unified model proposed by Dai et al. (2018), which predicts that the observed emission largely depends on the viewing angle of the observer with respect to the disk orientation (X-ray strong when viewed face-on and UV/optically strong when viewed disk-on). What is more, we find that disks with higher accretion rates have elevated wind and disk densities, which increases the reprocessing of the high-energy radiation and thus generally augments the optical-to-X-ray flux ratio along a particular viewing angle. This implies that at later times, as the accretion level declines, we expect the funnel to effectively open up and allow more X-rays to leak out along intermediate viewing angles. Such dynamical model for TDEs can provide a natural explanation for the diversity in the emission properties observed in TDEs at peak and along their temporal evolution.
1 Introduction
The tidal disruption of stars by massive black holes (MBHs) offers a unique probe of MBH demographics (Mockler et al., 2019; Gezari, 2021), host galaxy properties (French et al., 2020), stellar dynamics (Stone et al., 2020; Pfister et al., 2020), as well as black hole accretion and jet physics (Dai et al., 2021). When a star with mass and radius approaches a MBH with mass , the star is disrupted within the tidal radius , where the MBH’s tidal force exceeds the stellar self-gravity. About half stellar debris orbits back to the vicinity of the MBH following a characteristic pattern which first quickly increases to a peak and then declines with time following a mass fallback rate (Rees, 1988; Evans & Kochanek, 1989; Guillochon & Ramirez-Ruiz, 2013). When , can exceed the Eddington accretion rate by two orders of magnitude at peak and stays super-Eddington for years after peak. Here we define the Eddington accretion rate of a black hole as , where is the Eddington luminosity for an opacity , and is the nominal accretion efficiency for the Novikov-Thorne thin disk solution (Novikov & Thorne, 1973).
With the recent launches of all-sky transient surveys including ZTF and eROSITA, the number of detected TDE candidates has reached around one hundred (e.g., Gezari, 2021; Sazonov et al., 2021; Hammerstein et al., 2022). TDEs have been categorized into two classes based on their main emission type at peak: X-ray TDEs (Auchettl et al., 2017; Saxton et al., 2021) and optical TDEs (van Velzen et al., 2020). Most X-ray-selected TDEs emit soft X-rays with effective temperatures at K, while only three of them emit beamed, hard X-rays which are associated with relativistic jets (e.g., Bloom et al., 2011; Burrows et al., 2011; Cenko et al., 2012; De Colle et al., 2012). The optical TDEs have lower effective temperatures at fewK, and are further characterized by their spectroscopic features (producing strong and broad H, or He, or Bowen fluorescence emission lines) (Leloudas et al., 2019; Charalampopoulos et al., 2022). Interestingly, as the luminosity of a TDE typically declines by around one order of magnitude over tens to hundreds of days after peak, its effective temperature usually undergoes a peculiar non-evolution. Recently, a large number of TDEs have been followed up for longer than a year and they show different late-time behaviors. A few initially optically-strong TDEs rebrighten in X-rays (e.g., Gezari et al., 2017; Holoien et al., 2018; Wevers et al., 2019; Hinkle et al., 2021; Liu et al., 2022), while many others maintain strong UV/optical emissions over years (van Velzen et al., 2019).
Many theoretical models have been proposed to explain these TDE emission properties (Roth et al., 2020). While the X-ray emissions have been predicted by classical accretion disk models (Ulmer, 1999), UV/optical emissions are argued to be produced from either the reprocessing of X-ray photons in an extended envelope or outflows (Loeb & Ulmer, 1997; Strubbe & Quataert, 2009; Lodato & Rossi, 2011; Coughlin & Begelman, 2014; Guillochon et al., 2014; Metzger & Stone, 2016; Roth et al., 2016) or the shocks powered by debris stream self-intersection (Piran et al., 2015; Bonnerot et al., 2021). The late-time rebrightening of X-rays in TDEs can be accounted by either a change in the disk morphology as the accretion rate declines from super-Eddington to sub-Eddington, or the delayed onset of accretion (van Velzen et al., 2019; Hayasaki & Jonker, 2021). The latter model, however, is disfavored by recent simulations which show that a large fraction of the debris already settles into a disk with moderate eccentricity within dynamical times for at least a subset of TDE parameters (Bonnerot et al., 2021; Andalman et al., 2022).
In search for a unified model that can explain both the optical and X-ray TDEs, Dai et al. (2018) have carried out the first three-dimensional (3D) general relativistic radiation magnetohydrodynamics (GRRMHD) simulation tailored for TDE super-Eddignton accretion flow. The simulated disk, around a black hole with and spin parameter , has an accretion rate of , representing a typical accretion level in TDEs. The spectra of the disk have been obtained by post-processing the simulated disk with a novel radiative transfer code. It is found that the observed emission type largely depends on the viewing angle of the observer with respect to the disk orientation. When viewed face-on, X-ray emissions can escape from the optically-thin funnel surrounded by winds. When viewed edge-on, X-ray emissions are heavily reprocessed in the geometrically and optically thick wind and disk, so only UV/optical emissions can be observed.
While this study gives a good first-order description of TDE disks and spectra, recent simulations also show that the properties of a super-Eddington disk depends on the accretion rate, the black hole mass and spin, as well as the magnetic flux threading the disk (Jiang et al., 2014, 2019; McKinney et al., 2015; Sa̧dowski & Narayan, 2016). Although the black hole spin and disk magnetic flux might only mildly affect the main structure of the disk, they determine whether a relativistic jet can be launched (Blandford & Znajek, 1977; Curd & Narayan, 2019). At first glance, the black hole mass is not expected to affect the disk spectra significantly, since most TDE host MBHs have masses in a narrow range . However, the peak fallback rate of the TDE debris sensitively depends on the black hole mass with the relation . Therefore, TDEs from smaller MBHs should in general have much higher accretion rates at peak than those from larger MBHs (Ramirez-Ruiz & Rosswog, 2009). Also, further variance of the accretion rates in different TDEs as can be introduced by the difference in the masses and ages of the disrupted stars (Law-Smith et al., 2020).
In this Letter, we investigate how the TDE disk structure and the accompanied emission are influenced by the accretion rate at super-Eddington rates. We conduct three 3D GRRMHD simulations of super-Eddington disks with similar structures but varying accretion rates, and post-process the simulated disks to obtain their spectra at different inclination angles. These simulations are useful for understanding the diversity of the emissions observed from different TDEs, as well as the evolution of single TDEs as their fallback and accretion rate decline after peak. In Section 2 we introduce the setup of the GRRMHD and radiative transfer simulations. In Section 3 we give the main results and compare with TDE key observables. In Section 4 we draw a summary and discuss the implications and future work.
2 Methodology
2.1 Disk simulation setup
We carry out three dimensional simulations of super-Eddington disks using a fully 3D GRRMHD code HARMRAD with M1 closure (McKinney et al., 2014). In all simulations the MBH has and . The radial grid has 128 cells spanning from to ( is the gravitational radius of the MBH), with cell size increasing exponentially until and then increasing hyper-exponentially. The -grid has 64 cells spanning from 0 to with finer resolution in the jet and disk regions. The -grid has 32 grids spanning uniformly from 0 to with periodic boundary conditions. The gas is assumed to have solar chemical abundances (mass fractions of H, He, and “metals”, respectively, ). Frequency-mean absorption and emission opacities are used as in McKinney et al. (2015), except that the Chianti opacity is removed as it is unimportant for the disk temperature of our TDE models. Thermal Comptonization is also included.
We tailor the disk initial conditions to be consistent with realistic TDE scenarios following the setup described in Dai et al. (2018). The accretion disk is initialized with Keplerian velocity profile with a rest-mass density which is Gaussian in angle with a height-to-radius ratio of , so that the initial density profile is given by
| (1) |
where is the scale height, is the initial reference density. The disks are checked to have total masses and specific angular momentum consistent to the first order with the conditions in TDEs. Adjusting leads to different accretion rates after the disk reaches the quasi-equilibrium state. As can reach in a TDE around a black hole, and a large fraction of the debris mass is expected to escape in outflows, we set the aimed accretion rates to be a few to a few tens of (Table 1).
A large-scale poloidal magnetic field is initially seeded. As adopted in McKinney et al. (2015), for smaller than a breaking radius , the component of the vector potential is given by . For , the field transitions to a split monopolar field, which is given by . The field is normalised so that the initial ratio of gas+radiation pressure to magnetic pressure has a minimum value of 10.
2.2 Radiative transfer setup
We use the Monte Carlo radiative transfer code SEDONA (Kasen et al., 2006) to post-process the simulated disks and calculate the escaping radiation. More specifically, we calculate the bound electron level populations under non-local thermal equilibrium (LTE) as in Roth et al. (2016) and the Comptonization of electrons as in Roth & Kasen (2018). We track the free-free interactions, as well as the bound-bound and bound-free interactions with their opacities obtained from. the atomic database CMFGEN. The gas is assumed to consist of only H, He, and O with solar abundances. We focus on calculating the SED, and leave the line modeling to a future study which requires higher-solution simulations.
For each accretion rate, we calculate the spectra for four inclination bins of 10, 30, 50 and . In each bin, we take an average over for the already time-and-averaged profile of the simulated disk. Since the simulated jet density is likely numerically boosted, for the bins at 10 and 30∘, we also reduce the jet density by 100 times before taking the average. We note that the first-order behavior of the spectra does not depend on this arbitrary choice of density re-scaling inside the jet. We set the source to be a blackbody spectrum with a single temperature of K, which is consistent with the inner disk temperature. The source photons are injected from an inner boundary set at the boundary between the inflow and outflow, which is typically at a few except for the bin at which is partly in the disk inflow region. For the latter, we place the inner boundary at instead, and set the gas velocity to be always zero. The photons are then propagated in 3D, by assuming that the gas density, temperature, and radial velocity profiles are spherically symmetric. The photons propagate outwards until they leave the computational domain set at or have become a part of the kinetic/thermal pool.
Based on the Monte Carlo calculations, we iterate the gas temperatures, gas ionization state, bound electron states, and radiative transfer solution under the assumption of radiative equilibrium until a steady solution has been reached (after approximately 20 iterations). Since GRRMHD simulations show that the luminosity of super-Eddington disks are not always capped by , we also tweak the source photon luminosity and obtain the spectra under two limits – the escaped bolometric luminosity is either or .
3 Results
3.1 Properties of the accretion flow
In all three GRRMHD simulations, it takes an initial time period of for the accretion flow to get established. As the disk evolves, magnetic fluxes accumulate near the MBH and their strength further grow via the magnetorotational instability (MRI) (Balbus & Hawley, 1998). Here we focus on the final stage of the simulations when the accretion flow has reached steady state and the wind has established equilibrium at most inclination angles. The black hole parameters and some basic quantities of the accretion disks, averaged over the period of , are listed in Table 1. The disk profiles used for post-processing are also first averaged and then time-averaged over the same period. More numerical details of the simulated disks are given in Appendix A.
| Model | |||||
|---|---|---|---|---|---|
| M6a08-1 | 0.8 | 7 | 1.4 | 5.4 | |
| M6a08-2 | 0.8 | 12 | 4.5 | 3.3 | |
| M6a08-3 | 0.8 | 24 | 14 | 8.1 |
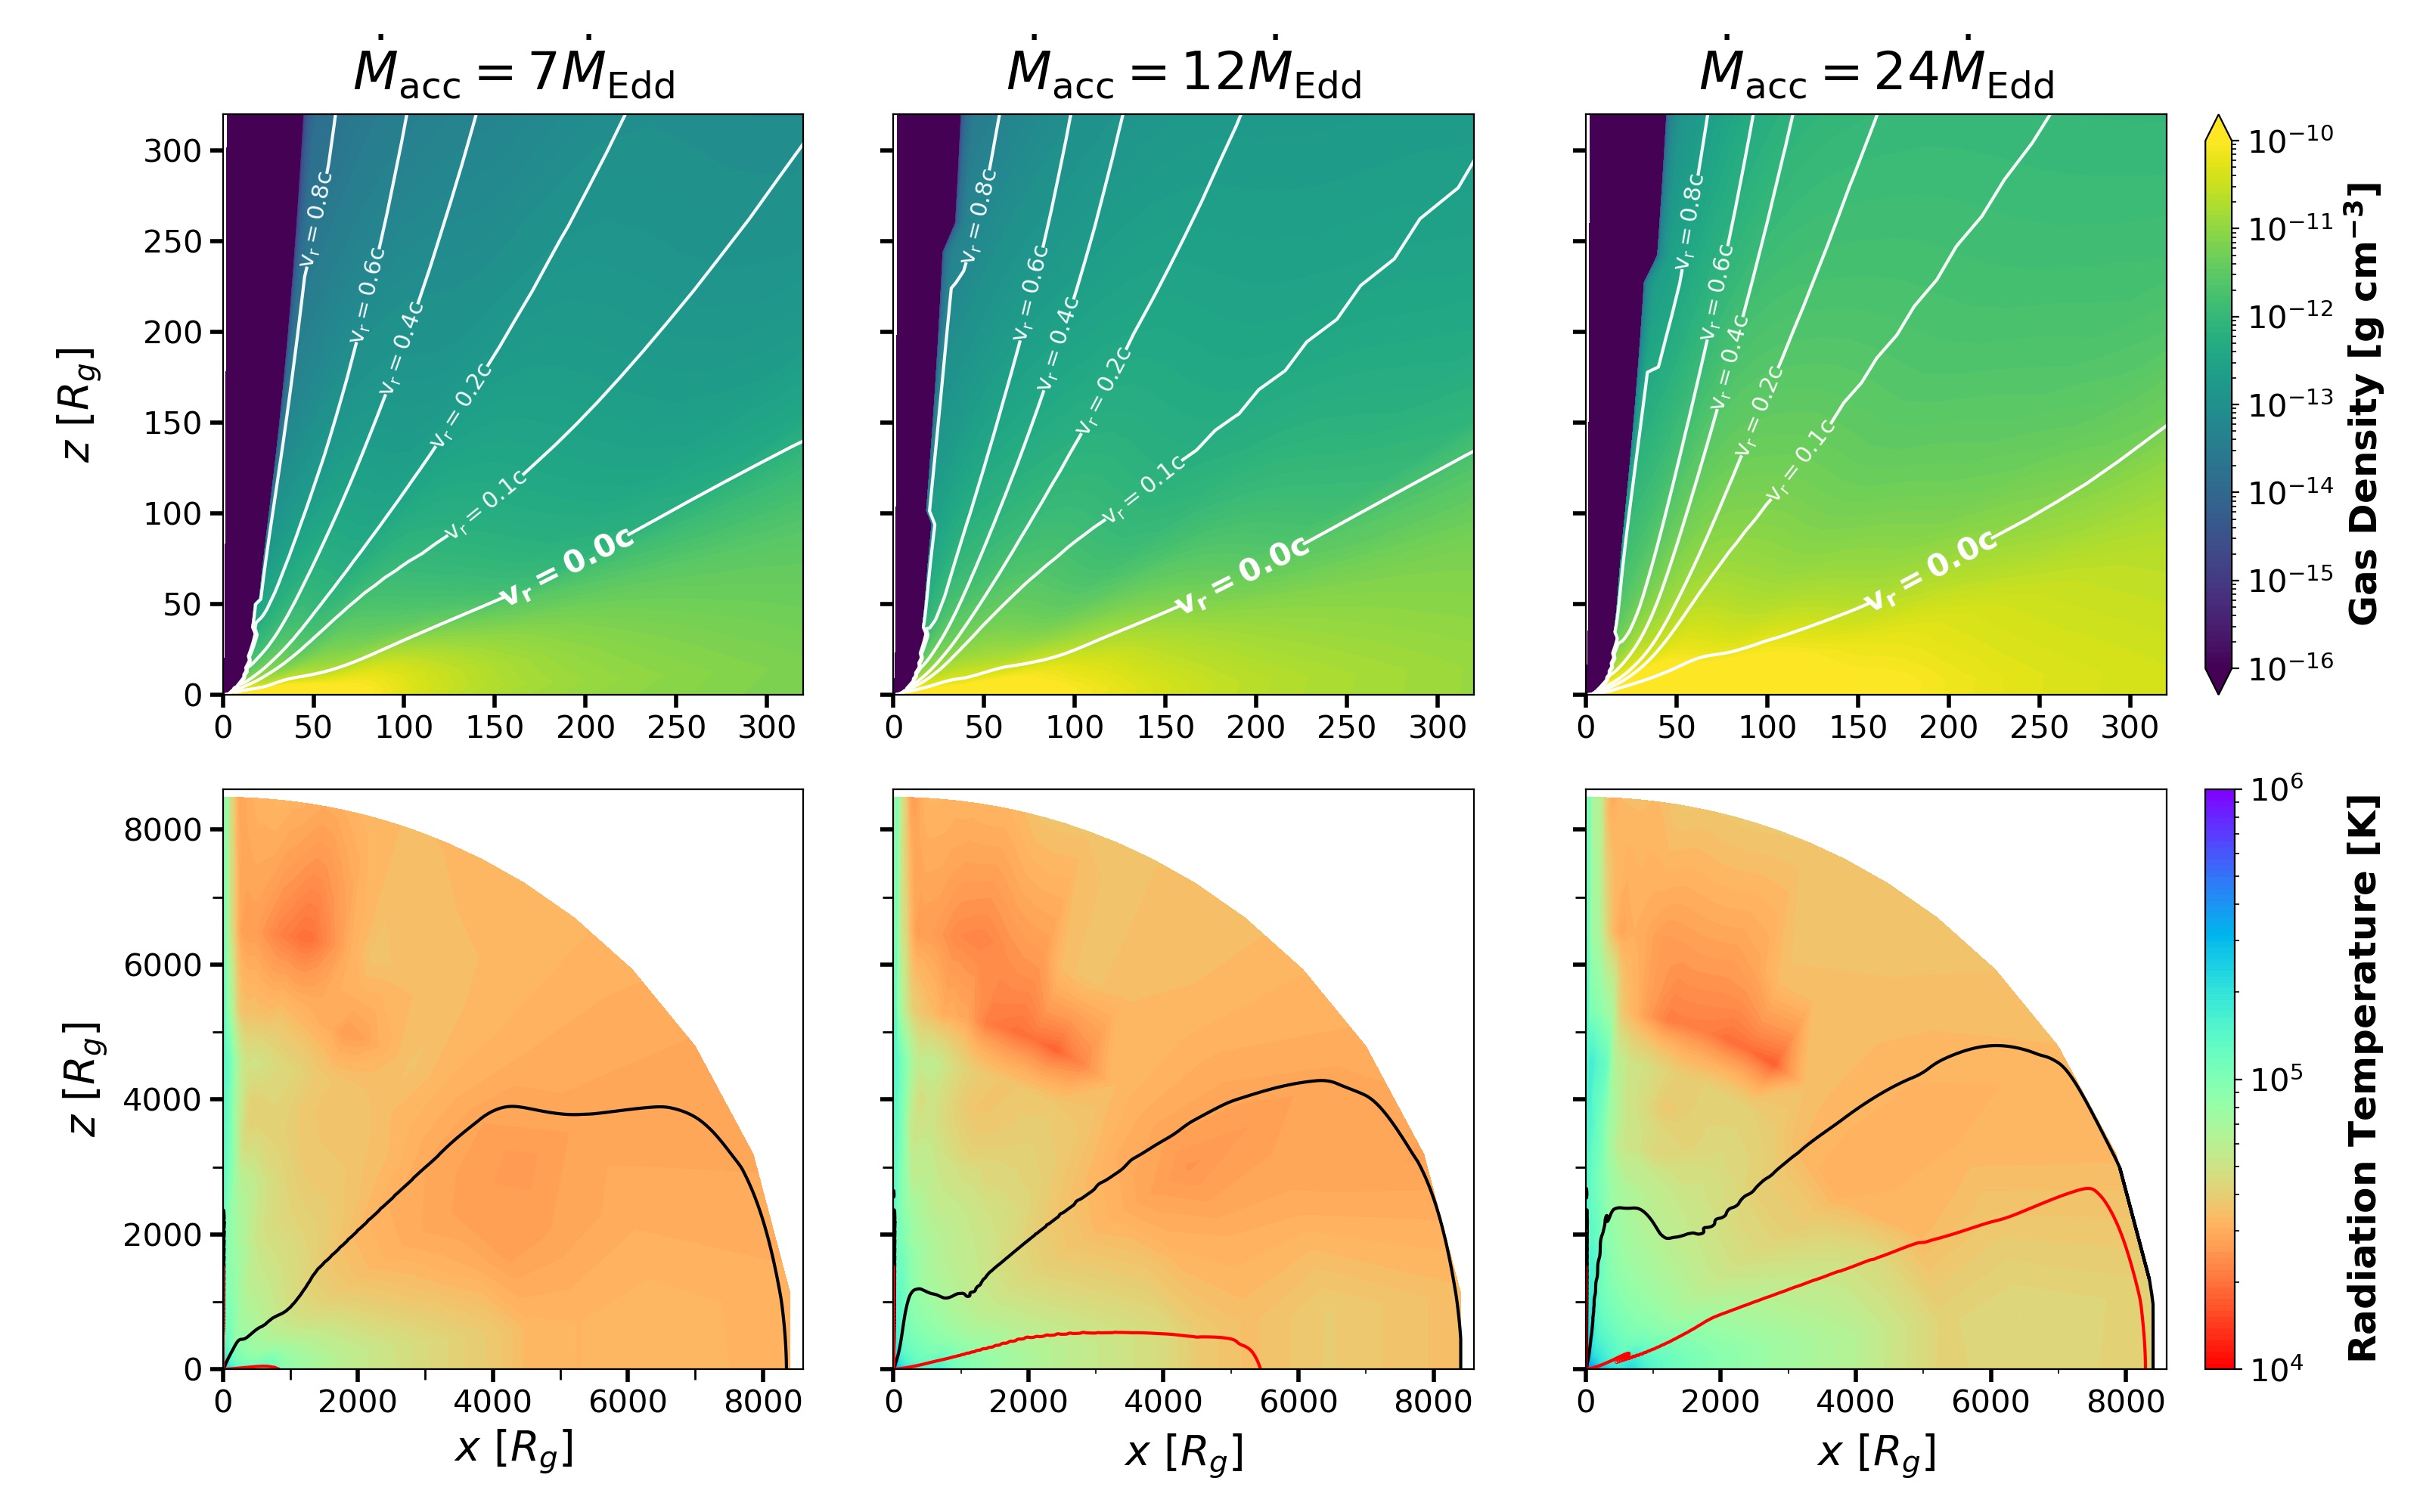
The averaged accretion rates onto the event horizon of the MBH in these three simulations are 7, 12 and 24 . To first order, these super-Eddington accretion flows have similar structures as those described in Dai et al. (2018). As shown in the upper panels of Fig. 1, geometrically and optically thick disks are formed with half-angular thickness , with, as expected, higher gas density towards the equatorial plane. The rotation profile of the resultant thick disks is sub-Keplerian. Wide-angle winds are launched by the large radiation and magnetic pressure, which are also optically thick at most angles except close to the polar axis. There are roughly two components of the wind: an ultra-fast outflow (UFO) with speeds faster than within from the pole, and a slower but denser wind outside inclination. At larger accretion rates, the disk and wind densities increase, and the winds become slower as a result of mass-loading. However, the wind geometry stays fairly similar.
The emission properties of the accretion flow should be examined near the photosphere. The optical depth for an opacity is calculated using along the radial direction, , from the outer boundary towards the event horizon. (Here relativistic effects are included so that: , with and ). The electron scattering photosphere is defined by with . The effective photosphere is then defined by with , where we have only considered free-free opacity in the scattering-dominated gas, where is the gas temperature. Both photospheres are plotted over the disk profiles in the lower panels of Fig. 1. As expected, we see the presence of an optically thin “funnel” near the rotation axis where the wind density is correspondingly lower. As the accretion rate increases, the wind becomes more opaque, which reduces the angular size of the funnel.
The effective photospheres reside mostly within except along the equitorial direction for the disk with the largest . Therefore, we select to evaluate various physical quantities at . This gives averaged wind mass rates of 1.4, 4.5 and 14 , and averaged bolometric luminosities at = 5.4, 3.3 and 8.1 , respectively, for the three simulations. The radiation temperature of the accretion flow is also plotted, which varies from K near the black hole to K in the outer part of the disk and wind. The radiation flux varies with the inclination as shown in Dai et al. (2018) and leaks out through the region of least resistance, which is the funnel.
Magnetic fluxes are dragged by the accretion flow and accumulate near the MBH. This brings the inner regions to swiftly become a magnetically arrested accretion disk (MAD) (Narayan et al., 2003). Relativistic jets are launched magnetically through the Blandford-Znajek mechanism (Blandford & Znajek, 1977) in all simulations. In this Letter we focus on calculating the emission properties from the disk, and leave the analysis of the jets for future study.
3.2 Spectra from post-processing
In this Section we investigate how the emission reprocessing depends on a few key parameters, namely, the viewing angle, the accretion rate, and the luminosity. The dependence on viewing angle has been previously studied by Dai et al. (2018). They show that for a fixed accretion rate, there is a clear trend of the spectral energy distribution (SED) moving towards larger wavelengths with increasing inclination angle. At low inclinations, the gas density is lower, so X-rays produced from the inner disk easily escape. At relatively large inclinations, on the other hand, the optically thick wind and outer disk serve as an effective reprocessing envelope. More specifically, in the fast wind region, the photons lose energy as they go through multiple scatterings in the expanding outflow before escaping. In the disk and the slow wind region, the reprocessing is mainly caused by the absorption of X-ray photons and the thermal Comptonization of electrons.
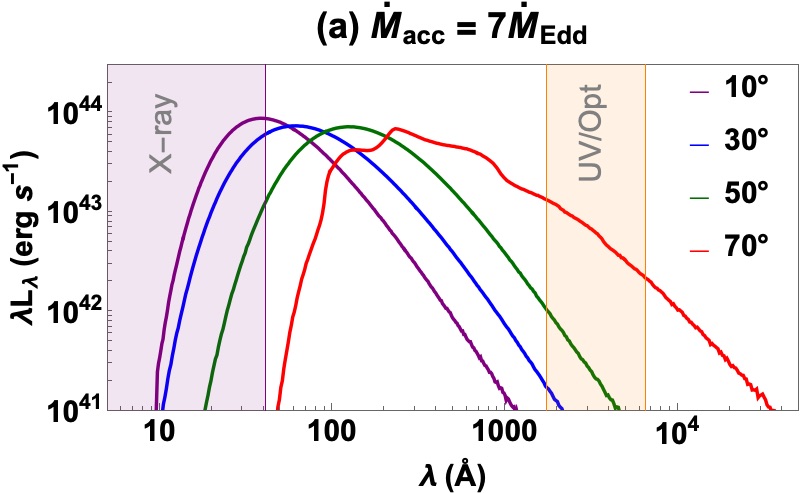
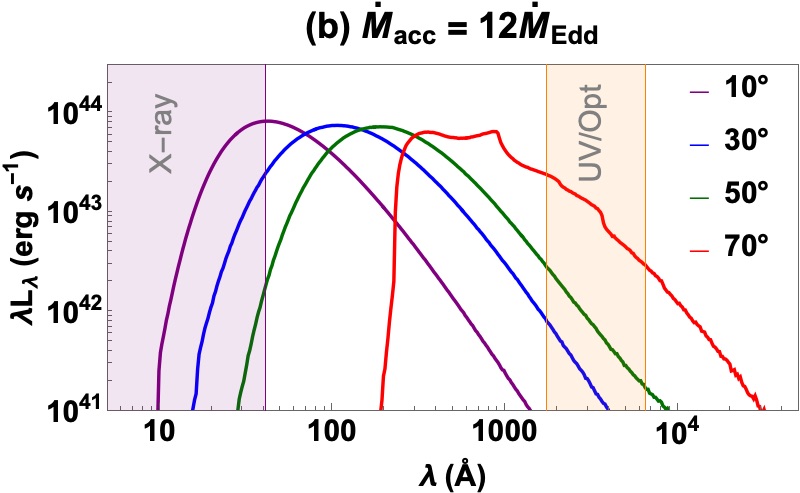
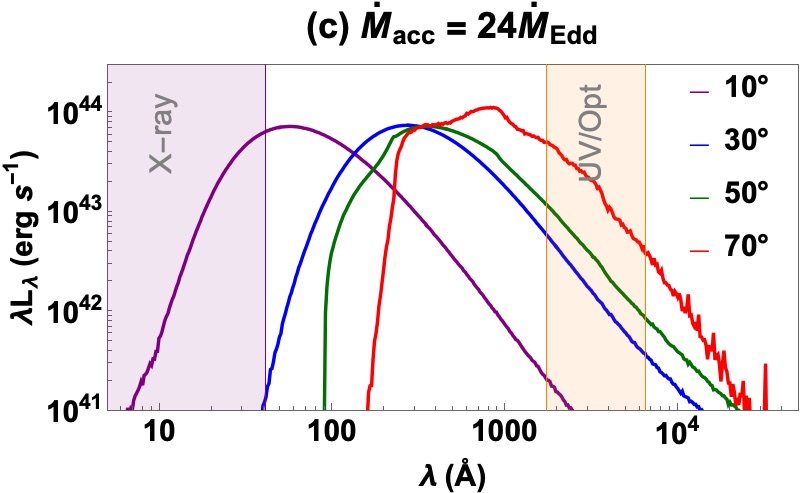
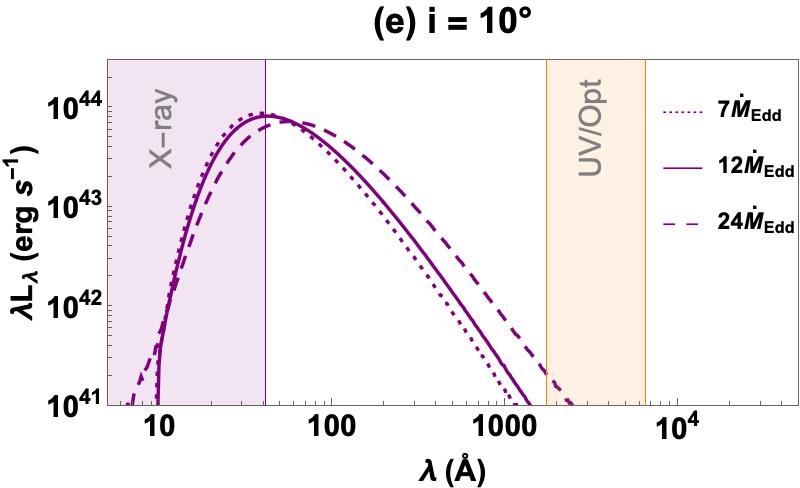
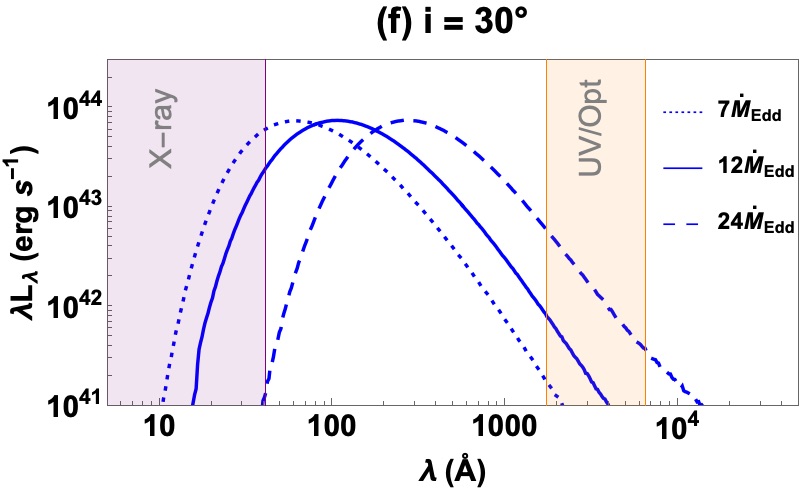
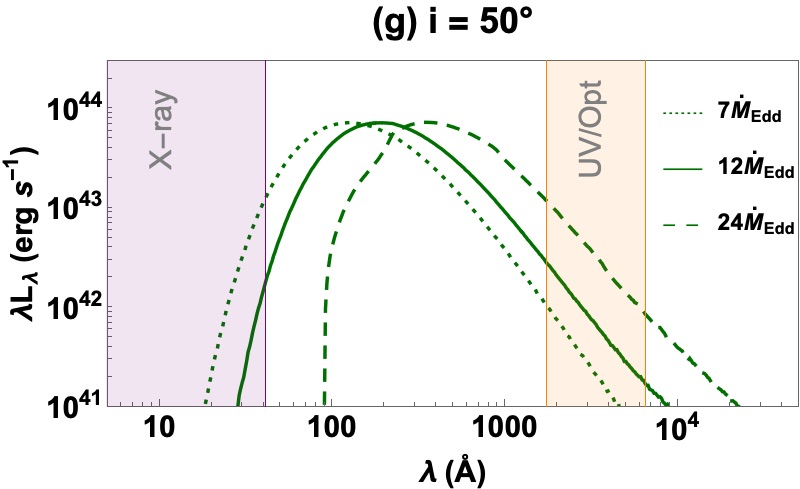
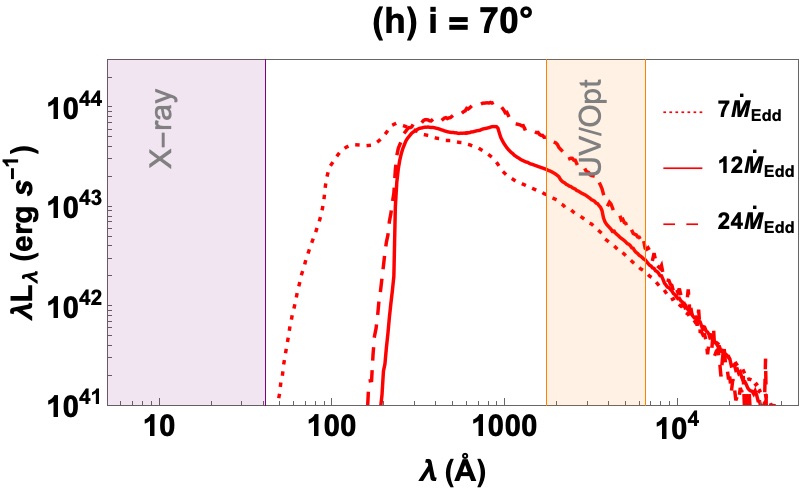
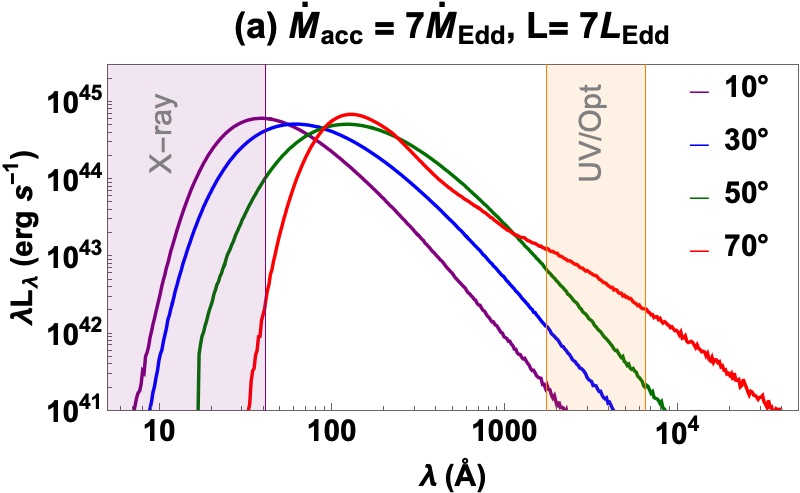
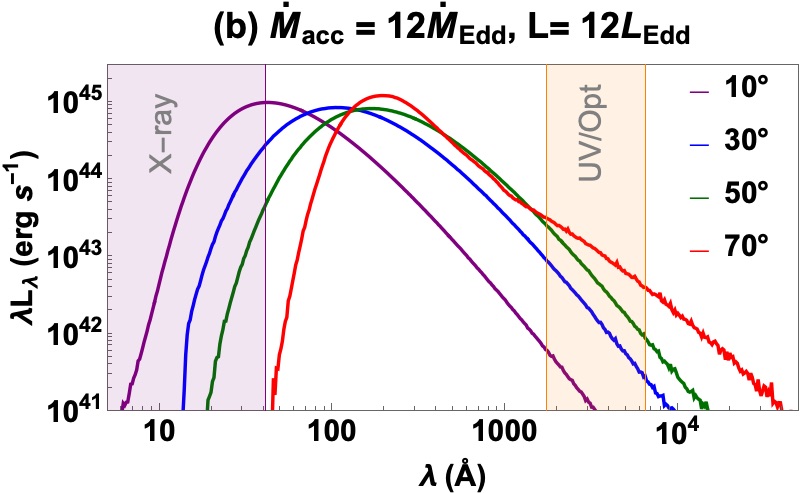
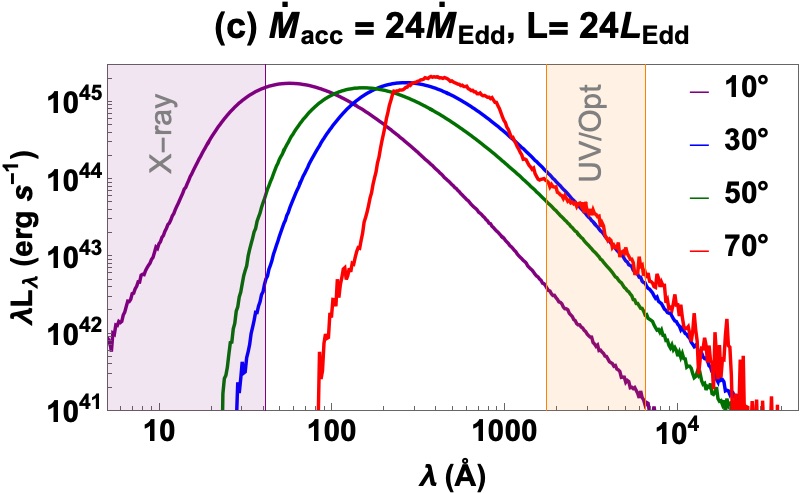
We re-examine the emission viewing-angle dependence in the three new simulated disks. Fig. 2, 2 and 2 show how the escaped spectrum varies with inclination, when respectively. At any of these accretion rates, the SED still evolves from X-ray to optically dominated as the inclination increases. However, the exact angle at which this transition occurs depends on the accretion rate. One can clearly observe that at low accretion rates , the escaped emission is dominated by X-ray emission at most inclinations unless the inclination angle is substantial (e.g., for ), while at very high accretion rates , the emanating radiation is mainly optically dominated except near the polar region (e.g., for ).
We expect a TDE to be observed along a fix viewing angle during its entire evolution, unless the disk experiences some axial precession. Therefore, we show the spectral evolution with at fixed inclination angles in Fig. 2–2. As the accretion rate declines after peak, the amount of reprocessing material is reduced, so the SED universally shifts towards lower wavelengths. However, the exact behavior of the spectrum depends sensitively on the inclination angle. At very small inclinations (), the TDE stays X-ray dominated throughout its evolution. At intermediate inclinations ( and ), the TDE can be optically strong at early times (if can be sufficiently large), and then rebrightens at X-ray energies at late time when the accretion rate diminishes. At very large inclinations (), the TDE stays UV/optically strong throughout its entire evolution.
While we have assumed that the bolometric luminosities of the escaped radiation always close to in the analysis above, GRRMHD simulations show that the true escaped luminosity from super-Eddington disks can exceed the Eddington limit, with more flux leaking out through the funnel (e.g., Sa̧dowski & Narayan, 2016). Therefore, we also calculated the spectra when the escaped radiation has a bolometric luminosity , which are shown in Fig. B.1. When the reprocessing is driven by adiabatic expansion, the SED shape stays unchanged while the magnitude of the flux scales with the luminosity. When the reprocessing mechanism is driven by absorption and Comptonization, increasing the luminosity makes the gas more ionized and reduces bound-free and free-free absorption, which shifts the spectral energy peak to slightly higher energies. However, the spectral shape is rather insensitive to the luminosity. In general, the setting of the luminosity within the explored range does not alter how the escaped radiation depends on the viewing angle and accretion rate.
3.3 Comparison with observations: blackbody luminosity, effective temperature, and photosphere radius
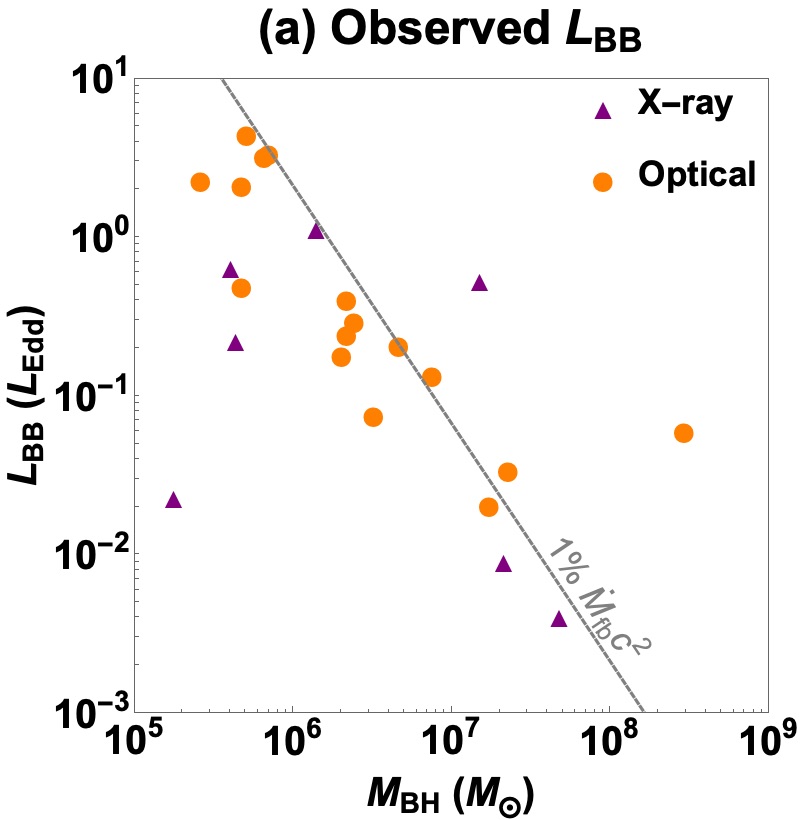
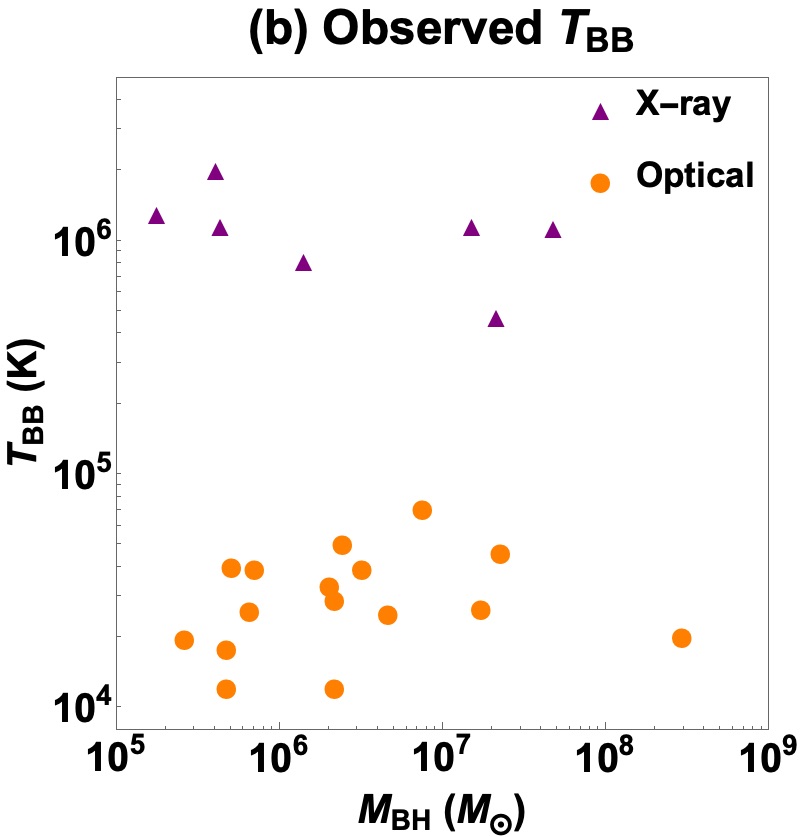
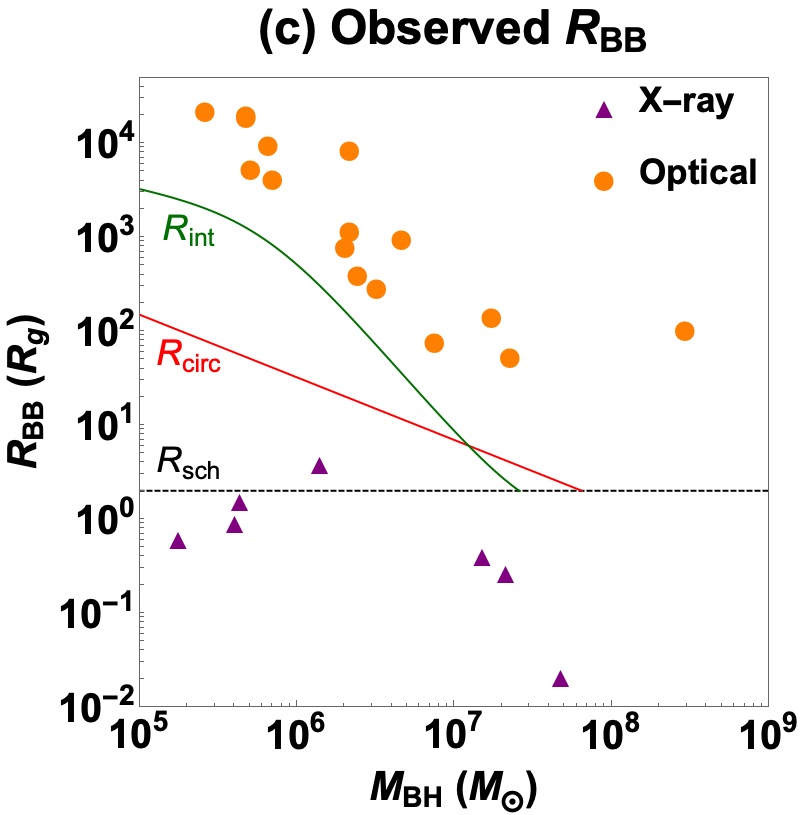
In this section, we compare our model predictions to the observed properties of TDEs. We start from the TDE catalog in Gezari (2021) which also lists the observed blackbody luminosities and temperatures, and then only include TDEs which have their masses estimated from the relation as in Wong et al. (2022). This gives us 7 X-ray-selected TDEs (Table C.1) and 16 optically-selected TDEs (Table C.2). We plot their observed blackbody luminosities, effective temperatures and photosphere radii as functions of in Fig. 3 - 3. The observed varies between , and can exceed when . Interestingly, commonly has a dependence on following the fallback rate trend: . The observed clearly depends on whether the TDE is optically-selected ( K) or X-ray-selected ( K). The observed , calculated from and using the Stefan-Boltzmann law, also has a bimodal distribution. The optically-selected TDEs have reaching and always exceeding both the circularization radius and the stream self-intersection radius (Dai et al., 2015). The X-ray-selected TDEs, however, sometimes have even within the event horizon, which might be caused by absorption in circumnuclear medium.
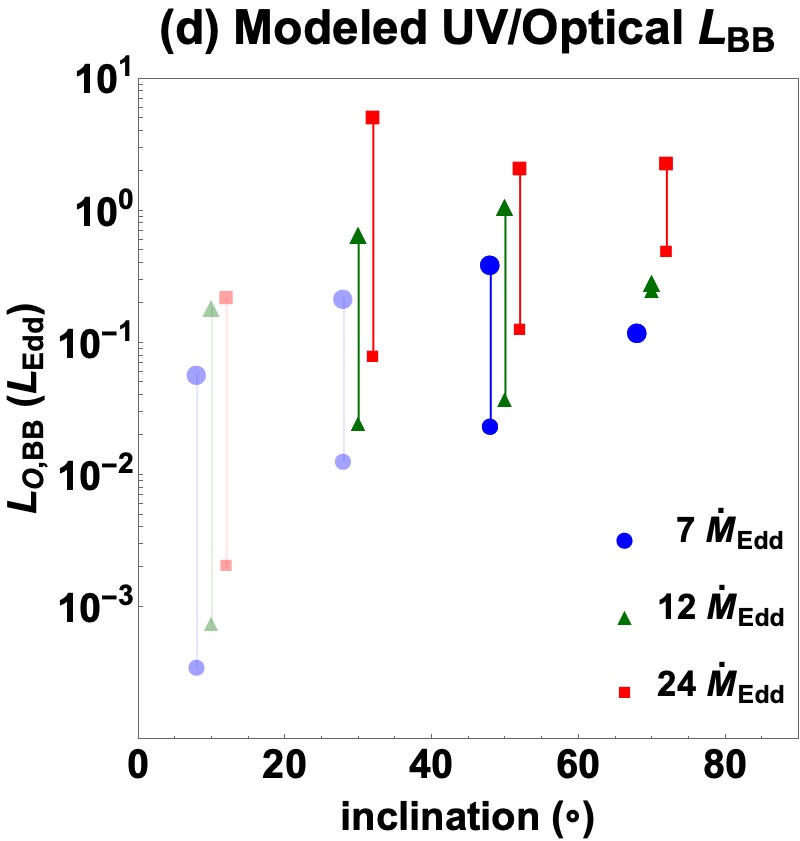
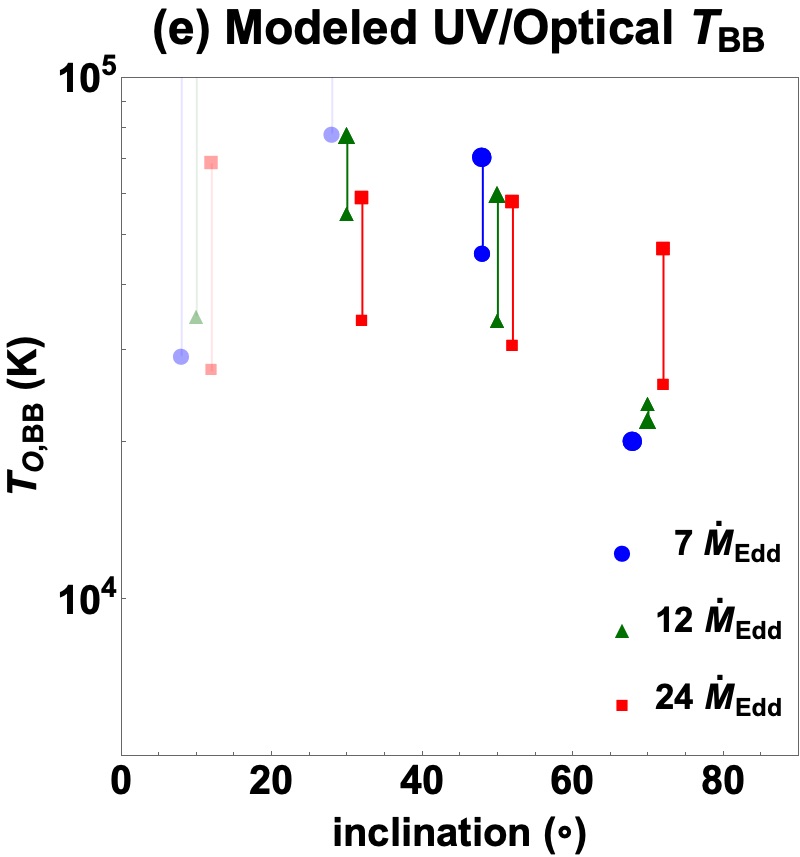
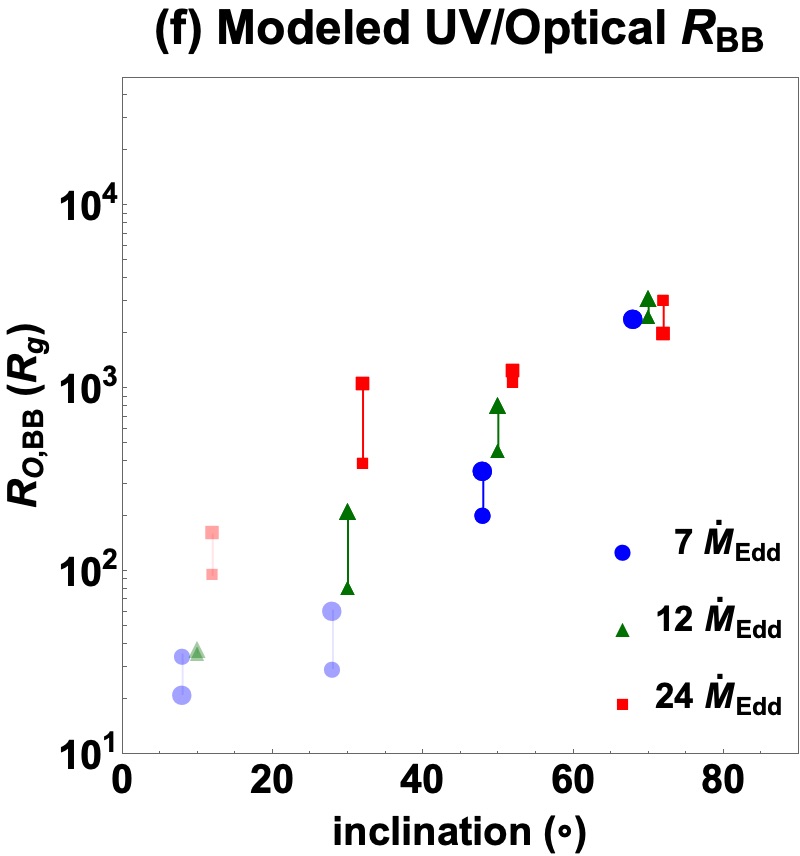
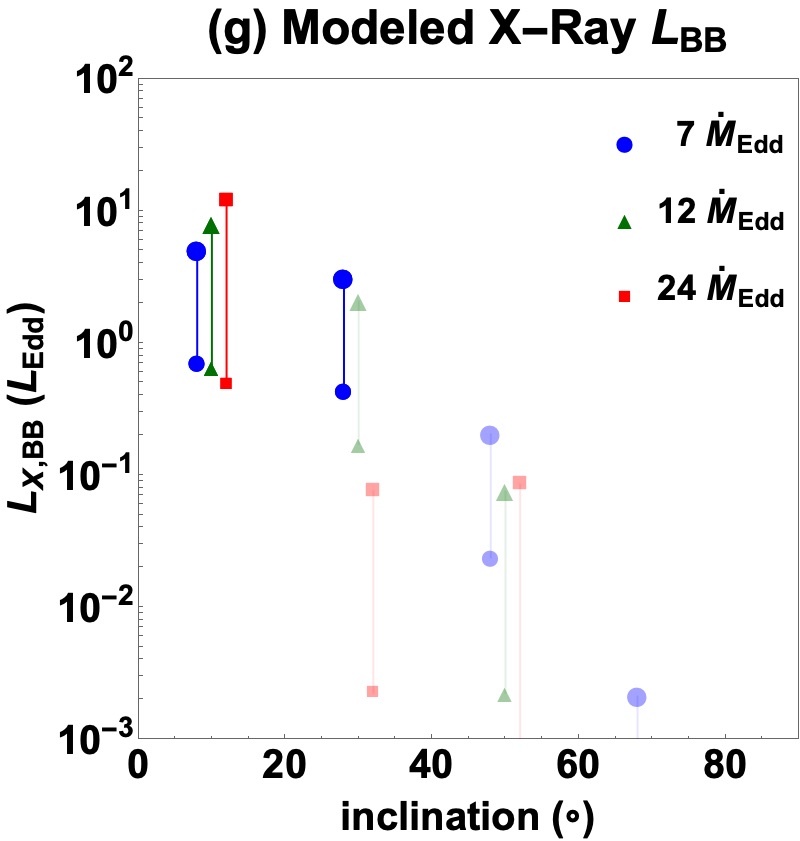
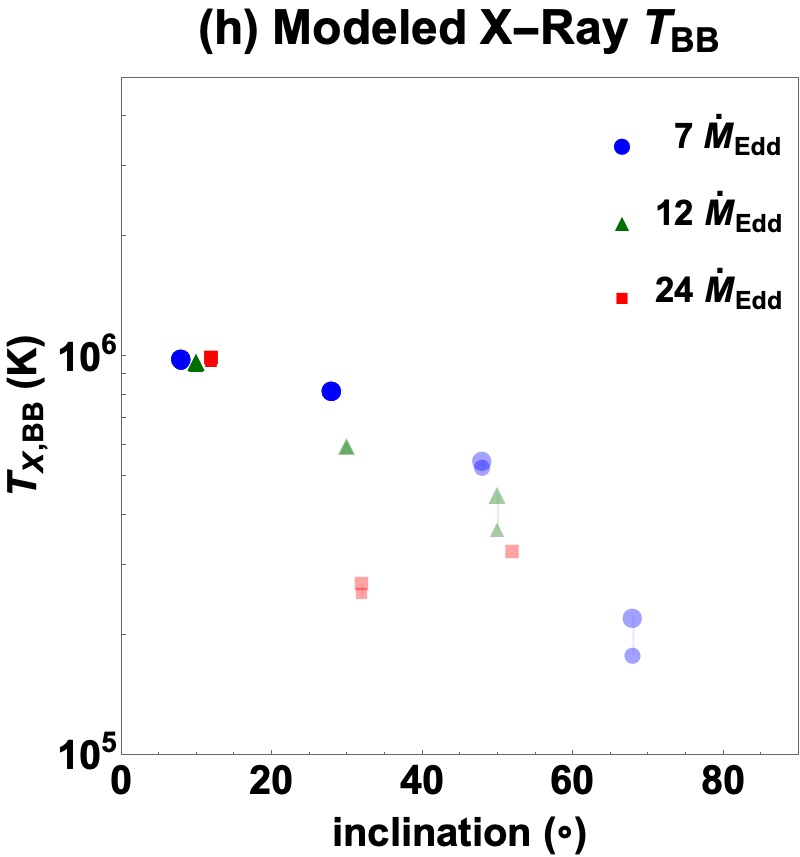
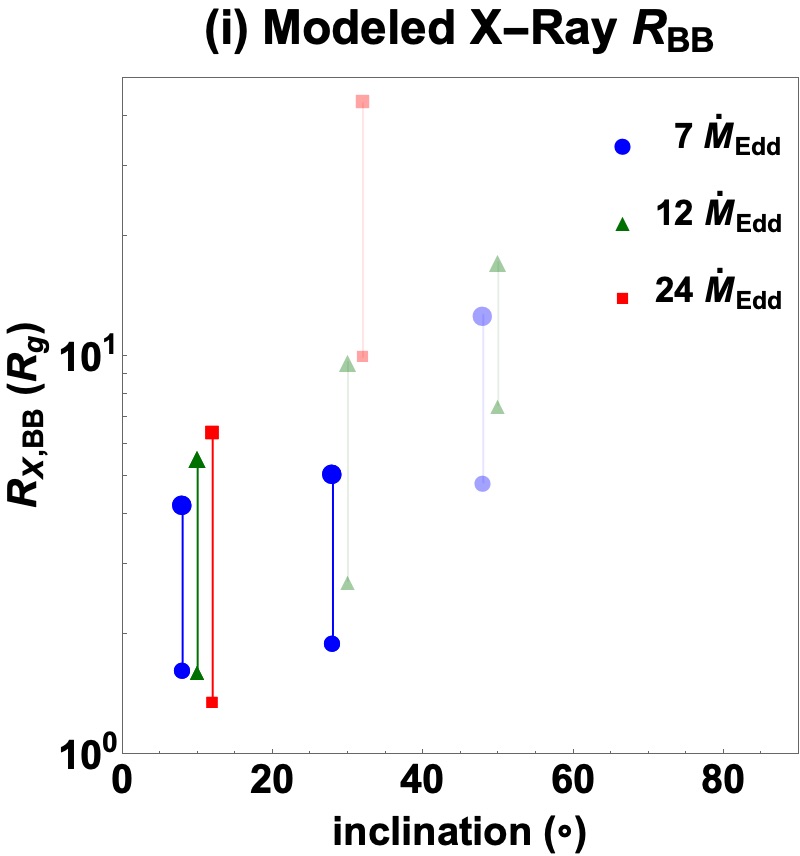
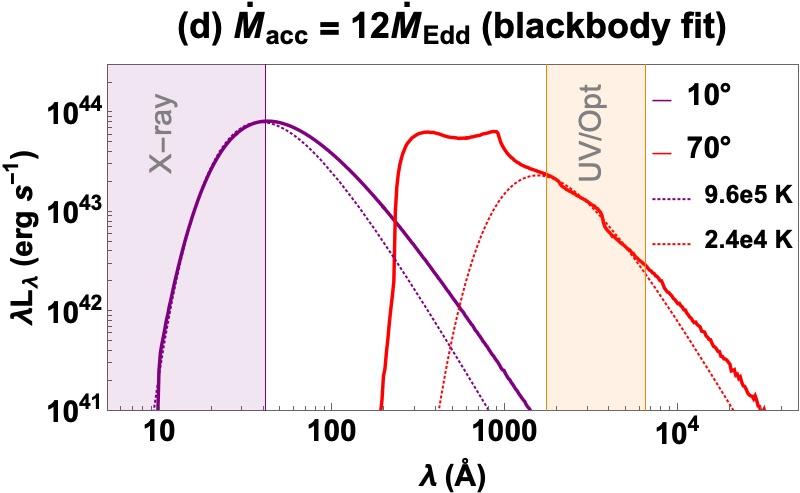
As the observed properties of TDEs are usually inferred from their spectra in monochromatic bands, we also fit the simulated spectra in either the X-ray or UV/optical band with blackbody spectra. For example, in Fig. 2, we show the simulated escaped spectra for at and and the blackbody radiation fits to the spectra in the X-ray band (0.3-10 keV) or the part of the spectrum in the UV/optical band (the 170-650 nm Swift UVOT band). It can be seen that the X-ray and UV/optical emission can be individually well approximated by blackbody radiation. Similarly, for each spectrum (at 7, 12, or 24 and inclination ), we obtain two blackbody radiation fits in the X-ray band and the UV/optical band. The escaped bolometric luminosity is assumed to be varying between and . The luminosities, temperatures and radii of the best-fit blackbody radiation spectra are are listed in Table D.1 and plotted in Fig. 3 - 3 (UV/optical fit) and Fig. 3 - 3 (X-ray fit). We further categorize whether a modeled TDE spectrum is a X-ray strong or optically strong by comparing the luminosity in the X-ray band (0.3-10 keV) and the blackbody luminosity inferred from the UV/optical band. We compare the model predictions to the observed properties as below:
1. Luminosity: The modeled mostly lies between 0.01-few . The simulated spectrum usually peaks in EUV and has a broader shape than a single-temperature blackbody spectrum. Therefore, the inferred blackbody luminosity ( or ) is always smaller than the bolometric luminosity of the escaped radiation. for optically-strong TDEs and for X-ray-strong TDEs is typically few. This naturally explains the missing energy problem in TDE (Stone & Metzger, 2016; Lu & Kumar, 2018; Mockler & Ramirez-Ruiz, 2021) – the majority of the energy is emitted in the EUV band which is difficult to be detected.
2. Temperature: Our modeling reproduces the bimodal distribution of TDE temperatures, i.e., optically-strong TDEs have temperature , and X-ray-strong TDEs have temperature . Furthermore, our modeling shows that the inferred temperatures of optical TDEs are not highly sensitive to accretion rates or observer inclination, which explains why TDEs have relatively constant throughout the evolution (van Velzen et al., 2020).
3. Photosphere radius: The optically-strong TDEs have far larger photosphere radii () than X-ray-strong TDEs (). A comparison between the observed and the modeled suggests that optically-selected TDEs are either commonly observed from large inclinations, or have . The distinction between the observed and modeled is possibly accounted by the absorption of X-rays in the circumnuclear medium.
We note that our predictions for the X-ray quantities, in particularly in the bin, are sensitive to the setting of the radiative transfer calculations. Here we always inject a blackbody spectrum with a constant , so our predicted at small inclinations also fall into a very narrow range. However, the temperatures at the center of accretion disks generally increase with increasing and decreasing , which will induce more variance to the observed X-ray temperatures. Also, for the setting with , the predicted decreases as increases, as a result of a constant bolometric luminosity and more reprocessing from X-ray to UV/optical emissions at higher densities. However, simulations show that the radiation fluxes leaking out through the funnel are not Eddington-limited (McKinney et al., 2015; Dai et al., 2018). Therefore, we expect that X-ray luminosities should scale positively with accretion rates, as illustrated by the case.
3.4 Temporal evolution of TDEs
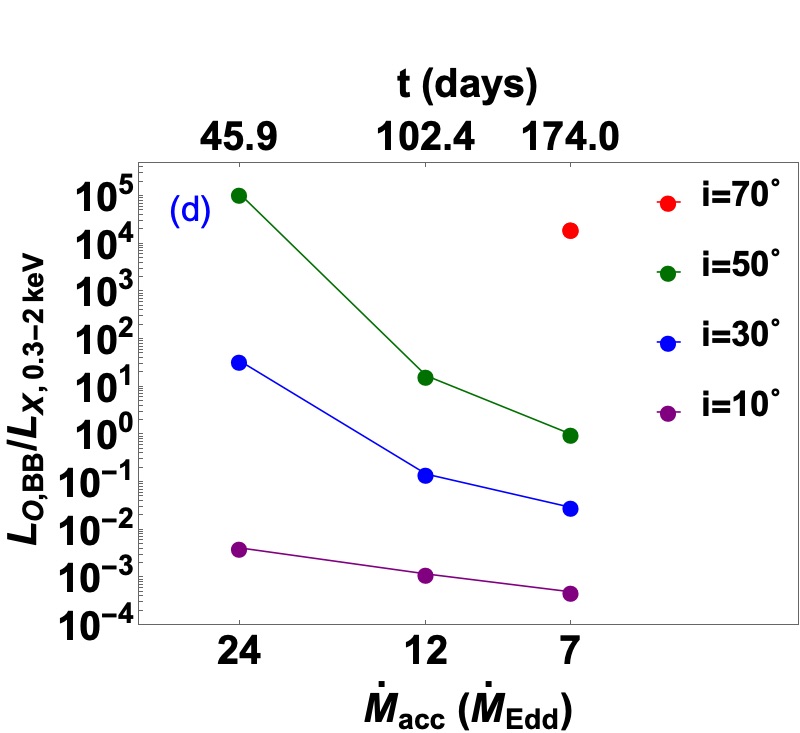
We show in Fig. 4 the evolution of the modeled luminosity, temperature, radius, as well as the ratio of optical to X-ray luminosity, as functions of the accretion rate. In order to connect the snapshots at an specific accretion rate to the temporal evolution of TDEs, we assume . This assumption is valid only if the fallback timescale dominates over other timescales, such as the disk viscous timescale and the photon diffusion/advection timescales. The exact conversion from to depends on the mass of the MBH, the properties of the disrupted star, and the impact parameter (Law-Smith et al., 2020). Focusing on the post-peak evolution, the three disk simulations correspond to 45.9, 102.4 and 174 days after the peak of the flare, assuming a solar-type star is fully disrupted by a black hole. Calculations of various timescales are given in Appendix E.
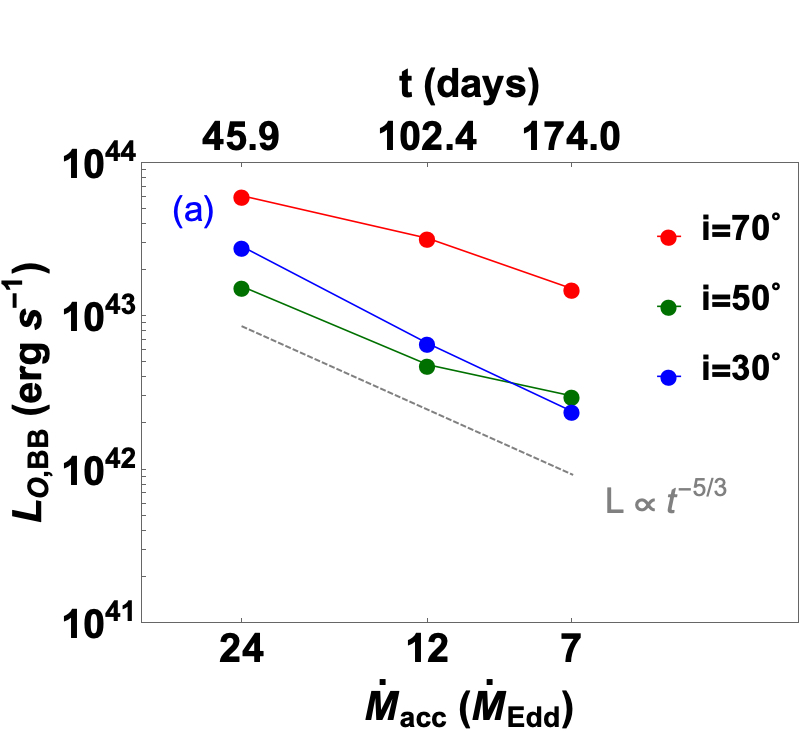
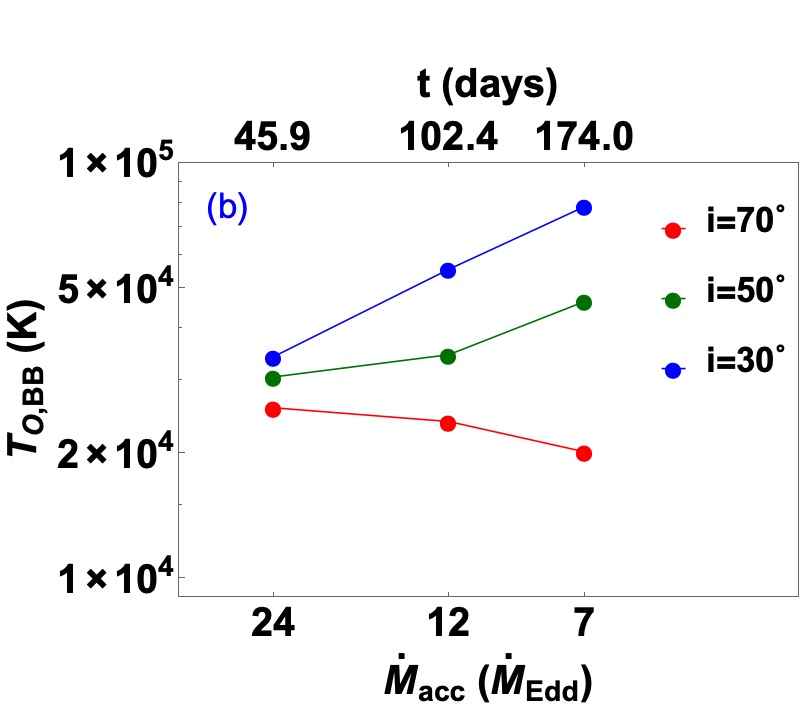
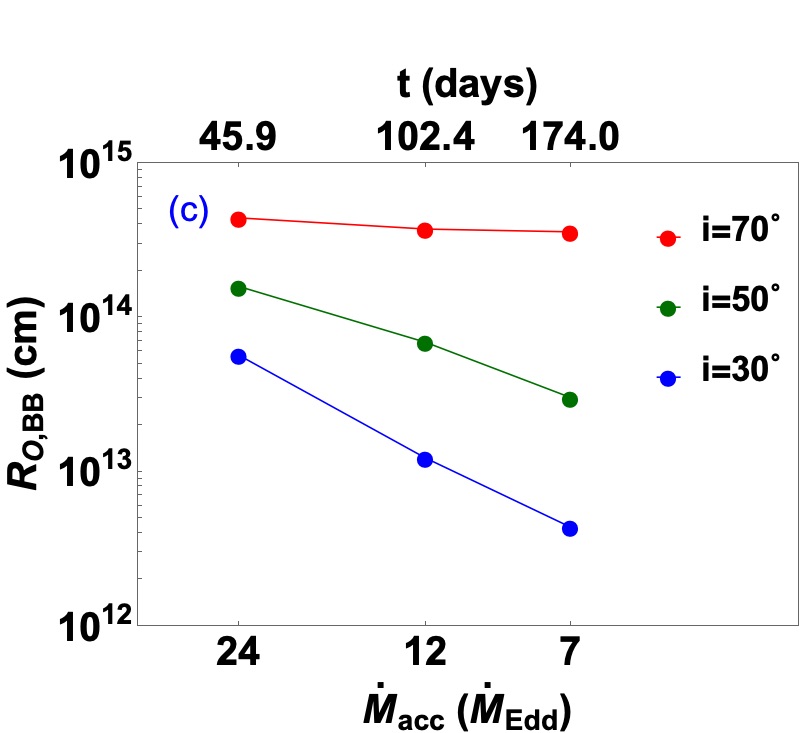
As the accretion rate drops from to , the optical luminosity also decreases, and the UV/optical light curve roughly follows the canonical decay. As discussed in the previous section, the fitted blackbody temperature stays rather constant. Interestingly, at large inclinations slightly decreases with declining , while at small to intermediate inclinations shows the opposite trend. This can provide an explanation to the different observed evolution of (van Velzen et al., 2020). As a result, the photosphere radius shrinks as decreases, with a faster evolution at smaller inclinations.
The ratio between UV/optical luminosity () and X-ray luminosity () also decreases as the accretion level drops and the amount of obscuring material is reduced. The fastest evolution is observed at intermediate inclinations, and especially if the TDE has a high accretion rate at peak. In such cases, we expect to see strong X-ray re-brightening of initially optically-strong TDEs, as reported in Gezari et al. (2017). The X-ray luminosity reaches the same level as the UV/optical luminosity at days after peak, and possibly even later if the disk formation or viscous timescale is long. At very small inclinations, the event is always X-ray strong. At very large inclinations, the event should stay optically strong for a long period, although it is theoretically predicted that the disk should eventually become geometrically thin and emit mostly in X-rays/UV when the accretion level drops to around Eddington (Shakura & Sunyaev, 1973).
4 Summary and future work
Inspired by the unified model for TDEs proposed by in Dai et al. (2018), we carry out three addtional 3D GRRMHD simulations of TDE super-Eddington accretion flow at different Eddington ratios, and conduct radiative transfer calculations to obtain the emanating spectra. Based on the results, we further propose a dynamical unified model which can explain the diversity and evolution of TDEs:
-
•
The viewing angle of the observer with respect to the orientation of the disk is the most important parameter in determining whether we observe either an X-ray or an optical bright TDE. At small inclinations, X-rays can escape from the funnel of the super-Eddington disk. At large inclinations, X-rays are mostly reprocessed into UV/optical radiation by the geometrically and optically thick wind and disk.
-
•
The blackbody radiation fits of the TDE super-Eddington disk spectra produce effective temperature, blackbody luminosity and photosphere radius distributions consistent with the observed ones. Most radiative energy escapes in the EUV range, and only a few to a few tens of percentage of radiative energy can be detected, which provides a solution to the TDE missing energy problem.
-
•
The observed diversity of the emission from different TDEs can be associated with the different Eddington ratios of their accretion rates, , at the flare peak conditions. In general, higher accretion levels induce larger (fitted blackbody) luminosities and larger photosphere radii, but do not significantly change the fitted effective temperatures.
-
•
The early-time evolution ( days after peak) of optical TDEs can be explained by this reprocessing model. As the luminosity drops by about 0.5-1 order of magnitude, the fitted temperature slightly increases at small to intermediate inclinations or decreases at large inclinations.
-
•
The evolution of the optical-to-X-ray flux ratio also depends sensitively on the viewing angle. At large inclinations, the TDE stays UV/optically strong for a very long time. At intermediate inclinations, we expect to see the fastest X-ray rebrightening, and reaches unity at few hundred days. At small inclinations, the TDE is always X-ray strong. The exact evolution timescale also depends on the accretion rate at peak, which further depends on the black hole and stellar parameters.
In this study we focus on understanding the disk continuum emission. We will investigate the disk spectroscopic features in a future work. Also, while our GRRMHD simulations are conducted in 3D, we only do post-processing along different inclination bins by assuming the profiles are spherically symmetric, which means that photons have an overall radial motion. Implementing 2D or 3D radiative transfer calculations can allow us to study the reprocessing of photons along more realistic paths. Furthermore, the evolution of the disk and jet emissions can be studied in more details by conducting simulations covering a more complete parameter space for black hole accretion rate and spin.
The unified model we have proposed for TDEs also sheds light on other types of black hole accretion systems, especially other super-Eddington sources such as ultra-luminous X-ray sources, narrow line Seyfert 1 galaxies, changing-look AGN and quasars in the early universe. Works like this illustrate that novel simulations are crucial for making direct comparisons between the observed emissions and model predictions, which offers important insights to how black holes grow through cosmic time, use accretion as a source of energy to power outflows and radiation, and give feedback to their surrounding environment.
References
- Andalman et al. (2022) Andalman, Z. L., Liska, M. T. P., Tchekhovskoy, A., Coughlin, E. R., & Stone, N. 2022, MNRAS, 510, 1627
- Auchettl et al. (2017) Auchettl, K., Guillochon, J., & Ramirez-Ruiz, E. 2017, ApJ, 838, 149
- Balbus & Hawley (1998) Balbus, S. A., & Hawley, J. F. 1998, Reviews of Modern Physics, 70, 1
- Blandford & Znajek (1977) Blandford, R. D., & Znajek, R. L. 1977, MNRAS, 179, 433
- Bloom et al. (2011) Bloom, J. S., Giannios, D., Metzger, B. D., et al. 2011, Science, 333, 203
- Bonnerot et al. (2021) Bonnerot, C., Lu, W., & Hopkins, P. F. 2021, MNRAS, 504, 4885
- Burrows et al. (2011) Burrows, D. N., Kennea, J. A., Ghisellini, G., et al. 2011, Nature, 476, 421
- Cenko et al. (2012) Cenko, S. B., Krimm, H. A., Horesh, A., et al. 2012, ApJ, 753, 77
- Charalampopoulos et al. (2022) Charalampopoulos, P., Leloudas, G., Malesani, D. B., et al. 2022, A&A, 659, A34
- Coughlin & Begelman (2014) Coughlin, E. R., & Begelman, M. C. 2014, ApJ, 781, 82
- Curd & Narayan (2019) Curd, B., & Narayan, R. 2019, MNRAS, 483, 565
- Dai et al. (2021) Dai, J. L., Lodato, G., & Cheng, R. 2021, Space Sci. Rev., 217, 12
- Dai et al. (2015) Dai, L., McKinney, J. C., & Miller, M. C. 2015, ApJ, 812, L39
- Dai et al. (2018) Dai, L., McKinney, J. C., Roth, N., Ramirez-Ruiz, E., & Miller, M. C. 2018, ApJ, 859, L20
- De Colle et al. (2012) De Colle, F., Guillochon, J., Naiman, J., & Ramirez-Ruiz, E. 2012, ApJ, 760, 103
- Evans & Kochanek (1989) Evans, C. R., & Kochanek, C. S. 1989, ApJ, 346, L13
- French et al. (2020) French, K. D., Wevers, T., Law-Smith, J., Graur, O., & Zabludoff, A. I. 2020, Space Sci. Rev., 216, 32
- Gezari (2021) Gezari, S. 2021, ARA&A, 59, arXiv:2104.14580 [astro-ph.HE]
- Gezari et al. (2017) Gezari, S., Cenko, S. B., & Arcavi, I. 2017, ApJ, 851, L47
- Guillochon et al. (2014) Guillochon, J., Manukian, H., & Ramirez-Ruiz, E. 2014, ApJ, 783, 23
- Guillochon & Ramirez-Ruiz (2013) Guillochon, J., & Ramirez-Ruiz, E. 2013, ApJ, 767, 25
- Hammerstein et al. (2022) Hammerstein, E., van Velzen, S., Gezari, S., et al. 2022, arXiv e-prints, arXiv:2203.01461
- Hayasaki & Jonker (2021) Hayasaki, K., & Jonker, P. G. 2021, ApJ, 921, 20
- Hinkle et al. (2021) Hinkle, J. T., Holoien, T. W. S., Auchettl, K., et al. 2021, MNRAS, 500, 1673
- Holoien et al. (2018) Holoien, T. W. S., Brown, J. S., Auchettl, K., et al. 2018, MNRAS, 480, 5689
- Jiang et al. (2014) Jiang, Y.-F., Stone, J. M., & Davis, S. W. 2014, ApJ, 796, 106
- Jiang et al. (2019) —. 2019, ApJ, 880, 67
- Kasen et al. (2006) Kasen, D., Thomas, R. C., & Nugent, P. 2006, ApJ, 651, 366
- Law-Smith et al. (2020) Law-Smith, J. A. P., Coulter, D. A., Guillochon, J., Mockler, B., & Ramirez-Ruiz, E. 2020, ApJ, 905, 141
- Leloudas et al. (2019) Leloudas, G., Dai, L., Arcavi, I., et al. 2019, ApJ, 887, 218
- Liu et al. (2022) Liu, X.-L., Dou, L.-M., Chen, J.-H., & Shen, R.-F. 2022, ApJ, 925, 67
- Lodato & Rossi (2011) Lodato, G., & Rossi, E. M. 2011, MNRAS, 410, 359
- Loeb & Ulmer (1997) Loeb, A., & Ulmer, A. 1997, ApJ, 489, 573
- Lu & Kumar (2018) Lu, W., & Kumar, P. 2018, ApJ, 865, 128
- McKinney et al. (2015) McKinney, J. C., Dai, L., & Avara, M. J. 2015, MNRAS, 454, L6
- McKinney et al. (2012) McKinney, J. C., Tchekhovskoy, A., & Blandford, R. D. 2012, MNRAS, 423, 3083
- McKinney et al. (2014) McKinney, J. C., Tchekhovskoy, A., Sadowski, A., & Narayan, R. 2014, MNRAS, 441, 3177
- Metzger & Stone (2016) Metzger, B. D., & Stone, N. C. 2016, MNRAS, 461, 948
- Mockler et al. (2019) Mockler, B., Guillochon, J., & Ramirez-Ruiz, E. 2019, ApJ, 872, 151
- Mockler & Ramirez-Ruiz (2021) Mockler, B., & Ramirez-Ruiz, E. 2021, ApJ, 906, 101
- Narayan et al. (2003) Narayan, R., Igumenshchev, I. V., & Abramowicz, M. A. 2003, PASJ, 55, L69
- Novikov & Thorne (1973) Novikov, I. D., & Thorne, K. S. 1973, in Black Holes (Les Astres Occlus), ed. C. Dewitt & B. S. Dewitt, 343
- Pfister et al. (2020) Pfister, H., Volonteri, M., Dai, J. L., & Colpi, M. 2020, MNRAS, 497, 2276
- Piran et al. (2015) Piran, T., Svirski, G., Krolik, J., Cheng, R. M., & Shiokawa, H. 2015, ApJ, 806, 164
- Ramirez-Ruiz & Rosswog (2009) Ramirez-Ruiz, E., & Rosswog, S. 2009, ApJ, 697, L77
- Rees (1988) Rees, M. J. 1988, Nature, 333, 523
- Rossi et al. (2021) Rossi, E. M., Stone, N. C., Law-Smith, J. A. P., et al. 2021, Space Sci. Rev., 217, 40
- Roth & Kasen (2018) Roth, N., & Kasen, D. 2018, ApJ, 855, 54
- Roth et al. (2016) Roth, N., Kasen, D., Guillochon, J., & Ramirez-Ruiz, E. 2016, ApJ, 827, 3
- Roth et al. (2020) Roth, N., Rossi, E. M., Krolik, J., et al. 2020, Space Sci. Rev., 216, 114
- Saxton et al. (2021) Saxton, R., Komossa, S., Auchettl, K., & Jonker, P. G. 2021, Space Sci. Rev., 217, 18
- Sazonov et al. (2021) Sazonov, S., Gilfanov, M., Medvedev, P., et al. 2021, MNRAS, 508, 3820
- Sa̧dowski & Narayan (2016) Sa̧dowski, A., & Narayan, R. 2016, MNRAS, 456, 3929
- Shakura & Sunyaev (1973) Shakura, N. I., & Sunyaev, R. A. 1973, A&A, 24, 337
- Stone & Metzger (2016) Stone, N. C., & Metzger, B. D. 2016, MNRAS, 455, 859
- Stone et al. (2020) Stone, N. C., Vasiliev, E., Kesden, M., et al. 2020, Space Sci. Rev., 216, 35
- Strubbe & Quataert (2009) Strubbe, L. E., & Quataert, E. 2009, MNRAS, 400, 2070
- Tchekhovskoy et al. (2011) Tchekhovskoy, A., Narayan, R., & McKinney, J. C. 2011, MNRAS, 418, L79
- Ulmer (1999) Ulmer, A. 1999, ApJ, 514, 180
- van Velzen et al. (2020) van Velzen, S., Holoien, T. W. S., Onori, F., Hung, T., & Arcavi, I. 2020, Space Sci. Rev., 216, 124
- van Velzen et al. (2019) van Velzen, S., Stone, N. C., Metzger, B. D., et al. 2019, ApJ, 878, 82
- Wevers et al. (2019) Wevers, T., Pasham, D. R., van Velzen, S., et al. 2019, MNRAS, 488, 4816
- Wong et al. (2022) Wong, T. H. T., Pfister, H., & Dai, L. 2022, ApJ, 927, L19
Appendix A Properties of simulated disks
A few more time-averaged quantities of the three simulated disks are listed in Table A.1. is the normalised magnetic flux at horizon (Tchekhovskoy et al., 2011), with being the condition for MAD disks. The net accretion efficiency evaluates how much rest-mass energy going into the black hole is converted to out-going energy near the event horizon. is the total power of the relativistic jet at , most of which is in the form of electromagnetic energy. is the maximum Lorentz factor of the jet. is the thermal+kinetic luminosity of the wind calculated at . is the effective -parameter of the disk as defined in McKinney et al. (2012). indicates the radius within which the disk inflow equilibrium has been established. In our simulations, the winds are launched mostly from the inner disk regions and have traveled beyond the photospheres at most inclination angles.
| Model | ||||||||
|---|---|---|---|---|---|---|---|---|
| M6a08-1 | 7 | 34.5 | 35.5 | 1.1 | 2.27 | 0.5 | 2.7 | 340 |
| M6a08-2 | 12 | 39 | 40.1 | 2.3 | 2.39 | 1.0 | 3.3 | 320 |
| M6a08-3 | 24 | 55 | 69.3 | 9.7 | 2.66 | 4.8 | 2.3 | 230 |
Appendix B Simulated spectra at higher luminosity
Appendix C List of observed TDEs reported in literature
For plotting Fig. 3-3 we use 16 optically-selected TDEs and 7 X-ray-selected TDEs. For completeness we list their names and relevant parameters as reported from pervious literature in Table C.1 and C.2.
| Name | log () | |||
| ASASSN-14ae | 5.42 | 43.87 | 4.29 | 4.34 |
| ASASSN-14li | 6.31 | 43.66 | 4.52 | 2.88 |
| ASASSN-15lh | 8.47 | 45.34 | 4.30 | 2.00 |
| ASASSN-15oi | 5.71 | 44.45 | 4.60 | 3.72 |
| AT2018dyb/ASASSN-18pg | 6.67 | 44.08 | 4.40 | 2.97 |
| AT2018hyz/ASASSN-18zj | 5.68 | 44.10 | 4.25 | 4.27 |
| GALEXD1-9 | 6.51 | 43.48 | 4.59 | 2.45 |
| GALEXD23H-1 | 6.39 | 43.95 | 4.70 | 2.59 |
| GALEXD3-13 | 7.36 | 43.98 | 4.66 | 1.71 |
| iPTF-15af | 6.88 | 44.10 | 4.85 | 1.87 |
| iPTF-16axa | 6.34 | 43.82 | 4.46 | 3.05 |
| PS1-10jh | 5.85 | 44.47 | 4.59 | 3.61 |
| PTF-09axc | 5.68 | 43.46 | 4.08 | 4.29 |
| PTF-09djl | 5.82 | 44.42 | 4.41 | 3.97 |
| PTF-09ge | 6.34 | 44.04 | 4.08 | 3.92 |
| SDSS-TDE1 | 7.24 | 43.64 | 4.42 | 2.14 |
| Name | log () | |||
| SDSSJ1323+48 | 6.15 | 44.30 | 5.91 | 0.80 |
| SDSSJ1201+30 | 7.18 | 45.00 | 6.06 | -0.29 |
| RXJ1624+75 | 7.68 | 43.38 | 6.05 | -1.57 |
| RXJ1420+53 | 7.33 | 43.38 | 5.67 | 0.03 |
| RBS1032 | 5.25 | 41.70 | 6.11 | -0.13 |
| 3XMMJ1521+07 | 5.61 | 43.51 | 6.30 | -0.02 |
| 3XMMJ1500+01 | 5.64 | 43.08 | 6.06 | 0.29 |
Appendix D Modeled TDE Parameters
| inc | log | log | log | log | log | log | ||||
| () | (∘) | (erg ) | (K) | (cm) | (erg ) | (K) | (cm) | |||
| 7 | 1 | 10 | 40.650 | 0.000 | 4.47 | 12.71 | 43.952 | 0.710 | 5.99 | 11.38 |
| 30 | 42.212 | 0.013 | 4.89 | 12.64 | 43.742 | 0.438 | 5.91 | 11.45 | ||
| 50 | 42.480 | 0.024 | 4.67 | 13.48 | 42.475 | 0.024 | 5.72 | 11.85 | ||
| 70 | 43.179 | 0.120 | 4.30 | 14.55 | 38.879 | 0.000 | 5.25 | 13.11 | ||
| 7 | 10 | 42.861 | 0.008 | 5.13 | 12.50 | 44.799 | 0.713 | 5.99 | 11.80 | |
| 30 | 43.434 | 0.031 | 5.04 | 12.95 | 44.587 | 0.438 | 5.91 | 11.87 | ||
| 50 | 43.691 | 0.056 | 4.85 | 13.72 | 43.407 | 0.029 | 5.74 | 12.29 | ||
| 70 | 43.175 | 0.017 | 4.30 | 14.55 | 41.422 | 0.000 | 5.35 | 13.55 | ||
| 12 | 1 | 10 | 40.989 | 0.001 | 4.55 | 12.73 | 43.914 | 0.651 | 5.98 | 11.38 |
| 30 | 42.503 | 0.025 | 4.74 | 13.09 | 43.334 | 0.171 | 5.78 | 11.61 | ||
| 50 | 42.684 | 0.038 | 4.54 | 13.84 | 41.451 | 0.002 | 5.57 | 12.05 | ||
| 70 | 43.508 | 0.255 | 4.38 | 14.57 | - | - | - | - | ||
| 12 | 10 | 43.364 | 0.015 | 5.13 | 12.75 | 44.994 | 0.652 | 5.99 | 11.91 | |
| 30 | 43.921 | 0.055 | 4.89 | 13.50 | 44.413 | 0.171 | 5.78 | 12.15 | ||
| 50 | 44.130 | 0.089 | 4.78 | 14.08 | 42.973 | 0.006 | 5.65 | 12.40 | ||
| 70 | 43.558 | 0.024 | 4.34 | 14.66 | - | - | - | - | ||
| 24 | 1 | 10 | 41.407 | 0.002 | 4.44 | 13.15 | 43.786 | 0.483 | 5.98 | 11.30 |
| 30 | 42.994 | 0.078 | 4.53 | 13.75 | 41.452 | 0.002 | 5.40 | 12.17 | ||
| 50 | 43.193 | 0.123 | 4.48 | 14.20 | - | - | - | - | ||
| 70 | 43.784 | 0.482 | 4.41 | 14.64 | - | - | - | - | ||
| 24 | 10 | 43.427 | 0.009 | 4.83 | 13.37 | 45.167 | 0.485 | 5.99 | 11.97 | |
| 30 | 44.790 | 0.204 | 4.77 | 14.18 | 42.977 | 0.003 | 5.43 | 12.80 | ||
| 50 | 44.401 | 0.083 | 4.76 | 14.26 | 43.026 | 0.004 | 5.50 | 13.22 | ||
| 70 | 44.444 | 0.092 | 4.67 | 14.46 | - | - | - | - |
Appendix E Characteristic Timescales
There are various physical timescales relevant fo TDEs: debris mass fallback timescale, disk formation/circularization timescale, disk viscous timescale, and photon transport timescale. The longest timescale of all governs the temporal evolution of TDE emissions.
The photon transport time through optically thick medium is the shorter one between the diffusion timescale and advection timescale. The photon diffusion timescale is calculated as , where is the size of the electron-scattering photosphere along a particular inclination, and is the electron-scattering optical depth integrated radially from to . The advection timescales is calculated as , since the photons trapped by the optically-thick gas has a similar speed as the gas. Here the gas radial velocity is averaged over the radial path within and weighted by gas density. The values for the disk are given in Table E.1. One can see that for the inclinations considered in this work, photons are preferably advected out by the optically-thick wind. The photon transport time varies from 0.1 day to a few days depending on the inclination.
The disk viscous timescale can be analytically calculated by , where is the orbital timescale of the disk, is a free parameter between 0 and approximately 1, and is the disk thickness (Shakura & Sunyaev, 1973). For our disk parameters, we have . The viscous time is therefore only a few days. We caution the readers that our simulated disks are MAD which typically have effective . The viscous time is potentially longer if the disks do not have such large magnetic fluxes.
The disk formation/circularization timescale induces uncertainty into the evolution of TDEs. Recent simulations show that a large fraction of the debris materials can form a disk within dynamical timescale but the disk still pocesses some moderate eccentricity (Bonnerot et al., 2021). As the topic is out of the scope of this paper, we assume here that the disk forms quickly for the calculation of the emission evolution.
Stellar debris typically falls back on timescales of , which is the orbital time of the most bound debris (Evans & Kochanek, 1989; Guillochon & Ramirez-Ruiz, 2013; Rossi et al., 2021):
| (E1) |
For our case with , varies between 25 days and 41 days for .
Lastly, assuming that the fallback timescale governs the evolution of TDEs, we calculate the time corresponding to each simulated disk with a further assumption that the fallback rate equals the instataneous accretion rate plus the wind mass rate . Here we focus on the post-peak evolution. By setting that the fallback rate peaks at , the post-peak time associated with a particular can be calculated with:
| (E2) |
With the wind mass rate given in Table 1, the three simulated disks correspond to . The post-peak time obtained with and a few different are shown in Table E.2.
| inclination (∘) | 10 | 30 | 50 | 70 |
| 896 | 1278 | 5425 | 8377 | |
| 7.0 | 74.0 | 137.2 | 710.2 | |
| 0.50 | 0.35 | 0.13 | 0.013 | |
| (day) | 0.07 | 0.13 | 1.06 | 13.6 |
| (day) | 0.35 | 5.4 | 42.2 | 337.4 |
| () | 0.2 | 0.5 | 1 | 1.5 |
| 36.7 | 76.4 | 133.0 | 211.6 | |
| (day) | NA | 18.6 | 45.9 | 69.7 |
| (day) | 18.3 | 53.8 | 102.4 | 140.0 |
| (day) | 42.3 | 98.5 | 174.0 | 229.2 |