Mixed Graph Contrastive Network for Semi-Supervised Node Classification
Abstract.
Graph Neural Networks (GNNs) have achieved promising performance in semi-supervised node classification in recent years. However, the problem of insufficient supervision, together with representation collapse, largely limits the performance of the GNNs in this field. To alleviate the collapse of node representations in semi-supervised scenario, we propose a novel graph contrastive learning method, termed Mixed Graph Contrastive Network (MGCN). In our method, we improve the discriminative capability of the latent feature by enlarging the margin of decision boundaries and improving the cross-view consistency of the latent representation. Specifically, we first adopt an interpolation-based strategy to conduct data augmentation in the latent space and then force the prediction model to change linearly between samples. Second, we enable the learned network to tell apart samples across two interpolation-perturbed views through forcing the correlation matrix across views to approximate an identity matrix. By combining the two settings, we extract rich supervision information from both the abundant unlabeled nodes and the rare yet valuable labeled nodes for discriminative representation learning. Extensive experimental results on six datasets demonstrate the effectiveness and the generality of MGCN compared to the existing state-of-the-art methods.
1. INTRODUCTION
In recent years, with the strong representation learning capacity, graph learning methods have become a hot research spot in many fields of multimedia, including the recommendation system (Liu et al., 2021a), 3D estimation (Hu et al., 2021; He et al., 2021), multi-modal dialog system (Zhang et al., 2021), and so on. Semi-supervised node classification, which aims to classify nodes in the graph with limited labels, is a crucial yet challenging graph learning task. Thanks to the powerful feature extraction capability, Graph Convolutional Network (GCN) (Kipf and Welling, 2016) has recently achieved promising performance in this scenario. As a result, it has attracted considerable attention in this field, and many methods (Veličković et al., 2017; Klicpera et al., 2018; Xu et al., 2018; Chien et al., 2020) have been proposed.
(a) GCN
(c) MVGRL
(b) MixupForGraph
(d) Ours
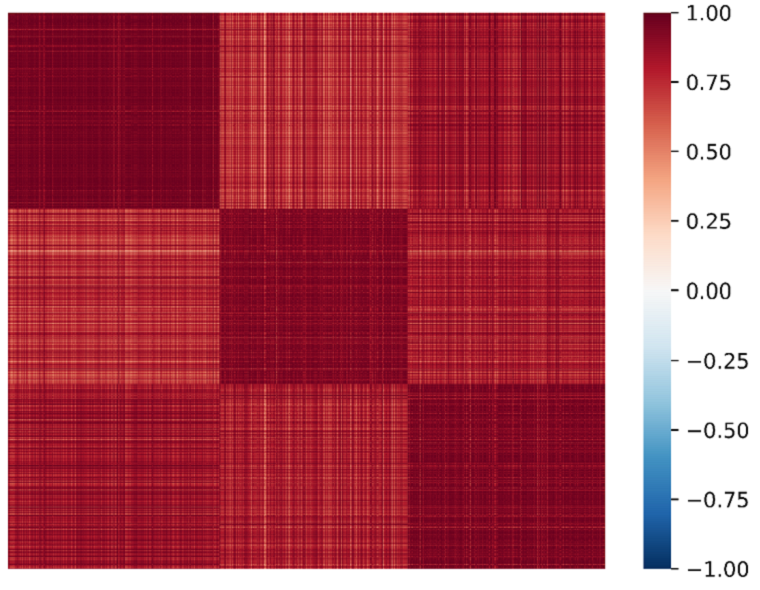
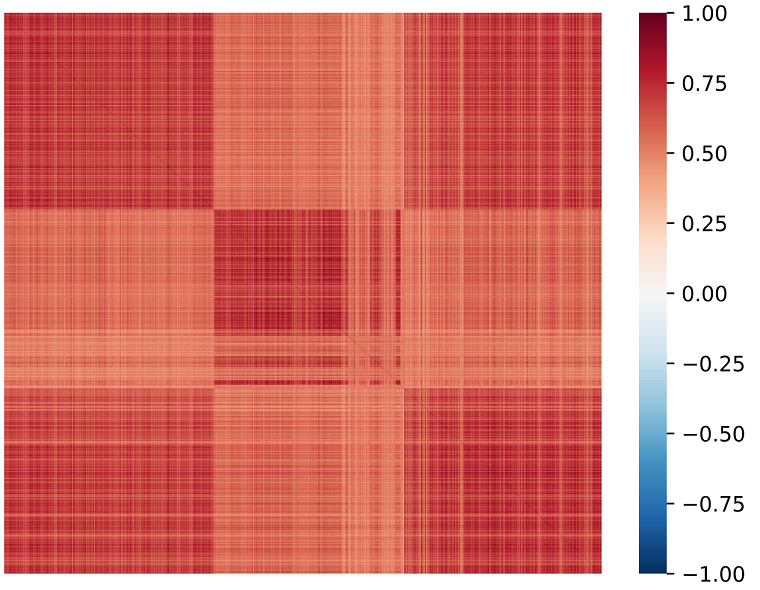
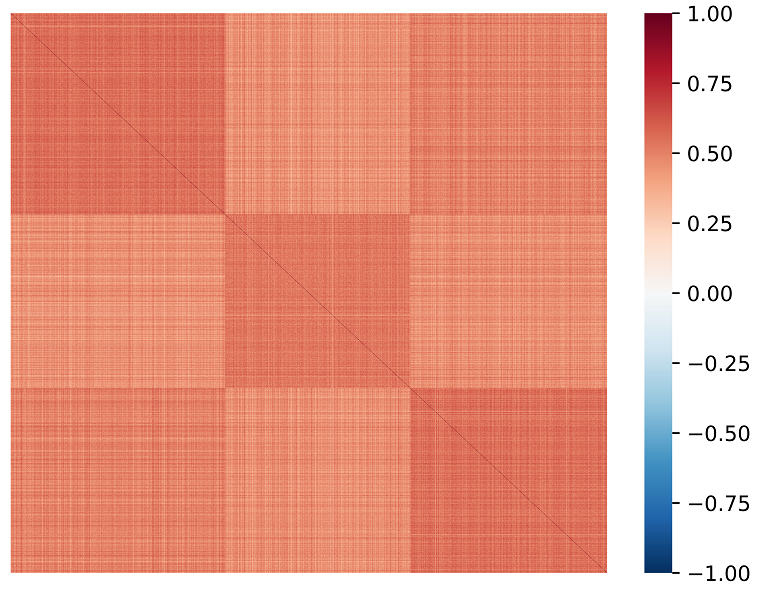
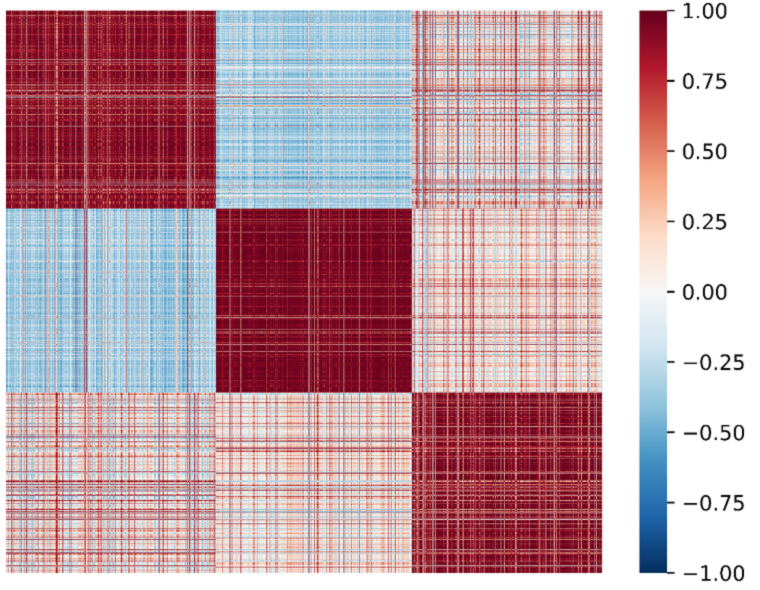
Although preferable performances have been achieved by the existing algorithms, in the semi-supervised node classification task, insufficient supervision has largely aggravated the problem of representation collapse in graph learning, leading to indiscriminative representation across classes. To solve the problem, a commonly used strategy is to path the supervision information from the labeled data to the unlabeled data according to the linkages within the adjacent matrix as guidance for network training (Kipf and Welling, 2016; Veličković et al., 2017; Xu et al., 2018; Hamilton et al., 2017). Moreover, in MixupForGraph (Wang et al., 2021), a graph mixup operation is designed to enhance the robustness and discriminative capability of the aggregated sample embedding over the labeled samples. Since the embedding of the labeled samples has integrated information of both the labeled sample and its unlabeled neighbors while pushing the predictions to their corresponding ground truth, the information of the unlabeled samples are also integrated for network training in a form of implicit regularization. Though valuable information is introduced, the performance of these methods could be significantly influenced by the inaccurate connections within the data. Recently, to alleviate the adverse influence of the inaccurate connections, MVGRL(Hassani and Khasahmadi, 2020) introduces contrastive learning as an auxiliary task for discriminative information exploitation. In this method, the authors design an InfoMax loss to maximize the cross-view mutual information between the node and the global summary of the graph. Although large improvement has been made, the current data augmentation and loss function setting of MVGRL fails to exploit abundant intuitive information within the unlabeled data thus limiting its classification performance. This phenomenon can be witnessed in the cosine similarity matrix of latent representation illustration in Fig. 1. As we can see, although the categorical information is revealed by the learned representations to different extent, more discriminative information is needed for further performance enhancement.
To solve this issue, we propose a novel graph contrastive semi-supervised learning method termed Interpolation-based Correlation Reduction Network (MGCN), which improves the discriminative capability of node embedding by enlarging the margin of decision boundaries and improving the cross-view consistency of the latent representation among samples. To be specific, we first adopt an interpolation-based strategy to conduct data augmentation in the latent space and then force the prediction model to change linearly between samples as done in the field of image recognition (Verma et al., 2019a). After that, by forcing the correlation matrix across two interpolation-perturbed views to approximate an identical matrix, we guide our network to be able to recognize whether two perturbed samples are the same samples or not. In this manner, the sample representations would be more discriminative, thus alleviating the collapsed representations. This could be clearly seen in Fig. 1 (d) that the similarity matrix generated by our method can obviously reveal the hidden distribution structure better than the compared methods. The key contributions of this paper are listed as follows:
-
•
We proposed a novel graph contrastive learning method to solve the representation collapse issue in the field of semi-supervised node classification.
-
•
An interpolation-based strategy is adopted to force the prediction model to change linearly between samples to enlarge the decision boundaries margin.
-
•
To further improve discriminative capability of representations, we design a correlation reduction mechanism to enable our network to tell apart the same sample against different samples across two interpolation-perturbed views.
-
•
Extensive experimental results on six datasets demonstrate the superiority of our method against the compared state-of-the-art method. The ablation study and module transferring experiments demonstrate the effectiveness and the generality of our proposed modules.
2. RELATED WORK
2.1. Semi-supervised Node Classification
Semi-supervised node classification (Zhu, 2005; Wu et al., 2020; Zhou et al., 2020) aims to classify nodes in the graph with few human annotations. Recently, Graph Neural Networks (GNNS) have achieved promising performance for their strong representation capability of graph-structured data. The pioneer GCN-Cheby (Defferrard et al., 2016) generalizes CNN (LeCun et al., 1998) to graphs in the spectral domain by proposing the Chebyshev polynomials graph filter. Following GCN-Chey, GCN (Kipf and Welling, 2016) reveals the underlying graph structure by feature transformation and aggregation operations in the spatial domain. After that, GraphSage (Hamilton et al., 2017) generates embeddings by sampling and aggregating features from the node neighborhoods. GAT(Veličković et al., 2017) proposed graph attention networks on graph-structured data to improve the performance. JK-Net(Xu et al., 2018) flexibly leverages different neighborhood ranges to enable better structure-aware representation. In addition, SGC(Wu et al., 2019) simplifies GCN by removing feature transformation between consecutive layers. Furthermore, Geom-GCN(Pei et al., 2020) proposes a geometric aggregation scheme to overcome the issue of neighborhood node structural information loss. Different from them, PPNP/APPNP (Klicpera et al., 2018) separates the feature transformation from aggregation operation and enhances the aggregation operation with PageRank (Page et al., 1999). More recently, following PPNP/APPNP, GPRGNN(Chien et al., 2020) jointly optimizes sample feature and topological information by learning the aggregation weights adaptively.
In our proposed method, we adopt GPRGNN (Chien et al., 2020) as our backbone and further improve its discriminative capability by enlarging the margin of decision boundaries and improving the cross-view consistency of the latent representation.
2.2. Representation Collapse
Contrastive learning methods (Hjelm et al., 2018; Chen et al., 2020; Grill et al., 2020; Zbontar et al., 2021; Liu et al., 2022b) have achieved promising performance on images in recent years. Motivated by their success, contrastive learning strategies have been increasingly adopted to the graph data (Velickovic et al., [n.d.]; Hassani and Khasahmadi, 2020; Thakoor et al., 2021; You et al., 2020; Zhu et al., 2020; Bielak et al., 2021).
The pioneer DGI (Velickovic et al., [n.d.]) is proposed to learn node embedding by maximizing the mutual information between the local and global fields of the graph. GMI(Peng et al., 2020) and HDMI(Jing et al., 2021) improve DGI by regarding edges and node attributes, respectively, to alleviate collapse representation. Besides, MVGRL (Hassani and Khasahmadi, 2020) and InfoGraph (Sun et al., 2019) demonstrate the effectiveness of maximizing the mutual information to learn graph-level representations in the graph classification task. Subsequently, GraphCL (You et al., 2020) and GRACE (Zhu et al., 2020) first generate two augmented views and then learn node embeddings by pulling together the same node in two augmented views while pushing away different nodes. However, representation collapse is a common problem that, without the adequate guidance of human annotations, the model tends to embed all samples to the same representation (Liu et al., 2021b).
In order to alleviate representation collapse, BGRL (Thakoor et al., 2021) is proposed to learn node embeddings by two separate GCN encoders. Specifically, the online encoder is trained to pull together the same node from two views while the target encoder is updated by an exponential moving average of online encoder. More recently, G-BT (Bielak et al., 2021) is proposed to avoid representation collapse by reducing the redundancy of features. MGCN implicitly achieves the redundancy-reduction principle through an interpolation-based correlation reduction mechanism in the sample level, described in section 3.3 to solve the representation collapse issue in the semi-supervised node classification task.
2.3. Interpolation-based Augmentation
Mixup(Zhang et al., 2017; Verma et al., 2019b) is an effective data augmentation strategy for image classification (Lucas et al., 2018; Hendrycks et al., 2019; Guo, 2020; Guo et al., 2019; Yang et al., 2022). It generates synthetic samples by linearly interpolating random image pairs and their labels as follows:
| (1) | ||||
where and are the hyper-parameters of Beta distribution. Besides, denotes the interpolation rate. Actually, Mixup incorporates the prior knowledge that interpolations of input samples should lead to interpolations of the associated targets (Zhang et al., 2017). In this manner, it extends the training distribution by constructing virtual training samples across all classes, thus improving the image classification performance (Verma et al., 2019b, a).
However, it is challenging to extend Mixup methods to the graph data, which contains many irregular connections. To solve this problem, GraphMixup (Wu et al., 2021) designs feature and edge Mixup mechanisms to improve the performance of class-imbalanced node classification. Besides, MixupForGraph (Wang et al., 2021) proposed the two-branch graph convolution to mix the receptive field sub-graphs for the paired nodes. Different from the previous methods, we propose a simple interpolation fashion. Specially, we interpolate the embeddings and associated labels directly.

3. METHODOLOGY
In this section, we proposed a novel graph contrastive learning method, termed Interpolation-based Correlation Reduction Network (MGCN), to improve the latent feature’s discriminative capability and alleviate the collapsed representation. As shown in Fig.2, our proposed method mainly contains two modules, i.e., the Mixed Graph Module and correlation reduction module. In the following subsections, we first define the main notations and the problem. Then we detail the two main modules and loss function of MGCN.
| Notations | Meaning | ||||
|---|---|---|---|---|---|
| The Attribute Matrix | |||||
| The Adjacency Matrix | |||||
| The Degree Matrix | |||||
| The Identity Matrix | |||||
| The Node Embeddings | |||||
| The Cross-view Sample Correlation Matrix | |||||
| The Prediction Distribution | |||||
| The Label Distrbution |
3.1. Notations and Problem Definition
To an undirected graph with classes of nodes, the node set and the edge set are denoted as and , respectively. The graph contains an attribute matrix and an adjacency matrix , where if , otherwise . The degree matrix is denoted as and . The normalized adjacency matrix could be calculated through calculating , where is an identity matrix. Besides, denotes the -norm. In this paper, our target is to embed the nodes into the latent space and classify them in a semi-supervised manner. The notations are summarized in Table 1.
3.2. Mixed Graph Module
Recent works (Zhang et al., 2017; Verma et al., 2019a) demonstrate that Mixup is an effective data augmentation for images to improve the discriminative capability of samples by achieving larger margin-decision boundaries. Different from images, the nodes in the graph are irregularly connected. Thus, the interpolation for the graph data is still an open question (Wang et al., 2021; Wu et al., 2021).
To overcome this issue, we propose a simple yet effective interpolation method on graph data as shown in the orange box in Fig.2. Specifically, we first encode the nodes into the latent space through Eq. (2).
| (2) |
Here, denotes the encoder of our feature extraction framework. In our paper, we take the encoder of GPRGNN (Chien et al., 2020), which learns node embeddings from node features and topological information for sample embedding.
Subsequently, we adopt a simple linear interpolation function to mix the node embeddings as formulated:
| (3) |
where denotes the -th view of the node embedding and is the interpolation rate. is the shuffle function that randomly permutes the input of the function and output the same samples with a new order. As , the interpolation function could be regarded as an operation that introduces perturbation to the principal embedding H. Similar to Eq. (3), the interpolated labels can be formulated as:
| (4) |
In this manner, we construct two perturbations as two different views of the principle sample batch in the latent space by mixing the node embeddings and the corresponding labels. Subsequently, we enhance the discriminative capability of the network by forcing the prediction model to change linearly between samples through the classification loss:
| (5) |
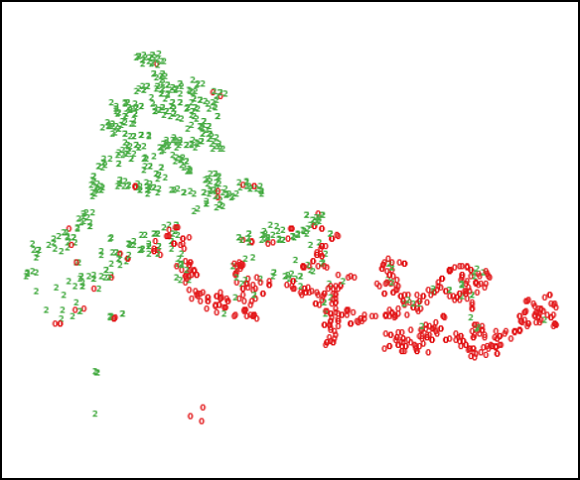
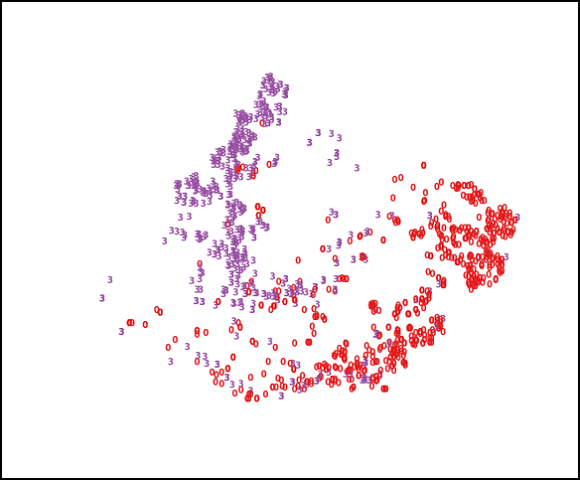
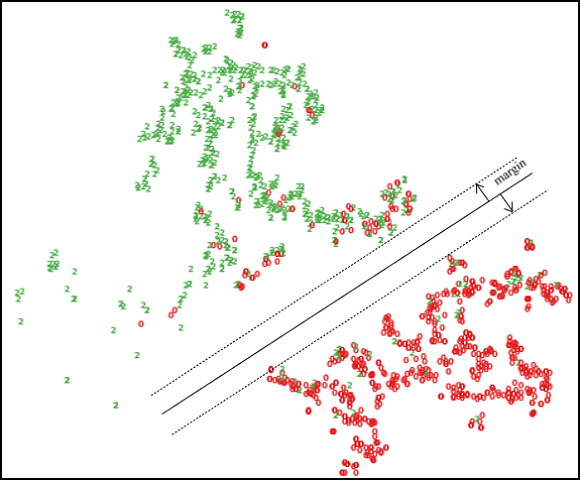
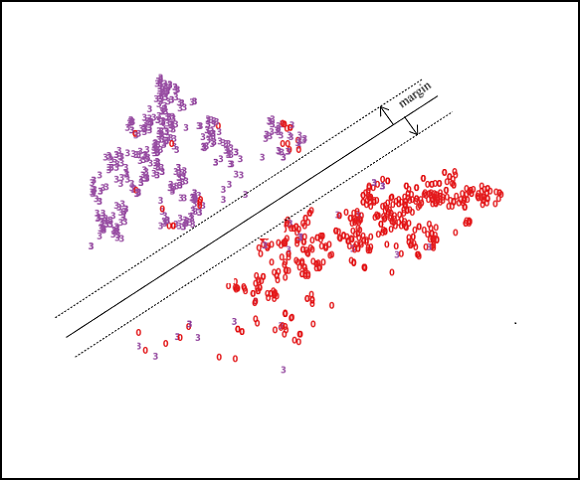
where denotes the Cross-Entropy loss (Murphy, 2012) and is the prediction of training data. According to (Zhang et al., 2017; Verma et al., 2019a), in image classification applications, the decision boundaries are pushed far away from the class boundaries by enabling the network to recognize the interpolation operation. Through minimizing in our paper, we can also acquire the larger-margin decision boundaries shown in Fig.5, thus alleviating the representation collapse problem.
3.3. Correlation Reduction Module
To further improve the discriminative capability of samples, we improve the cross-view consistency of the latent representation. Following this idea, as shown in the red box in Fig. 2, we propose a correlation reduction module, which pulls together the same samples while pushing away different samples from two interpolation-perturbed views. In this way, our network is encouraged to learn more discriminative embeddings, thus avoiding the representation collapse problem.
Concretely, the process of correlation reduction is divided into three steps. First, we utilize the proposed Mixed Graph Module to construct two interpolation-perturbed views of node embeddings, i.e., and in Fig. 2.
Second, the correlation matrix across two interpolation-perturbed views is calculated as:
| (6) |
where is the cosine similarity between -th node embedding of the first view and -th node embedding of the second view .
Furthermore, we force the correlation matrix Z to be equal to an identity matrix by minimizing the information correlation reduction loss, which could be presented as:
| (7) | ||||
In detail, the first term in Eq. (7) forces the diagonal elements of Z to 1, which indicates that the embeddings of each node are forced to agree with each other in two views. Besides, the second term in Eq. (7) makes the off-diagonal elements of Z to approach 0 so as to push away different nodes across two views.
Input: An undirected graph ; Iteration number ; Hyper-parameters , .
Output: Class prediction and the trained network .
By this decorrelation operation, we enlarge the distance between different samples in the latent space while preserving the view-invariance latent feature of each sample, thus keeping cross-view consistent of latent representation. Consequently, our network is guided to learn more discriminative features about input samples and further avoid the collapsed representation.
3.4. Loss Function
The proposed method MGCN jointly optimizes two losses: the classification loss and the information correlation reduction loss . In summary, the objective of MGCN is formulated as:
| (8) |
where is a trade-off hyper-parameter. The detailed learning procedure of MGCN is illustrated in Algorithm 1.
4. EXPERIMENT
4.1. Datasets & Metric
To verify the effectiveness of our proposed method, extensive experiments have been conducted on six benchmark datasets, including DBLP, ACM, AMAP, AMAC, CITESEER, and CORA (Shchur et al., 2018; Liu et al., 2022a). Detailed dataset statistics are summarized in Table 2. The detail descriptions are summarized as follows:
-
•
DBLP (Bo et al., 2020): This author network contains authors from four areas including information retrieval, machine learning, data mining, and database. The edge is constructed between two authors if they are the co-author relationship. The features of the authors are the bag-of-words of keywords.
-
•
ACM (Bo et al., 2020): It is a network of papers. An edge will be constructed between two papers if they are written by the same author. The features of the papers are the bag-of-words of the keywords. The papers published in MobiCOMM, SIGCOMM, SIGMOD, KDD are selected and divided into three classes, including data mining, wireless communication, and database.
-
•
AMAP (Tu et al., 2021): This is a co-purchase graph from Amazon. The nodes in the graph denote the products, and the features are the reviews encoded by the bag-of-words. The edges indicate whether two products are frequently co-purchased or not. The nodes are divided into eight classes.
-
•
AMAC (Tu et al., 2021): AMAC is extracted from Amazon co-purchase graph, where nodes represent products, edges represent whether two products are frequently co-purchased or not, features represent product reviews encoded by bag-of-words, and labels are predefined product categories.
-
•
CITESEER (Tu et al., 2021): It consists of 3327 scientific publications classified into one of six classes. The citation network consists of 4732 links. Each publication in the dataset is described by a 0/1-valued word vector indicating the absence or presence of the corresponding word from the dictionary. The dictionary consists of 3703 unique words.
-
•
CORA (Tu et al., 2021): The Cora dataset consists of 2708 scientific publications classified into one of seven classes. The citation network consists of 5429 links. Each publication in the dataset is described by a 0/1-valued word vector indicating the absence/presence of the corresponding word from the dictionary. The dictionary consists of 1433 unique words.
For fairness, we follow GPRGNN (Chien et al., 2020) and adopt the sparse splitting (2.5% / 2.5% / 95% for train / validation / test) in the origin literature for all datasets. The classification performance is evaluated by the wide-used accuracy metric.
| Dataset | Sample | Dimension | Edges | Classes |
|---|---|---|---|---|
| DBLP | 4057 | 334 | 7056 | 4 |
| ACM | 3025 | 1870 | 26256 | 3 |
| AMAP | 7650 | 745 | 287326 | 8 |
| AMAC | 13752 | 767 | 491722 | 10 |
| CITESEER | 3327 | 3703 | 4732 | 6 |
| CORA | 2708 | 1433 | 5429 | 7 |
| Method | DBLP | ACM | AMAP | AMAC | CITESEER | CORA | ||||||||||||||
|---|---|---|---|---|---|---|---|---|---|---|---|---|---|---|---|---|---|---|---|---|
| GCN-Cheby | (Defferrard et al., 2016) | 60.48±0.00 | 79.98±3.07 | 90.09±0.28 | 82.41±0.28 | 65.67±0.38 | 71.39±0.51 | |||||||||||||
| GCN | (Kipf and Welling, 2016) | 67.64±0.38 | 84.95±0.21 | 90.54±0.21 | 82.52±0.32 | 67.30±0.35 | 75.21±0.38 | |||||||||||||
| GraphSage | (Hamilton et al., 2017) | 29.49±0.03 | 37.65±0.01 | 90.51±0.25 | 83.11±0.23 | 61.52±0.44 | 70.89±0.54 | |||||||||||||
| APPNP | (Klicpera et al., 2018) | 67.75±0.44 | 74.61±0.67 | 91.11±0.26 | 81.99±0.26 | 68.59±0.30 | 79.41±0.38 | |||||||||||||
| JK-Net | (Xu et al., 2018) | 64.51±0.53 | 81.20±0.11 | 87.70±0.70 | 77.80±0.97 | 60.85±0.76 | 73.22±0.64 | |||||||||||||
| GAT | (Veličković et al., 2017) | 68.58±0.42 | 83.88±0.35 | 90.09±0.27 | 81.95±0.38 | 67.20±0.46 | 76.70±0.42 | |||||||||||||
| SGC | (Wu et al., 2019) | 53.66±2.15 | 72.99±2.96 | 83.80±0.46 | 76.27±0.36 | 58.89±0.47 | 70.81±0.67 | |||||||||||||
| GPRGNN | (Chien et al., 2020) | 67.84±0.30 | 80.93±2.26 | 91.93±0.26 | 82.90±0.37 | 67.63±0.38 | 79.51±0.36 | |||||||||||||
| MixupForGraph | (Wang et al., 2021) | 68.51±0.78 | 86.24±0.62 | 89.87±0.10 | 77.30±2.10 | 57.41±0.33 | 67.11±0.63 | |||||||||||||
| DGI | (Velickovic et al., [n.d.]) | 68.90±1.34 | 81.26±1.48 | 83.10±0.50 | 75.90±0.60 | 65.43±2.94 | 73.74±1.43 | |||||||||||||
| GCA | (Zhu et al., 2021) | 20.82±1.94 | 19.10±1.73 | 89.98±1.28 | 81.86±1.80 | 56.39±3.94 | 74.49±3.70 | |||||||||||||
| GRACE | (Zhu et al., 2020) | 68.88±0.04 | 85.93±0.56 | 90.60±0.03 | 72.76±0.02 | 66.54±0.01 | 78.62±0.62 | |||||||||||||
| MVGRL | (Hassani and Khasahmadi, 2020) | 67.89±0.34 | 83.78±0.27 | 79.37±0.03 | 70.22±0.02 | 67.98±0.05 | 78.06±0.07 | |||||||||||||
| MGCN | Ours | 70.60±0.76 | 87.88±0.54 | 92.64±0.24 | 83.99±0.90 | 69.18±0.43 | 80.89±0.95 | |||||||||||||
4.2. Experiment Setup
All experiments are implemented with one NVIDIA 1080Ti GPU on PyTorch platform. To alleviate the influence of randomness, we run each method for 10 times and report the mean values with standard deviations. Besides, to all methods, we train them for 1000 epochs until convergence. For ACM and DBLP datasets, we adopt the code of compared methods and reproduce the results. For the performance of baselines on other datasets, we reported the corresponding values from GPRGNN (Chien et al., 2020) directly. In our proposed method, we adopt GPRGNN as our feature extraction backbone network, and our network is trained with the Adam optimizer (Kingma and Ba, 2014). Besides, the learning rate is set to 1e-3 for CITESEER, 5e-2 for DBLP, 2e-2 for CORA and AMAC, 1e-2 for ACM and AMAP, respectively. The interpolation rate and the trade-off hyper-parameter are set to 0.9 and 0.5, respectively.
4.3. Performance Comparison
To demonstrate the superiority of our method, we conduct performance comparison experiments for our proposed MGCN and 9 baselines. Specially, classical GCN-base methods (Defferrard et al., 2016; Kipf and Welling, 2016; Hamilton et al., 2017; Xu et al., 2018; Veličković et al., 2017; Wu et al., 2019; Chien et al., 2020; Klicpera et al., 2018) path the supervision information from the labeled data to the unlabeled data according to the linkages within the adjacent matrix as guidance for network training. Besides, the Mixup-enhanced method (Wang et al., 2021) improves the robustness and discriminative capability of the aggregated sample embedding over the labeled samples. Moreover, we report the results of the contrastive methods (Velickovic et al., [n.d.]; Zhu et al., 2021, 2020; Hassani and Khasahmadi, 2020), which design auxiliary tasks for discriminative information exploitation.
From these results in Table 3, we observe and analyze as follows. 1) It could be observed that the classical GCN-based methods are not comparable with our proposed MGCN. For example, on CORA dataset, MGCN exceeds GCN (Kipf and Welling, 2016) by 5.68%. This is because these methods would suffer from the representation collapse problem caused by the inaccurate connections within data in the adjacency matrix. 2) Compared with the Mixup-enhance method MixupForGraph (Wang et al., 2021), MGCN achieves better classification performance. The reason is that MixupForGraph does not consider the contrastive learning method to improve the discriminative capacity in the semi-supervised node classification task. 3) Moreover, our MGCN consistently outperforms other contrastive learning methods including DGI(Velickovic et al., [n.d.]), GCA(Zhu et al., 2021), GRACE(Zhu et al., 2020) and, MVGRL(Hassani and Khasahmadi, 2020)). We conjecture that those methods fail to exploit abundant intuitive information within the unlabeled data, thus achieving sub-optimal performance.
Different from them, our method aims to alleviate collapsed representations by improving the discriminative capability of the latent space from two aspects. Firstly, we proposed a Mixed Graph Module to force the prediction model to change linearly between samples, thus enlarging the margin of decision boundaries. Besides, the proposed correlation reduction mechanism further improves the discriminative capability of the features by keeping the cross-view consistency of the latent representations. Consequently, the proposed MGCN alleviates collapsed representations and achieves the top-level performance on six datasets.
CORA
CITESEER
AMAC

AMAP
ACM
DBLP

(a) The trade-off hyper-parameter
(b) The interpolation rate
4.4. Transferring Modules to Other Methods
To further investigate the effectiveness and the generality of our proposed modules, we transfer the Mixed Graph Module and correlation reduction module to five baselines including GCN-Cheby (Defferrard et al., 2016), GCN (Kipf and Welling, 2016), APPNP(Klicpera et al., 2018), JK-Net (Xu et al., 2018), GAT (Veličković et al., 2017). Table 4 reports the performance of the five methods with their variants on DBLP, ACM, CITESEER, and CORA dataset. Here, we denotes the baseline and the baseline with the two proposed modules as B and B-O, respectively.
From these results, we observed that, enhanced by our proposed modules, the baselines significantly achieve better performance. Specifically, our modules improve the classification accuracy of GCN by 4.79% on DBLP, 0.82% on ACM, 1.23% on CITESEER, 2.49% on CORA, respectively. The reason is that the two proposed modules enhance the discriminative capability of samples by enlarging the margin of decision boundaries and improving the cross-view consistency of the node representations. In this manner, the baselines alleviate the collapsed representation, thus achieving better classification performance.
| Dataset | GCN-Cheby | GCN | APPNP | JKNet | GAT | |||||
|---|---|---|---|---|---|---|---|---|---|---|
| B | B-O | B | B-O | B | B-O | B | B-O | B | B-O | |
| DBLP | 60.48±0 | 63.52±1.46 | 67.64±0.38 | 72.43±0.62 | 67.84±0.30 | 68.50±0.78 | 64.51±0.53 | 66.97±0.49 | 68.58±0.42 | 69.00±1.84 |
| ACM | 79.98±3.07 | 83.02±1.03 | 84.95±0.21 | 85.77±1.33 | 74.61±0.67 | 83.71±1.78 | 81.20±0.11 | 85.53±1.22 | 83.88±0.35 | 83.18±2.93 |
| CITESEER | 65.67±0.38 | 66.52±0.65 | 67.30±0.35 | 68.53±0.59 | 68.59±0.30 | 70.12±0.97 | 60.85±0.76 | 64.88±1.00 | 67.20±0.46 | 68.54±0.38 |
| CORA | 71.39±0.51 | 72.95±1.06 | 75.21±0.38 | 77.70±0.44 | 79.41±0.38 | 79.53±0.37 | 73.22±0.64 | 75.45±1.69 | 76.70±0.42 | 77.25±3.25 |
ChebNet
GCN
JKNet
MixupForGraph
MVGRL
GPRGNN
Ours
4.5. Ablation Studies
In this section, we first conduct ablation studies to verify the effectiveness of the proposed modules ,and than we analyze the robustness of MGCN to the hyper-parameters.
4.5.1. Effectiveness of the Proposed Modules
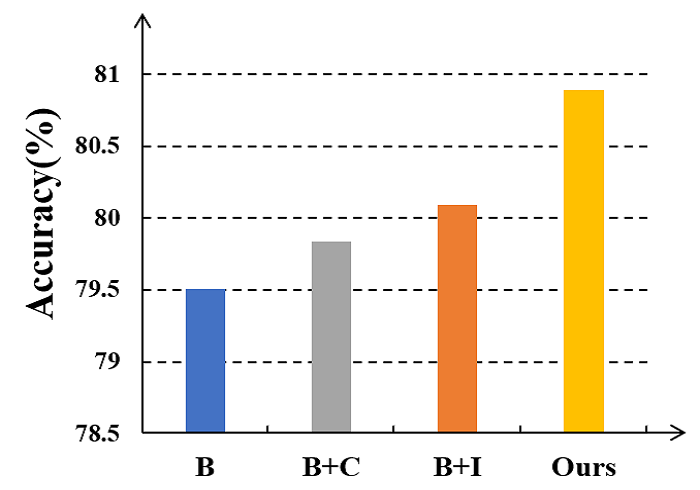
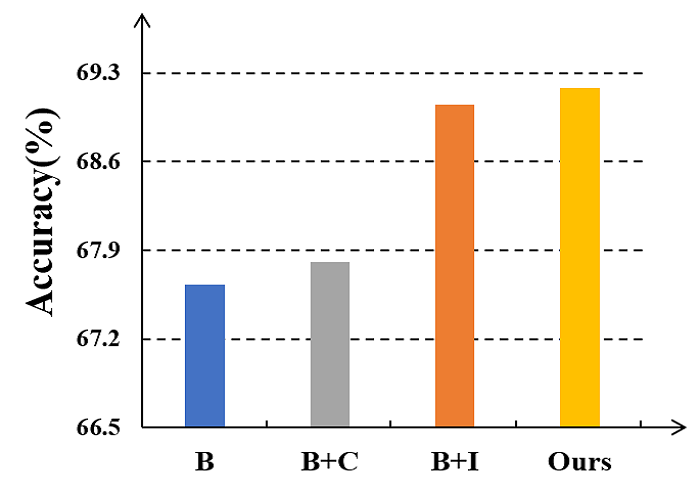
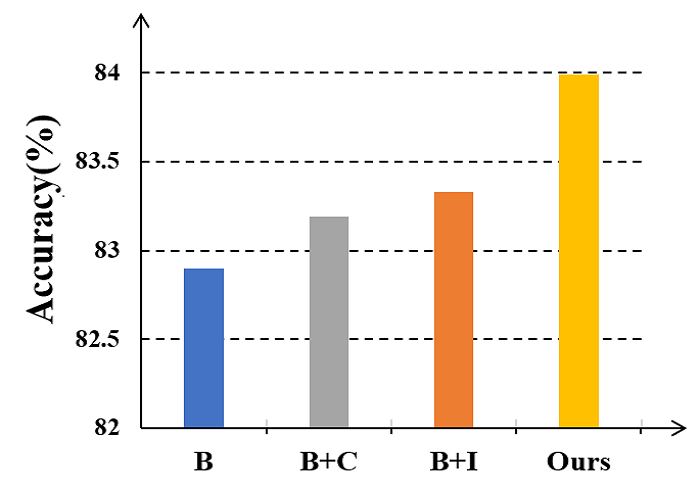
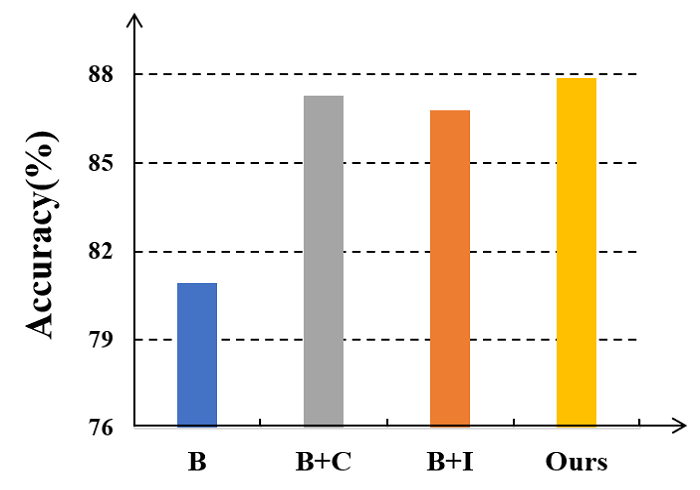
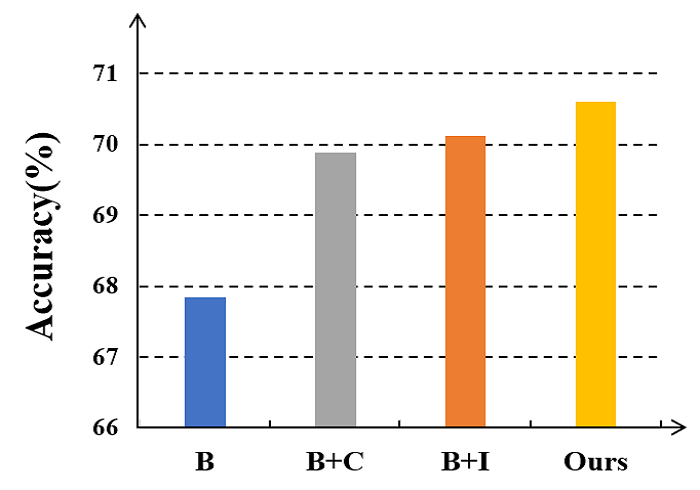
To investigate the effectiveness of the proposed Mixed Graph Module and correlation reduction module, extensive ablation studies are conducted in Fig. 3. Here, we adopt GPNGNN(Chien et al., 2020) as “Baseline”. Besides, “B”, “B+I”, “B+C” and “Ours” denote the baseline, the baseline with Mixed Graph Module, correlation reduction module and both, respectively. From these results, we have observed as follows. 1) Compared with “Baseline”, “B+I” has about 1.81% performance improvement on average of six datasets since the proposed Mixed Graph Module enlarges the margin of decision boundaries by forcing the prediction model to change linearly between samples. 2) Benefited from the correlation reduction module, the classification performance is improved. Taking the result on DBLP dataset for example, “B+C” exceeds “Baseline” by 2.05%. This demonstrates that the correlation reduction module improves the discriminative capability of samples by keeping the cross-view consistency of the latent representations. 3) Moreover, better performance of “Ours” indicates that both proposed modules are effective to guide the network to learn more discriminative latent features.
4.5.2. Hyper-parameter Analysis
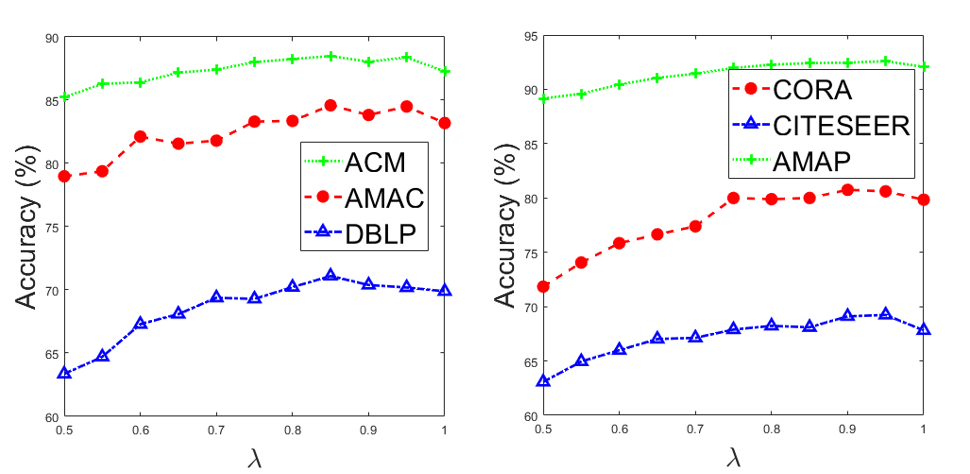
Furthermore, we investigate the robustness of our proposed method to the hyper-parameters on six datasets. Specifically, to the trade-off hyper-parameter , we conduct ablation studies as shown in Fig. 4 (a). From these results, we observe that the classification accuracy will not fluctuate greatly when increasing. This demonstrates that our model MGCN is insensitive to the variation of the hyper-parameter . Besides, the accuracy of semi-supervised node classification with different values of the interpolation rate are illustrated in Fig. 4 (b). It’s observed that the performance of MGCN is decreased when is about less than 0.9 since controls the perturbation to the principal embedding H. It is worth mentioning that is set as 0.9 in all experiments.
GCN
GPRGNN
Ours
4.6. Visualization Experiment
4.6.1. -SNE Visualization of Classification Results
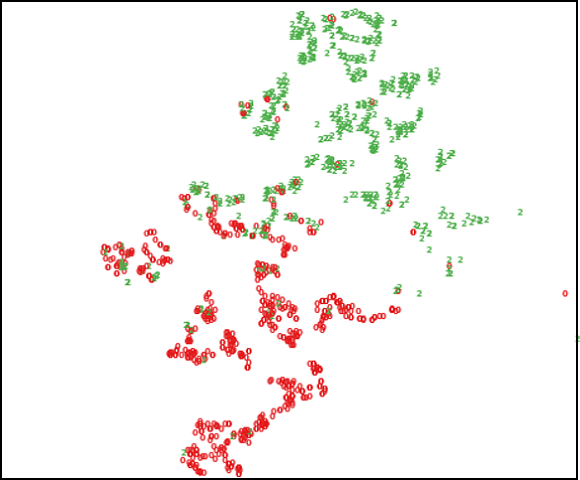
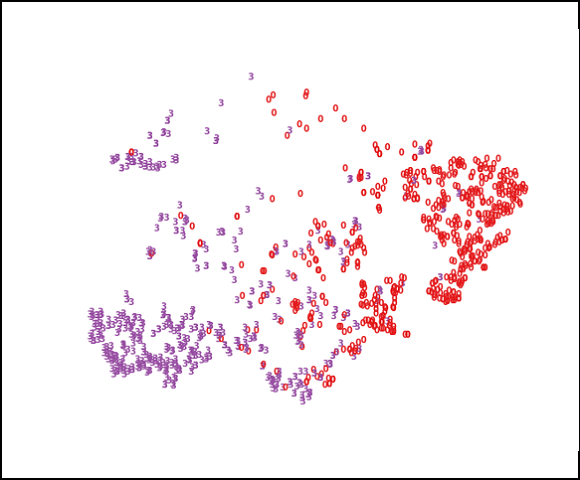
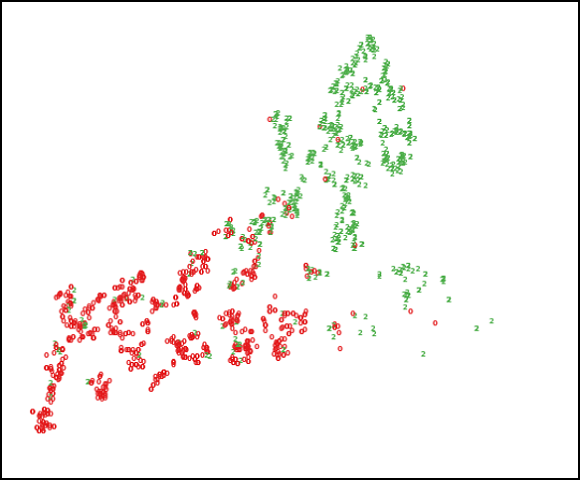
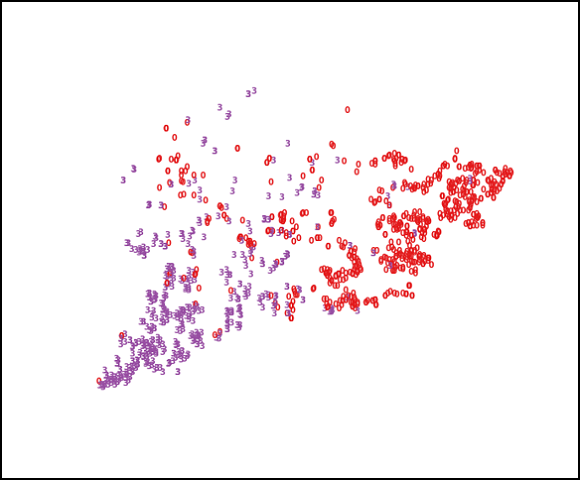
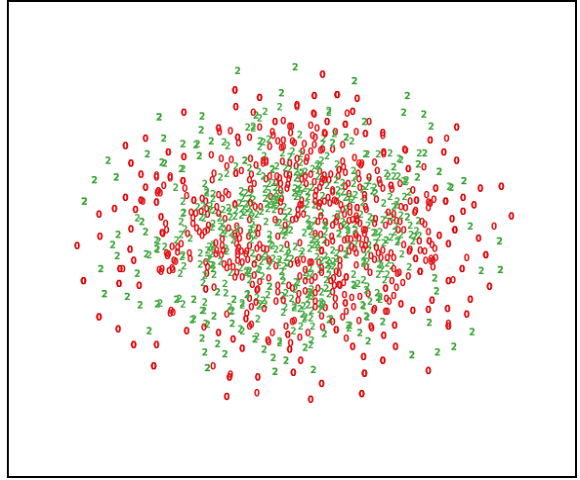
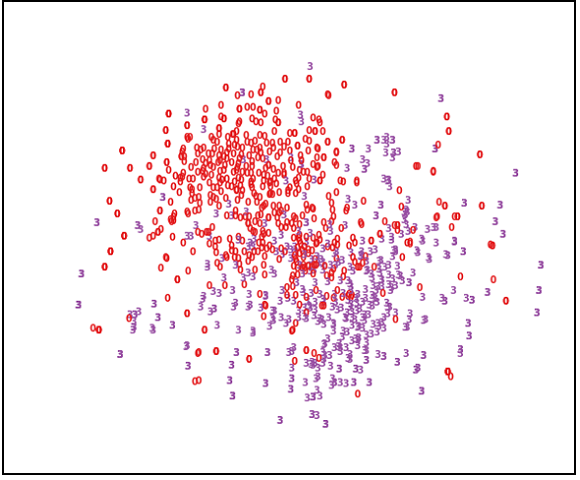
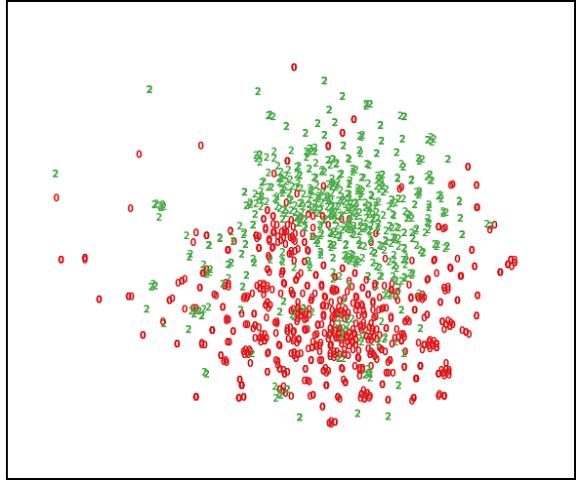
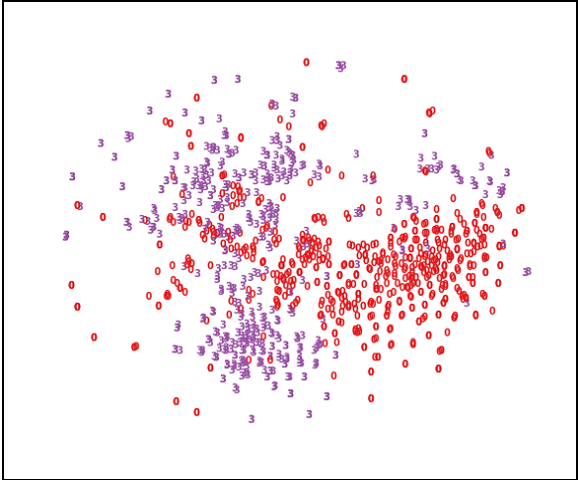
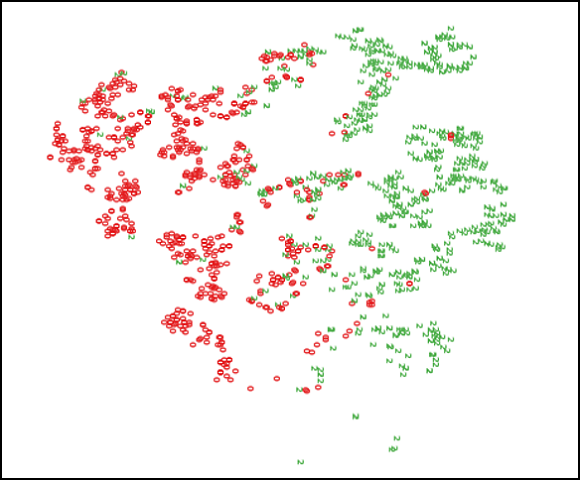
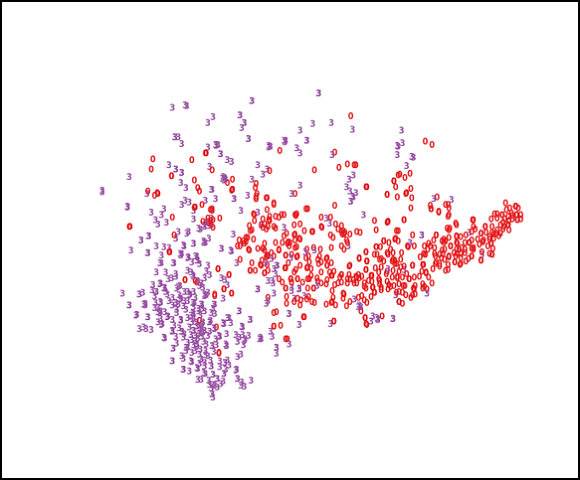
To intuitively show the superiority of MGCN, we visualize the distribution of the node embeddings H learned by ChebNet, GCN, GPRGNN and our MGCN on ACM and DBLP datasets via -SNE algorithm (Van der Maaten and Hinton, 2008). Here, we randomly select two categories of all samples so as to illustrate the margin of the corresponding decision boundaries clearly in Fig.5. From these results, we conclude that our proposed method has a larger margin of the decision boundaries compared with others.
4.6.2. Visualization of Node Similarity Matrices
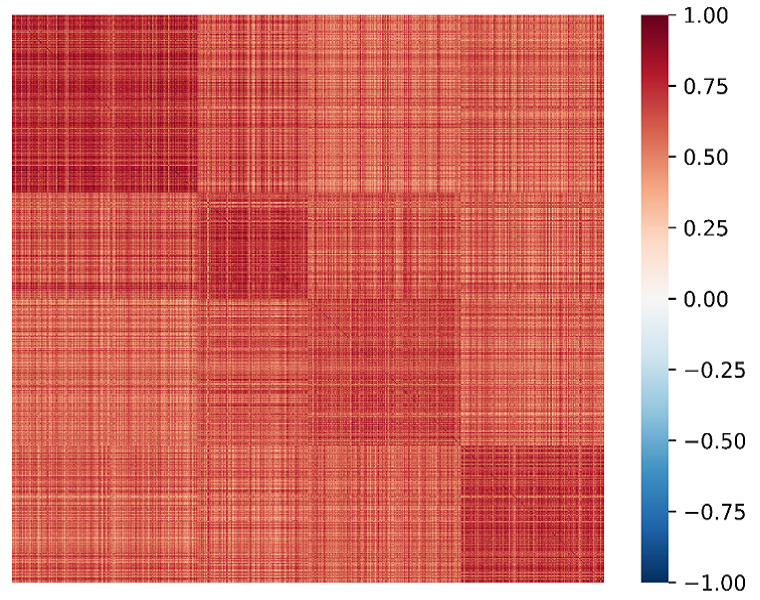
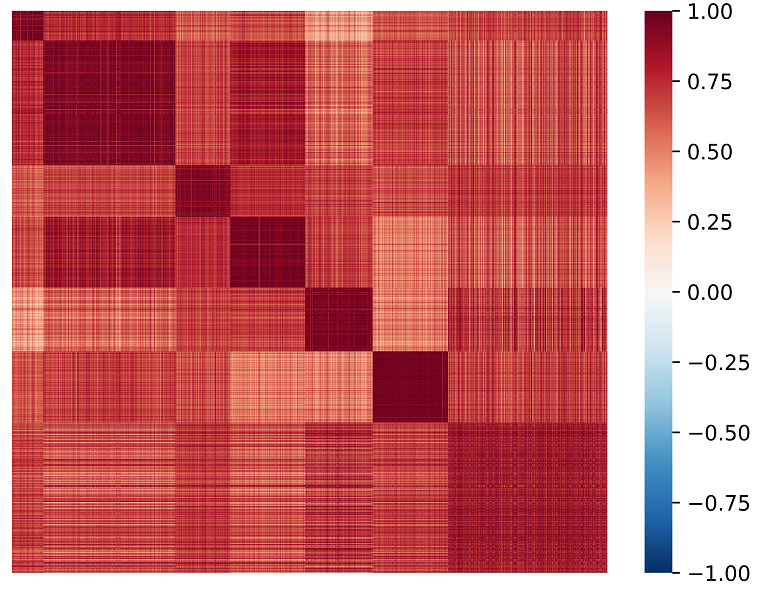
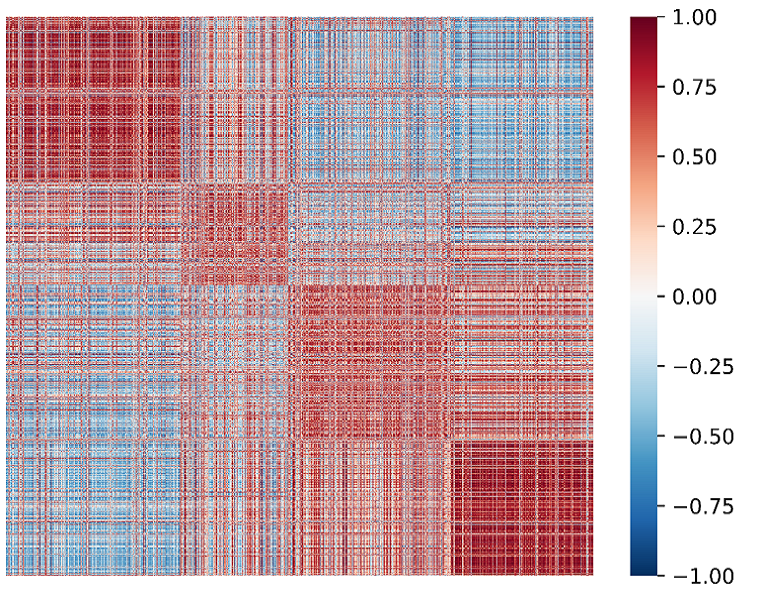
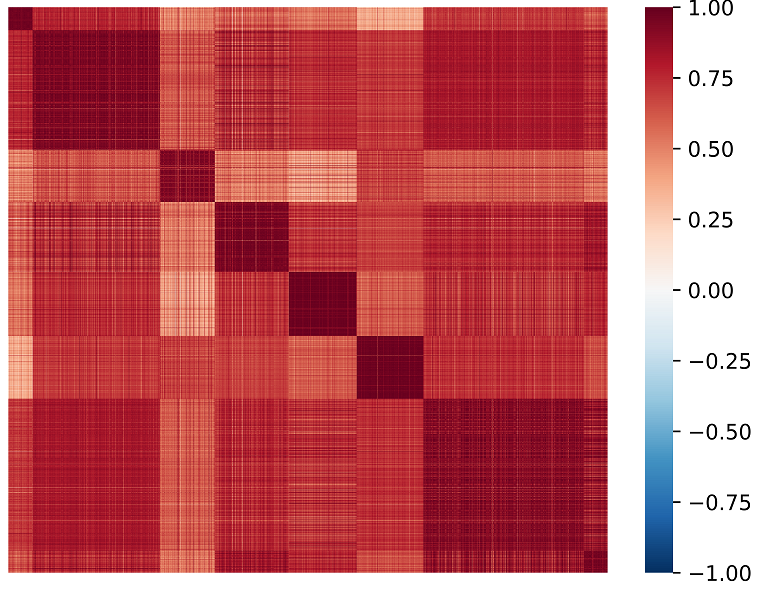
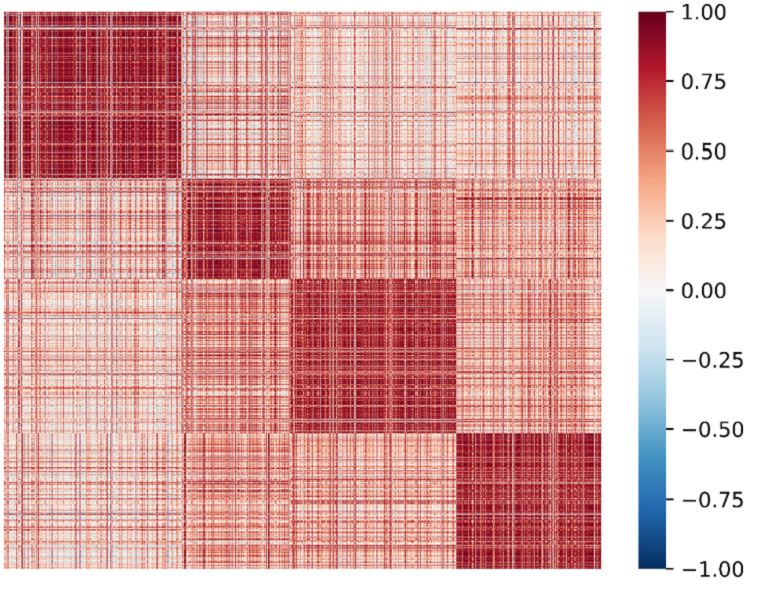
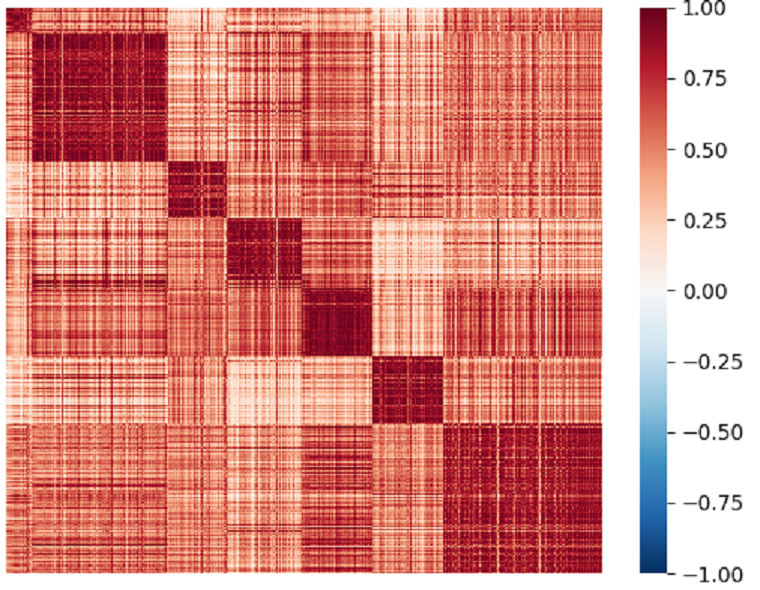
We plot the heat maps of sample similarity matrices in the latent space to intuitively show the representation collapse problem in graph node classification methods and the effectiveness of our solution to this issue on DBLP and AMAP datasets. Here, we sort all samples by categories to make those from the same cluster beside each other. As illustrated in Fig. 6, we observe that GCN (Kipf and Welling, 2016) and GPRGNN (Chien et al., 2020) would suffer from representation collapse during the process of node encoding. Unlike them, our proposed method learns the more discriminative latent features, thus avoiding the representation collapse.
5. CONCLUSION
In this work, we propose a novel graph contrastive learning method termed Interpolation-based Correlation Reduction Network (MGCN) to alleviate the representation issue in semi-supervised node classification task. Specifically, we propose a Mixed Graph Module to force the prediction model to change linearly between samples, thus enlarging the margin of decision boundaries. Besides, the proposed correlation reduction module aims to keep the cross-view consistency of the embeddings. Benefited from these two modules, our network is guided to learn more discriminative representations, thus alleviating the representation collapse problem. Extensive experiments on six datasets demonstrate the superiority of our proposed methods.
References
- (1)
- Bielak et al. (2021) Piotr Bielak, Tomasz Kajdanowicz, and Nitesh V Chawla. 2021. Graph Barlow Twins: A self-supervised representation learning framework for graphs. arXiv preprint arXiv:2106.02466 (2021).
- Bo et al. (2020) Deyu Bo, Xiao Wang, Chuan Shi, Meiqi Zhu, Emiao Lu, and Peng Cui. 2020. Structural deep clustering network. In Proc. of WWW.
- Chen et al. (2020) Ting Chen, Simon Kornblith, Mohammad Norouzi, and Geoffrey Hinton. 2020. A simple framework for contrastive learning of visual representations. In International conference on machine learning.
- Chien et al. (2020) Eli Chien, Jianhao Peng, Pan Li, and Olgica Milenkovic. 2020. Adaptive universal generalized pagerank graph neural network. arXiv preprint arXiv:2006.07988 (2020).
- Defferrard et al. (2016) Michaël Defferrard, Xavier Bresson, and Pierre Vandergheynst. 2016. Convolutional neural networks on graphs with fast localized spectral filtering. Advances in neural information processing systems (2016).
- Grill et al. (2020) Jean-Bastien Grill, Florian Strub, Florent Altché, Corentin Tallec, Pierre H Richemond, Elena Buchatskaya, Carl Doersch, Bernardo Avila Pires, Zhaohan Daniel Guo, Mohammad Gheshlaghi Azar, et al. 2020. Bootstrap your own latent: A new approach to self-supervised learning. arXiv preprint arXiv:2006.07733 (2020).
- Guo (2020) Hongyu Guo. 2020. Nonlinear mixup: Out-of-manifold data augmentation for text classification. In Proceedings of the AAAI Conference on Artificial Intelligence, Vol. 34. 4044–4051.
- Guo et al. (2019) Hongyu Guo, Yongyi Mao, and Richong Zhang. 2019. Augmenting data with mixup for sentence classification: An empirical study. arXiv preprint arXiv:1905.08941 (2019).
- Hamilton et al. (2017) William L Hamilton, Rex Ying, and Jure Leskovec. 2017. Inductive representation learning on large graphs. In Proc. of ICONIP.
- Hassani and Khasahmadi (2020) Kaveh Hassani and Amir Hosein Khasahmadi. 2020. Contrastive multi-view representation learning on graphs. In Proc. of ICML.
- He et al. (2021) Qian He, Desen Zhou, Bo Wan, and Xuming He. 2021. Single Image 3D Object Estimation with Primitive Graph Networks. In Proceedings of the 29th ACM International Conference on Multimedia. 2353–2361.
- Hendrycks et al. (2019) Dan Hendrycks, Norman Mu, Ekin D Cubuk, Barret Zoph, Justin Gilmer, and Balaji Lakshminarayanan. 2019. Augmix: A simple data processing method to improve robustness and uncertainty. arXiv preprint arXiv:1912.02781 (2019).
- Hjelm et al. (2018) R Devon Hjelm, Alex Fedorov, Samuel Lavoie-Marchildon, Karan Grewal, Phil Bachman, Adam Trischler, and Yoshua Bengio. 2018. Learning deep representations by mutual information estimation and maximization. In International Conference on Learning Representations.
- Hu et al. (2021) Wenbo Hu, Changgong Zhang, Fangneng Zhan, Lei Zhang, and Tien-Tsin Wong. 2021. Conditional directed graph convolution for 3d human pose estimation. In Proceedings of the 29th ACM International Conference on Multimedia. 602–611.
- Jing et al. (2021) Baoyu Jing, Chanyoung Park, and Hanghang Tong. 2021. Hdmi: High-order deep multiplex infomax. In Proceedings of the Web Conference 2021. 2414–2424.
- Kingma and Ba (2014) Diederik P Kingma and Jimmy Ba. 2014. Adam: A method for stochastic optimization. arXiv preprint arXiv:1412.6980 (2014).
- Kipf and Welling (2016) Thomas N Kipf and Max Welling. 2016. Semi-supervised classification with graph convolutional networks. arXiv preprint arXiv:1609.02907 (2016).
- Klicpera et al. (2018) Johannes Klicpera, Aleksandar Bojchevski, and Stephan Günnemann. 2018. Predict then propagate: Graph neural networks meet personalized pagerank. arXiv preprint arXiv:1810.05997 (2018).
- LeCun et al. (1998) Yann LeCun, Léon Bottou, Yoshua Bengio, and Patrick Haffner. 1998. Gradient-based learning applied to document recognition. Proc. IEEE (1998).
- Liu et al. (2021b) Xiao Liu, Fanjin Zhang, Zhenyu Hou, Li Mian, Zhaoyu Wang, Jing Zhang, and Jie Tang. 2021b. Self-supervised learning: Generative or contrastive. IEEE Transactions on Knowledge and Data Engineering (2021).
- Liu et al. (2022a) Yue Liu, Wenxuan Tu, Sihang Zhou, Xinwang Liu, Linxuan Song, Xihong Yang, and En Zhu. 2022a. Deep Graph Clustering via Dual Correlation Reduction. In Proc. of AAAI.
- Liu et al. (2021a) Yong Liu, Susen Yang, Chenyi Lei, Guoxin Wang, Haihong Tang, Juyong Zhang, Aixin Sun, and Chunyan Miao. 2021a. Pre-training graph transformer with multimodal side information for recommendation. In Proceedings of the 29th ACM International Conference on Multimedia. 2853–2861.
- Liu et al. (2022b) Yue Liu, Sihang Zhou, Xinwang Liu, Wenxuan Tu, and Xihong Yang. 2022b. Improved Dual Correlation Reduction Network. arXiv preprint arXiv:2202.12533 (2022).
- Lucas et al. (2018) Thomas Lucas, Corentin Tallec, Yann Ollivier, and Jakob Verbeek. 2018. Mixed batches and symmetric discriminators for GAN training. In International Conference on Machine Learning. PMLR, 2844–2853.
- Murphy (2012) Kevin P Murphy. 2012. Machine learning: a probabilistic perspective. MIT press.
- Page et al. (1999) Lawrence Page, Sergey Brin, Rajeev Motwani, and Terry Winograd. 1999. The PageRank citation ranking: Bringing order to the web. Technical Report.
- Pei et al. (2020) Hongbin Pei, Bingzhe Wei, Kevin Chen-Chuan Chang, Yu Lei, and Bo Yang. 2020. Geom-gcn: Geometric graph convolutional networks. arXiv preprint arXiv:2002.05287 (2020).
- Peng et al. (2020) Zhen Peng, Wenbing Huang, Minnan Luo, Qinghua Zheng, Yu Rong, Tingyang Xu, and Junzhou Huang. 2020. Graph representation learning via graphical mutual information maximization. In Proceedings of The Web Conference 2020. 259–270.
- Shchur et al. (2018) Oleksandr Shchur, Maximilian Mumme, Aleksandar Bojchevski, and Stephan Günnemann. 2018. Pitfalls of graph neural network evaluation. arXiv preprint arXiv:1811.05868 (2018).
- Sun et al. (2019) Fan-Yun Sun, Jordan Hoffmann, Vikas Verma, and Jian Tang. 2019. Infograph: Unsupervised and semi-supervised graph-level representation learning via mutual information maximization. arXiv preprint arXiv:1908.01000 (2019).
- Thakoor et al. (2021) Shantanu Thakoor, Corentin Tallec, Mohammad Gheshlaghi Azar, Mehdi Azabou, Eva L Dyer, Remi Munos, Petar Veličković, and Michal Valko. 2021. Large-scale representation learning on graphs via bootstrapping. In International Conference on Learning Representations.
- Tu et al. (2021) Wenxuan Tu, Sihang Zhou, Yue Liu, and Xinwang Liu. 2021. Siamese Attribute-missing Graph Auto-encoder. arXiv preprint arXiv:2112.04842 (2021).
- Van der Maaten and Hinton (2008) Laurens Van der Maaten and Geoffrey Hinton. 2008. Visualizing data using t-SNE. Journal of machine learning research (2008).
- Veličković et al. (2017) Petar Veličković, Guillem Cucurull, Arantxa Casanova, Adriana Romero, Pietro Lio, and Yoshua Bengio. 2017. Graph attention networks. arXiv preprint arXiv:1710.10903 (2017).
- Velickovic et al. ([n.d.]) Petar Velickovic, William Fedus, and William L Hamilton. [n.d.]. Deep Graph Infomax. ([n. d.]).
- Verma et al. (2019a) Vikas Verma, Kenji Kawaguchi, Alex Lamb, Juho Kannala, Yoshua Bengio, and David Lopez-Paz. 2019a. Interpolation consistency training for semi-supervised learning. arXiv preprint arXiv:1903.03825 (2019).
- Verma et al. (2019b) Vikas Verma, Alex Lamb, Christopher Beckham, Amir Najafi, Ioannis Mitliagkas, David Lopez-Paz, and Yoshua Bengio. 2019b. Manifold mixup: Better representations by interpolating hidden states. In International Conference on Machine Learning. PMLR, 6438–6447.
- Wang et al. (2021) Yiwei Wang, Wei Wang, Yuxuan Liang, Yujun Cai, and Bryan Hooi. 2021. Mixup for Node and Graph Classification. In Proceedings of the Web Conference 2021.
- Wu et al. (2019) Felix Wu, Amauri Souza, Tianyi Zhang, Christopher Fifty, Tao Yu, and Kilian Weinberger. 2019. Simplifying graph convolutional networks. In International conference on machine learning.
- Wu et al. (2021) Lirong Wu, Haitao Lin, Zhangyang Gao, Cheng Tan, Stan Li, et al. 2021. GraphMixup: Improving Class-Imbalanced Node Classification on Graphs by Self-supervised Context Prediction. arXiv preprint arXiv:2106.11133 (2021).
- Wu et al. (2020) Zonghan Wu, Shirui Pan, Fengwen Chen, Guodong Long, Chengqi Zhang, and S Yu Philip. 2020. A comprehensive survey on graph neural networks. IEEE transactions on neural networks and learning systems 32, 1 (2020), 4–24.
- Xu et al. (2018) Keyulu Xu, Chengtao Li, Yonglong Tian, Tomohiro Sonobe, Ken-ichi Kawarabayashi, and Stefanie Jegelka. 2018. Representation learning on graphs with jumping knowledge networks. In Proc. of ICML.
- Yang et al. (2022) Xihong Yang, Xiaochang Hu, Sihang Zhou, Xinwang Liu, and En Zhu. 2022. Interpolation-based Contrastive Learning for Few-Label Semi-Supervised Learning. arXiv preprint arXiv:2202.11915 (2022).
- You et al. (2020) Yuning You, Tianlong Chen, Yongduo Sui, Ting Chen, Zhangyang Wang, and Yang Shen. 2020. Graph contrastive learning with augmentations. Advances in Neural Information Processing Systems 33 (2020), 5812–5823.
- Zbontar et al. (2021) Jure Zbontar, Li Jing, Ishan Misra, Yann LeCun, and Stéphane Deny. 2021. Barlow twins: Self-supervised learning via redundancy reduction. arXiv preprint arXiv:2103.03230 (2021).
- Zhang et al. (2017) Hongyi Zhang, Moustapha Cisse, Yann N Dauphin, and David Lopez-Paz. 2017. mixup: Beyond empirical risk minimization. arXiv preprint arXiv:1710.09412 (2017).
- Zhang et al. (2021) Haoyu Zhang, Meng Liu, Zan Gao, Xiaoqiang Lei, Yinglong Wang, and Liqiang Nie. 2021. Multimodal dialog system: Relational graph-based context-aware question understanding. In Proceedings of the 29th ACM International Conference on Multimedia. 695–703.
- Zhou et al. (2020) Jie Zhou, Ganqu Cui, Shengding Hu, Zhengyan Zhang, Cheng Yang, Zhiyuan Liu, Lifeng Wang, Changcheng Li, and Maosong Sun. 2020. Graph neural networks: A review of methods and applications. AI Open 1 (2020), 57–81.
- Zhu (2005) Xiaojin Jerry Zhu. 2005. Semi-supervised learning literature survey. (2005).
- Zhu et al. (2020) Yanqiao Zhu, Yichen Xu, Feng Yu, Qiang Liu, Shu Wu, and Liang Wang. 2020. Deep Graph Contrastive Representation Learning. In ICML Workshop on Graph Representation Learning and Beyond. http://arxiv.org/abs/2006.04131
- Zhu et al. (2021) Yanqiao Zhu, Yichen Xu, Feng Yu, Qiang Liu, Shu Wu, and Liang Wang. 2021. Graph contrastive learning with adaptive augmentation. In Proceedings of the Web Conference 2021. 2069–2080.