Intake Monitoring in Free-Living Conditions: Overview and Lessons we Have Learned
Abstract
The progress in artificial intelligence and machine learning algorithms over the past decade has enabled the development of new methods for the objective measurement of eating, including both the measurement of eating episodes as well as the measurement of in-meal eating behavior. These allow the study of eating behavior outside the laboratory in free-living conditions, without the need for video recordings and laborious manual annotations. In this paper, we present a high-level overview of our recent work on intake monitoring using a smartwatch, as well as methods using an in-ear microphone. We also present evaluation results of these methods in challenging, real-world datasets. Furthermore, we discuss use-cases of such intake monitoring tools for advancing research in eating behavior, for improving dietary monitoring, as well as for developing evidence-based health policies. Our goal is to inform researchers and users of intake monitoring methods regarding (i) the development of new methods based on commercially available devices, (ii) what to expect in terms of effectiveness, and (iii) how these methods can be used in research as well as in practical applications.
keywords:
Objective intake monitoring , Passive intake monitoring , Wearables , Artificial intelligence for dietary monitoring[hua]organization=Department of Informatics and Telematics, Harokopio University of Athens, country=Greece
[auth]organization=Electrical and Computer Engineering Department, Aristotle University of Thessaloniki, country=Greece
1 Introduction
Studying and monitoring food intake behavior is important for several health conditions including obesity, eating disorders, cardiometabolic syndrome and diabetes. Examples of methods for the in-depth study of intake include video-based monitoring, where researchers manually annotate video sequences of people eating (e.g., Llewellyn et al. (2008)), and surface electromyography (sEMG) where signals capture the activation of muscles associated with eating (such as Smit et al. (2011)). These methods support detailed analysis of intake behavior in the laboratory.
In free-living conditions, however, the options are limited to the use of questionnaires, such as food recall questionnaires, food frequency questionnaires or questionnaires reported via mobile apps. Self-reported food intake information has been shown in many cases to be inaccurate, however, while the use of self-reported information for policy decision-support purposes has been questioned (see Bingham (1991), Archer et al. (2013)). Furthermore, detailed in-meal eating parameters, such as eating speed cannot be measured using self-reports.
As a result, the development of new sensors and algorithms for monitoring intake behavior has received significant research attention over the past few years. The main drivers for this interest have been the availability of inexpensive sensors, the widespread use of mobile phones and wearable devices, as well as recent developments in machine learning and signal processing algorithms.
In this paper, we present an overview of research that we have performed over the past six years towards methods for passive, objective and accurate intake monitoring in free-living conditions. Specifically, we focus on methods that use sensors that are wearable and that are easy to acquire, possibly with commercially available devices. We therefore present only methods for monitoring intake using (a) ear-worn sensors (earbuds) and (b) wrist-worn sensors (smartwatches). Figure 1 shows examples of commercially available devices that can be used for intake monitoring using the methods presented in this paper.

The goal of these methods is to directly obtain, or estimate, measurements that can be broadly categorized in (a) in-meal and (b) all-day food intake indicators. Examples are shown in Table 1. All-day indicators rely on accurate detection of meals and snacks. All other measurements can be derived from this information. In-meal indicators can be more diverse and require granular measurements. Furthermore, the proposed methods can be used to study new features of intake behavior, possibly associated to health conditions, as demonstrated by Kyritsis et al. (2021).
| In-meal | All-day |
|---|---|
| Meal duration | Main meals per day |
| Bouts per minute | Number of snacks per day |
| Bout deceleration | Eating breakfast |
| Total intake | Eating schedule consistency |
In Section 2 we present a brief overview of methods that have been proposed in the recent literature for objective food intake monitoring in free-living conditions, using various sensors. Section 3 discusses several methods for monitoring intake using inertial sensors embedded in a wrist-worn smartwatch. It is shown that it is not only possible to explicitly model detailed movements performed during eating to measure intake, but that it also is possible for deep representation learning algorithms to learn the structure of eating movements implicitly.
Section 4 discusses methods for intake monitoring using chewing detection. The methods were developed using a custom-made chewing detection device that uses audio, photoplethysmography (PPG) and acceleration signals. It is shown, however, that deep representation learning algorithms can achieve similar results using the audio signal only. The algorithms therefore can be used with commercially available earbuds that house a microphone.
The paper also discusses how these methods can be integrated into practical use-cases for research, dietary monitoring and measurements for supporting policy decisions (Section 5). This includes a discussion on the benefits of using passive objective monitoring, as well as potential barriers and difficulties that are still under investigation.
2 Related work
This section provides a brief overview of selected methods for objective dietary monitoring that have been recently proposed in the literature and are relevant to the work that we discuss in this paper.
2.1 Bite detection
Dong et al. (2012) presented a method that uses a single channel of the gyroscope sensor (roll of the wrist) for detecting bites using a smartwatch. This approach works well for counting the number of bites but is not as accurate for temporal bite localization. Another approach, proposed by Zhang et al. (2016), uses a bottom-up solution, aiming at first discovering subfeeding gestures (food-to-mouth and back-to-rest) using the inertial signals and then aggregating these gestures into bites. Both of these methods are further discussed in Section 3. Approaches also exist that bring the cultural aspect into consideration when investigating eating behavior. Such works make use of the characteristic wrist motions that occur when certain cutlery is used. For example, the works of Cho and Choi (2018) and Kim et al. (2012) use the accelerometer data from wrist mounted sensors to deal with the recognition of Asian-style eating events that mainly involve the use of the spoon and chopsticks in contrast to the Western eating styles that mostly use the fork and the knife.
The works of Anderez et al. (2020) and Amft et al. (2005a) showcase the feasibility of incorporating drinking gestures, in addition to eating, to their models and perform in-meal monitoring using wrist-mounted inertial sensors. Experimental results using small datasets (involving six and two subjects, respectively) provide the initial indication that simultaneously monitoring both gesture types is possible; however, further experimentation is required using larger and more diverse datasets in order to obtain more concrete evidence.
Other approaches include the use of video from a camera placed in front of the participant during a meal session. Examples include Rouast and Adam (2019); Qiu et al. (2020) and Konstantinidis et al. (2020). Rouast and Adam (2020) proposed a method that can be applied to both inertial and video data (but not their combination) and is also able to distinguish between eating and drinking episodes. Finally, Heydarian et al. (2021) presented a method for the fusion of inertial and video data for in-meal eating monitoring.
2.2 Meal detection in-the-wild
The approaches discussed in the previous section (section 2.1) focus on measuring the in-meal eating behavior by performing the temporal localization of bite events via wrist motion tracking under free-living conditions. The current section focuses on a much smaller body of research that aims at identifying and localizing eating episodes (such as meals or snacks) from data collected using wrist-mounted inertial sensors. Furthermore, such approaches fall into two categories; the first category includes methods that perform indirect meal detection by clustering intake-related events (e.g., bites) while the second one includes methods that perform direct detection.
Regarding the indirect detection of eating events, the work of Zhang et al. (2017) presents a method that makes use of a smartwatch for intake monitoring and a neck-worn camera for providing ground truth. Their method is based on the rationale that most eating activities do not occur while moving; thus, their proposed method filters out periods with high physical activity and focuses on the resulting ones. Using the density of the detected feeding gestures the authors are able to detect the feeding episodes using a density-based scheme. A similar method is presented in Thomaz et al. (2015) where the authors propose a pipeline that includes the extraction of features from the inertial signals and a feeding gesture classification scheme. Finally, eating moment detection is achieved by using the DBSCAN algorithm on the detected food intake gestures.
Towards the direct detection of eating events, the work of Dong et al. (2011) proposes the use of a wrist-band device and the use of a single gyroscope channel by a two-state model (not eating and possibly eating) based on thresholds. Their method is based on the hypothesis that a period of increased wrist motion exists before and after every meal, while during the meal the wrist motion energy is decreased. The latter work of Sharma et al. (2016) extended the work of Dong et al. (2011) by using a more well-suited novel smartwatch-like sensing platform and increasing the dataset’s size by over twofold. Furthermore, the authors suggest that their initial hypothesis (i.e., increased wrist activity before and after a meal) may not generalize for all participants. Another work by Dong et al. (2013) suggests the use of a prototype watch-like device towards the detection of eating activities. More specifically, the authors propose the use of a single channel from the on-board gyroscope sensor, particularly the one that measures the orientation velocity on the axis that is collinear with the forearm (also known as the roll). By using the variance of the roll signal as the single feature, they construct a finite state machine that consists of two states, “not eating” and “possibly eating”, while the transition between those two states is achieved simply by thresholding. Mirtchouk et al. (2017) used two smartwatches, one in each wrist, and recorded a large dataset (ACE), which is publicly available. It includes meals, drinks and snacks. The work of Thomaz et al. (2017) modeled eating as a bimanual task (requiring two hands) and broke it down into two subcategories - symmetric bimanual (hands have same role, e.g., holding a sandwich) and asymmetric bimanual (hands have complementary roles, e.g., knife and fork). Direct detection of eating events can also be achieved using more complex sensors; e.g., Jia et al. (2019) as well as Raju and Sazonov (2019) used a first-person, egocentric video stream taken during the day to detect eating episodes.
2.3 Chewing detection
In addition to bite detection via eating gestures, several methods have explored intake monitoring through chewing detection. Amft and Troster (2009) proposed one of the first intake monitoring systems that uses a combination of ear microphones (for chewing) and throat microphones (for swallowing). Amft et al. (2009) suggests bite-weight estimation from an in-ear microphone. The approach requires accurate detection of chewing events, since the method is based on characteristics such as chew duration, number of chews (per chewing bout), and signal energy during the chew, to estimate bite weight. Unfortunately, these methods may not generalize well in free-living conditions where external noise and movement could interfere with detection.
Päßler and Fischer (2012) also proposed methods which use an in-ear microphone, as well as a second microphone for identifying external sounds. The authors propose several algorithms that use mainly morphological and spectral features of the audio signal. Again, generalization in noisy environments closer to real-life could be an issue (see also Section 4). In Päßler and Fischer (2014), the authors compare eight different algorithms for chewing detection on 18 hours of recordings. Best results achieve over both precision and recall. An important finding is that the addition of a pre-processing stage where noise (i.e. non-relevant sounds for chewing detection) is removed can reduce false-positive detections by .
Another method for chewing detection is presented by Bi et al. (2018), and uses an ear-mounted sensor. The microphone is an off-the shelf device, however, a 3D-printed mounting component is required, and authors report that it reduces comfort during wear. Both temporal and spectral features are extracted from the captured audio and a feature selection method is also used. The proposed method detects - (depending on strictness of evaluation) eating episodes out of a total of on a free-living dataset of hours.
Bi et al. (2016) uses a neck microphone. The prototype wearable is worn around the neck, and a mounted microphone is mounted pressing against the throat, capturing audio in an non-invasive way. Audio signal is transmitted via Bluetooth to a smartphone were food-type recognition takes place. The proposed algorithm uses Hidden Markov Model for chewing detection, and then extracts both time and frequency domain features from the detected chewing segments. These features are used with a decision-tree classifier to recognize food type. Classification accuracy is reported to be .
In Fontana et al. (2014), authors propose a combination of an in-ear microphone, a jaw sensor, and wrist-mounted accelerometer for detecting eating activity. Different features are extracted from each sensor and neural network classifiers are used for eating detection. Authors report detection accuracy of on a hour dataset that includes both eating and daily activities. Alternative sensors have also been examined; such a piezoelectric sensor is proposed in Sazonov and Fontana (2012) for detecting chewing activity.
Recently, deep learning approaches have been used with audio sensors, as they tend to achieve high effectiveness in most classification tasks.
One of the first methods to use deep learning for chewing signal processing is the iHear Food system Gao et al. (2016). The system relies on a commercially-available headset for chewing detection. Authors evaluate SVM classifiers for detection; they report accuracy of - in laboratory conditions, which degrades to - in field testing. However, authors then evaluate a deep learning classifier that can improve accuracy to - .
More recently, Tuğtekin Turan and Erzin (2018) have suggested the use of a throat microphone, combined with a convolutional neural network (CNN) after noise filtering. The CNN is trained on spectral representation of the audio signal. Experimental evaluation on minutes of recordings shows promising results.
2.4 Food portion and food type recognition
Complementary to methods for eating detection and in-meal eating behavior monitoring, visual recognition methods have been proposed for assessing the content and volume of food. For example, Puri et al. (2009) and Zhu et al. (2010) propose the estimation of food portion size using cameras. Further examples include Kong and Tan (2012); Anthimopoulos et al. (2014); Zhu et al. (2011) and Christodoulidis et al. (2015), that propose methods for food type recognition from images. In Lu et al. (2020) the authors proposed the goFOOD system, which requires 2 photos or 1 short video of food. It detects food, segments it and recognizes food type, and performs 3D reconstruction for volume estimation. Then, it estimates calories and micro-nutrients (based on a look-up table).
3 Intake monitoring using smartwatches
This section presents how a smartwatch, used as a sensor platform, can be utilized as a means of monitoring the in-meal and all-day eating behavior. Albeit not technically a sensor, the smartwatch is a wrist-mounted, watch-like device that contains sensors. The eating behavior monitoring methods presented in this section make use of the accelerometer and gyroscope sensors as they appear in the majority of smartwatches due to their low cost and multiple applications (e.g., adjusting the orientation of the screen).
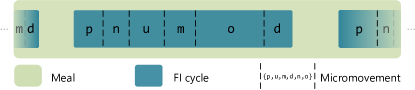
Next, we introduce the eating behavior model and its three core components; in particular, the micromovement, the food intake (FI) cycle (i.e., bite) and the meal. The term micromovement corresponds to a simple and short in duration movement of the wrist that operates the utensil during the course of a meal. A typical example of a micromovement is the upwards movement of wrist towards the mouth area. In its ideal form, a food intake cycle begins by manipulating a utensil to pick up food from the plate (p), continues with an upwards motion of the wrist operating the utensil towards the mouth (u), followed by inserting the food into the mouth (m) before concluding with a downwards motion of the wrist away from the mouth area (d). In practice however, we observe repetitions of certain micromovements, unrecognized wrist movements (o) or no wrist movements at all (n).
Finally, in the context of this work, the meal is defined as the sequence of actions that leads to the consumption of already-prepared food, at a given place and lasts a finite amount of time. Furthermore, we adopt the plated food assumption and that the food is consumed using specific utensils (i.e., knife, fork and/or spoon). Figure 2 depicts an example that makes use of the proposed eating behavior model.
For the rest of this section, we present how the aforementioned eating behavior model and the inertial data from a commercial smartwatch can be used to perform in-meal, with and without the use of micromovements (sections 3.1 and 3.2), and all-day eating behavior monitoring (section 3.3).
3.1 Micromovement-based in-meal eating behavior monitoring
Given the micromovement-based eating behavior model introduced in Section 3, we propose a two-step approach towards the detection of FI cycles during the course of a meal. The first step deals with the processing of windowed inertial measurements (i.e., fixed-length segments) with the purpose of obtaining their micromovement representations, while the second step is responsible for modeling the temporal evolution and classify sequences of windows as FI cycles.
The method’s pipeline, originally introduced in Kyritsis et al. (2019b), begins with the preprocessing of the raw inertial data (3D acceleration and angular velocity) using a median filter in order to smooth any short and sudden fluctuations. In addition, since the accelerometer sensor captures both the acceleration caused by the voluntary movement of the wrist as well as the acceleration due to the Earth’s gravitational field, we convolve the accelerometer streams with a high-pass Finite Impulse Response (FIR) filter. Following the preprocessing step, a Convolutional Neural Network (CNN) is used to estimate the micromovement probability distribution of each window of the inertial streams. To classify sequences of windows as FI cycles we apply a Long short-term memory (LSTM) network. The LSTM network takes as input overlapping sequences of micromovement distributions (as produced by the CNN) and outputs a probability that the input sequence is an FI cycle. It should be emphasized that the CNN and LSTM networks are trained separately. More specifically, the CNN is trained using windows of length equal to seconds that correspond to the p, u, m, d, n micromovements, while the LSTM is trained using sequences of length equal to seconds that contain micromovement distributions that begin with p, end with d and contain an m micromovement instance. The final FI cycle moments are assigned to the local maxima of the LSTM network’s output.
Earlier adaptations of the micromovement-based algorithm are based on hand-crafted features and Support Vector Machines (SVM) instead of a CNN (Kyritsis et al., 2017a) and Hidden Markov Models (HMM) for modeling the temporal evolution of windowed micromovement instances (Kyritsis et al., 2017b). These adaptations, however, have proven to be subpar compared with the CNN and LSTM-based approach. Finally, the adaptation presented in Papadopoulos et al. (2018) includes the personalized tuning of the SVM-based model (Kyritsis et al., 2017a) using unlabeled samples and semi-supervised learning techniques.
3.2 Micromovement-free in-meal eating behavior monitoring
Moving past the micromovement-based approach of Section 3.1, this section presents an end-to-end, single-step method for the detection of FI cycles (i.e., bites) during the course of a meal. It should be emphasized that the presented algorithm depends solely on the information regarding the FI cycles and, as a result, does not require the explicit knowledge of wrist micromovements. In addition, this approach is considered as data-driven since it processes the raw inertial data (not using hand-engineered features) to obtain the micromovement representations of the windowed inertial streams.
The core of the approach presented in Kyritsis et al. (2020) and Kyritsis et al. (2018) is an Artificial Neural Network (ANN) with both convolutional and recurrent layers. By allowing the model to be more data-driven the CNN can discover the optimal feature representations before performing temporal modeling using an LSTM.
Similar to Section 3.1, preprocessing includes data smoothing and removal of the gravitational component from the acceleration stream. The end-to-end network is then trained by minimizing a single loss function (as opposed to the network of Section 3.1 that trained the CNN and LSTM separately). Using signal samples of length equal to seconds, we obtain the FI cycle predictions of the meal under investigation. To make the model more robust, we propose a data augmentation technique that is based around artificially changing the orientation of the smartwatch and thus simulating different placements on the wrist. The final FI moments correspond to the local maxima of the produced end-to-end network bite probabilities. Figure 3 depicts the architecture of the end-to-end network as part of the in-meal FI cycle detection pipeline.

Evaluation is performed in a leave-one-subject-out (LOSO) fashion using our strict evaluation scheme proposed by Kyritsis et al. (2019b). Essentially, the first detected bite in a ground truth interval is considered as a true positive (TP), while subsequent ones count as false positives (FP). Bite detections outside ground truth intervals also count as FP. Ground truth intervals without any bite detections are considered as false negatives (FN). Furthermore, we used the publicly-available Food Intake Cycle (FIC) dataset111https://mug.ee.auth.gr/intake-cycle-detection/, containing a total of meals from subjects recorded in the cafeteria of the Aristotle University of Thessaloniki. The total duration of the meals sums to minutes, with a mean duration of minutes. No special instructions were provided to the participants and they were free to consume a wide variety of food types in their own way and pace and engage with discussions with other people around the table or interact with their smartphone.
Table 2 presents the evaluation results. In addition to the micromovement-based or micromovement-free approaches presented in Sections 3.1 and 3.2, we include experimental results from two additional smartwatch-based methods found in the recent literature. The method presented by Dong et al. (2012) is a micromovement-free approach that is based on a single channel of the gyroscope sensor (the one parallel to the forearm) and certain thresholds to detect bite events. The method by Zhang et al. (2016) is designed around the idea of modeling a bite using two subfeeding wrist gestures; specifically, food-to-mouth and back-to-rest.
Evaluation results indicate that the micromovement-free, end-to-end approach outperforms all other methods, both micromovement-based and micromovement-agnostic, by achieving an F1 score of using our strict evaluation scheme. The micromovement-based approach presented in Section 3.1 achieves the second highest performance with an F1 score of under the same scheme. Switching to the less strict evaluation scheme of Dong et al. (2012) an overall increase can be observed across all experiments. We emphasize on the importance of using the F1 score as the evaluation metric of choice, as it provides a combined measure of precision (how many of the detected bites are actually bites) and recall (how many of the actual bites are detected). More specifically, since the F1 score is the harmonic mean of precision and recall, achieving a high F1 score requires both a high precision and a high recall.
3.3 All-day and in-the-wild eating behavior monitoring
A more challenging problem arises when dealing with all-day, in-the-wild recordings where meals are only a small part of the recorded data, while the rest of the recording corresponds to everyday activities such as commuting, doing sports or working. This section addresses the problem of “when” one eats by performing the temporal localization of meals in all-day, in-the-wild recordings.
The hypothesis around the design of our method is that the density of bites is high during meals and low when outside of meals. Based on this hypothesis, the first step of our approach (Kyritsis et al. (2020, 2019a)) is to detect all FI cycles that occur during during the all-day recording. The next step is to use signal processing techniques to isolate regions with high bite density and, iteratively, merge them with adjacent ones (within seconds of each other). Furthermore, any regions with duration less than seconds are discarded (short meal rejection). The outcomes of the above, two-step, process are the recording’s meal end-points.
Evaluation is performed by exhaustively calculating the TP, FP, FN and true negatives (TN) by discretizing the complete all-day recording. Moreover, we are able to measure the intersection and union between the detected and ground truth meal intervals, thus allowing to calculate the Jaccard index (also known in the literature as Intersection over Union - IoU). The datasets used for evaluation are the publicly available FreeFIC (both the baseline and held-out parts are available online222https://mug.ee.auth.gr/free-food-intake-cycle-detection/) and ACE (proposed by Mirtchouk et al. (2017)). The baseline part of FreeFIC contains a total of all-day recordings adding up to hours, collected from subjects. Similarly, the held-out part of FreeFIC consists of all-day recordings, from subjects, with a total duration of hours. On the other hand, ACE contains recordings from subjects summing up to approximately hours. One significant difference between the two datasets is that ACE includes the consumption of drinks and snacks which have different wrist mechanics compared to the utensil-based consumption of meals that are included in FreeFIC.
The first half of Table 3 summarizes the performance of meal detection algorithms obtained in a LOSO fashion using the baseline FreeFIC set, while the second half using the held-out part of FreeFIC. We compare the performance of our approach with the well-known method of Dong et al. (2013) - a segmentation algorithm based on the hypothesis that meals tend to be preceded and succeeded by periods of vigorous wrist motion. Also, inspired by Zhang et al. (2016), we compare the performance of the DBSCAN clustering algorithm towards the aggregation of FI cycles into meals. Results from both LOSO and held-out experiments point out that the proposed approach outperforms similar methods by achieving a weighted accuracy/Jaccard index equal to / and /, respectively. By applying our meal detection algorithm to the ACE dataset (Table 4), we can see that despite the different recording conditions the weighted accuracy remains satisfactory ( and with and without considering snacks as meals, respectively). Since eating activities occupy a very small portion of the total recording duration, therefore it is a problem that by definition involves imbalanced datasets, it is crucial to adjust accuracy by a weight factor to avoid bias in the results. For the meal detection problem, the weight factor is obtained by dividing the total recording duration with the time spent during meals; e.g., for the FreeFIC dataset the weight factor is calculated as , which essentially means that recordings contain times more non meal-related activities that meal-related ones.
| Positive periods | Prec | Rec | Spec | F1 | Acc | Accw | JI |
|---|---|---|---|---|---|---|---|
| Meals only | |||||||
| Meals & snacks |
3.4 Limitations
The relatively high battery requirements from recording accelerometer and gyroscope signals can impose limitations on intake monitoring with smartwatches that are currently available commercially. In an attempt to overcome these issues, we are investigating the use of the accelerometer signal only for the detection of FI cycles and localization of meals. Early experiments indicate that, despite the significant loss of information, the bite and meal detection results remain satisfactory, yet open to improvement. Specifically, LOSO evaluation using FIC reached an F1 score of for bite detection and a weighted accuracy/Jaccard index of / using FreeFIC for meal detection.
Future work includes the investigation of how different sitting postures and use of utensils affect micromovement modeling, bite detection and extracted indicator. In addition, we plan on incorporating drinking gestures to the eating behavior model, to make it capable of monitoring more complex eating behaviors.
4 Chewing detection and measurement
A different type of signal that can be used to automatically extract eating behavior information is audio. In particular, continuously capturing audio using a microphone close to the mouth can be used to capture the distinct sounds of crushing food between the teeth during mastication and thus detect chewing activity.
Using audio and detecting chewing offers much richer information regarding eating behavior. In particular, it is possible to identify individual chews and thus extract information, such as number of chews per chewing bout, chewing rate, changes in chewing rate, and more. Furthermore, it is possible to extract additional information, such as food texture attributes (e.g. crispiness and moisture) which could help in identifying the food type. Finally, approaches to estimate the weight (in grams) of each chewing bout are also possible (and are currently under investigation).
The most common placing of microphones for such applications in inside the outer in-ear canal. Early studies (such as Amft et al. (2005b)) have shown that this placement is one of the most effective ones as chewing sounds travel very well (with very low attenuation) from the mandible, through the skull, to the ear. In addition, as the microphone is usually directed towards the inside of the ear canal, it naturally dampens external sounds (such as environmental noise, other people talking, and more). On the other hand, sounds such as talking (from the person wearing the microphone sensor) or walking introduce significant challenges for the detection systems.
A complete approach for a “chewing sensor” has been developed in the context of the EU funded SPLENDID project (Maramis et al., 2014). In this project, a prototype sensor (hardware and software) has been developed that enables objective and automatic monitoring of chewing activity. The sensor includes two pieces: an ear-mounted device, that connects via wire to a belt-mounted device (Figure 4). The ear-mounted device includes an in-ear microphone and a photoplethysmography (PPG) sensor. The belt-mounted device includes a triaxial accelerometer, a data logger that buffers signals from all three sensors and a Bluetooth transmitter that transfers chunks of the buffered data to an Android smartphone. The design of the sensor improved over the course of the project, focusing on the comfort of the users, since the ear-piece needs to be worn continuously. It has received mostly positive comments during the project’s pilot evaluations van den Boer et al. (2018).

While microphones had been studied and experimented with in the literature, the use of a PPG for chewing detection had not been reported before. PPG sensors usually detect blood-flow related information. For chewing detection, placement of a PPG sensor around the ear lobe can detect fluctuations in blood flow that are caused by the activation of the masseter and the trigeminal nerve during chewing (Papapanagiotou et al., 2016).
4.1 Chewing detection using audio, PPG, and acceleration signals
The chewing detection algorithm by Papapanagiotou et al. (2017b) follows a late-fusion approach where each of the audio and PPG signals are processed independently, and their final detection scores are aggregated for the final decision.
Both signals are first pre-processed by applying a low-pass filter to remove unwanted drift that is caused by the electronics and hardware. Then, the signals are split into sliding windows. Different window lengths are chosen for each signal, based on the information we want to obtain. Specifically, we use windows of s length for the PPG signal, since we want to extract the rhythmic motion of chewing that typically is in the range from to Hz. Thus, even for the lowest frequency of Hz, a window of s contains at least periods, i.e. individual chews. From each window we extract spectral features that capture the energy of frequencies relevant to chewing frequency. A trained SVM model is then used on the feature vectors to obtain a classification score.
A similar process is followed for the audio signal. Here, however, we extract much shorter windows ( and ms) and extract features that capture the texture of the sound, i.e. the various characteristics of sound as food is crushed between the teeth. We extract spectral features, higher-order statistics, and other features such as fractal dimension that help the classification model distinguish chewing from talking (Papapanagiotou et al., 2015). A trained SVM model is used to obtain a classification score for each window. Since audio-based windows are extracted at a higher rate compared to PPG-based windows, a down-sampling process is required to synchronize the two classification scores.
The scores, and are combined using a single tuning parameter and chewing is decided using the following inequality
| (1) |
where parameter defines the relative importance of audio over the PPG signal on the decision, and parameter is a threshold that defines the strictness of classification.
The reason for using parameter is that audio and PPG have different responsiveness in the detection process. Specifically, PPG has very high recall at the cost of many false-positive detections. On the other hand, audio-based detection yields very good precision (very few false-positives) but has lower recall. Thus, the combination of the two parameters allows the user to tune the detection system towards higher recall or precision, or a balanced mode, based on the needs of each use-case.
The accelerometer signal is complementary used to detect periods of walking, running, and high physical activity. This information is important because walking rhythm is similar to chewing (i.e. to Hz) and it registers similar patterns both to the audio and PPG sensors, causing the classification models to yield high false-positive detections. By filtering out the chewing detections during walking or other high physical activities we can remove these false positives. It can be argued that one can eat and walk at the same time, but overall, the gain in chewing detection effectiveness is greater when the accelerometer signal is used.
The system and algorithm has been validated on various data collection studies during the SPLENDID project. The final version has been evaluated on a large and challenging dataset that was collected in the Wageningen University in the Netherlands and includes approximately h of recordings. Participants consumed a variate of food types during both meals and snacks, and were able to freely move and leave the premises, and were also encouraged to engage in activities with high physical-activity level. The dataset has been made publicly available (Papapanagiotou et al., 2017c), including all signals and manual annotations for each individual chew. The only exception is the audio signals which have not been published due to privacy issues, but we have made available all the audio-based features we have extracted.
| Prec | Rec | Acc | Accw | F1 | |
|---|---|---|---|---|---|
| LOSO | |||||
| Cumulative |
4.2 Audio-feature learning for chewing detection
Selecting which features to extract from a window is based on careful analysis of the signals, their nature, and the expertise of the researchers. An alternative method is to use methods that automatically learn to extract relevant features during the training of the classification model.
We have examined this possibility by employing deep neural networks (DNNs) to detect chewing based only on the audio signal of the sensor (Papapanagiotou et al., 2017a). We have studied the effectiveness of a DNN that includes (a) five convolutional layers that are used to learn meaningful and effective representations and (b) three fully connected layers that discriminate between chewing and non-chewing based on the learned features of the CNN layers. We have experimented with various design choices for the network architecture, and Papapanagiotou et al. (2017a) presented the results (on the same dataset of Papapanagiotou et al. (2017c)) for five different architectures with different lengths of input window (from to s). The most effective one is the s input window architecture, achieving an F1-score of which is higher than the comparable of the SVM-based approach (Table 5).
| Prec | Rec | Acc | Accw | F1 | |
|---|---|---|---|---|---|
| (a) | |||||
| (b) |
While the DNN-based models achieve higher effectiveness, they require significantly larger volumes of labeled data. Labeling data is a laborious and slow process, that can also sometimes introduce errors. To alleviate this process, we have explored the possibility of using unlabeled data to train the convolutional layers of the model in an unsupervised way, and then use labeled data for supervised training of the fully connected layers only (Papapanagiotou et al., 2021b). This self-supervised learning approach has been found to be highly promising, and our first results indicate that self-supervised learning can lead to comparable, and sometimes even better, detection effectiveness (Table 6). These results demonstrate that it is possible to rely on the audio signal only and to use commercially available earbuds instead of purpose-made chewing sensors, as in our previous work by Papapanagiotou et al. (2021c).
4.3 Using audio to extract in-meal information
Having a system that continuously monitors and detects chewing activity can be used to extract additional information besides the total duration of chewing (which is what we evaluate in Tables 5 and 6). Individually detected chews are aggregated into chewing bouts, and these in turn into meals/snacks. As a result, we can extract information such as total number of meals/snacks, duration of each meal, etc. It is also possible to extract more detailed information within each meal, such as number of chewing bouts (within a meal), number of individual chews (per chewing bout or for the entire meal), chewing rate, and more. The accuracy of this information is directly tied to the effectiveness of the chewing detection models.
Furthermore, in Papapanagiotou et al. (2021a) we have presented a modification of our algorithm by Papapanagiotou et al. (2017b), which, given chewing detections, can estimate certain food-texture attributes. These include crispiness, wetness/moisture, and chewiness. A preliminary evaluation on a relatively small dataset has shown very promising results, especially for crispiness.
We have also presented an algorithm that estimates the weight (in grams) of each food bite based only on the audio signal (Papapanagiotou et al., 2021c). The method is similar to the one by Papapanagiotou et al. (2017b) and extracts the same features, however, it then uses different regression models to estimate bite-weight. Both food-type–specific and non-specific models have been evaluated, and the best results (using regression neural networks) achieve an average absolute error of less than gram per bout, which corresponds to less than relative error for out of the food types examined.
5 Use-cases and impact in eating behavior research and practice
The intake monitoring solutions that we have seen so far can be used in both experimental studies, as well as in real-world applications at individual or population level. In this section, we outline three categories of use-cases, and discuss practical considerations resulting from previous experience in the SPLENDID (Maramis et al., 2014), i-Prognosis (Hadjidimitriou et al., 2016) and BigO (Diou et al., 2020) projects.
5.1 Use in research
The study of intake behavior often requires the use of specialized measuring equipment or manual annotation through video recordings and is therefore commonly performed inside the laboratory. Examples include the study of in-meal eating behavior (e.g. (Ioakimidis et al., 2009; Zandian et al., 2009)) and the study of mastication behavior (e.g., (Woda et al., 2006)). In free-living conditions, studies of intake behavior commonly rely on self-reports that are either provided once (such as food recall or food frequency questionnaires) or through multiple “just-in-time” user feedback through mobile apps Maramis et al. (2019).
For detecting intake moments, measuring eating via a smartwatch or through the chewing sensor using the methods presented in Sections 3 and 4 can increase recall in eating events. This is valuable for snacking and constant eating behaviors, that take place unconsciously (Wansink and Sobal, 2007) and are not accurately reported. Furthermore, one can have reliable estimates of the error introduced by the measurement methods, as reported in Tables 3 and 6.
For in-meal behavior monitoring, the smartwatch-based method of Section 3 can provide the number of bites and the bite frequency, as well as other eating parameters which cannot be easily self-reported. An example demonstrating the value of gesture-based measurements for research was shown by Kyritsis et al. (2021). In this study, the micromovement approach was used to quantify eating difficulties of Parkinson’s Disease patients. The study analyzed in-meal eating behavior of Parkinson’s Disease patients as well as healthy subjects, both inside and outside the clinic, for approximately 700 meals. It was found that the duration of the movement from the plate to the mouth during eating was a reliable, objective measurement that was able to distinguish Parkinson’s Disease patients from healthy subjects.
Impact summary
The presented intake monitoring methods enable (a) automated measurements of in-meal indicators without videos and without manual effort by researchers, (b) objective and more accurate intake behavior measurements, compared to self-reports and (c) automated intake behavior measurements in free-living conditions.
5.2 Use for patient dietary monitoring
In addition to research, the proposed objective intake monitoring tools have the potential to be used for measuring the eating behavior of patients in free-living conditions. This enables targeted recommendations and improved treatment for a number of health domains, such as overweight and obesity, diabetes, cardiometabolic syndrome and cardiovascular disease.
In this scenario, patients are instructed to use the monitoring tools under prespecified conditions (e.g., for at least 3 hours when at home in the afternoon), or even freely throughout the day. The devices collect signals which are then analyzed to extract behavioral indicators, such as the ones shown in Table 1. These are presented to the health professional who is monitoring the patient through a web application. The indicators can be presented in the form of aggregated summaries (e.g., average number of afternoon snacks) or through detailed timeseries graphs, bar plots and other visualizations. Such an example visualization, from the SPLENDID dietary monitoring system, is shown in Figure 5.

In the SPLENDID project this approach was used in a series of studies with the chewing sensor (van den Boer et al. (2018)) to (a) support sensor development, (b) assess its usefulness and acceptance by end-users and health professionals and (c) evaluate the feasibility of use in real-world settings. In a study where 20 overweight young adults used the chewing sensor integrated prototype for 4 weeks, it was found that the sensor was useful, but there are important usability limitations, especially when it comes to long-term use. For example users reported that the cable of the prototype was inconvenient, that the sensor was conspicuous (and thus users avoided its use in a social context), while its use for several hours was uncomfortable. Today, wireless earbuds housing an integrated microphone, such as the ones shown in Figure 1 are commercially available, and therefore several of these drawbacks have already been addressed.
Impact summary
Use of the proposed sensors by patients in free-living conditions allows improved, objective monitoring by clinicians, who can identify unhealthy behaviors (such as excessive snacking, constant eating, increased eating speed) and provide targeted recommendations.
5.3 Use for policy decision support
The proposed algorithms can work with “off-the-shelf” devices sold commercially, such as smartwatches and wireless earbuds. This enables their large-scale use, at population level, to support health policy decisions. As a motivating example, imagine a local health authority that wants to address the increasing obesity prevalence in the young population, through interventions in the local urban environment and through regulation of fast food restaurants in the city (e.g., by limiting the number of permits close to schools). Ideally, these decisions should be supported by evidence on the effectiveness of these interventions, (a) to ensure that resources are well allocated, and (b) to provide quantifiable arguments in support of the interventions.
To achieve this, the health authorities invite citizens to participate in a one-month study (possibly providing incentives) by installing a mobile app. The mobile app should not send any raw, personally identifiable data to the authorities (e.g., by extracting indicators at the individual’s mobile phone), while at the same time providing valuable information about the association of individual’s behavior with the local environment.
Use of intake monitoring combined with location in this scenario can provide answers to questions related to the eating behavior of individuals with respect to their environment. For example, it could answer questions, such as “where do children have their main meals? In the school, at restaurants, or at home?”, or “How much do they eat when visiting restaurants and cafeterias close to school?”, “Do they eat multiple snacks at or around school?”, “Is their behavior significantly different when they eating at home versus eating outside?” Note that to answer such questions, one does not need to send the exact locations visited by the individuals. It is possible to only send behavior indicator statistics about the different location types (e.g., “school”, “home”, “cafe”, “restaurant”), without specifying where these locations are.
A similar approach was followed in the BigO project (Filos et al. (2021); Diou et al. (2020)), in which approximately 4000 children and adolescent participants used their mobile phones to measure physical activity behavior, as well as statistics related to visits to various location types. The intake information provided by the users of BigO was only based on pictures and self-reports, but would have been much richer if the proposed intake measurement methods had also been applied.
Impact summary
The proposed intake behavior measurement methods can be applied at population level with equipment that is currently commercially available at low cost. It is therefore possible to collect detailed evidence about determinants of the urban and socioeconomic environment on eating habits, as well as on the effectiveness of policies and interventions to improve population health.
5.4 Current barriers and future research directions
Objective, passive and continuous food intake monitoring methods show significant promise in improving the amount and quality of data produced for the purposes of research, patient guidance and policy decision support. On the other hand, with the current state of the art there are still significant obstacles that need to be overcome in order to facilitate further deployment of these technologies in practice.
Among the barriers, the most important ones include user acceptance, compliance and deployment with existing hardware and operating systems. Acceptance is both related to user comfort, as well as what is socially acceptable. For example, the experimental integrated prototype of the chewing sensor was not well-received outside the home environment, since it was not fully incospicuous and could raise questions among young peers. The development of more acceptable devices such as smartwatches that look like regular watches, or wireless earbuds with integrated microphones, will hopefully improve user acceptance.
Acceptance is a prerequisite for compliance, but is not sufficient. Compliance depends on additional factors, such as the effect of the algorithms on battery duration as well as the users remembering to wear the devices when instructed. Differences in compliance introduce challenges in the analysis of the data, since only partial measurements are available for each user during the day. Drawing reliable inferences about the behavior of individuals in the presence of such types of “missing data” is one important current research problem.
Finally, in the cases where “off-the-shelf” equipment is used to support the use-cases outlined above, the restrictions imposed by the vendors’ operating system may introduce significant difficulties in the implementation and deployment of intake monitoring applications. For example, the operating system may not provide access to raw accelerometer or gyroscope signals, or it may forcefully stop applications that perform processing of the signals. These are technical restrictions that result from the fact that commercially available devices (mobile phones, smartwatches) have not been designed for continuous data collection. We believe that as the benefits of such data acquisition functionalities become more apparent, it will become easier to implement and deploy monitoring applications for real-world use cases.
6 Conclusions
In this paper we have presented a high-level overview of methods for objective food intake monitoring with commercially available - and usable - sensors. We have provided an overview of recent work performed by our group, along with results demonstrating the effectiveness compared to baseline methods. We have also discussed various use-cases, benefits and limitations of such intake monitoring systems. Our overall aim has been to inform readers regarding what is possible when off-the-shelf sensors are combined with algorithms based on modern machine learning methods.
It was shown that by using an off-the-shelf smartwatch it is possible to acquire highly accurate detection of intake moments during a meal, reaching an F1 score of over . This approach can be extended to detect meals, reaching an F1 score of and an accuracy of (weighted accuracy of ) in the FreeFIC dataset. Meal detection results are worse in the ACE dataset ( weighted accuracy when including snacks, for main meals), however they can still be considered satisfactory. Potential drawbacks of the smartwatch methods include the need for wearing the smartwatch on the wrist that is used to transfer food to the mouth, as well as the fact that the algorithm needs to constantly record the accelerometer as well as the gyroscope signal. Finally, most meals in the training and evaluation datasets have been performed using a fork or spoon and a knife.
Regarding chewing detection, we showed that using a combination of signals (audio, PPG and accelerometer) can lead to accurate detection of chews using a combination of frequency and time domain features and a decision fusion mechanism. Results on a challenging real-world dataset with over 60 hours of recordings showed that the method achieved a weighted accuracy of . Using the audio signal only, after representation learning with a deep convolutional neural network achieved even better results, reaching a weighted accuracy of . Importantly, it was shown that this approach also works with recent self-supervised learning methods, which can learn useful representations of the chewing signals without the use of labeled examples for model training. These results are important, not only with respect to their effectiveness, but because in-ear microphones are now available in several commercial wireless earbuds, allowing these methods to be deployed using inexpensive, off-the-shelf devices. The largest challenge for this family of methods remains usability and compliance, since users will inevitably wear their earbuds only for a part of the day. Methods for estimating intake behavior when only a subset of the data is available is still a subject of ongoing research.
During the last years, we have also used these methods for a number of applications, including research on intake behavior for patients with Parkinson’s Disease, dietary monitoring of individuals with overweight or obesity, as well as population monitoring for developing targeted policies against obesity. These use-cases revealed that there are still many difficulties to overcome when using these methods in operational environments, including technical/equipment difficulties, usability, user compliance as well as the analysis and interpretation of results. On the other hand, these challenges highlight new opportunities for future research, that we believe will bring intake monitoring methods to the everyday practice.
Acknowledgements
The work leading to these results has received funding from the European Commission under projects SPLENDID (Grant Agreement No. 610746, 01/10/2013-30/09/2016), BigO (Grant Agreement No. 27688, 01/12/2016 - 30/11/2020), iPrognosis (Grant Agreement No. 690494, 01/02/2016 - 31/01/2020) and REBECCA (Grant Agreement No. 965231, 01/04/2021 - 31/03/2025).
References
- Amft et al. (2005a) Amft, O., Junker, H., Troster, G., 2005a. Detection of eating and drinking arm gestures using inertial body-worn sensors, in: Ninth IEEE international symposium on wearable computers (ISWC’05), IEEE. pp. 160–163.
- Amft et al. (2009) Amft, O., Kusserow, M., Troster, G., 2009. Bite weight prediction from acoustic recognition of chewing. IEEE Transactions on Biomedical Engineering 56, 1663–1672. doi:10.1109/TBME.2009.2015873.
- Amft et al. (2005b) Amft, O., Stäger, M., Lukowicz, P., Tröster, G., 2005b. Analysis of chewing sounds for dietary monitoring, in: Beigl, M., Intille, S., Rekimoto, J., Tokuda, H. (Eds.), UbiComp 2005: Ubiquitous Computing, Springer Berlin Heidelberg, Berlin, Heidelberg. pp. 56–72.
- Amft and Troster (2009) Amft, O., Troster, G., 2009. On-body sensing solutions for automatic dietary monitoring. IEEE Pervasive Computing 8, 62–70. doi:10.1109/MPRV.2009.32.
- Anderez et al. (2020) Anderez, D.O., Lotfi, A., Pourabdollah, A., 2020. Eating and drinking gesture spotting and recognition using a novel adaptive segmentation technique and a gesture discrepancy measure. Expert Systems with Applications 140, 112888.
- Anthimopoulos et al. (2014) Anthimopoulos, M.M., Gianola, L., Scarnato, L., Diem, P., Mougiakakou, S.G., 2014. A food recognition system for diabetic patients based on an optimized bag-of-features model. IEEE journal of biomedical and health informatics 18, 1261–1271.
- Archer et al. (2013) Archer, E., Hand, G.A., Blair, S.N., 2013. Validity of us nutritional surveillance: National health and nutrition examination survey caloric energy intake data, 1971–2010. PloS one 8, e76632.
- Bi et al. (2018) Bi, S., Wang, T., Tobias, N., Nordrum, J., Wang, S., Halvorsen, G., Sen, S., Peterson, R., Odame, K., Caine, K., Halter, R., Sorber, J., Kotz, D., 2018. Auracle: Detecting eating episodes with an ear-mounted sensor. Proc. ACM Interact. Mob. Wearable Ubiquitous Technol. 2. URL: https://doi.org/10.1145/3264902, doi:10.1145/3264902.
- Bi et al. (2016) Bi, Y., Lv, M., Song, C., Xu, W., Guan, N., Yi, W., 2016. Autodietary: A wearable acoustic sensor system for food intake recognition in daily life. IEEE Sensors Journal 16, 806–816. doi:10.1109/JSEN.2015.2469095.
- Bingham (1991) Bingham, S.A., 1991. Limitations of the various methods for collecting dietary intake data. Annals of Nutrition and Metabolism 35, 117–127.
- van den Boer et al. (2018) van den Boer, J., van der Lee, A., Zhou, L., Papapanagiotou, V., Diou, C., Delopoulos, A., Mars, M., 2018. The splendid eating detection sensor: Development and feasibility study. JMIR Mhealth Uhealth 6, e170. URL: http://mhealth.jmir.org/2018/9/e170/, doi:10.2196/mhealth.9781.
- Cho and Choi (2018) Cho, J., Choi, A., 2018. Asian-style food intake pattern estimation based on convolutional neural network, in: 2018 IEEE International Conference on Consumer Electronics (ICCE), IEEE. pp. 1–2.
- Christodoulidis et al. (2015) Christodoulidis, S., Anthimopoulos, M., Mougiakakou, S., 2015. Food recognition for dietary assessment using deep convolutional neural networks, in: International Conference on Image Analysis and Processing, Springer. pp. 458–465.
- Diou et al. (2020) Diou, C., Sarafis, I., Papapanagiotou, V., Alagialoglou, L., Lekka, I., Filos, D., Stefanopoulos, L., Kilintzis, V., Maramis, C., Karavidopoulou, Y., et al., 2020. Bigo: A public health decision support system for measuring obesogenic behaviors of children in relation to their local environment, in: 2020 42nd Annual International Conference of the IEEE Engineering in Medicine & Biology Society (EMBC), IEEE. pp. 5864–5867.
- Dong et al. (2011) Dong, Y., Hoover, A., Scisco, J., Muth, E., 2011. Detecting eating using a wrist mounted device during normal daily activities, in: Proceedings of the International Conference on Embedded Systems, Cyber-physical Systems, and Applications (ESCS), The Steering Committee of The World Congress in Computer Science, Computer …. p. 1.
- Dong et al. (2012) Dong, Y., Hoover, A., Scisco, J., Muth, E., 2012. A new method for measuring meal intake in humans via automated wrist motion tracking. Applied psychophysiology and biofeedback 37, 205–215.
- Dong et al. (2013) Dong, Y., Scisco, J., Wilson, M., Muth, E., Hoover, A., 2013. Detecting periods of eating during free-living by tracking wrist motion. IEEE journal of biomedical and health informatics 18, 1253–1260.
- Filos et al. (2021) Filos, D., Lekka, I., Kilintzis, V., Stefanopoulos, L., Karavidopoulou, Y., Maramis, C., Diou, C., Sarafis, I., Papapanagiotou, V., Alagialoglou, L., et al., 2021. Exploring associations between children’s obesogenic behaviors and the local environment using big data: Development and evaluation of the obesity prevention dashboard. JMIR mHealth and uHealth 9, e26290.
- Fontana et al. (2014) Fontana, J.M., Farooq, M., Sazonov, E., 2014. Automatic ingestion monitor: A novel wearable device for monitoring of ingestive behavior. IEEE Transactions on Biomedical Engineering 61, 1772–1779. doi:10.1109/TBME.2014.2306773.
- Gao et al. (2016) Gao, Y., Zhang, N., Wang, H., Ding, X., Ye, X., Chen, G., Cao, Y., 2016. ihear food: Eating detection using commodity bluetooth headsets, in: 2016 IEEE First International Conference on Connected Health: Applications, Systems and Engineering Technologies (CHASE), pp. 163–172. doi:10.1109/CHASE.2016.14.
- Hadjidimitriou et al. (2016) Hadjidimitriou, S., Charisis, V., Kyritsis, K., Konstantinidis, E., Delopoulos, A., Bamidis, P., Bostantjopoulou, S., Rizos, A., Trivedi, D., Chaudhuri, R., et al., 2016. Active and healthy ageing for parkinson’s disease patients’ support: A user’s perspective within the i-prognosis framework, in: 2016 1st International Conference on Technology and Innovation in Sports, Health and Wellbeing (TISHW), IEEE. pp. 1–8.
- Heydarian et al. (2021) Heydarian, H., Adam, M.T., Burrows, T., Rollo, M.E., 2021. Exploring score-level and decision-level fusion of inertial and video data for intake gesture detection. IEEE Access .
- Ioakimidis et al. (2009) Ioakimidis, I., Zandian, M., Bergh, C., Södersten, P., 2009. A method for the control of eating rate: a potential intervention in eating disorders. Behavior research methods 41, 755–760.
- Jia et al. (2019) Jia, W., Li, Y., Qu, R., Baranowski, T., Burke, L.E., Zhang, H., Bai, Y., Mancino, J.M., Xu, G., Mao, Z.H., et al., 2019. Automatic food detection in egocentric images using artificial intelligence technology. Public health nutrition 22, 1168–1179.
- Kim et al. (2012) Kim, H.J., Kim, M., Lee, S.J., Choi, Y.S., 2012. An analysis of eating activities for automatic food type recognition, in: Proceedings of The 2012 Asia Pacific Signal and Information Processing Association Annual Summit and Conference, IEEE. pp. 1–5.
- Kong and Tan (2012) Kong, F., Tan, J., 2012. Dietcam: Automatic dietary assessment with mobile camera phones. Pervasive and Mobile Computing 8, 147–163.
- Konstantinidis et al. (2020) Konstantinidis, D., Dimitropoulos, K., Langlet, B., Daras, P., Ioakimidis, I., 2020. Validation of a deep learning system for the full automation of bite and meal duration analysis of experimental meal videos. Nutrients 12, 209.
- Kyritsis et al. (2017a) Kyritsis, K., Diou, C., Delopoulos, A., 2017a. Food intake detection from inertial sensors using LSTM networks, in: International conference on image analysis and processing, Springer. pp. 411–418.
- Kyritsis et al. (2018) Kyritsis, K., Diou, C., Delopoulos, A., 2018. End-to-end learning for measuring in-meal eating behavior from a smartwatch, in: 2018 40th Annual International Conference of the IEEE Engineering in Medicine and Biology Society (EMBC), IEEE. pp. 5511–5514.
- Kyritsis et al. (2019a) Kyritsis, K., Diou, C., Delopoulos, A., 2019a. Detecting meals in the wild using the inertial data of a typical smartwatch, in: 2019 41st Annual International Conference of the IEEE Engineering in Medicine and Biology Society (EMBC), IEEE. pp. 4229–4232.
- Kyritsis et al. (2019b) Kyritsis, K., Diou, C., Delopoulos, A., 2019b. Modeling wrist micromovements to measure in-meal eating behavior from inertial sensor data. IEEE journal of biomedical and health informatics 23, 2325–2334.
- Kyritsis et al. (2020) Kyritsis, K., Diou, C., Delopoulos, A., 2020. A data driven end-to-end approach for in-the-wild monitoring of eating behavior using smartwatches. IEEE Journal of Biomedical and Health Informatics 25, 22–34.
- Kyritsis et al. (2021) Kyritsis, K., Fagerberg, P., Ioakimidis, I., Chaudhuri, K.R., Reichmann, H., Klingelhoefer, L., Delopoulos, A., 2021. Assessment of real life eating difficulties in parkinson’s disease patients by measuring plate to mouth movement elongation with inertial sensors. Scientific Reports 11, 1–14.
- Kyritsis et al. (2017b) Kyritsis, K., Tatli, C.L., Diou, C., Delopoulos, A., 2017b. Automated analysis of in meal eating behavior using a commercial wristband IMU sensor, in: 2017 39th Annual International Conference of the IEEE Engineering in Medicine and Biology Society (EMBC), IEEE. pp. 2843–2846.
- Llewellyn et al. (2008) Llewellyn, C.H., Van Jaarsveld, C.H., Boniface, D., Carnell, S., Wardle, J., 2008. Eating rate is a heritable phenotype related to weight in children. The American journal of clinical nutrition 88, 1560–1566.
- Lu et al. (2020) Lu, Y., Stathopoulou, T., Vasiloglou, M.F., Pinault, L.F., Kiley, C., Spanakis, E.K., Mougiakakou, S., 2020. gofoodtm: An artificial intelligence system for dietary assessment. Sensors 20. URL: https://www.mdpi.com/1424-8220/20/15/4283, doi:10.3390/s20154283.
- Maramis et al. (2014) Maramis, C., Diou, C., Ioakeimidis, I., Lekka, I., Dudnik, G., Mars, M., Maglaveras, N., Bergh, C., Delopoulos, A., 2014. Preventing obesity and eating disorders through behavioural modifications: The splendid vision, in: 2014 4th International Conference on Wireless Mobile Communication and Healthcare-Transforming Healthcare Through Innovations in Mobile and Wireless Technologies (MOBIHEALTH), IEEE. pp. 7–10.
- Maramis et al. (2019) Maramis, C., Ioakimidis, I., Kilintzis, V., Stefanopoulos, L., Lekka, E., Papapanagiotou, V., Diou, C., Delopoulos, A., Kassari, P., Charmandari, E., Maglaveras, N., 2019. Developing a novel citizen-scientist smartphone app for collecting behavioral and affective data from children populations, in: MOBIHEALTH, IEEE.
- Mirtchouk et al. (2017) Mirtchouk, M., Lustig, D., Smith, A., Ching, I., Zheng, M., Kleinberg, S., 2017. Recognizing eating from body-worn sensors: Combining free-living and laboratory data. Proceedings of the ACM on Interactive, Mobile, Wearable and Ubiquitous Technologies 1, 1–20.
- Papadopoulos et al. (2018) Papadopoulos, A., Kyritsis, K., Sarafis, I., Delopoulos, A., 2018. Personalised meal eating behaviour analysis via semi-supervised learning, in: 2018 40th Annual International Conference of the IEEE Engineering in Medicine and Biology Society (EMBC), IEEE. pp. 4768–4771.
- Papapanagiotou et al. (2021a) Papapanagiotou, V., Diou, C., van den Boer, J., Mars, M., Delopoulos, A., 2021a. Recognition of food-texture attributes using an in-ear microphone, in: Del Bimbo, A., Cucchiara, R., Sclaroff, S., Farinella, G.M., Mei, T., Bertini, M., Escalante, H.J., Vezzani, R. (Eds.), Pattern Recognition. ICPR International Workshops and Challenges, Springer International Publishing, Cham. pp. 558–570.
- Papapanagiotou et al. (2017a) Papapanagiotou, V., Diou, C., Delopoulos, A., 2017a. Chewing detection from an in-ear microphone using convolutional neural networks, in: 2017 39th Annual International Conference of the IEEE Engineering in Medicine and Biology Society (EMBC), pp. 1258–1261. doi:10.1109/EMBC.2017.8037060.
- Papapanagiotou et al. (2021b) Papapanagiotou, V., Diou, C., Delopoulos, A., 2021b. Self-supervised feature learning of 1d convolutional neural networks with contrastive loss for eating detection using an in-ear microphone. arXiv:2108.00769.
- Papapanagiotou et al. (2015) Papapanagiotou, V., Diou, C., Lingchuan, Z., van den Boer, J., Mars, M., Delopoulos, A., 2015. Fractal nature of chewing sounds, in: Murino, V., Puppo, E., Sona, D., Cristani, M., Sansone, C. (Eds.), New Trends in Image Analysis and Processing – ICIAP 2015 Workshops, Springer International Publishing, Cham. pp. 401–408.
- Papapanagiotou et al. (2016) Papapanagiotou, V., Diou, C., Zhou, L., van den Boer, J., Mars, M., Delopoulos, A., 2016. A novel approach for chewing detection based on a wearable ppg sensor, in: 2016 38th Annual International Conference of the IEEE Engineering in Medicine and Biology Society (EMBC), pp. 6485–6488. doi:10.1109/EMBC.2016.7592214.
- Papapanagiotou et al. (2017b) Papapanagiotou, V., Diou, C., Zhou, L., van den Boer, J., Mars, M., Delopoulos, A., 2017b. A novel chewing detection system based on ppg, audio, and accelerometry. IEEE Journal of Biomedical and Health Informatics 21, 607–618. doi:10.1109/JBHI.2016.2625271.
- Papapanagiotou et al. (2017c) Papapanagiotou, V., Diou, C., Zhou, L., van den Boer, J., Mars, M., Delopoulos, A., 2017c. The splendid chewing detection challenge, in: 2017 39th Annual International Conference of the IEEE Engineering in Medicine and Biology Society (EMBC), pp. 817–820. doi:10.1109/EMBC.2017.8036949.
- Papapanagiotou et al. (2021c) Papapanagiotou, V., Ganotakis, S., Delopoulos, A., 2021c. Bite-weight estimation using commercial ear buds. arXiv:2108.00771.
- Päßler and Fischer (2012) Päßler, S., Fischer, W.J., 2012. Evaluation of algorithms for chew event detection, in: Proceedings of the 7th International Conference on Body Area Networks, ICST (Institute for Computer Sciences, Social-Informatics and Telecommunications Engineering), Brussels, BEL. p. 20–26.
- Puri et al. (2009) Puri, M., Zhu, Z., Yu, Q., Divakaran, A., Sawhney, H., 2009. Recognition and volume estimation of food intake using a mobile device, in: 2009 Workshop on Applications of Computer Vision (WACV), IEEE. pp. 1–8.
- Päßler and Fischer (2014) Päßler, S., Fischer, W.J., 2014. Food intake monitoring: Automated chew event detection in chewing sounds. IEEE Journal of Biomedical and Health Informatics 18, 278–289. doi:10.1109/JBHI.2013.2268663.
- Qiu et al. (2020) Qiu, J., Lo, F.P.W., Jiang, S., Tsai, Y.Y., Sun, Y., Lo, B., 2020. Counting bites and recognizing consumed food from videos for passive dietary monitoring. IEEE Journal of Biomedical and Health Informatics 25, 1471–1482.
- Raju and Sazonov (2019) Raju, V., Sazonov, E., 2019. Processing of egocentric camera images from a wearable food intake sensor, in: 2019 SoutheastCon, IEEE. pp. 1–6.
- Rouast and Adam (2019) Rouast, P.V., Adam, M.T., 2019. Learning deep representations for video-based intake gesture detection. IEEE journal of biomedical and health informatics 24, 1727–1737.
- Rouast and Adam (2020) Rouast, P.V., Adam, M.T., 2020. Single-stage intake gesture detection using ctc loss and extended prefix beam search. arXiv preprint arXiv:2008.02999 .
- Sazonov and Fontana (2012) Sazonov, E.S., Fontana, J.M., 2012. A sensor system for automatic detection of food intake through non-invasive monitoring of chewing. IEEE Sensors Journal 12, 1340–1348. doi:10.1109/JSEN.2011.2172411.
- Sharma et al. (2016) Sharma, S., Jasper, P., Muth, E., Hoover, A., 2016. Automatic detection of periods of eating using wrist motion tracking, in: 2016 IEEE First International Conference on Connected Health: Applications, Systems and Engineering Technologies (CHASE), IEEE. pp. 362–363.
- Smit et al. (2011) Smit, H.J., Kemsley, E.K., Tapp, H.S., Henry, C.J.K., 2011. Does prolonged chewing reduce food intake? fletcherism revisited. Appetite 57, 295–298.
- Thomaz et al. (2017) Thomaz, E., Bedri, A., Prioleau, T., Essa, I., Abowd, G.D., 2017. Exploring symmetric and asymmetric bimanual eating detection with inertial sensors on the wrist, in: Proceedings of the 1st Workshop on Digital Biomarkers, pp. 21–26.
- Thomaz et al. (2015) Thomaz, E., Essa, I., Abowd, G.D., 2015. A practical approach for recognizing eating moments with wrist-mounted inertial sensing, in: Proceedings of the 2015 ACM international joint conference on pervasive and ubiquitous computing, pp. 1029–1040.
- Tuğtekin Turan and Erzin (2018) Tuğtekin Turan, M., Erzin, E., 2018. Detection of food intake events from throat microphone recordings using convolutional neural networks, in: 2018 IEEE International Conference on Multimedia Expo Workshops (ICMEW), pp. 1–6. doi:10.1109/ICMEW.2018.8551492.
- Wansink and Sobal (2007) Wansink, B., Sobal, J., 2007. Mindless eating: The 200 daily food decisions we overlook. Environment and Behavior 39, 106–123.
- Woda et al. (2006) Woda, A., Foster, K., Mishellany, A., Peyron, M.A., 2006. Adaptation of healthy mastication to factors pertaining to the individual or to the food. Physiology & Behavior 89, 28–35.
- Zandian et al. (2009) Zandian, M., Ioakimidis, I., Bergh, C., Södersten, P., 2009. Linear eaters turned decelerated: Reduction of a risk for disordered eating? Physiology & behavior 96, 518–521.
- Zhang et al. (2017) Zhang, S., Alharbi, R., Nicholson, M., Alshurafa, N., 2017. When generalized eating detection machine learning models fail in the field, in: Proceedings of the 2017 ACM International Joint Conference on Pervasive and Ubiquitous Computing and Proceedings of the 2017 ACM International Symposium on Wearable Computers, pp. 613–622.
- Zhang et al. (2016) Zhang, S., Alharbi, R., Stogin, W., Pourhomayun, M., Spring, B., Alshurafa, N., 2016. Food watch: Detecting and characterizing eating episodes through feeding gestures, in: Proceedings of the 11th EAI International Conference on Body Area Networks, pp. 91–96.
- Zhu et al. (2011) Zhu, F., Bosch, M., Khanna, N., Boushey, C.J., Delp, E.J., 2011. Multilevel segmentation for food classification in dietary assessment, in: 2011 7th International Symposium on Image and Signal Processing and Analysis (ISPA), IEEE. pp. 337–342.
- Zhu et al. (2010) Zhu, F., Bosch, M., Woo, I., Kim, S., Boushey, C.J., Ebert, D.S., Delp, E.J., 2010. The use of mobile devices in aiding dietary assessment and evaluation. IEEE journal of selected topics in signal processing 4, 756–766.