New Strong Gravitational Lenses from the DESI Legacy Imaging Surveys Data Release 9
Abstract
We have conducted a search for strong gravitational lensing systems in the Dark Energy Spectroscopic Instrument (DESI) Legacy Imaging Surveys Data Release 9. This is the third paper in a series (following Huang et al., 2020, 2021, Paper I & II, respectively). These surveys together cover 19,000 deg2 visible from the northern hemisphere, reaching a -band AB magnitude of . We use a deep residual neural network, trained on a compilation of known lensing systems and high grade candidates as well as non-lenses in the same footprint. After applying our trained neural network to the survey data, we visually inspect and rank images with probabilities above a threshold. We have found 1895 lens candidates, of which 1512 are identified for the first time. Combining the discoveries from this work with those from Paper I (335) and II (1210), we have discovered a total of 3057 new candidates in the Legacy Surveys.
1 Introduction
Strong gravitational lensing systems are a powerful tool for cosmology. They have been used to study how dark matter is distributed in galaxies and clusters (e.g., Kochanek, 1991; Koopmans & Treu, 2002; Bolton et al., 2006; Koopmans et al., 2006; Bolton et al., 2008; Bradač et al., 2008; Huang et al., 2009; Grillo et al., 2015; Tessore et al., 2016; Shu et al., 2016, 2017), and are uniquely suited to probe substructure in cluster and galaxy scale lenses, as well as line-of-sight low-mass halos and test the predictions of the cold dark matter (CDM) model beyond the local universe (e.g., Vegetti & Koopmans, 2009; Vegetti et al., 2010, 2012; Hezaveh et al., 2016; Ritondale et al., 2019; Meneghetti et al., 2020; Çağan Şengül et al., 2021; Wagner-Carena et al., 2022). Multiply lensed supernovae (SNe) are ideal for measuring time delays and because of their well-characterized light curves, and in the case of Type Ia, with the added benefit of standardizable luminosity (Refsdal, 1964; Treu, 2010; Oguri & Marshall, 2010), provided microlensing can be accurately characterized (Yahalomi et al., 2017). Furthermore, lens models can be constructed after the SNe have faded (Ding et al., 2021). In the last decade, strongly lensed supernovae, both core-collapse (Kelly et al., 2015; Rodney et al., 2016) and Type Ia (Quimby et al., 2014; Goobar et al., 2017; Rodney et al., 2021; Goobar et al., 2022; Pierel et al., 2022; Chen et al., 2022) have been discovered. Very recently, Sheu et al. (2023) conducted a retrospective search for strongly lensed supernovae in the Dark Energy Spectroscopic Instrument (DESI) Legacy Imaging Surveys (Dey et al. 2019), and found seven promising candidates. Time-delay measurements from multiply imaged supernovae (e.g., Goldstein & Nugent, 2017; Shu et al., 2018; Goldstein et al., 2018a, b; Pierel & Rodney, 2019; Suyu et al., 2020; Huber et al., 2021), combined with measurements from distance ladders (e.g., Riess et al., 2019; Freedman et al., 2019, 2020; Riess et al., 2021) and lensed quasars (e.g., Suyu et al., 2010, 2013; Treu & Marshall, 2016; Bonvin et al., 2017; Wong et al., 2019; Millon et al., 2020; Birrer et al., 2020), can be an important test of the tension between measured locally and the value inferred from the Cosmic Microwave Background (CMB; Planck Collaboration et al., 2020). In addition, magnified (but not multiply-lensed) SNe Ia were identified (Patel et al., 2014; Nordin et al., 2014; Rubin et al., 2018) and used to test the lens models. Finally strong lensing systems can be used to constrain the properties of dark energy (e.g., Treu, 2010; Linder, 2016; Sharma & Linder, 2022).
The introduction of neural networks to identify gravitational lens candidates in imaging surveys has been transformative (e.g., Jacobs et al., 2017; Metcalf et al., 2018; Jacobs et al., 2019a, b; Cañameras et al., 2020, 2021). In our recent work, we discovered over 1500 new strong lenses (Huang et al., 2020, 2021, Paper I and II, respectively) in the DESI Legacy Imaging Surveys (Dey et al., 2019) by using residual neural networks trained on observed images.
In this paper, we present results from our third search for strong lenses in the Legacy Surveys, using Data Release 9 (DR9). We provide an overview of the observations in §2. In §3, we describe the construction of the training sample and our neural network model. New lens candidates are presented in §4. We discuss our discoveries in §5 and conclude in §6.
2 Observations
The Legacy Surveys is composed of three surveys: the Dark Energy Camera Legacy Survey (DECaLS), the Beijing-Arizona Sky Survey (BASS), and the Mayall -band Legacy Survey (MzLS). DECaLS is observed by the Dark Energy Camera (DECam; Flaugher et al., 2015) on the 4-m Blanco telescope, which covers deg2 of the sky in the range of . BASS/MzLS are observed in the and bands by the 90Prime camera (Williams et al., 2004) on the Bok 2.3-m telescope and in the -band by the Mosaic3 camera (Dey et al., 2016) on the 4-meter Mayall telescope. Together BASS/MzLS cover the same deg2 of the northern subregion of the Legacy Surveys. Data Release 9 (DR9) contains additional DECam data reprocessed from the Dark Energy Survey (DES; Dark Energy Survey Collaboration et al., 2016) for . This provides an additional deg2, resulting in a total footprint of deg2. The DECam surveys will hereafter be referred to in their entirety as DECaLS, within which we distinguish DES and non-DES regions. The Legacy Surveys is imaged with a median PSF depth of 22.5 AB mag in -band (22.6 AB mag for MzLS). The FWHMs for the delivered images are: (), 1.18′′ (), and 1.11′′ () for DECaLS; () and () for BASS; and () for MzLS.
The Tractor (Lang et al., 2016) is a forward modeling algorithm that performs probabilistic astronomical source detection and typing and constructs the source catalogs for the Legacy Surveys. Source extraction is done on pixel-level data, taking as input the individual images from multiple exposures in multiple bands, with different seeing in each. The Tractor treats the fitting process as a minimization problem. A detected source is retained if the initial penalized is improved by 25111For more details, see https://www.legacysurvey.org/dr9/description/. The Tractor models detected sources as the better of either a point source (“PSF”) or round exponential (“REX”) galaxy. A detected source can be further classified as de Vaucouleurs (DEV; Sérsic index ) or exponential (EXP; ) profile over REX/PSF if such a fit improves the by 9. The classification becomes a Sérsic profile (SER) with an improvement in the by another 9 over DEV/EXP. Earlier data releases included a composite (COMP) profile, which is no longer fit for in DR9.
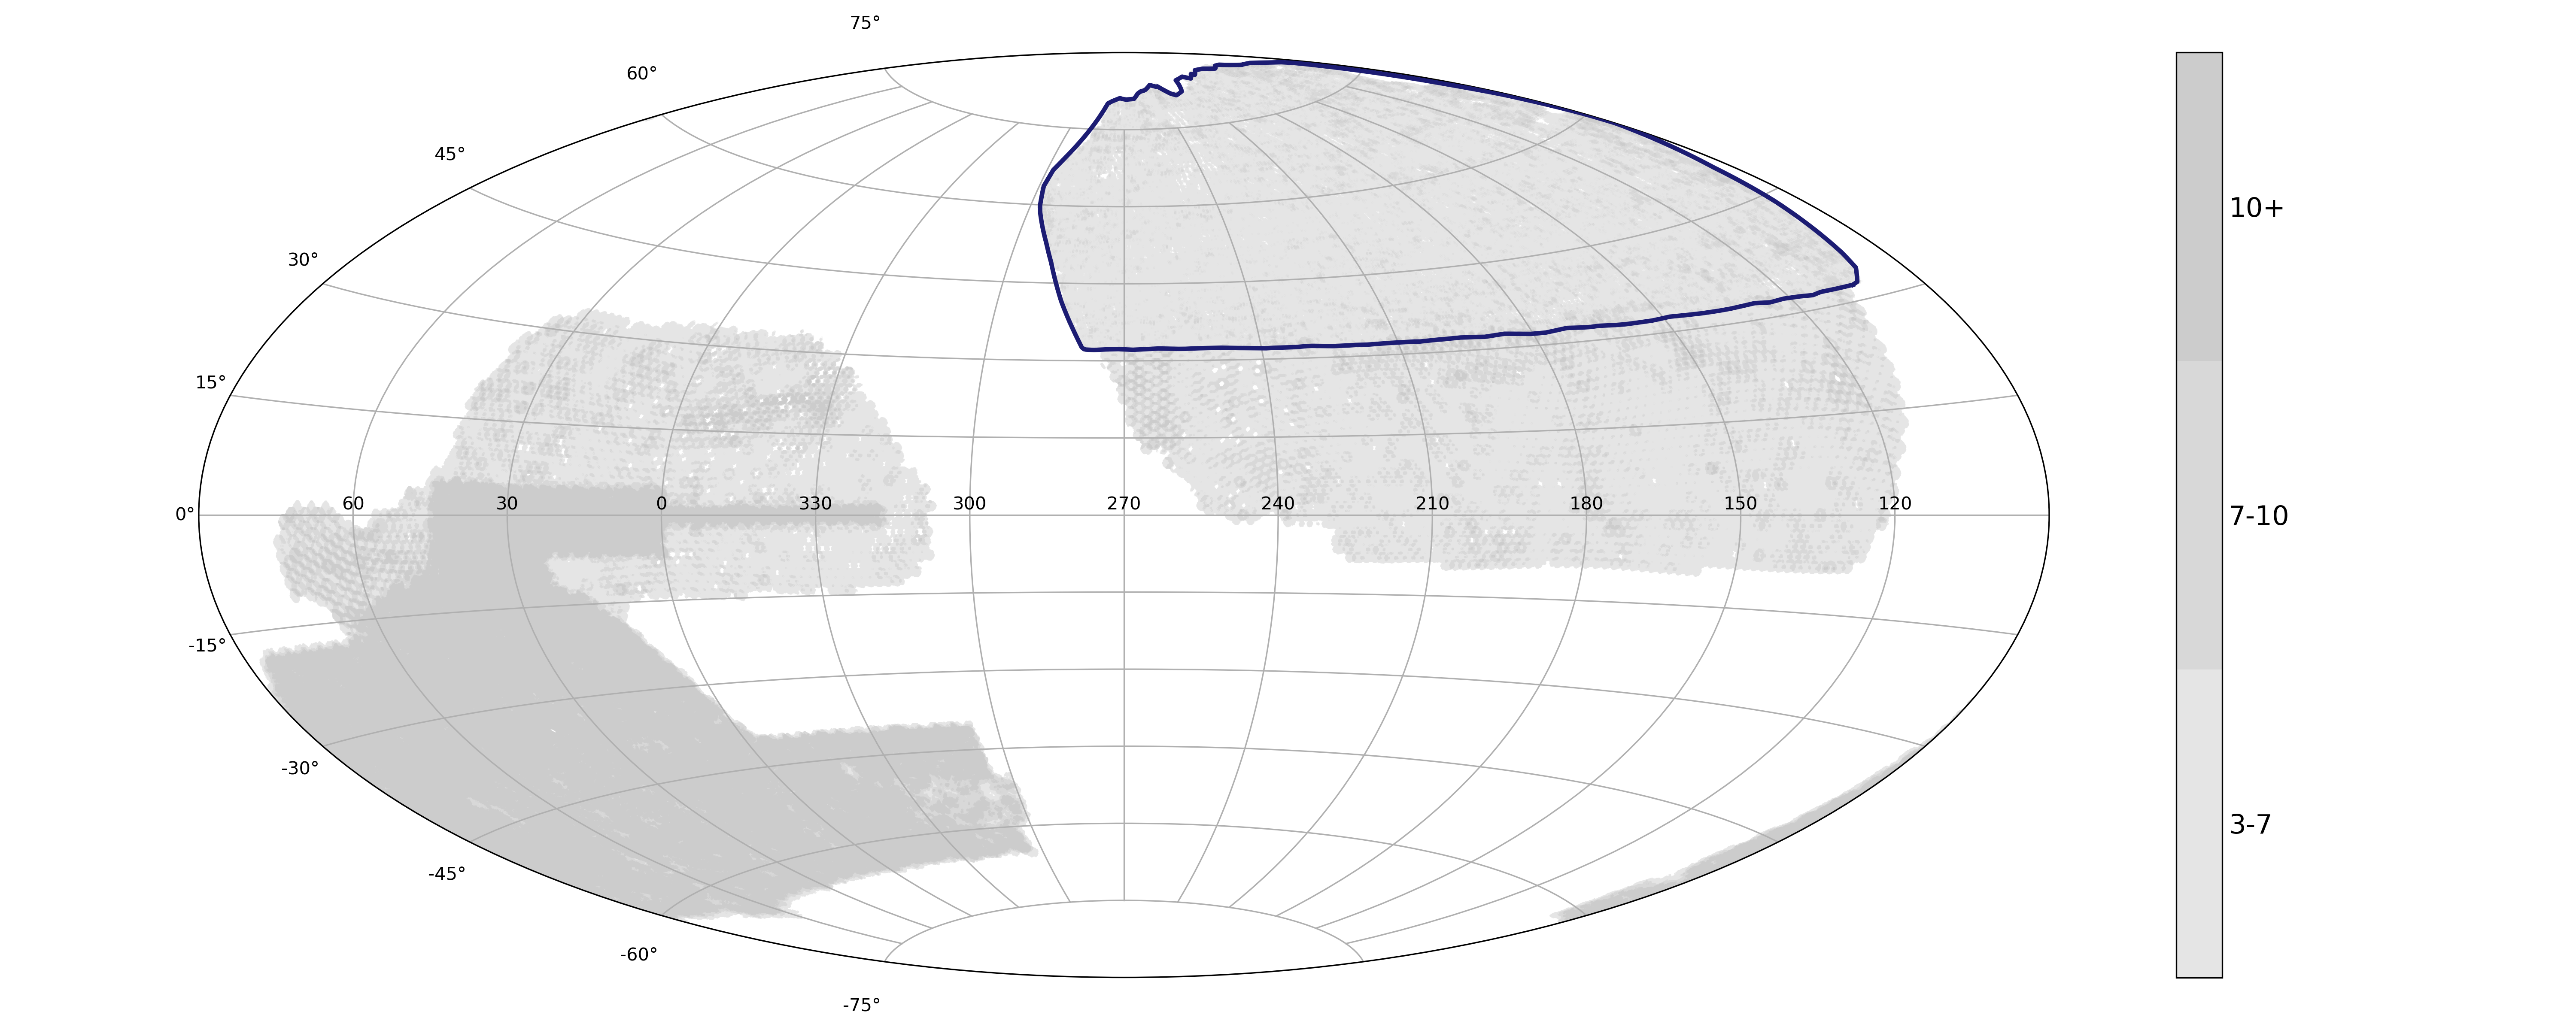
Figure 2 shows the depth map of -band observations in the Legacy Surveys DR9 by plotting the depth of objects typed as SER with mag. SER is the most common galaxy type in this magnitude regime. Table 1 shows the total counts for each galaxy type (SER, DEV, REX, and EXP) with mag for both the BASS/MzLS and DECaLS regions.
| The Tractor Type | SER | DEV | REX | EXP | Total by Region | ||
|---|---|---|---|---|---|---|---|
| BASS/MzLS | |||||||
| DECaLS | |||||||
| Total by Type | 45,262,252 |
3 The Training Sample and Neural Network Model
Convolutional neural networks (CNNs) have been very successful in identifying strong gravitational lenses in simulated and real imaging data. As in Papers I and II, we continue to use observed images of both lenses and non-lenses for training. In what follows, we describe our training sample (§3.1) and neural network model (§3.2).
3.1 Training Sample
The training sample contains 1961 lenses, the majority of which come from Paper I and II with the rest selected from Carrasco et al. (2017); Diehl et al. (2017); Pourrahmani et al. (2018); Sonnenfeld et al. (2018); Wong et al. (2018); Jacobs et al. (2017, 2019a, 2019b); Petrillo et al. (2019); Cañameras et al. (2020).
To date, systems have been confirmed via high-resolution imaging and/or spectroscopy (e.g., MasterLens; Moustakas et al., 2012). Thus, a large majority of the lens candidates in the training sample are not confirmed. Some of these candidates were found by searches conducted by other groups in various imaging surveys, using different search methods and criteria. To select the lenses for our training sample, we apply a uniform set of criteria (similar to those in Paper I and II) based solely on the Legacy Surveys images for these systems, regardless of where they were originally discovered. The locations of the selected systems are shown in Figure 3.1.
As in our previous searches, we apply cuts on the type (SER, DEV, or REX), magnitude ( mag), and depth (3 passes in , , and bands) of the objects included in the training sample. We find that the inclusion of objects fainter than 20.0 mag results in diminishing returns for the search. These same cuts are applied to images in the training sample and for deployment with the exception of images centered on EXP objects, which are included in deployment, but not in the training sample. To-date there are relatively few lens galaxies typed as EXP. However, low surface brightness, extended lensed source images are sometimes typed as EXP.
For the selection of non-lenses, for each type (SER, DEV, REX) and region (DECaLS, BASS/MzLS), we bin by the number of passes in -band. We then select non-lenses randomly, but keep the proportionality to the lenses the same in each bin ( 33:1). This is to prevent potential bias by the neural net based on the number of passes (see Paper II). This results in a total of 64,584 non-lenses in the training sample.
3.2 The Neural Network Model
The “shielded” residual network (ResNet) model, as described in Paper II, is an improvement upon the neural network architecture presented in Lanusse et al. (2018, L18). The “shielding” layers (Szegedy et al., 2014) perform 11 convolutions that reduce the dimensionality of the output from each ResNet block. This modification improved performance and shortened training time. During the training, the ResNet attempts to minimize the cross entropy loss function:
| (1) |
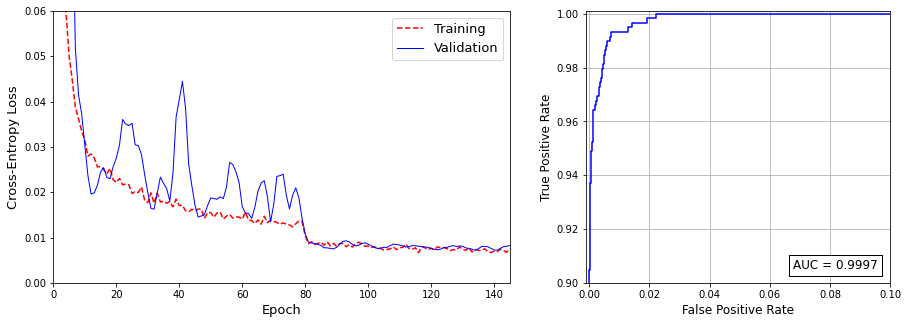
where is label for the th image (1 for lens and 0 for non-lens), is the model predicted probability, and is the number of images in one training step (the same as batch size, given below). In the training process, the “shielded” model outperformed the L18 model and thus we decide to exclusively use it in this work. We use a 7:3 split of the training sample to create the training and validation sets, respectively. We use an image cutout size of 101 pixel101 pixel (which translates to 2626′′), a batch size of 128, an initial learning rate of , a decay rate of 1/5, and a decay epoch at 80. The model is trained on Google Colab222https://colab.research.google.com/ using a graphics processing unit (GPU; NVIDIA Tesla P100). We trained our ResNet model for a total of 145 epochs (approximately 5 hours). Training beyond this point results in marginal gain in model performance (see Figure 3.2). In addition to the cross entropy loss, we further assess the performance of of our trained model by using the receiver operating characteristic (ROC). The ROC curve shows the True Positive Rate (TPR) vs. the False Positive Rate (FPR), where P(ositive) indicates a lens and N(egative), a non-lens. With the definitions True Positive (TP) = correctly identified as a lens, False Positive (FP) = incorrectly identified as a lens, True Negative (TN) = correctly rejected, and False Negative (FN) = incorrectly rejected,
and
Random classifications will result in a diagonal line in this space with an area under the ROC curve (or AUC) equal to 0.5, while for a perfect classifier, AUC = 1. The ROC curve for our best-performing model is also shown in Figure 3.2 for the validation set, with an AUC of 0.9997, an improvement over the training results from Paper II.
4 Results
In this section we present the lens candidates we have found in the Legacy Surveys. In §4.1, we present lens candidates found in DR9 (this work). In §4.2 we provide a summary of all lens candidates discovered by our group in the Legacy Surveys DR7, 8, and 9.
4.1 Lens Candidates in DR9
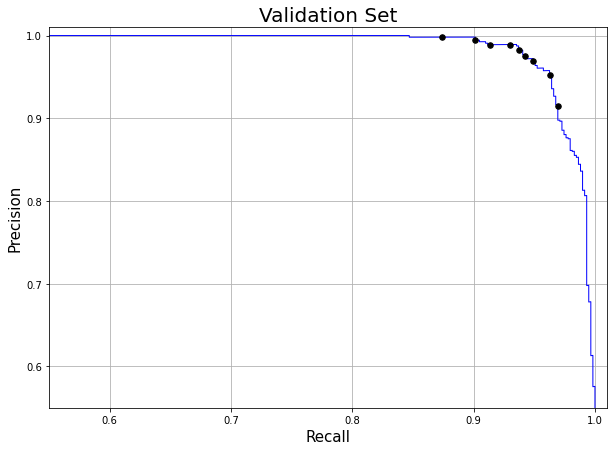
In this section we present the strong lens candidates discovered exclusively in Legacy Surveys DR9 from this work. To determine the probability threshold for human inspection, we consult the precision-recall curve (PRC), where precision = TP/(TP+FP) and recall = TP/(TP + FN), which is the same as TPR (§ 3).333As in Paper II, we recognize the redundancy in terminology. This results from fairly standard usage (e.g., recall or TPR depending on the context) and in part from the difference in terminology used in the fields of machine learning and astrophysics (“recall” or “completeness”, “precision” or “purity”).
Figure 4.1 shows the precision-recall curve (PRC) for our trained ResNet model for the validation set, with marked probability thresholds. The distribution of the probability thresholds on our PRC are tightly clustered near the “shoulder” of the curve, indicating a high level of performance. A perfect PRC curve would pass through (1,1) where these thresholds would converge. We consult the PRC to determine the probability threshold for inspection based on a reasonable trade-off between precision (purity) and recall (completeness). We select a probability threshold of 0.4, with the number of cutout images above this threshold 47,000. This is a reasonable number to inspect, comparable to those in Paper I and II. These cutouts with probability 0.4 will be referred to as the neural network “recommendations”.
For deployment, even though our ResNet model is trained on DEV, SER and REX, we expand our search to include galaxies with EXP profiles (as mentioned in §3.1). Thus we deploy the trained model on 45 million cutouts with passes in , , and -bands and centered on all non-PSF objects with -band mag . Subsequent inspection of the resulting recommendations was conducted considering the following criteria (same as in Paper I and II): small blue galaxy/galaxies (red galaxies are rare but certainly acceptable) next to a red galaxy/galaxies at the center that satisfy the following criteria:
-
•
are typically 1 - 5′′ away
-
•
have low surface brightness
-
•
curve toward the red galaxy/galaxies
-
•
have counter/multiple images with similar colors (especially in Einstein-cross like configuration)
-
•
are elongated (including semi- or nearly full rings)
Typically, most candidates do not have all these characteristics. In general, the greater the number of these characteristics an image has, the higher they are ranked by humans.
After an initial round of inspections, co-authors C.S. and X.H. independently examine all preliminary candidates. The grades are assigned as follows:
-
•
Grade A: We have a high level of confidence of these candidates. Many of them have one or more prominent arcs, usually blue. The rest have one or more clear arclets, sometimes arranged in multiple-image configurations with similar colors (again, typically blue). However, there are clear cases with red arcs.
-
•
Grade B: They have similar characteristics as the Grade A’s. Grade B giant arcs tend to be fainter than those for Grade A. Likewise, the putative arclets tend to be smaller and/or fainter, or isolated (without counter images).
-
•
Grade C: They generally have features that are even fainter and/or smaller than what is typical for Grade B candidates, but that are nevertheless suggestive of lensed arclets. Counter images are often not present or hardly discernible. In a number of cases, the angular scales of the candidate systems are comparable to or only slightly larger than the seeing. Therefore, for some of these candidates, to attain a higher level of certainty, higher spatial resolution, deeper data, or spectroscopic observations would be required.
We have found 1895 candidates, with 115 Grade A’s, 526 B’s, and 1254 C’s (Table 2). For the DEV and SER type galaxies in DECaLS we achieve a purity of 1 candidate in 23 ResNet recommendations. Though it is difficult to do a direct comparison given the change in The Tractor categorization, this seems to indicate an improvement over the purity of 1 in 31 reported in Paper II for DEV and COMP in DECaLS. Certainly, the overall purity of 1 in 25 recommendations is a clear improvement over Paper II (1 in ). The purity by type and region is shown in Table 3.
| Grade | A | B | C | Total by Type | ||
|---|---|---|---|---|---|---|
| SER | 68 (64, 4) | 309 (296, 13) | 650 (630, 20) | 1027 (990, 37) | ||
| DEV | 37 (32, 5) | 113 (108, 5) | 302 (283, 19) | 452 (423, 29) | ||
| REX | 6 (6, 0) | 65 (64, 1) | 224 (219, 5) | 295 (289, 6) | ||
| EXP | 4 (4, 0) | 39 (34, 5) | 78 (74, 4) | 121 (112, 9) | ||
| Total by Grade | 115 (106, 9) | 526 (504, 22) | 1254 (1206, 48) | 1895 (1814, 81) |
Note. — The numbers shown in the parenthesis correspond to the totals in DECaLS and BASS/MzLS (separated by a comma), respectively.
| The Tractor Type | SER | DEV | REX | EXP | Purity by Region | ||
|---|---|---|---|---|---|---|---|
| DECaLS | 23 | 21 | 25 | 38 | 24 | ||
| BASS/MzLS | 29 | 34 | 128 | 51 | 40 | ||
| Purity by Type | 23 | 22 | 27 | 39 | 25 |
Note. — Purities are shown as the number of ResNet recommendations inspected in order to find a lens candidate.
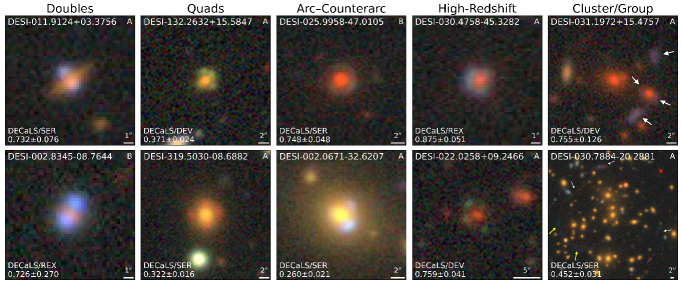
Of these, 125 were previously known lenses or candidates, and 258 were found in recent publications, the majority of which came from Stein et al. (2021, see §5). We therefore report 1512 new lens candidates, with 53 Grade A’s, 384 B’s, and 1075 C’s. We highlight in Figure 4.1 two examples each for five categories of new strong lens candidates that we have discovered. The positions of all new candidates on the sky are shown in Figure 4.1.
4.2 Lens Candidates in DR7, 8, and 9
From our three searches in the Legacy Surveys,
we have found a grand total of 3057 new candidates (Paper I: 335 in DR7 among DEV and COMP in DECaLS only, Paper II: 1210 in DR8, this work: 1512 in DR9).
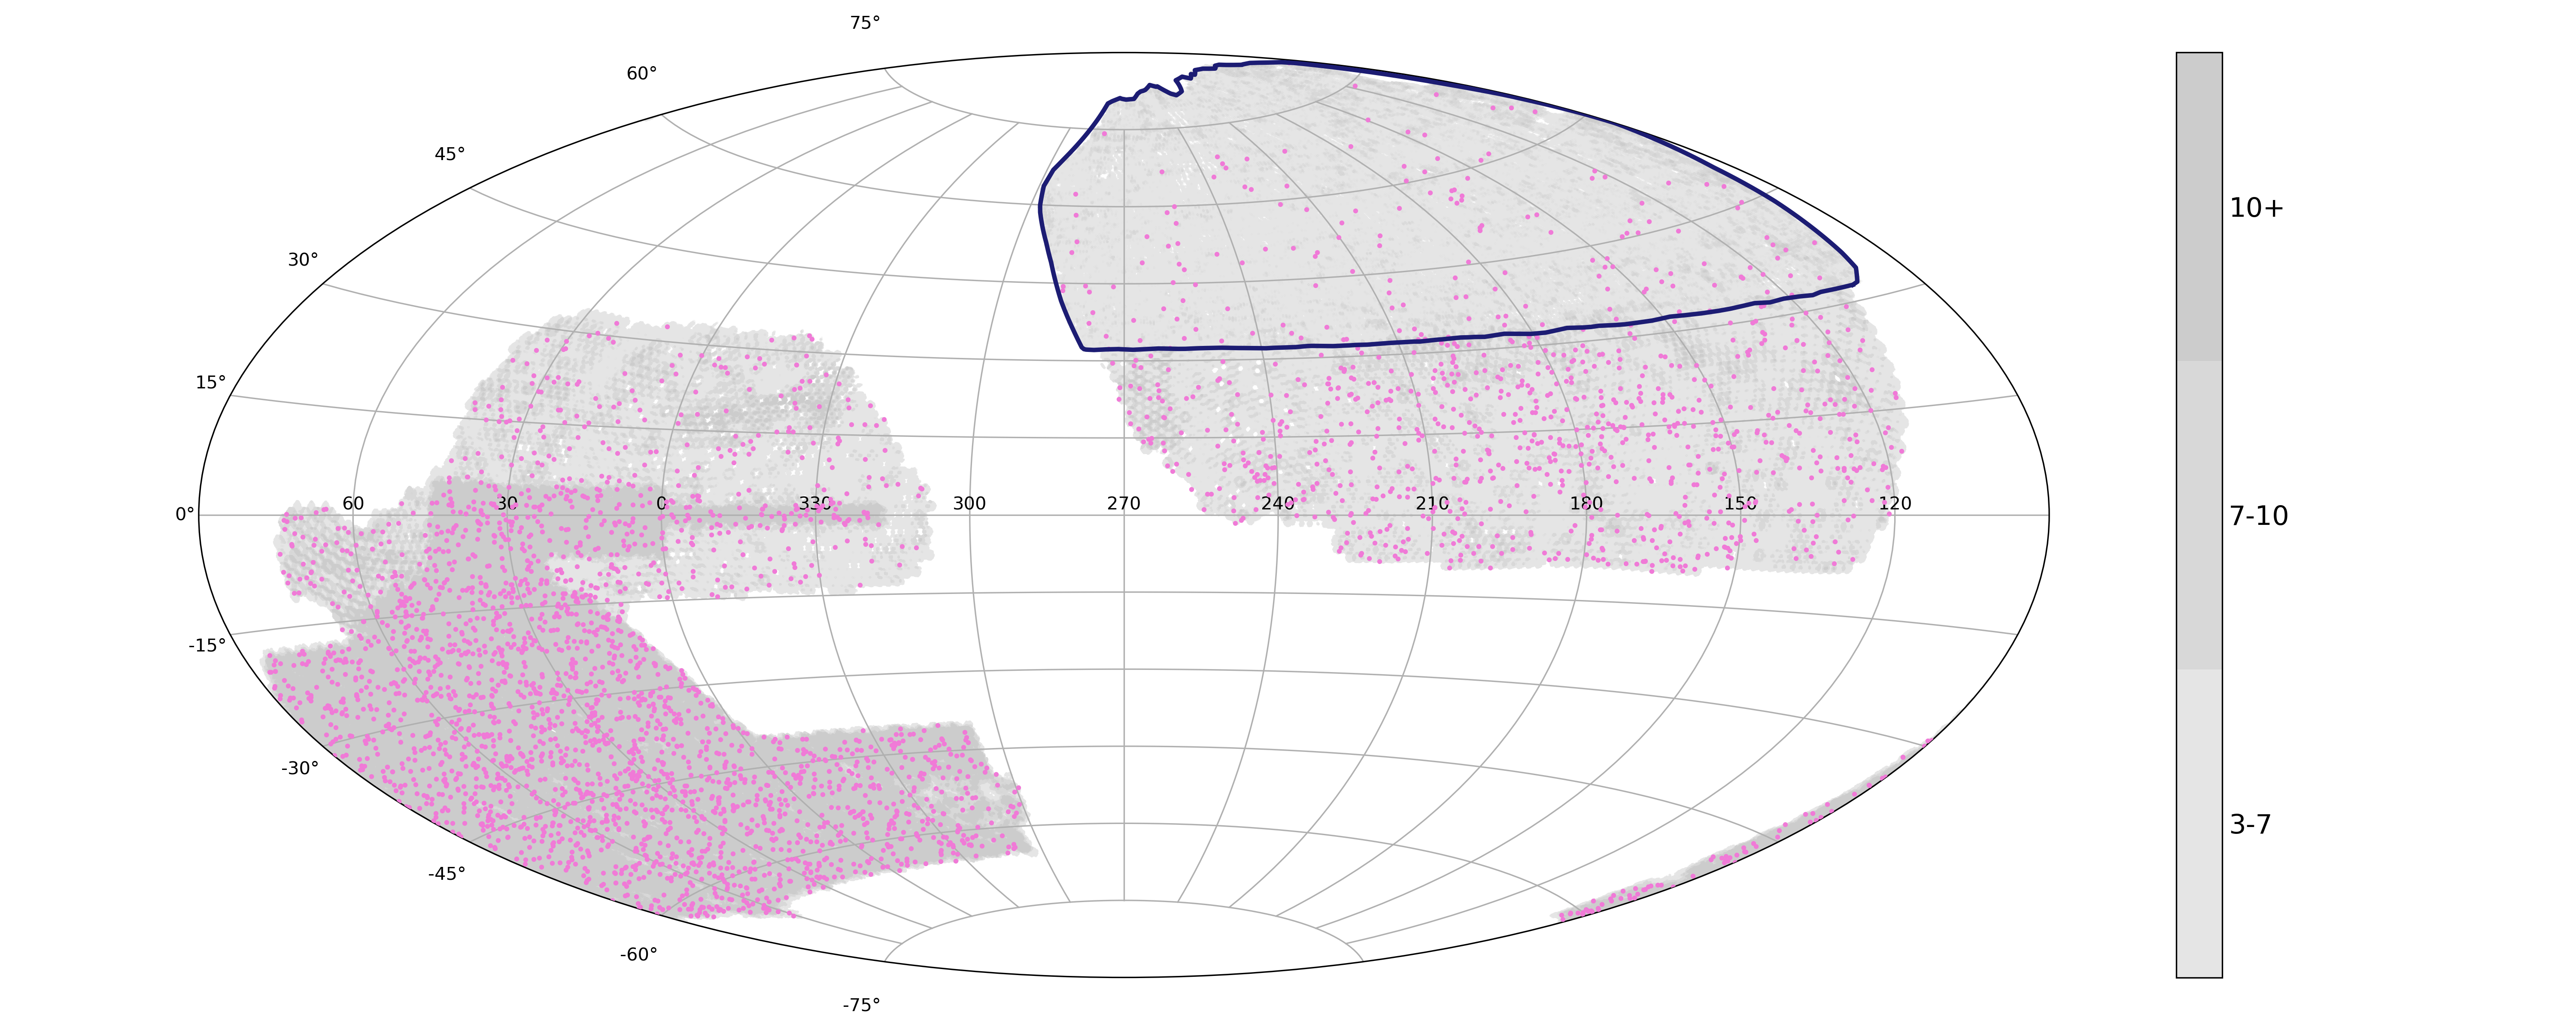
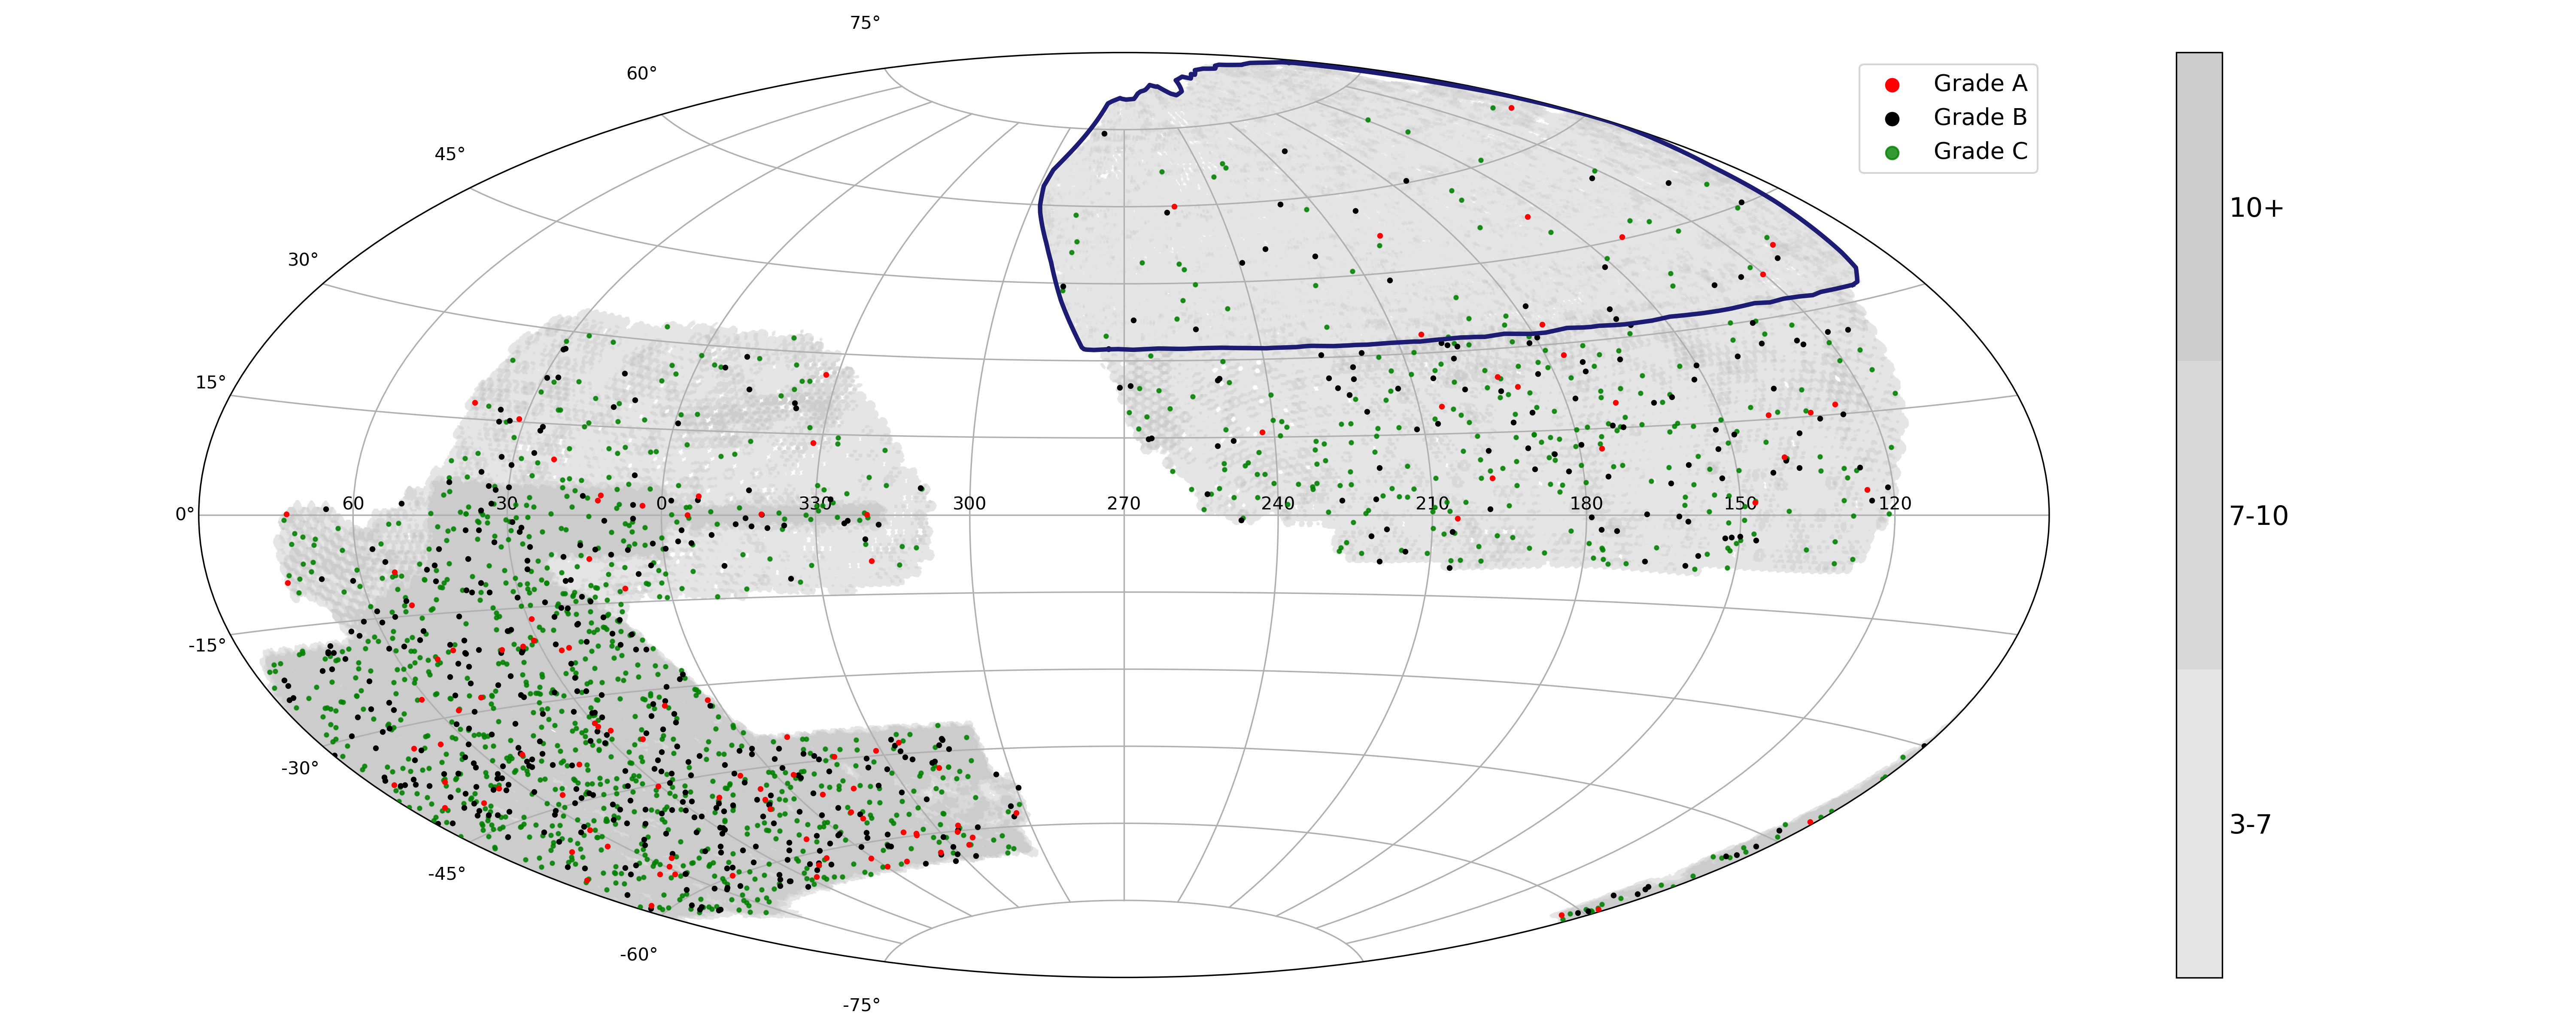
The entire catalog of these lenses can be found on our project website444https://sites.google.com/usfca.edu/neuralens/. The positions of all candidates on the sky are shown in Figure 4.2.
![[Uncaptioned image]](/html/2206.02764/assets/all_candidate_map.png) Figure 7: All 3057 candidate lensing systems discovered in the Legacy Surveys reported in Paper I (green), Paper II (purple), and this work (pink), over the depth map of the Legacy Surveys DR9 shown in Figure 2.
Figure 7: All 3057 candidate lensing systems discovered in the Legacy Surveys reported in Paper I (green), Paper II (purple), and this work (pink), over the depth map of the Legacy Surveys DR9 shown in Figure 2.
5 Discussion
We have trained and deployed on the highly heterogeneous imaging data within the Legacy Surveys, with non-uniform depth and varying image quality across BASS/MzLS and DECaLS, which includes the DES and non-DES regions. We show that despite this challenge, our neural network can be trained to perform well with a carefully constructed training sample. This training sample is larger by a factor of 3 than that in Paper II, with known lenses and lens candidates from both BASS/MzLS and DECaLS, and non-lenses that are selected proportionally in each depth bin for each region. We achieve an overall ResNet purity of 1 lens candidate in 25 neural net recommendations, a clear improvement over Paper II (1 in 40). This is competitive with, if not better than, similar searches carried out for other surveys, especially given that the data set we deploy on is the most heterogeneous.
The DECaLS region of the Legacy Surveys has been mined for lenses several times before (Diehl et al., 2017; Jacobs et al., 2019a, b; Rojas et al., 2021; O’Donnell et al., 2022, Papers I and II). It is also worth keeping in mind that the Legacy Surveys overlap significantly with SDSS and Pan-STARRS, which contains the entirety of the MzLS/BASS region. Both of these surveys have been mined for strong lenses (e.g., Sonnenfeld et al., 2013; Cañameras et al., 2020; Talbot et al., 2021). Lens searches also have been carried out in the Hyper-Suprime Cam Subaru Strategic Program (HSC SSP), Canada–France–Hawaii Telescope Legacy Survey (CFHTLS), and the Kilo-Degree Survey (KiDS), all of which are contained within the Legacy Surveys (e.g., Jacobs et al., 2017; Cañameras et al., 2021; Li et al., 2021). Finally, the MzLS/BASS region also significantly overlaps with the Ultraviolet Near Infrared Optical Northern Survey (UNIONS), which has been mined for lenses as well (Savary et al., 2021). And yet, we have succeeded in finding a large number of high quality new lenses.
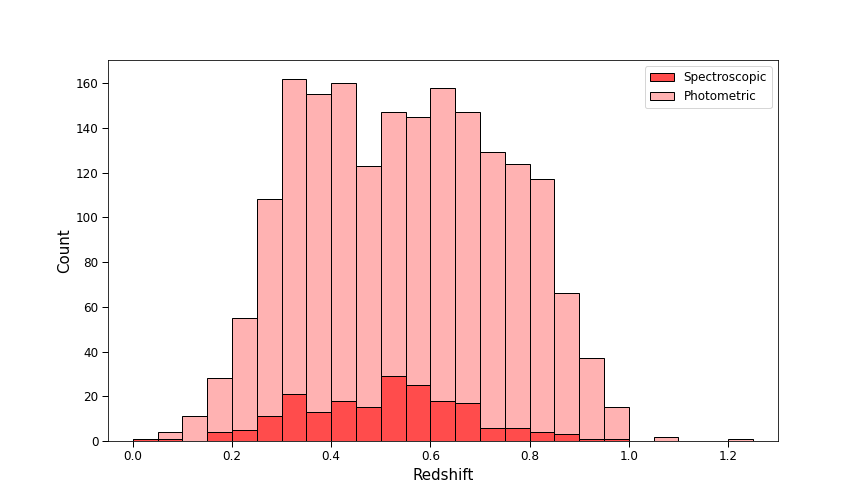
The photometric redshift distribution of our candidates is shown in Figure 5. It is largely similar to the redshift distribution of the lenses in the training sample. The average redshift of the new candidates, however, is higher by 0.1, at , possibly indicating our model’s ability to find lenses with a higher redshift distribution than the training sample.
Stein et al. (2021, S21) also searched for strong lenses in the DESI Legacy Surveys DR9. Their approach took two steps. First they performed a form of self-supervised learning, by applying a CNN encoder on real observed images to minimize contrastive loss in a representation space. Then, after projecting image cutouts onto this representation space, they employed three search strategies: similarity search, linear binary classification trained on labeled data, and re-training (“fine-tuning”) the self-supervised CNN encoder by incorporating the linear classifier. As with this work, they searched for lens candidates in all non-PSF objects (typed by The Tractor) with 20.0 mag. They further expanded the search to 20.0 mag, adding more candidates. They reported a total of 1192 strong lens candidates.
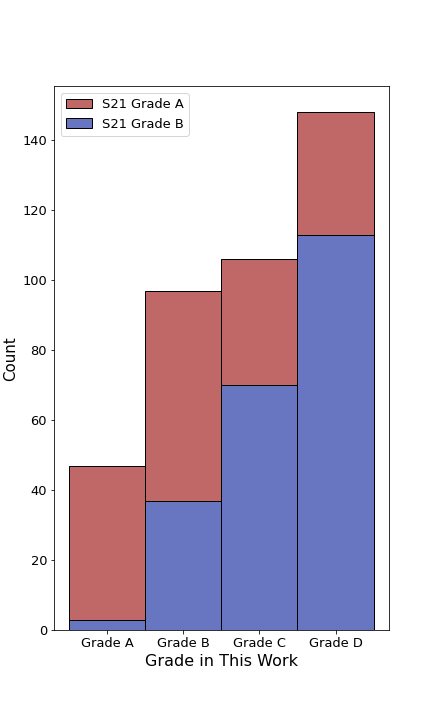
The candidates reported in S21 were only assigned Grades A and B. A total of 398 () candidates from S21 have been identified in our search (limited to 20.0 mag), which represents approximately 40% of their 20.0 mag candidates. This includes 148 S21 candidates receiving a grade of D from our visual inspection. Figure 5 shows the distribution of the S21 grades relative to the grades in this work for the overlapping candidates. Table 4 shows a two-way comparison.
For the overlapping candidates: from the red text in Table 4, 25.8% of the S21 Grade A systems are given an A or B grade in this work, and a further 8.9% and 8.7% of their systems receive a C or D grade from our inspection, respectively. For the S21 Grade B systems, 9.6% are given an A or B grade in our work, 8.9% a C grade, and 14.3% a D grade. In total, 43.3% and 28.3% of the S21 Grade A and B systems, respectively, are assigned a Grade D or better from our visual inspection. Going in the other direction, from the blue text in Table 4, 40.9%, 18.4%, 8.5% and 8.0% of our Grade A, B, C, and D candidates are identified in S21 (i.e., assigned an A or B grade), respectively. The agreement is the strongest for mutual Grade A’s.
Figure 5 shows examples of overlapping candidates reported in S21 and this work. Grades assigned by S21 (A and B) are the same in each row, and grades from this work are the same in each column (A, B, C, and D). While grading criteria may differ between search teams, high quality candidates (grade A and B) are often shared, as shown in the left half of Figure 5.
We also provide comparisons for a few example systems with the largest discrepancy in grade: those assigned grade A or B in S21 that were given a grade of C and D in this work.
DESI-070.4050-50.4559 (first row, third column) has a faint possible arclet with no visible counter image. There are two other objects of similar brightness but somewhat different color in the cutout (southeast and northwest of the putative lens). They are too faint for us to have high confidence that they are lensed images and thus we assign a grade of C.
DESI-153.6301+24.4854 (second row, third column) also shows what appears to be an arclet. While the surface brightness and color are consistent with the expectation of a lensed arc, there is no apparent counter image and the shape of the arc does not conform to the typical morphology (there appears to be a “kink” in the putative arc, possibly indicating two galaxies in close proximity on the sky). It is also possible that the shape of the arc may be due to source structure. Given the limitations of this ground-based image and the absence of a clearly identifiable counter-image, we assign a grade of C.
DESI-066.4365-57.6926 (first row, fourth column) is a type of image that we have seen in our searches a number of times. If it is lensing, this would be a perfect Einstein ring. Since such perfect alignment is very rare even among strong lensing systems, we are generally sceptical. Lensed arcs typically have low surface brightness, whereas this putative ring appears quite bright. The structure seen in the putative ring is, in our experience, consistent with a ring galaxy (e.g, Timmis & Shamir, 2017). Furthermore, if this system is indeed a strong lens, the Einstein radius, 2.8′′. Using a lens redshift of 0.4 (photometric redshift; Zhou et al., 2020), and source redshift of 0.8 (assumed to be 2; e.g., Sharma & Linder, 2022), we can then estimate the mass enclosed within the Einstein radius as well as the velocity dispersion () of the lens. Assuming an singular isothermal sphere (SIS) profile, we find the enclosed mass to be M⊙ and 470 km s-1. Compared with known lenses in the SLACS program with similar -band magnitude and lens and source redshifts, these values are extraordinarily large. Finally, the galaxy does not appear to be a part of a group. We therefore assign a grade of D.
For DESI-035.4194-46.8752 (second row, fourth column), we consider the putative arc to be more likely a spiral galaxy (perhaps with a high inclination angle), with what appears to be a reddish core and blue spiral arms. In this and other select ambiguous cases, photometric redshfits (Zhou et al., 2020) can be helpful. The photometric redshift of the putative arc at 0.2680.047 relative to that of the putative lens (the orange galaxy at the center of the image) at 0.2480.038 is consistent with this not being a lensing system. While photometic redshifts of elliptical galaxies are often reliable, this is not always the case with blue lensed sources. The photometric redshift of the putative arc in DESI-035.4194-46.8752 is centered on the orange core and is likely more reliable. Hence we assign a grade of D.
In all four cases, we deem the possibility of lensing to be present (just not high enough to be assigned above C Grade), high resolution image and/or spectroscopic observations are needed to be conclusive.
![[Uncaptioned image]](/html/2206.02764/assets/x2.png) Figure 10: A comparison of a sample of systems reported in both S21 and this work. For all images, north is up, and east to the left. The scalebar shown in the first image applies to all images in this figure. We show an example system for all permutations of grade assignment given grades A and B from S21 and grades A, B, C, and D in this work. The name for each system from this work is shown in the top left, with the name from S21 in parentheses below that. The bottom left shows the grade from this work and below that, the S21 grade in parentheses.
Figure 10: A comparison of a sample of systems reported in both S21 and this work. For all images, north is up, and east to the left. The scalebar shown in the first image applies to all images in this figure. We show an example system for all permutations of grade assignment given grades A and B from S21 and grades A, B, C, and D in this work. The name for each system from this work is shown in the top left, with the name from S21 in parentheses below that. The bottom left shows the grade from this work and below that, the S21 grade in parentheses.
Finally, the technique utilized by S21 is more computationally expensive (64 GPU hours, NVIDIA V100, with an additional 288 hours for their “fine-tuned” approach) than our supervised approach (5 GPU hours, NVIDIA Tesla P100). On the other hand, the S21 approach has the advantage of facilitating searches for other kinds of objects (not just strong lensing systems) downstream. Given future improvements on GPUs is almost a certainty, this is clearly is a promising strategy.
The discoverability of new lenses, by humans alone or with machine learning assistance, of course depends on observation conditions (e.g., depth, seeing, and filter selection) and the criteria for the deployment sample. As highlighted by the brief comparison between S21 and this work, even for the same survey, different well-designed machine learning based searches can lead to different discovery sets. In general, this likely is dependent on the machine learning technique employed (e.g., neural network architecture, supervised vs. unsupervised), training sample (e.g., selection criteria, size, and whether it consists of simulations, observed images, or an amalgamation), and the final human inspection process itself (Rojas et al., 2023). These can lead to overlapping and complementary discoveries. A more detailed comparison between different searches and their respective results would likely be beneficial to future lens searches. This, however, is beyond the scope of this paper.
6 Conclusions
We have carried out a search for strong gravitational lensing systems in the DESI Legacy Surveys Data Release 9 (DR9). This is the third paper in a series on lens searches in the DESI Legacy Surveys, following Paper I (Huang et al., 2020, DR7 DECaLS, DEV and COMP only) and Paper II (Huang et al., 2021, DR8, DEV, COMP, and REX).
| A (115) | B (526) | C (1254) | ABC (1895) | D (1865) | ABC+D | |||||
|---|---|---|---|---|---|---|---|---|---|---|
| A (404) | 10.9% | 14.9% | 8.9% | 34.7% | 8.7% | 43.3% | ||||
| 38.3% | 44 | 11.4% | 60 | 2.9% | 36 | 140 | 1.9% | 35 | 175 | |
| B (788) | 0.4% | 4.7% | 8.9% | 14.0% | 14.3% | 28.3% | ||||
| 2.6% | 3 | 7.0% | 37 | 5.6% | 70 | 110 | 6.1% | 113 | 223 | |
| AB (1192) | 40.9% | 47 | 18.4% | 97 | 8.5% | 106 | 250 | 8.0% | 148 | 398 |
We use a customized deep residual neural network (Lanusse et al., 2018; Huang et al., 2021), trained on observed lenses and non-lenses. We apply our trained neural network to 45 million non-PSF (SER, DEV, REX, EXP) cutout images with at least three passes in each of the bands and a -band magnitude cut of for the galaxy at the center of each image. We hold a high standard in grading these candidate systems. We have found 115 Grade A, 526 Grade B, and 1254 Grade C candidates, for a total of 1895. Of these, 125 were previously known systems, and 258 were also reported in recent publications, the majority of which came from Stein et al. (2021). We therefore report 1512 new lens candidates with a grade breakdown of 51 Grade A, 383 Grade B, and 1079 Grade C. Combining all three searches, we have found a grand total of 3057 strong lens candidates. Grade D systems are not counted as candidates in this paper, but we have included them on our project website (URL provided in §4.2).
Along with Stein et al. (2021), this is the largest deployment to search for strong lenses in the most heterogeneous dataset. Even more notably, in all parts of the footprint of our search, multiple lens searches were performed before, by our group or other groups. By using an expanded, statistically representative training sample, we are able to find a large number of high quality new lens candidates, with high purity. We have presented a brief comparison with Stein et al. (2021) in §5. Their results and ours show that a detailed comparison will likely benefit future lens searches in large data sets.
This work, together with other searches, has clearly demonstrated that machine learning approaches are highly effective in discovering large numbers of high-quality strong lensing candidates. This will likely continue to be the case in future surveys such as the Vera C. Rubin Observatory Legacy Survey of Space and Time (LSST), Euclid, and the Nancy Grace Roman Space Telescope, and the discovery of strong lenses will continue to accelerate. There has also been significant development on strong lens modeling, for example, the availability of open-source, widely-used lens modeling packages (e.g., Birrer & Amara, 2018; Nightingale et al., 2019). Recently, Gu et al. (2022) introduced GIGA-Lens, which takes advantage of the high level of parallelization of GPUs and automatic differentiation, speeding up lens modeling by one to two orders of magnitudes. This makes it possible to model the strong lensing systems expected to be discovered in the next decade in a reasonable amount of time. The immediate future of using strong lensing to address significant astrophysical and cosmological questions is indeed very bright.
7 Acknowledgement
This research used resources of the National Energy Research Scientific Computing Center (NERSC), a U.S. Department of Energy Office of Science User Facility operated under Contract No. DE-AC02-05CH11231 and the Computational HEP program in The Department of Energy’s Science Office of High Energy Physics provided resources through the “Cosmology Data Repository” project (Grant #KA2401022). X.H. acknowledges the University of San Francisco Faculty Development Fund. A.D.’s research is supported by National Science Foundation’s National Optical-Infrared Astronomy Research Laboratory, which is operated by the Association of Universities for Research in Astronomy (AURA) under cooperative agreement with the National Science Foundation.
This paper is based on observations at Cerro Tololo Inter-American Observatory, National Optical Astronomy Observatory (NOAO Prop. ID: 2014B-0404; co-PIs: D. J. Schlegel and A. Dey), which is operated by the Association of Universities for Research in Astronomy (AURA) under a cooperative agreement with the National Science Foundation.
This project used data obtained with the Dark Energy Camera (DECam), which was constructed by the Dark Energy Survey (DES) collaboration. Funding for the DES Projects has been provided by the U.S. Department of Energy, the U.S. National Science Foundation, the Ministry of Science and Education of Spain, the Science and Technology Facilities Council of the United Kingdom, the Higher Education Funding Council for England, the National Center for Supercomputing Applications at the University of Illinois at Urbana-Champaign, the Kavli Institute of Cosmological Physics at the University of Chicago, the Center for Cosmology and Astro-Particle Physics at the Ohio State University, the Mitchell Institute for Fundamental Physics and Astronomy at Texas A&M University, Financiadora de Estudos e Projetos, Fundação Carlos Chagas Filho de Amparo à Pesquisa do Estado do Rio de Janeiro, Conselho Nacional de Desenvolvimento Científico e Tecnológico and the Ministério da Ciência, Tecnologia e Inovacão, the Deutsche Forschungsgemeinschaft, and the Collaborating Institutions in the Dark Energy Survey. The Collaborating Institutions are Argonne National Laboratory, the University of California at Santa Cruz, the University of Cambridge, Centro de Investigaciones Enérgeticas, Medioambientales y Tecnológicas-Madrid, the University of Chicago, University College London, the DES-Brazil Consortium, the University of Edinburgh, the Eidgenössische Technische Hochschule (ETH) Zürich, Fermi National Accelerator Laboratory, the University of Illinois at Urbana-Champaign, the Institut de Ciències de l’Espai (IEEC/CSIC), the Institut de Física d’Altes Energies, Lawrence Berkeley National Laboratory, the Ludwig-Maximilians Universität München and the associated Excellence Cluster Universe, the University of Michigan, the National Optical Astronomy Observatory, the University of Nottingham, the Ohio State University, the OzDES Membership Consortium the University of Pennsylvania, the University of Portsmouth, SLAC National Accelerator Laboratory, Stanford University, the University of Sussex, and Texas A&M University.
References
- Birrer & Amara (2018) Birrer, S., & Amara, A. 2018, Physics of the Dark Universe, 22, 189, doi: 10.1016/j.dark.2018.11.002
- Birrer et al. (2020) Birrer, S., Shajib, A. J., Galan, A., et al. 2020, arXiv e-prints, arXiv:2007.02941. https://arxiv.org/abs/2007.02941
- Bolton et al. (2008) Bolton, A. S., Burles, S., Koopmans, L. V. E., et al. 2008, ApJ, 682, 964, doi: 10.1086/589327
- Bolton et al. (2006) Bolton, A. S., Burles, S., Koopmans, L. V. E., Treu, T., & Moustakas, L. A. 2006, ApJ, 638, 703, doi: 10.1086/498884
- Bonvin et al. (2017) Bonvin, V., Courbin, F., Suyu, S. H., et al. 2017, MNRAS, 465, 4914, doi: 10.1093/mnras/stw3006
- Bradač et al. (2008) Bradač, M., Allen, S. W., Treu, T., et al. 2008, ApJ, 687, 959, doi: 10.1086/591246
- Cañameras et al. (2020) Cañameras, R., Schuldt, S., Suyu, S. H., et al. 2020, arXiv e-prints, arXiv:2004.13048. https://arxiv.org/abs/2004.13048
- Cañameras et al. (2021) Cañameras, R., Schuldt, S., Shu, Y., et al. 2021, A&A, 653, L6, doi: 10.1051/0004-6361/202141758
- Carrasco et al. (2017) Carrasco, M., Barrientos, L. F., Anguita, T., et al. 2017, ApJ, 834, 210, doi: 10.3847/1538-4357/834/2/210
- Çağan Şengül et al. (2021) Çağan Şengül, A., Dvorkin, C., Ostdiek, B., & Tsang, A. 2021, arXiv e-prints, arXiv:2112.00749. https://arxiv.org/abs/2112.00749
- Chen et al. (2022) Chen, W., Kelly, P. L., Oguri, M., et al. 2022, Nature, 611, 256, doi: 10.1038/s41586-022-05252-5
- Dark Energy Survey Collaboration et al. (2016) Dark Energy Survey Collaboration, Abbott, T., Abdalla, F. B., et al. 2016, MNRAS, 460, 1270, doi: 10.1093/mnras/stw641
- Dey et al. (2016) Dey, A., Rabinowitz, D., Karcher, A., et al. 2016, in Proc. SPIE, Vol. 9908, Ground-based and Airborne Instrumentation for Astronomy VI, 99082C
- Dey et al. (2019) Dey, A., Schlegel, D. J., Lang, D., et al. 2019, AJ, 157, 168, doi: 10.3847/1538-3881/ab089d
- Diehl et al. (2017) Diehl, H. T., Buckley-Geer, E. J., Lindgren, K. A., et al. 2017, ApJS, 232, 15, doi: 10.3847/1538-4365/aa8667
- Ding et al. (2021) Ding, X., Liao, K., Birrer, S., et al. 2021, MNRAS, 504, 5621, doi: 10.1093/mnras/stab1240
- Flaugher et al. (2015) Flaugher, B., Diehl, H. T., Honscheid, K., et al. 2015, AJ, 150, 150, doi: 10.1088/0004-6256/150/5/150
- Freedman et al. (2019) Freedman, W. L., Madore, B. F., Hatt, D., et al. 2019, ApJ, 882, 34, doi: 10.3847/1538-4357/ab2f73
- Freedman et al. (2020) Freedman, W. L., Madore, B. F., Hoyt, T., et al. 2020, ApJ, 891, 57, doi: 10.3847/1538-4357/ab7339
- Goldstein & Nugent (2017) Goldstein, D. A., & Nugent, P. E. 2017, ApJ, 834, L5, doi: 10.3847/2041-8213/834/1/L5
- Goldstein et al. (2018a) Goldstein, D. A., Nugent, P. E., & Goobar, A. 2018a, arXiv e-prints. https://arxiv.org/abs/1809.10147
- Goldstein et al. (2018b) Goldstein, D. A., Nugent, P. E., Kasen, D. N., & Collett, T. E. 2018b, ApJ, 855, 22, doi: 10.3847/1538-4357/aaa975
- Goobar et al. (2017) Goobar, A., Amanullah, R., Kulkarni, S. R., et al. 2017, Science, 356, 291, doi: 10.1126/science.aal2729
- Goobar et al. (2022) Goobar, A., Johansson, J., Schulze, S., et al. 2022, arXiv e-prints, arXiv:2211.00656. https://arxiv.org/abs/2211.00656
- Grillo et al. (2015) Grillo, C., Suyu, S. H., Rosati, P., et al. 2015, ApJ, 800, 38, doi: 10.1088/0004-637X/800/1/38
- Gu et al. (2022) Gu, A., Huang, X., Sheu, W., et al. 2022, arXiv e-prints, arXiv:2202.07663. https://arxiv.org/abs/2202.07663
- Hezaveh et al. (2016) Hezaveh, Y. D., Dalal, N., Marrone, D. P., et al. 2016, ApJ, 823, 37, doi: 10.3847/0004-637X/823/1/37
- Huang et al. (2009) Huang, X., Morokuma, T., Fakhouri, H. K., et al. 2009, ApJ, 707, L12, doi: 10.1088/0004-637X/707/1/L12
- Huang et al. (2020) Huang, X., Storfer, C., Ravi, V., et al. 2020, The Astrophysical Journal, 894, 78, doi: 10.3847/1538-4357/ab7ffb
- Huang et al. (2021) Huang, X., Storfer, C., Gu, A., et al. 2021, ApJ, 909, 27, doi: 10.3847/1538-4357/abd62b
- Huber et al. (2021) Huber, S., Suyu, S. H., Noebauer, U. M., et al. 2021, A&A, 646, A110, doi: 10.1051/0004-6361/202039218
- Jacobs et al. (2017) Jacobs, C., Glazebrook, K., Collett, T., More, A., & McCarthy, C. 2017, MNRAS, 471, 167, doi: 10.1093/mnras/stx1492
- Jacobs et al. (2019a) Jacobs, C., Collett, T., Glazebrook, K., et al. 2019a, MNRAS, 484, 5330, doi: 10.1093/mnras/stz272
- Jacobs et al. (2019b) —. 2019b, ApJS, 243, 17, doi: 10.3847/1538-4365/ab26b6
- Kelly et al. (2015) Kelly, P. L., Filippenko, A. V., Burke, D. L., et al. 2015, Science, 347, 1459, doi: 10.1126/science.1261475
- Kochanek (1991) Kochanek, C. S. 1991, ApJ, 373, 354, doi: 10.1086/170057
- Koopmans & Treu (2002) Koopmans, L. V. E., & Treu, T. 2002, ApJ, 568, L5, doi: 10.1086/340143
- Koopmans et al. (2006) Koopmans, L. V. E., Treu, T., Bolton, A. S., Burles, S., & Moustakas, L. A. 2006, ApJ, 649, 599, doi: 10.1086/505696
- Lang et al. (2016) Lang, D., Hogg, D. W., & Mykytyn, D. 2016, The Tractor: Probabilistic astronomical source detection and measurement, Astrophysics Source Code Library. http://ascl.net/1604.008
- Lanusse et al. (2018) Lanusse, F., Ma, Q., Li, N., et al. 2018, MNRAS, 473, 3895, doi: 10.1093/mnras/stx1665
- Li et al. (2021) Li, R., Napolitano, N. R., Spiniello, C., et al. 2021, ApJ, 923, 16, doi: 10.3847/1538-4357/ac2df0
- Linder (2016) Linder, E. V. 2016, Phys. Rev. D, 94, 083510, doi: 10.1103/PhysRevD.94.083510
- Meneghetti et al. (2020) Meneghetti, M., Davoli, G., Bergamini, P., et al. 2020, Science, 369, 1347, doi: 10.1126/science.aax5164
- Metcalf et al. (2018) Metcalf, R. B., Meneghetti, M., Avestruz, C., et al. 2018, arXiv e-prints, arXiv:1802.03609. https://arxiv.org/abs/1802.03609
- Millon et al. (2020) Millon, M., Galan, A., Courbin, F., et al. 2020, A&A, 639, A101, doi: 10.1051/0004-6361/201937351
- Moustakas et al. (2012) Moustakas, L. A., Brownstein, J., Fadely, R., et al. 2012, in American Astronomical Society Meeting Abstracts, Vol. 219, American Astronomical Society Meeting Abstracts #219, 146.01
- Nightingale et al. (2019) Nightingale, J. W., Massey, R. J., Harvey, D. R., et al. 2019, MNRAS, 489, 2049, doi: 10.1093/mnras/stz2220
- Nordin et al. (2014) Nordin, J., Rubin, D., Richard, J., et al. 2014, MNRAS, 440, 2742, doi: 10.1093/mnras/stu376
- O’Donnell et al. (2022) O’Donnell, J. H., Wilkinson, R. D., Diehl, H. T., et al. 2022, ApJS, 259, 27, doi: 10.3847/1538-4365/ac470b
- Oguri & Marshall (2010) Oguri, M., & Marshall, P. J. 2010, MNRAS, 405, 2579, doi: 10.1111/j.1365-2966.2010.16639.x
- Patel et al. (2014) Patel, B., McCully, C., Jha, S. W., et al. 2014, ApJ, 786, 9, doi: 10.1088/0004-637X/786/1/9
- Petrillo et al. (2019) Petrillo, C. E., Tortora, C., Vernardos, G., et al. 2019, MNRAS, 484, 3879, doi: 10.1093/mnras/stz189
- Pierel & Rodney (2019) Pierel, J. D. R., & Rodney, S. 2019, ApJ, 876, 107, doi: 10.3847/1538-4357/ab164a
- Pierel et al. (2022) Pierel, J. D. R., Arendse, N., Ertl, S., et al. 2022, arXiv e-prints, arXiv:2211.03772. https://arxiv.org/abs/2211.03772
- Planck Collaboration et al. (2020) Planck Collaboration, Aghanim, N., Akrami, Y., et al. 2020, A&A, 641, A6, doi: 10.1051/0004-6361/201833910
- Pourrahmani et al. (2018) Pourrahmani, M., Nayyeri, H., & Cooray, A. 2018, ApJ, 856, 68, doi: 10.3847/1538-4357/aaae6a
- Quimby et al. (2014) Quimby, R. M., Oguri, M., More, A., et al. 2014, Science, 344, 396, doi: 10.1126/science.1250903
- Refsdal (1964) Refsdal, S. 1964, MNRAS, 128, 307, doi: 10.1093/mnras/128.4.307
- Riess et al. (2021) Riess, A. G., Casertano, S., Yuan, W., et al. 2021, ApJ, 908, L6, doi: 10.3847/2041-8213/abdbaf
- Riess et al. (2019) Riess, A. G., Casertano, S., Yuan, W., Macri, L. M., & Scolnic, D. 2019, ApJ, 876, 85, doi: 10.3847/1538-4357/ab1422
- Ritondale et al. (2019) Ritondale, E., Vegetti, S., Despali, G., et al. 2019, MNRAS, 485, 2179, doi: 10.1093/mnras/stz464
- Rodney et al. (2021) Rodney, S. A., Brammer, G. B., Pierel, J. D. R., et al. 2021, Nature Astronomy, 5, 1118, doi: 10.1038/s41550-021-01450-9
- Rodney et al. (2016) Rodney, S. A., Strolger, L. G., Kelly, P. L., et al. 2016, ApJ, 820, 50, doi: 10.3847/0004-637X/820/1/50
- Rojas et al. (2021) Rojas, K., Savary, E., Clément, B., et al. 2021, Strong lens systems search in the Dark Energy Survey using Convolutional Neural Networks. https://arxiv.org/abs/2109.00014
- Rojas et al. (2023) Rojas, K., Collett, T. E., Ballard, D., et al. 2023, arXiv e-prints, arXiv:2301.03670, doi: 10.48550/arXiv.2301.03670
- Rubin et al. (2018) Rubin, D., Hayden, B., Huang, X., et al. 2018, ApJ, 866, 65, doi: 10.3847/1538-4357/aad565
- Savary et al. (2021) Savary, E., Rojas, K., Maus, M., et al. 2021, arXiv e-prints, arXiv:2110.11972. https://arxiv.org/abs/2110.11972
- Sharma & Linder (2022) Sharma, D., & Linder, E. V. 2022, arXiv e-prints, arXiv:2204.03020. https://arxiv.org/abs/2204.03020
- Sheu et al. (2023) Sheu, W., Huang, X., Cikota, A., et al. 2023, arXiv e-prints, arXiv:2301.03578, doi: 10.48550/arXiv.2301.03578
- Shu et al. (2018) Shu, Y., Bolton, A. S., Mao, S., et al. 2018, ApJ, 864, 91, doi: 10.3847/1538-4357/aad5ea
- Shu et al. (2016) —. 2016, ApJ, 833, 264, doi: 10.3847/1538-4357/833/2/264
- Shu et al. (2017) Shu, Y., Brownstein, J. R., Bolton, A. S., et al. 2017, ApJ, 851, 48, doi: 10.3847/1538-4357/aa9794
- Sonnenfeld et al. (2013) Sonnenfeld, A., Gavazzi, R., Suyu, S. H., Treu, T., & Marshall, P. J. 2013, ApJ, 777, 97, doi: 10.1088/0004-637X/777/2/97
- Sonnenfeld et al. (2018) Sonnenfeld, A., Chan, J. H. H., Shu, Y., et al. 2018, PASJ, 70, S29, doi: 10.1093/pasj/psx062
- Stein et al. (2021) Stein, G., Blaum, J., Harrington, P., Medan, T., & Lukic, Z. 2021, arXiv e-prints, arXiv:2110.00023. https://arxiv.org/abs/2110.00023
- Suyu et al. (2010) Suyu, S. H., Marshall, P. J., Auger, M. W., et al. 2010, ApJ, 711, 201, doi: 10.1088/0004-637X/711/1/201
- Suyu et al. (2013) Suyu, S. H., Auger, M. W., Hilbert, S., et al. 2013, ApJ, 766, 70, doi: 10.1088/0004-637X/766/2/70
- Suyu et al. (2020) Suyu, S. H., Huber, S., Cañameras, R., et al. 2020, arXiv e-prints, arXiv:2002.08378. https://arxiv.org/abs/2002.08378
- Szegedy et al. (2014) Szegedy, C., Liu, W., Jia, Y., et al. 2014, arXiv e-prints, arXiv:1409.4842. https://arxiv.org/abs/1409.4842
- Talbot et al. (2021) Talbot, M. S., Brownstein, J. R., Dawson, K. S., Kneib, J.-P., & Bautista, J. 2021, MNRAS, 502, 4617, doi: 10.1093/mnras/stab267
- Tessore et al. (2016) Tessore, N., Bellagamba, F., & Metcalf, R. B. 2016, MNRAS, 463, 3115, doi: 10.1093/mnras/stw2212
- Timmis & Shamir (2017) Timmis, I., & Shamir, L. 2017, ApJS, 231, 2, doi: 10.3847/1538-4365/aa78a3
- Treu (2010) Treu, T. 2010, ARA&A, 48, 87, doi: 10.1146/annurev-astro-081309-130924
- Treu & Marshall (2016) Treu, T., & Marshall, P. J. 2016, Astronomy and Astrophysics Review, 24, 11, doi: 10.1007/s00159-016-0096-8
- Vegetti & Koopmans (2009) Vegetti, S., & Koopmans, L. V. E. 2009, MNRAS, 392, 945, doi: 10.1111/j.1365-2966.2008.14005.x
- Vegetti et al. (2010) Vegetti, S., Koopmans, L. V. E., Bolton, A., Treu, T., & Gavazzi, R. 2010, MNRAS, 408, 1969, doi: 10.1111/j.1365-2966.2010.16865.x
- Vegetti et al. (2012) Vegetti, S., Lagattuta, D. J., McKean, J. P., et al. 2012, Nature, 481, 341, doi: 10.1038/nature10669
- Wagner-Carena et al. (2022) Wagner-Carena, S., Aalbers, J., Birrer, S., et al. 2022, arXiv e-prints, arXiv:2203.00690. https://arxiv.org/abs/2203.00690
- Williams et al. (2004) Williams, G. G., Olszewski, E., Lesser, M. P., & Burge, J. H. 2004, in Proc. SPIE, Vol. 5492, Ground-based Instrumentation for Astronomy, ed. A. F. M. Moorwood & M. Iye, 787–798
- Wong et al. (2018) Wong, K. C., Sonnenfeld, A., Chan, J. H. H., et al. 2018, ApJ, 867, 107, doi: 10.3847/1538-4357/aae381
- Wong et al. (2019) Wong, K. C., Suyu, S. H., Chen, G. C. F., et al. 2019, arXiv e-prints, arXiv:1907.04869. https://arxiv.org/abs/1907.04869
- Yahalomi et al. (2017) Yahalomi, D. A., Schechter, P. L., & Wambsganss, J. 2017, arXiv e-prints, arXiv:1711.07919. https://arxiv.org/abs/1711.07919
- Zhou et al. (2020) Zhou, R., Newman, J. A., Mao, Y.-Y., et al. 2020, arXiv e-prints, arXiv:2001.06018. https://arxiv.org/abs/2001.06018