Determination of hydrogen concentration in solids by transmission ERDA under nuclear-elastically enhanced recoiling of H by 8 and 9 MeV He
Hiroshi Kudo1
***Corresponding author E-mail address: kudo@tac.tsukuba.ac.jp
, Masanori Kurosawa2, Hiroshi Naramoto1, Masao Sataka1, Satoshi Ishii1, Kimikazu Sasa1,3 and Shigeo Tomita3
1Research Facility Center for Science and Technology, University of Tsukuba, 1-1-1 Tennodai, Tsukuba, Ibaraki 305-8577, Japan
2Faculty of Life and Environmental Sciences, University of Tsukuba, 1-1-1 Tennodai, Tsukuba, Ibaraki 305-8572, Japan
3Faculty of Pure and Applied Sciences, University of Tsukuba, 1-1-1 Tennodai, Tsukuba, Ibaraki 305-8571, Japan
ABSTRACT
Hydrogen concentrations in thin self-supporting samples of polyphenylene sulfide and muscovite have been determined by nuclear-elastic recoil detection analysis of transmission layout. The analysis procedure is based only on the database of stopping power and recoil cross section for material analysis, without using any reference sample of known H content. For the polyphenylene sulfide sample, the determined value of cm3 is in good agreement with the calculated value of cm3. For the muscovite sample, the H concentration originating each from bound water and absorbed water is uniform over the entire thickness of the sample. The determined concentration Hcm3 of the muscovite agrees excellently with the value of Hcm3 obtained from other quantitative analyses typically applied for minerals. The present results demonstrate the capability of accurate determination of H contents in materials and minerals by transmission ERDA.
I Introduction
Knowledge about behavior of hydrogen in solids is of scientific and also of practical importance since hydrogen can seriously affect physical and, especially, mechanical properties of materials [1]. Also, hydrogen in solids attracts geological interest since geological samples typically contain H in the form of water (H2O) or hydroxyls (OH) [2] [3] [4]. For example, it is certainly helpful to discuss the origin of the lunar water and the earth’s sea via hydrogen analyses of glasses and minerals in lunar rocks [5] [6].
For analysis of hydrogen in solids, possible experimental methods, in particular, of non-destructive type are extremely restricted because analysis techniques based on electronic transitions of atoms are hardly applicable in this case. A notable and unique feature of elastic recoil detection analysis (ERDA) using a fast ion beam is non-destructive detection of light atoms in a solid sample [7]. For analysis of hydrogen in thin self-supporting samples, a useful method is ERDA of transmission layout (T-ERDA), in which recoil H resulting from hard collisions with He or heavier projectiles is energy-analyzed in the direction close to 0∘ after passing through the sample. For example, Tirira and coworkers carried out profiling of H in thin self-supporting samples by T-ERDA using 2–3 MeV He [8] [9]. At about the same time, elastic recoil coincidence spectroscopy (ERCS), which is a variation of T-ERDA, has been developed [10]. Later, ERCS using proton–proton scattering was applied to observe the fluid inclusion in minerals [11], localized H distribution in diamond [12], and H concentration in clinopyroxene crystals [13]. In the studies mentioned above, the workers obtained higher spatial resolutions than for the typical case of neutron tomography [14], which is a competitive analysis technique with ERDA.
Previously, we observed 3D distribution of hydrogen bubbles in a H-introduced Al foil by T-ERDA [15]. Actually, such 3D analysis of hydrogen can be carried out by taking advantage of the enhanced recoil cross section as large as 2 b/sr due to the nuclear elastic interaction of 8–10 MeV 4He with H [16]. This allows sufficient count rate of recoil H needed for the 3D observation by employing the collimated 10–100 pA He2+ beam of the m size.
In our developing stage of nuclear-elastic T-ERDA, the main factors determining the spatial and depth resolutions typically in the m range were studied using test samples [17]. Further fundamental studies are needed to establish this method as a standard technique of hydrogen analysis. For this reason, we have carried out T-ERDA using samples of PPS [polyphenylene sulfide (C6H4S)n] and natural muscovite. The former is a synthetic resin with well-known atomic composition, while the latter sample has been highly characterized by other analysis approaches, as will be noted in §II. Rigorous analysis of hydrogen content in these samples is of practical importance since these are often used as reference samples for hydrogen analysis by ERDA [18] [19]. The main interest of the present work is the reproducibility of the known concentrations of hydrogen in the samples without relying on any reference sample to determine the absolute H concentrations. Therefore, the present analysis method is based fully on the open database of stopping power and recoil cross section for material analysis using ion beams.
II Experiments
In the present experiments, the measured samples are stacked PPS–Al layers and muscovite, which are on the Al foil of 50 m thickness to prevent the incident He from entering the particle detector. The PPS–Al stacked samples are those used in the previous work [17], which are abbreviated as PPS/Al(50), Al(10)/PPS/Al(50), and Al(20)/PPS/Al(50), where the numbers in the parentheses denote the thicknesses in m. The thicknesses of the PPS film and the Al foils were determined by measuring the weight and area, assuming the densities of 2.70 and 1.35 g/cm3 for Al and PPS, respectively. The nominal purity of the Al foils is 99.99%. The measurement reproduced the nominal Al thicknesses of 10, 20, and 50 m within the error of 2%. The measured PPS thickness is m, which is thin enough to be used as a localized H marker. Furthermore, the PPS film was characterized by Rutherford backscattering spectroscopy (RBS) using 2 MeV He, which showed no discernible inhomogeneity of the PPS film, according to the composition analysis of the RBS spectra (S and C) applying the commonly used SIMNRA code.
The muscovite sample was prepared by cleaving the bulk muscovite which was collected from a granitic pegmatite rock at Ishikawa, Fukushima Prefecture, Japan. The precise thickness of the muscovite sample on the order of 10 m can be determined afterward from the analysis of the T-ERDA spectrum. The density of the muscovite 2.83 g/cm3 was measured with a high precision electronic densimeter. The chemical composition of the muscovite was determined with scanning electron microscope coupled with energy dispersive X-ray spectroscopy (SEM-EDS), while the water content of the muscovite was determined by Karl Fischer titration. Averaging the four values of water content obtained from four measurements, we obtained 4.530.06 and 0.400.01 wt% for bound water H2O() and absorbed water H2O(), respectively. The analysis results are summarized in table 1, which has well reproduced the published data [20]. It is noted that the critical temperature of 200∘C results from the fact that at higher temperatures appreciable weight loss with endothermic reaction occurs [21].
| Chem. com. | wt% | Atom. com. | at% | mass% |
|---|---|---|---|---|
| SiO2 | 46.72 | Si | 14.70 | 21.75 |
| Al2O3 | 33.73 | Al | 12.51 | 17.78 |
| K2O | 10.93 | K | 4.39 | 9.04 |
| TiO2 | 0.07 | Ti | 0.02 | 0.04 |
| FeO | 3.07 | Fe | 0.81 | 2.38 |
| MnO | 0.09 | Mn | 0.02 | 0.07 |
| MgO | 0.21 | Mg | 0.10 | 0.13 |
| Na2O | 0.65 | Na | 0.40 | 0.48 |
| H2O () | 4.53 | H () | 9.51 | 0.50 |
| H2O () | 0.40 | H () | 0.84 | 0.04 |
| O | 56.70 | 47.79 |
Figure 1 shows the experimental setup similar to the previous case [17], except for the slightly narrow acceptance angle of the surface-barrier silicon detector (SSD), . The energy resolution of the detector was 33 keV, which is sufficient for the present T-ERDA. The experiments were carried out under the pressure of Pa. The incident He energies of 8 and 9 MeV were chosen for effective use of the extremely enhanced He-H differential recoil cross section in the forward direction. The estimated angular spread of the incident He2+ beam from the UTTAC 6MV tandem accelerator is 0.2∘, which is much less than . The He2+ beam was focused to 30m2 on the samples. The energy-measuring system for H was calibrated with 5.48 MeV particles emitted from 241Am.
The beam current was adjusted within the range of 150–300 pA, depending on the sample, to obtain the count rate of 200 counts/s or less for recoil H. This assures negligible counting loss of the H signals in the present experiments. The beam current was frequently monitored during the measurements by the Faraday cup attached to the sample holder, shown in figure 1. The integrated beam current (incident charge) for 1 minute was measured repeatedly with a current integrator, from which the uncertainty of the incident charge % was obtained. The integrated beam current for 1 minute was also measured before and after accumulating every hydrogen spectrum for 10 minutes. This procedure was repeated two or three times and, after confirming the reproducibility, the two or three hydrogen spectra were summed up to obtain the final data.
Under fixed beam conditions, we have repeated to measure H spectra several times at several fixed beam positions on the samples and confirmed that there is only negligible difference among these spectra. This indicates not only negligible loss of H from the samples by the He irradiation, but also uniformity of atomic composition and thickness of the samples.
III Results and discussion
According to the previous study [17], the present T-ERDA can be discussed using the straight-path approximation for the trajectories of He and recoil H. Also, the enhanced energy loss for the acceptance angle of relative to is negligibly small since the path length is enhanced only by , i.e., 0.22%. It is notable that the angular spread of recoil H after passing through the present sample causes negligible change in the H yield. This is because the differential recoil cross section changes slowly with recoil angle in the narrow forward direction under consideration, hence the H yield is unchanged as a whole even when the recoil directions of recoil H are smeared and mixed with each other by the multiple scattering suffered in the sample. In a representative case, for example, the angular spread of 5.12 MeV H (recoil H by 8 MeV He) after passing through an Al foil of 50 m is [17], which corresponds to only % change in the value of differential recoil cross section at the recoil angle of 3.78∘ [16]. It is of essential importance to note that the analysis of observed energy spectra of recoil H requires to know, in advance, the stopping powers for incident He and recoil H, which are evaluated from the density and the atomic composition of the sample. This situation might seem logically inconsistent in the determination of H concentration. In most cases, however, a possible H content lies in a relatively limited range. Hence, hydrogen in the sample makes only minor contribution to the stopping powers evaluated for a fixed value of the known target density, and therefore, we can determine yet unknown H concentration in the sample. The following analysis of the experimental data is based on the physical backgrounds mentioned above.
III.1 PPS
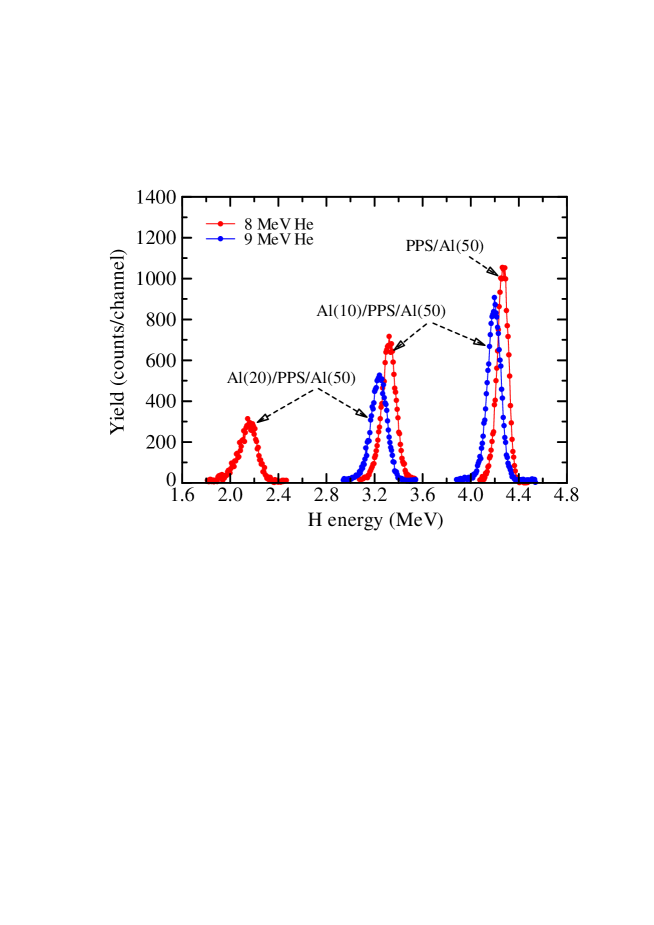
Figure 2 shows the energy spectra of recoil H measured using 8 and 9 MeV He2+ for the stacked PPS–Al samples. The absence of PPS/Al(50) data for 9 MeV He is because the incident He can pass through the sample and certainly damage the detector. The sharp peaks in the spectra originate from recoil H in the PPS film. The peak energies for 8 MeV He2+ agree with the previously observed values [17]. These peak energies can be reproduced with a discrepancy of only 0.6% by the evaluations of energy losses in PPS and Al, in which the straight path approximation and the stopping powers by SRIM are employed. On the other hand, the similar evaluations for 9 MeV underestimate the peak energies by 1.2%, corresponding to 40 keV, which is not negligible in comparison with the energy resolution of the detector 33 keV, as noted earlier. Nevertheless, such discrepancies with the peak energies do not affect the present analysis of the experimental data.
Since the PPS thickness (1.35 m) cannot be resolved with the depth resolution, 1.5–1.6 m, of the present T-ERDA [17], the areas under the peaks are considered to determine the H concentration in PPS. In this case, the slight and approximately uniform background yield originating probably from He–Al nuclear reactions must be subtracted from every spectrum. For each spectrum, the background was subtracted by assuming the straight-line background connecting the ends of low- and high-energy tails of the H peak, which are well recognized in the spectrum. In every case, the area under the H peak includes the background yield of 2–10%. Since the background yield determined in such manner has typical uncertainty of %, the uncertainty of the H yield after background subtraction should be at most 10%10%, i.e., 1%. The data for the five different experimental conditions, shown in table 2, each providing the H concentration in PPS, are useful to confirm the consistency and reliability of the present analysis procedure.
The integrated H yield under the peak is related to the H concentration by
| (1) |
where is the number of incident He, m is the thickness of the PPS sample, is the He–H differential recoil cross section in the laboratory frame, which depends on the He energy at recoil and the solid angle , and the integral is performed for the solid angle of acceptance of the detector. can be calculated using the stopping powers for He. Equation (1) leads to
| (2) |
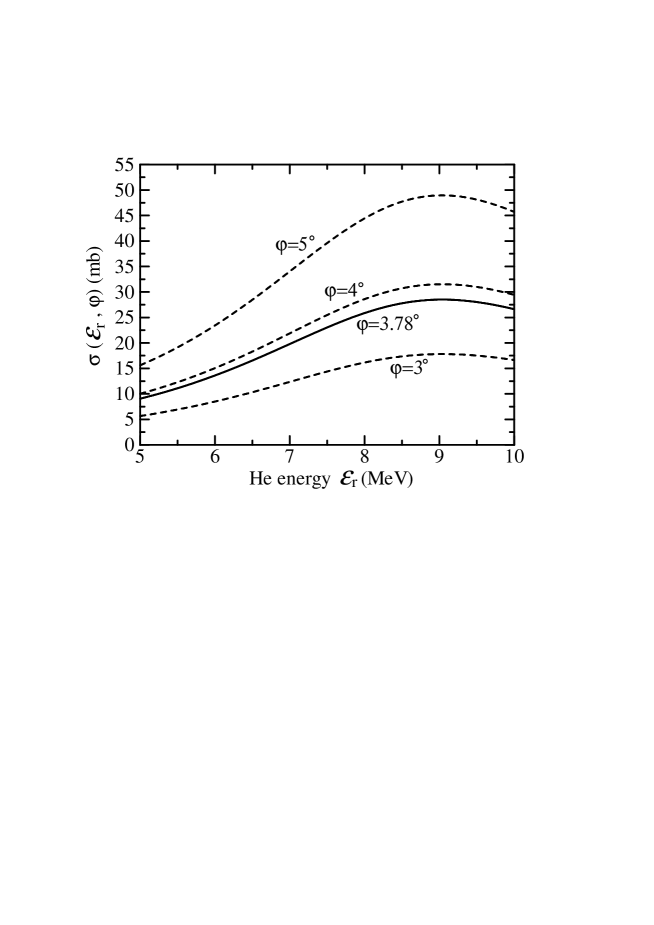
where the cross section is expressed as
| (3) |
where is the polar angle with respect to the He beam axis, and , as noted in §II. Figure 3 shows for the parameter ranges of interest in the present analysis, which was calculated using the numerical table of differential recoil cross sections given by IBANDL [16]. At MeV, is maximal, implying that the highest efficiency for collecting H signals is obtained for the present setup of . Nevertheless, the background yield increases with increasing the He energy and therefore the He energy must be chosen by considering the balance between the efficiency and sensitivity required for hydrogen analysis of a given sample. Comparing the values of for and 4∘, we notice the appreciable difference by 10% only for the small angular change of 0.22∘. This is the reason that special care was taken for the acceptance angle of the detector in the experimental setup.
Table 2 shows the determined values of the H concentration of PPS, for which the experimental data used are in the ranges of (1.4–2.4) and (1.2–2.8). For the case of 9 MeV He on the Al(10)/PPS/Al(50) sample, for example, the concentration of H/cm3 results from 2.311 after subtracting the background yield of , , and MeV which corresponds to mb (see figure 3). Note that the energy loss of He and recoil H in the PPS sample is negligibly small in the determination of the H concentration, as is obvious from the small energy differences in the values of , shown in table 2.
| Sample | He energy | He energy | H concentration | Ratio to | |
|---|---|---|---|---|---|
| (MeV) | (MeV) | (cm3) | 3.01cm3 | ||
| PPSAl(50) | 8 | 7.950.05 | 2.64 | 0.88 | |
| Al(10)PPSAl(50) | 8 | 6.660.06 | 3.17 | 1.05 | |
| Al(10)PPSAl(50) | 9 | 7.770.05 | 2.68 | 0.89 | |
| Al(20)PPSAl(50) | 8 | 5.210.07 | 2.94 | 0.98 | |
| Al(20)PPSAl(50) | 9 | 6.440.06 | 2.90 | 0.96 |
The uncertainty of the determined values of H concentration stems mainly from five sources: (i) the % error in associated with the integrated current, as is mentioned in §II, (ii) a possible error of % in resulting from the uncertainty of the acceptance angle of the detector, (iii) a possible error of % associated with the measured value of , (iv) the statistical error of %, and (v) a 1% error due to the background subtraction, discussed earlier. Because of no interaction among these five sources, the total uncertainty is estimated as % by assuming the convolution characteristic of Gaussian distributions. It should be noted that in the literatures there is a discrepancy of % between the experimental and theoretical recoil cross sections for the energy and angular ranges of interest [22][23]. Even if this discrepancy is taken into account, only minor change arises in the above estimate, i.e., from 8 to 9%.
The H concentration in PPS calculated from the nominal density of 1.35 g/cm3 and the atomic composition of (C6H4S)n, using Avogadro’s constant, is cm3. The ratios of the determined value to the calculated value, shown in table 2, are approximately equal to 1. Averaging the five determined values, we may conclude cm3 for the H concentration of PPS. This value agrees well and consistently with the calculated one, which demonstrates the validity of the present analysis.
III.2 Muscovite
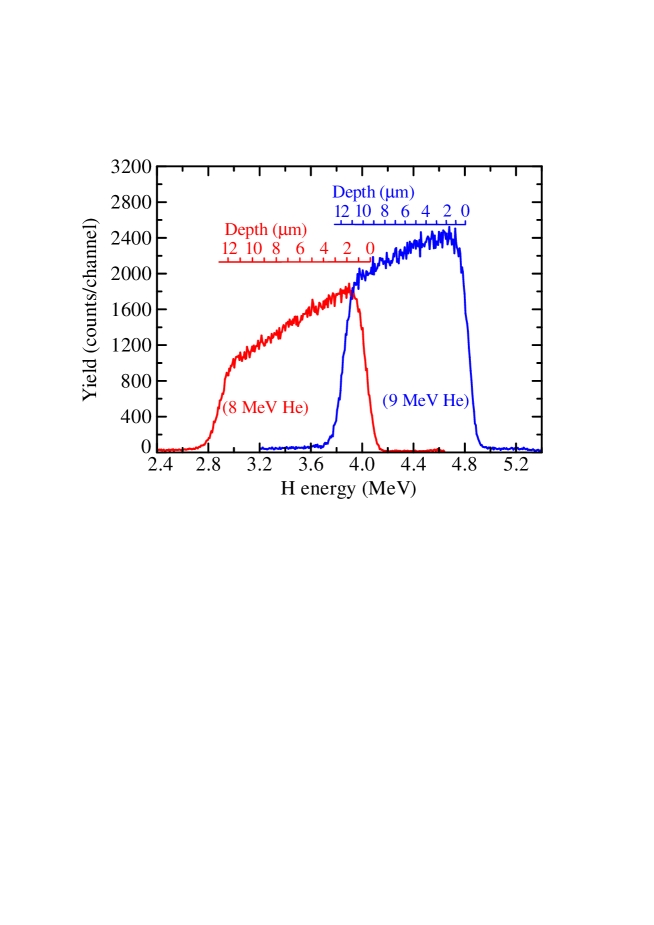
Figure 4 shows T-ERDA spectra of recoil H from the muscovite sample, which were measured with 8 and 9 MeV He2+. The counts of the spectrum yield for 9 MeV have been multiplied by 1.103 to compare the two spectra for the equal number of incident He2+, for the 8 MeV case. The narrower and higher spectrum of recoil H for 9 MeV results from the reduced energy loss of He and H in the sample and from the increased recoil cross sections, compared with the 8 MeV case.
For evaluation of the stopping powers of the muscovite, its density 2.83 g/cm3 and the atomic composition shown in table 1 are the input parameters of the SRIM code [24]. Compared with pure muscovite of 2.9 g/cm3, which consists of K, Al, Si, O, and H [ KAl2 AlSi3 O10 (OH)2 ], there are several substituted atoms in the muscovite sample. However, such difference, including the different H contents, hardly affect the stopping powers. Actually, the stopping powers of the muscovite sample for He and H in the energy ranges under consideration are less than those of pure muscovite by only 0.2%.
In the straight-path approximation, the measured H energy can be converted to the depth where the recoil occurs in the muscovite of thickness . We start with writing down the He energy at recoil, which was introduced in §III.1, i.e.,
| (4) |
where or 9 MeV is the kinetic energy of incident He in the present case, and the notation indicates the stopping power of muscovite for He. Since recoil H passes through the Al foil of thickness m before entering the detector, the relation between and is written in terms of the integral along which is also the beam axis of incident He, i.e.,
| (5) |
where with and being the atomic masses of H and He, respectively, and the stopping powers are written with the same notation as in equation (4). The stopping powers in equations (4) and (5) depend on the kinetic energy of He or H, and therefore, on , hence they increase as increases (with losing the kinetic energies) in the energy ranges of He and H under consideration. The first term on the right side of equation (5) represents the energy of recoil H induced at , while the second and the third represent the energy loss of H in the outgoing path.
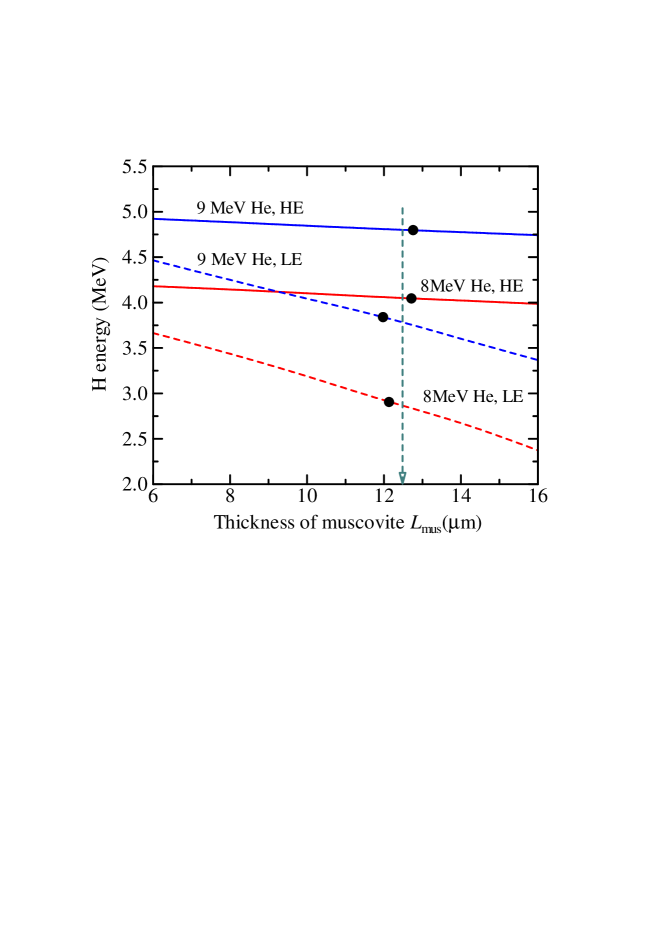
For a given value of , decreases with increasing from because of the larger stopping power for He than for H. It is obvious that at decreases with increasing and, accordingly, can be determined from such a condition that the calculated value of at reproduces the high-energy edge of the measured spectrum. Similarly, the low-energy edge of the measured spectrum can also be used to determine , which allows to reconfirm the value of obtained from the high-energy edge. Actually, the high- and low-energy edges are given by the H energies at half-heights of the right and left steps of the spectra shown in figure 4. This procedure is illustrated in figure 5, thereby we have determined m using the values of stopping powers by SRIM. The depth scales in figure 2 have been obtained accordingly. These depth scales and the smeared high- and low-energy edges of the spectra indicate that the depth resolution of the present T-ERDA is 2 m.
The depth-dependent H concentration in the muscovite sample can be obtained from the spectra in figure 4. When the axis is divided by a short interval of , the H yield contributed from the thickness range of to is expressed as
| (6) |
where is the number of incident He, is the He–H differential recoil cross section in the laboratory frame, which depends on the He energy at recoil and the solid angle , and the integral is performed for the solid angle of acceptance of the detector. Notably, equation (6) is on the basis of the fact that the counting efficiency of the detector for recoil H is effectively 100%, which has been assured, although indirectly, from the analysis results of PPS in §III.1. From equation (6), we obtain
| (7) |
where the recoil cross section is expressed as
| (8) |
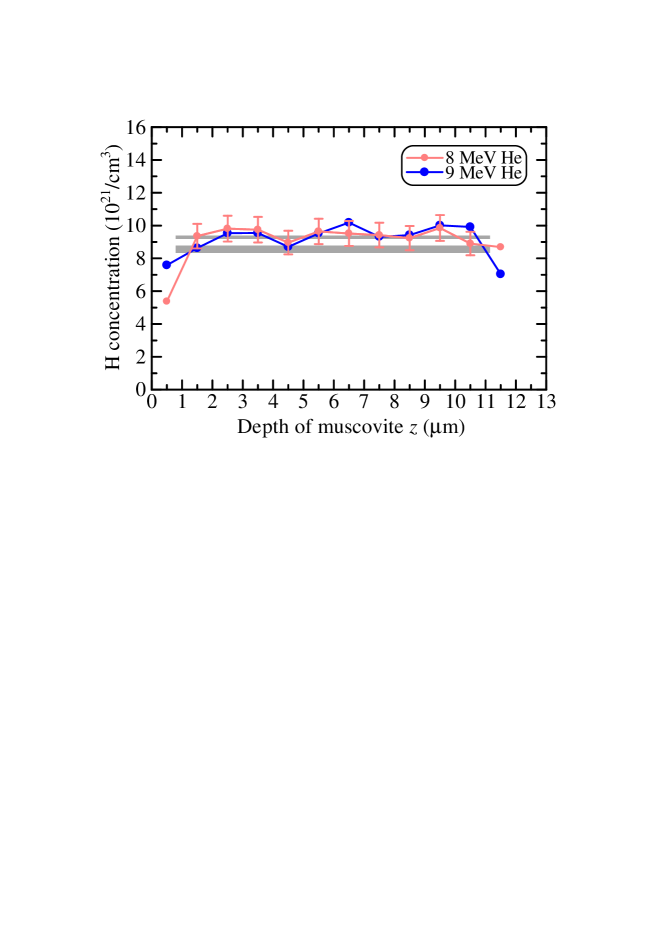
It is straightforward that for m can be determined using equation (7) and shown in figure 3. In this case, for every 1 m depth is obtained from the spectra in figure 4 after subtracting the slightly recognized background. Figure 6 shows determined in this manner. For example, the concentration of Hcm3 at m for 8 MeV results from counts for m, , and mb.
We see in figure 6 that the results of for 8 and 9 MeV He agree consistently with each other at the depth from 1.5 to 11 m. Outside this depth range, the slopes near the high- and low-energy ends of the spectra should lead to unreliable results. We see the uniformity of at m, hence the average value Hcm3 is obtained. The uncertainty of has been estimated as % in the similar manner to the case of PPS, except that the possible error of the PPS thickness is replaced by that of the muscovite thickness, %, as noted earlier. In figure 6, the value of agrees well with the H concentration of Hcm3 obtained from the data in table 1, using the density of the muscovite 2.83 g/cm3 and Avogadro’s constant. Furthermore. the value of cannot be accounted for with the concentration of Hcm3 which is obtained for the bound water only. Therefore, we may conclude that the absorbed water is distributed uniformly over the entire thickness of the muscovite sample with the present depth resolution of 2 m. This is unique information obtained by the nondestructive T-ERDA. These analysis results demonstrate the capability of accurate determination of hydrogen contents in materials and minerals by the present T-ERDA system.
IV Summary and Conclusion
Hydrogen concentrations in PPS and muscovite have been determined by T-ERDA without using reference samples. For PPS, the determined H concentration of cm3 is in good agreement with the calculated concentration of cm3. For muscovite, the H concentration is uniform over the entire thickness of the sample with the depth resolution of 2 m, and the average value Hcm3 agrees excellently with Hcm3 which is obtained from the measured chemical composition of the muscovite sample, listed in table 1. This also implies that the H concentration originating from absorbed water is uniform in the muscovite, like that from bound water constituting the crystal structure of muscovite. These analysis results assure reliability of T-ERDA under the condition of nuclear elastically enhanced recoiling.
In the present T-ERDA, the sensitivity to H content is restricted by the background yield, noted in §III.1. Obviously, the background yield can be suppressed by replacing the present stopping foil (50 m thick Al) by a foil of heavier element with higher Coulomb barrier. Such a refinement in the experimental setup might be of technical importance when the T-ERDA system is used for analysis of not only small amount of hydrogen, but also trace amount of deuterium introduced in a foil sample.
ACKNOWLEDGEMENTS
The authors thank the technical staff of UTTAC for operating the
6MV tandem accelerator for supporting the experiments.
We are grateful to Toray KP Films Inc. for providing the PPS films, and to
Toyo Aluminium K. K. for providing a set of Al foils of different thicknesses.
References
- [1] Condon J B and Schober T, 1993 J. Nucl. Mater. 207 1–24
- [2] Sweeney R J, Prozesky V M and Springhorn K A 1997 Geochim. Cosmochim. Acta 61 101–113
- [3] Raepsaet C, Bureau H, Khodja H, Aubaud C and Carraro A 2008 Nucl. Instrum. Meth. Phys. Res. B 266 1333–1337
- [4] Bureau H, Raepsaet C, Khodja H, Carraro A and Aubaud C 2009 Geochim. Cosmochim. Acta 73 3311–3322
- [5] Stephant A, Anand M, Ashcroft H O, Zhao X, Hu S, Korotev R L, Strekopytov S, Greenwood R C, Humphreys-Williams E, Liu Y, Tang G, Li Q and Franchi I A 2019 Geochim. Cosmochim. Acta 266 163–183
- [6] Lin Y and van Westrenen W 2021 Global Planet. Change 197 103393
- [7] Lanford W A, Nuclear Reactions for Hydrogen Analysis. In: Tesmer J R, Nastasi M, Barbour J C, Maggiore C J and Mayer J W, editors. Handbook of Modern Ion Beam Materials Analysis, Materials Research Society, 1995
- [8] Tirira J, Trocellier P and Frontier J P 1990 Nucl. Instrum. Meth. Phys. Res. B 45 147–150
- [9] Tirira J, Trocellier P, Frontier J P, Massiot Ph, Costantini J M and Mori V, 1990 Nucl. Instrum. Meth. Phys. Res. B 50 135–139
- [10] Hofsäss H C, Parikh N R, Swanson M L and Chu W-K 1990 Nucl. Instrum. Meth. Phys. Res. B 45 151–156
- [11] Furuno K, Komatsubara T, Sasa K, Oshima H, Yamato Y, Ishii S, Kimura H and Kurosawa M 2003 Nucl. Instrum. Meth. Phys. Res. B 210 459–463
- [12] Reichart P, Datzmann G, Hauptner A, Hertenberger R, Wild C and Dollinger G 2004 Science 306 1537–1540
- [13] Weis F A, Ros L, Reichart P, Skogby H, Kristiansson P and Dollinger G 2018 Phys. Chem. Miner. 45 669–678
- [14] Griesche A, Dabah E, Kannengiesser T, Kardjilov N, Hilger A and Manke I 2014 Acta Materialia 78 14–22
- [15] Yamazaki A, Sasa K, Tomita S, Ishii S, Naramoto H, Sataka M, Kudo H, Itoh G and Ohkubo M 2019 AIP Advances 9 105111
- [16] IBANDL (Ion Beam Analysis Nuclear Data Library). https://www-nds.iaea.org/exfor/ibandl.htm
- [17] Kudo H, Naramoto H, Sataka M, Ishii S, Sasa K and Tomita S 2021 J. Phys. Condensed Matter 33 465901
- [18] Ros L, Kristiansson P, Borysiuk M, Abdel N, Elfman M, Nilsson E J C and Pallon J 2015 Nucl. Instrum. Meth. Phys. Res. B 348 273–277
- [19] Kinomura A, Nakao S, Suzuki K, Kuzuya Y, Nakajima M and Yasuda K 2021 Nucl. Instrum. Meth. Phys. Res. B 502 54–58
- [20] Udagawa S, Urabe K, Ikawa H, Katoo K and Hasu H 1973 J. Clay Sci. Soc. Jp. (in Japanese) 13 131–138
- [21] Guggenheim S, Chang Y and Koster van Groos A 1987 Amer. Mineral. 72 537–550
- [22] Pusa P, Rauhala E, Gurbich A and Nurmela A 2004 Nucl. Instrum. Meth. Phys. Res. B 222 686–689
- [23] Hupin G, Quaglioni S and Navrátil P 2014 Phys. Rev. 90 061601(R)
- [24] Ziegler J F and Biersack J P, SRIM2013, The Stopping and Range of Ions in Matter http://www.srim.org/