Strain-induced thermoelectricity in pentacene
Abstract
The present work discusses a non-synthetic strategy to achieve a favorable thermoelectric response in pentacene via strain. It is found that a uni-axial strain is capable of inducing spatial anisotropy in the molecule. As a result, the transmission spectrum becomes highly asymmetric under a particular strained scenario, which is the primary requirement to get a favorable thermoelectric response. Different thermoelectric quantities are computed for the strain-induced pentacene using Green’s function formalism following the Landauer-Büttiker prescription. Various scenarios are considered to make the present work more realistic, such as the effects of substrate, coupling strength between the molecule and electrodes, dangling bonds, etc. Such a scheme to enhance the thermoelectric performance in pentacene is technologically intriguing and completely new to the best of our knowledge.
I Introduction
The detrimental nature of climate change led us to think of efficient, renewable, and unconventional energy sources. A recent study reveals that of the global energy consumption is wasted as a form of heat energyCullen and Allwood (2010); Bell (2008). Naturally, it prompts us to develop efficient mechanisms which convert this ‘waste-heat’ energy into electrical energy. Thermoelectric (TE) phenomenon enables direct conversion of heat energy into electricity and vice versaSnyder and Toberer (2008); He and Tritt (2017). Therefore, thermoelectricity can potentially be one of the unconventional energy sources, which can also address the global energy crisis and global warming. At present, the wide applicability of TE devices hinges on the efficacy of the TE material.
The efficiency of TE material is quantified by a dimensionless parameter, dubbed as figure of merit (), and expressed as Hicks and Dresselhaus (1993a)
| (1) |
where , and are the Seebeck coefficient, electrical conductance, temperature, and total thermal conductance, respectively. Since both electrons and phonons are heat carriers, the total thermal conductance comprises of two parts – electronic part () and phononic part (). Typically, a material with is regarded as a good TE material. However, to be economically competitive, materials with are often recommended Tritt (2011). To have larger TE efficiency of a material, a large Seebeck coefficient, high electrical conductivity, and low thermal conductivity are highly solicited. However, it turns out that these material properties are interrelated and also possess conflicting interests. For example, to get higher , we want large electrical transport and, at the same time, suppression of the phonon transport which is conflicting Zhang et al. (2014). These contrasting attributes pose a great challenge to the optimization of the functional element as a TE material.
In recent years, there has been a significant advancement in the TE sector Dresselhaus et al. (2007), and it has been identified that nanostructures and low-dimensional systems show better performance than the bulk ones Kubala et al. (2008); Hicks and Dresselhaus (1993a, b). But, the technology to obtain such structures is complicated, expensive, and hence far from commercialization. Recent advancements in this field indicate that there is a growing inclination towards the organic compound as a TE material. The organic materials enjoy superiority over the inorganic ones due to their unique characteristics of being flexible, low-cost, diversified molecular design, ease of manufacturing, light-weight, and above all, low intrinsic thermal conductivity, typically below Zhang and Di (2020); Russ et al. (2016); Zhang et al. (2014).
Of late, the idea of using single molecules as a functional element has propelled extensive experimental and theoretical investigations to understand the charge transport through molecular junctions Cuevas and Scheer (2010). The molecular junctions are thought to be promising candidates to deliver high efficiencies due to the discreteness of the energy spectrum, and the properties can be tuned via chemical synthesis, electrostatic gates, or by applying pressure Rincón-García et al. (2016). Motivated by these, pentacene which is an organic molecule, consists of five linearly-fused benzene rings, is chosen as the TE material for the present work. However, for a pure pentacene molecule, is close to one Wang et al. (2009), which is still far beyond the level of meeting the practical applications. Nevertheless, significant progress has been made in developing high-performance TE devices using organic molecules by employing various strategies like chemical doping Kang et al. (2019, 2016); Yamashita et al. (2019), field-modulated doping Huang et al. (2016); Pernstich et al. (2008); Zhang et al. (2015), and strain Zhang et al. (2021).
It turns out that carrier mobility is one of the key factors to determine the TE response. For small organic molecules like pentacene, the inter-molecular packing and molecular structure become decisive to the carrier mobility da Silva Filho et al. (2005); Yuan et al. (2014) and hence the TE performance. Due to the presence of weak Van der Waals interaction, these organic molecules easily undergo lattice deformation under the application of external force Yuan et al. (2014); Reyes-Martinez et al. (2015). Thus, as a non-synthetic strategy, introducing strain in such molecular junction could be an efficient way to improve the TE performance Zhang et al. (2021). For example, in case of TIPS (tri-isopropylsilyly-ethynyl) pentacene, carrier mobility increases from to cm2V-1s-1 when the stacking distance is decreased from Å to Å Giri et al. (2011). There are other studies where the directional dependence of TE properties on strain is explored Matta et al. (2018); Landi et al. (2021). However, to the best of our knowledge, the effect of strain on the TE properties of the organic molecules is yet to be fully understood.
In this present communication, we study the TE response in a typical small organic molecule like pentacene and propose a non-synthetic strategy to achieve favorable TE performance. The strain is introduced along the direction of the benzene chain, and its effect is incorporated through the hopping integral Ribeiro et al. (2009); Naumis et al. (2017). The strain effectively changes different bond lengths depending upon the strain direction and the corresponding hopping integrals get modified accordingly. This in turn induces a spatial anisotropy in the hopping terms of the molecule. Consequently, an asymmetry in the transmission spectrum is expected, which is the key requirement to get higher Mahan and Sofo (1996); Zerah-Harush and Dubi (2015). We employ the non-equilibrium Green’s function formalism, based on Landauer-Büttiker prescription to compute two-terminal transmission probability Datta (1997, 2005). Using Landauer’s prescription, the TE performance is examined by evaluating the electrical conductance, thermopower, and thermal conductance due to both the electrons and phonons Zerah-Harush and Dubi (2015); Finch et al. (2009). In the case of small organic molecules, at low temperature, the contribution of phonon to the thermal conductance is very small compared to the electronic one and hence can be safely ignored Yang et al. (2020). However, at high temperatures, such as room temperature, the phonon thermal conductance must be included.
The key findings of our work are (i) single organic molecules can be a promising class of TE materials, (ii) our study provides a nonsynthetic strategy for optimizing TE properties of organic molecules, (iii) figure of merit of pure pentacene molecule can be significantly enhanced by applying strain, and (iv) compared to stretching, compression along the benzene chain shows a favorable TE response.
The rest of the presentation is organized as follows. In Sec. II, we present the model and the necessary theoretical formulation to compute different TE quantities. All the results are critically analyzed in Sec. III. Finally, in Sec. IV, we end with concluding remarks.
II Theoretical formulation
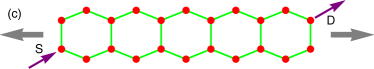
Figure 1 depicts the schematic diagram of our proposed device where a single pentacene molecule is connected with two one-dimensional (1D) semi-infinite electrodes, namely source () and drain (), denoted by purple arrows. These two electrodes are kept at two different temperatures and , where is infinitesimally small. Thus, we restrict ourselves to the linear response regime. Figure 1(a) shows the strain less case while Figs. 1(b) and (c) show the schematic diagrams in presence of strain. We use the nearest-neighbor tight-binding Hamiltonian to describe the system.


Model Hamiltonian: The Hamiltonian representing the total system comprises of four parts and it is written as
| (2) |
Where and are the sub-parts of the Hamiltonian associated with the molecular junction, source, drain, and the coupling between the electrodes and the molecular junction, respectively. Each of these sub-parts of the Hamiltonian is given by
| (3a) | |||||
| (3b) | |||||
| (3c) | |||||
where denotes the on-site energy at site and represents hopping amplitude from site to . Here, represent the annihilation operators whereas their hermitian conjugates denote the creation operators and satisfy anti-commutation relation. The parenthesis denotes that the interaction is limited to nearest-neighbor only. For pure pentacene molecule, on-site energies are independent of and can be taken as a constant. On-site potential and hopping amplitude are taken to be the same for both the electrodes. The coupling between the source(drain) and the molecular junction is denoted by .
Incorporation of strain: Here, we consider a uni-axial strain, applied along the chain of the benzene rings. The introduction of strain changes the distances between atomic sites, and thus the hopping amplitude is modified accordingly. The modified hopping integral with the bond length is given by Ribeiro et al. (2009); Naumis et al. (2017)
| (4) |
where is the hopping integral without strain, while is the modified hopping inegral due to strain. and be the lattice constant and modified bond length respectively. is the Grüneisen parameter, a measure of the phonon mode softening or hardening rate. This parameter can be calculated using Raman scattering experiment Mohiuddin et al. (2009); Ding et al. (2010) or from ab initio calculations Cheng et al. (2011). Usually, for graphene, Grüneisen parameter ranges between 2-3. In a recent DFT-based work Abdulla et al. (2015), Grüneisen parameter for tetracene has been reported as 2.82. In such degree, we assume the Grüneisen parameter for pentacene in the present work.
We define a dimensionless quantity , which can be thought of as a continuous parameter to illustrate the effect of strain. Clearly, when , the parameter becomes positive implying the stretching of the molecular junction. On the other hand, indicates the compression of the same. Since we are introducing the strain along the benzene chain, only the angular hopping amplitude is modified, whereas the vertical hopping amplitude remains the same.
It is to be noted that the functional form of the hopping integral under strain is taken from Ref. Ribeiro et al. (2009); Naumis et al. (2017) which deals with the similar kinds of 2D structures like graphene where the geometrical building block is pentacene. Here we must mention that we aim to examine the effect of strain on the TE properties of pentacene which is invoked through the modification of hopping integral. The presence of strain modifies the distances between atomic sites, and the hopping amplitude is altered accordingly. It turns out that the modification of the hopping integral does influence the TE properties, as the transmission spectra become highly asymmetric, which is the primary requirement for favorable TE response. The specific functional form of , as mentioned in Eq. 4, is not so much important. One can also consider other functional forms as well, which we confirm through our detailed numerical calculations. The central issue is that we need to consider a finite (slow) variation of in presence of strain.
In order to study the TE properties under strained and unstrained conditions, we need to calculate different TE quantities along with transmission function. The prescription is as follows.
Two-terminal transmission probability: We calculate the two-terminal transmission probability for electrons travelling from source to drain through the molecular junction. We employ the non-equilibrium Green’s function technique Datta (1997, 2005) to evaluate the two-terminal transmission probability. The retarded Green’s function can be obtained from the following equation
| (5) |
where and represent the self-energies of the source and drain, respectively. Now, the transmission probability can be expressed in terms of retarded () and advanced Green’s functions as
| (6) |
where and are the coupling matrices that describe the rate at which particles scatter between the electrodes and the molecular junction.
Thermoelectric quantities: In the linear response regime, all the TE quantities like , , and can be extracted using Landauer’s integrals as Zerah-Harush and Dubi (2015); Finch et al. (2009); Mondal et al. (2021)
| (7a) | |||||
| (7b) | |||||
| (7c) | |||||
where the Landauer’s integral is given by
| (8) |
Where , and indicate Planck’s constant, equilibrium Fermi-Dirac occupation probability, and Fermi energy respectively. Here, is the two-terminal transmission probability.
The figure of merit can be expressed in the following form Ganguly and Maiti (2020); Zerah-Harush and Dubi (2015)
| (9) |
The product of the electrical conductance and the square of the thermopower is known as the power factor i.e. . For a good TE material, should be as high as possible. We must mention that the maximum power of a TE device not only depends on the power factor but also on the temperature difference between the electrodes. The expression for the maximum power is given by Benenti et al. (2011); Briones-Torres et al. (2021)
| (10) |
The efficiency of the TE device at the maximum power is given by Benenti et al. (2011); Briones-Torres et al. (2021)
| (11) |
where indicates the ideal Carnot efficiency.
Phonon thermal conductance:
Since we are working with a single-molecule, the lattice vibration is quite small at low temperature and hence is very small compared to its electronic counterpart Yang et al. (2020). However, that is not the case at high temperatures and hence the phononic contribution to the thermal conductance should be included to get a precise estimation of . The phonon thermal conductance can be computed from the following expression Zhang et al. (2007); Hopkins and Serrano (2009); Hopkins et al. (2009) as
| (12) |
Here, and are the phonon and cut-off frequencies respectively. We consider only elastic scattering in the present case. denotes the Bose-Einstein distribution function. is the phonon transmission probability across the pentacene, evaluated using the standard Green’s function technique as Hopkins et al. (2009)
| (13) |
is known as the thermal broadening. is the self-energy matrix for the source/drain electrode. The Green’s function for pentacene reads as Hopkins et al. (2009)
| (14) |
where is a diagonal matrix describes the mass matrix of pentacene. Each element of the mass matrix denotes the mass of the atom at the -th position in the pentacene molecule. is the matrix of spring constants in the pentacene. An element in the diagonal denotes the restoring force of the -th atom due to its neighboring atoms, while the element represents the effective spring constant between -th and -th neighboring atoms. The self-energy matrices and have the same dimension as and and can be computed by evaluating the self-energy term , where is the spring constant at the electrode-pentacene contact interface.
Different spring constants are assumed through the second derivative of Harrison’s interatomic potential Harrison (1980). For the 1D electrodes, we need to know the interatomic spacing and the elastic constant , as transverse interaction is absent in 1D system. The expression for the spring constant is . However, as the pentacene is a 2D object, the transverse interaction needs to be included through the other elastic constant and the expression for the spring for the pentacene becomes Kittel (2004) . Once the mass and spin constant are known, the cut-off frequency for the 1D electrodes is determined from the relation . To have a detailed description of the methodology and to compute phonon thermal conductance, see Refs. Zhang et al. (2007); Hopkins and Serrano (2009); Hopkins et al. (2009).
III Numerical results and discussion
In this section, we report the details of the TE response in pentacene with and without strain. We commonly refer case as the pristine molecule. To begin with, let us first mention the parameters which are kept fixed throughout the present work. The lattice constant of pentacene is taken to be unity. The on-site energies of the molecular junction as well as the electrodes are set at zero. It is easy to establish that any non-zero values of on-site energy will not alter the essential physics of the present work. All the results reported here involving energies are measured in units of eV. We restrict ourselves in the wideband limit, and the NNH integral for the electrodes is kept fixed at eV whereas for pentacene it is eV. The coupling between the electrodes and the functional element ( and ) are taken to be the same and are set at eV.
Before presenting the results, it is imperative to have an estimation of the modified bond lengths under strained conditions. We compute the results for typical cases of the strained molecule, namely, and , for illustrations. When , the angular bond length is stretched by 10 to , with assumed Grüneisen parameter . Whereas, the angular bond length is compressed by the same amount as the former case when . Transmission Spectra:
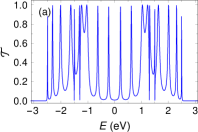
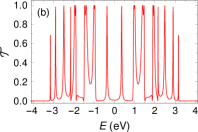
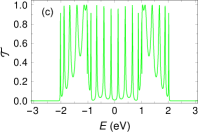
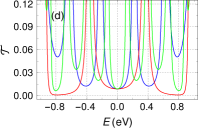
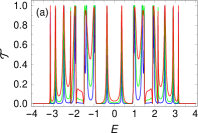
We begin our discussion by analyzing the two-terminal transmission probability () as a function of energy both in the absence and presence of strain. The transmission probability is calculated following Eq. 6. The variation of as a function of energy for three cases, namely, and are shown in Fig. 2. In Fig. 2(b), for , the allowed energy window is wider than that of the pristine case (Fig. 2(a)), while it gets shortened for (fig. 2(c)). Such modifications in the allowed energy window are completely due to the modified hopping integrals under different strained conditions as is expected from Eq. 4. The transmission spectra are also significantly modified in the presence of strain. Interestingly, in Fig. 2(b), we see that on either side of , the transmission probability is vanishingly small over a narrow energy window associated with a sharp peak. This is clearly visible in Fig. 2(d), where the transmission spectra are shown within a narrow energy window for the former three -values. Such a situation indicates that the transmission spectrum is asymmetric over that energy region and may yield a favorable TE response Ganguly and Maiti (2020) as we shall see in the forthcoming discussion. It should be noted here that the asymmetry in the transmission function occurs due to the induced spatial anisotropy in the hopping integrals by strain.
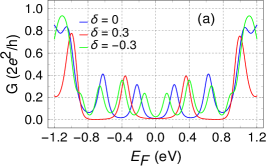
Thermoelectric quantities: Now, let us study the thermoelectric response of pentacene by analyzing the TE entities like electrical conductance, thermopower, thermal conductance, and figure of merit at room temperature (K). Two different strained scenarios are considered, namely, and -0.3, including the pristine case, that is and the corresponding results are represented by blue, red, and green colors, respectively as shown in Fig. 3.
The variation of electrical conductance (in units of ) with Fermi energy is shown in Fig. 3(a). Within the given Fermi energy window, the behavior of is distinctly different for the three considered -values, where the sharp peaks in their respective transmission spectrum (Fig. 2) are smeared out due to the temperature broadening. At and around , is vanishingly small for the stretched condition (, red curve) while it is finite for the other two cases ( and -0.3) within the said Fermi energy region.
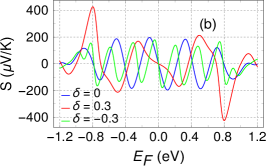
The behavior of thermopower as a function of Fermi energy is depicted in Fig. 3(b). Interestingly, is about 400V/K at for , while for the other two -values, is restricted within V/K within the given Fermi energy window. Such a significantly enhanced for the stretched condition is completely due to the asymmetry in the corresponding transmission spectrum as noticed earlier in Fig. 2. This in turn may increase the figure of merit, since .
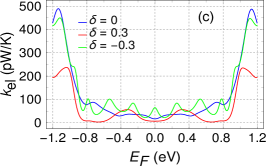
Like the electronic conductance, the thermal conductance due to electrons shows more or less similar behavior as a function of Fermi energy as shown in Fig. 3(c). We see that attains relatively lower values for the stretched condition () than the other two cases throughout the given Fermi energy window. Moreover, is significantly suppressed for close to the band center and also at and around . Since appears in the denominator in the expression of , a stretched scenario should yield a favorable TE response.
What we accumulate from Figs. 3(a-c) is that the introduction of strain significantly modifies the different TE quantities. Particularly, for case, though the electrical conductance is low but larger thermopower and significantly suppressed thermal conductance due to electrons should result in a better TE response. The combined effect of all these TE quantities will be reflected in the behavior of which we will discuss now.
The surface plot in Fig. 4 shows the variation of as a function of Fermi energy corresponding to the -values as discussed earlier. For the pristine case, the maximum is found to be at room temperature which matches quite well with the existing ab initio results, where of pure pentacene molecule is reported to be at K Wang et al. (2009). The introduction of a uni-axial strain significantly modifies the TE performance. For , TE response is not up to the mark as is seen by the green curve in Fig. 4. The most favorable response is obtained for the stretched scenario with the strain parameter , as is noticed by the two red

peaks in Fig. 4. Specifically, near the Fermi energy , , which is much larger than unity and certainly is a favorable TE response. Thus, we can say that such high values of are achieved by the enhancement of thermopower and the suppression of thermal conductance due to electrons in presence of strain, particularly for the stretched condition.
The effectiveness of the TE response is usually measured by the dimensionless quantity as discussed earlier. However, there are other key parameters to gauge the TE response of a material. Such as the power factor and efficiency, the studies which are also important to see the applicability of a TE material, especially for power generation applications Liu et al. (2016). Therefore, below we discuss the power factor and the efficiency of pentacene both for the strain-less and strained cases.
The behavior of the power factor as a function of Fermi energy is depicted in Fig. 5 for the -values as considered before. For the strain-less case, the power has a maximum value pW/K2. The behavior of the power factor for is more or less similar to the pristine case.
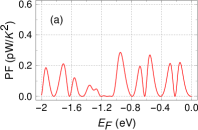
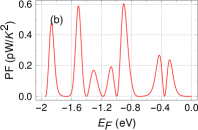
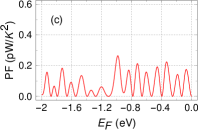
However, the power factor for is almost twice the previous two cases and has a value of pW/k2 near . Thus, we see that the introduction of strain improves the power factor. However, the maximum power can be estimated by employing Eq. 10. For example, at room temperature for and eV, the maximum power is pW/K2, where is infinitesimal temperature difference between the electrodes.
It is easy to see from Eq. 11 that the efficiency at maximum power is just a parametric extension of figure of merit. Naturally, we expect similar behavior of efficiency at maximum power to the . The efficiency at maximum power () (normalised to ideal Carnot efficiency ) is presented as a function of Fermi energy in Fig. 6. The efficiencies at maximum power for (Fig. 6(a)) and -0.3 (Fig. 6(c)) are somewhat similar and the maximum efficiency is noted about 20 of the ideal Carnot engine efficiency. On the other hand,
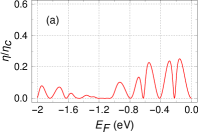
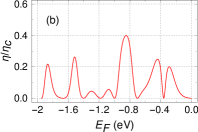
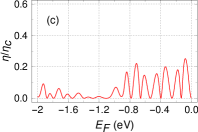
the efficiency at maximum power for at room temperature is found to be (Fig. 6(b)), which is quite good from the application point of view.
III.1 Thermal conductance due to phonon
Now, we discuss the results due to phonons. To begin with, let us mention the values that are considered in the present work. The system is treated as the spring-mass system to compute . As mentioned earlier, the spring constants are calculated from the second derivative of the harmonic Harrison potential Harrison (1980). For the 1D electrodes, we consider two different materials, namely, Ge and Au. The spring constant for Ge is considered as Hopkins et al. (2009) N/m, while for Au Neighbours and Alers (1958), it is N/m. For the pentacene, the spring constant is N/m in the absence of strain, which is considered as same as the single-crystal benzene Heseltine et al. (1964). The cut-off frequency of vibration depends on the material properties of the electrodes and the pentacene since we assume that two different atoms are adjacent to each other at the interface. For the chosen setup, by averaging the spring constants of the electrodes and pentacene, and the masses, the cut-off frequency for Ge electrodes comes out to be Trad/s, and for Au electrode, it is 15.1 Trad/s. It should be noted that here the effect of strain is also considered through the change in bond length ( case, which yielded the favorable TE response) as discussed earlier and the effective spring constant for pentacene is included in the calculation of the phonon thermal conductance.
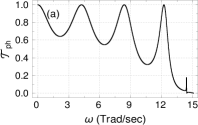
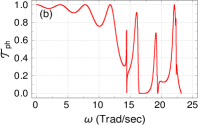
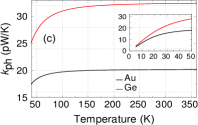
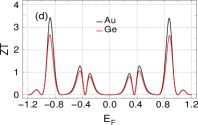
In Figs. 7(a) and (b), we plot the phonon transmission probability as a function of phonon frequency for the Au and Ge electrodes. Fabry-pérot-likes peaks are observed in both the cases as discussed in Ref. Hopkins et al. (2009). The behavior of phonon thermal conductance with temperature is shown in Fig. 7(c). In the inset of the same plot, we show variation at low temperatures. We observe that is only a few pW/K at very low temperature, which is in good agreement with our previous statement Yang et al. (2020). As the temperature increases, tends to saturate. The saturated value for Ge electrode is about 20 pW/K and for Au electrode, it is about 32 pW/K. With these values of , we finally compute the total which includes the thermal conductance due to electronic contribution as well as the phonons, as shown in Fig. 7. The maximum is noted for Au electrode is about 3.5 and for Ge about 2.8, which are greater than unity. Thus it is evident that even if one includes the phononic contribution, favorable TE response persists at room temperature.
III.2 Effect of Temperature
Since, our study reveals that , that is, stretching the functional element is more effective for achieving the favorable TE response,

we examine the temperature dependence of for this particular case. In Fig. 8, we plot for three different temperature values, namely, K, K, and K, represented by blue, red, and green colors, respectively. Here, tends to increase with temperature and the maximum values of for the said temperatures within the given Fermi energy window are about , , and , respectively. Note that within a wide range of temperatures, is always higher than unity.
III.3 Effect of electrode-molecule coupling
The electrodes-molecule coupling strength plays a crucial role in TE response. In all the earlier plots, the coupling strength was fixed at 0.75 eV. Here we also consider two other different strengths, namely, eV and 1 eV to study the TE performance. It should be noted that all the chosen coupling strengths are within the wideband limit. The results for eV, 0.75 eV, and 1 eV are denoted with blue, green, and red colors, respectively. Here eV is included for the sake of comparison. First we study the transmission
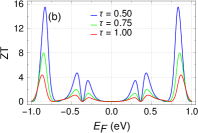
spectrum as shown in Fig. 9(a). The coupling strengths between the electrodes and molecule provide the broadening in the transmission spectrum. For instance, in the case of weak coupling strength (eV, blue curve), the transmission probability shows a few sharp peaks. Other than the sharp peaks, transmission probability is either zero or vanishingly small throughout the given energy window. On the other hand, for the strong coupling strength (eV, red curve), the transmission spectra is comparatively broadened than the other two cases. The transmission function becomes more asymmetric with reducing the electrode-molecule coupling strength. Naturally, much favorable response is expected in the limit of weak-coupling, which is clearly reflected from Fig. 9. From weak to strong coupling strengths, the value of decreases in a regular manner. For eV, the maximum is noted about 16, while for eV. Nevertheless, all the chosen coupling strengths exhibit favorable TE responses.
III.4 Role of substrate
Usually, molecules are grown on glass or metallic substrates Wang et al. (2004); Fritz et al. (2004); Shioya et al. (2019). Recently, pentacene has also been prepared by vacuum deposition with ionic liquids Takeyama et al. (2011). Since the substrates or the immediate environment around the molecule can modify the electronic properties of the molecule, their effects must be taken into account while studying the TE response. Such effects can be incorporated via disorder in the present case, which may arise due to the trapped charge impurities on the surface, surface roughness, etc. Rycerz et al. (2007); Lewenkopf and Mucciolo (2013). Therefore, we consider disorder

effect in our system, where the disorders are included in the site energies of the pentacene ‘randomly’ from a Box distribution function of width , that is the site energies are chosen randomly within the range . As the site energies are random, we compute by taking the average of over a large number of distinct disordered configurations, to get reliable results. In Fig. 10, we plot as a function of for two disorder strengths, namely, (denoted with green) and 0.2 (denoted with red), and include the disorder-free case (denoted with blue) for comparison. In presence of disorder, the transmission probability will have lower values due to the localization effect and hence the degree of TE performance will suppress. This fact is clearly seen in Fig. 10, specifically, near the Fermi energy eV. The important observation is that for , is still greater than unity, which is a favorable response.
III.5 Effect of dangling bonds
Finally, we study the effect of dangling bonds on the TE performance, which may present in pentacene. Usually, hydrogen (H) bonding or H-replacement is not energetically favored in pentacene on H-passivated surfacesTsetseris and Pantelides (2005). However, when a single pentacene molecule is chemically absorbed on silicon surface, the molecule may acquire a few dangling bonds with H as well as Si Choudhary et al. (2005); Suzuki et al. (2006). Therefore, in order to see whether the presence of dangling bonds enhances the TE performance, we consider only the dangling bonds with H atoms Yamaguchi (1999). Here we also consider the strain condition , which gave us the favorable TE response. The hopping integral between the sites of the pentacene and H is considered as 0.9 eV. The on-site energy for the dangling sites is set at 0.1 eV.

All other parameters are identical as earlier. In Fig. 11, we plot as a function of the Fermi energy considering the dangling bonds. Interestingly, the result is highly favorable, as the maximum is noted at about 16. This considerable enhancement in is quite expected. This is because, as we introduce the dangling bonds in our system, we basically include some asymmetry in the system through the on-site energies and the hopping integrals in the dangling bonds. This, in turn, makes the transmission function more asymmetric and hence the significant enhancement in .
Here it is relevant to note that other -values can also be taken into account to investigate the TE properties. From our exhaustive calculations, we find favorable responses for other values of as well.
Experimental feasibility: Recently, the solution processing techniques have been used to alter the molecular packing through lattice strain leading to efficient, low-cost organic semiconductor devices Becerril et al. (2008); Sakanoue and Sirringhaus (2010). For example, using solution shearing methods, Giri et al. have shown that molecular stacking is reduced from to in the case of TIPS pentacene which is a derivative of pentacene Giri et al. (2011). One of the advantages of the above-mentioned solution-shearing technique is that it is possible to access new packing structures that are not possible through other commonly used methods, which increases the possibility of exploring the effects of the mechanical strain in a more general way.
IV Concluding remarks
In the present work, we have proposed a scheme to achieve a favorable TE response in a typical small organic molecule, namely, pentacene, via a non-synthetic strategy. We have particularly shown that the TE performance can be enhanced significantly when the system under consideration is subjected to a uni-axial strain along the longitudinal direction. The proposed setup is described within the nearest-neighbor tight-binding framework and the effect of uni-axial strain is incorporated through the hopping integrals. Different thermoelectric quantities are computed using Green’s function formalism following the Landauer-Büttiker prescription.
The key outcomes of the present work are as follows:
The uni-axial strain induces a spatial anisotropy in the hopping integrals, which significantly modifies the transmission spectra.
The thermopower increases considerably and the thermal conductance due to electrons is suppressed significantly for the stretched condition than those for the pristine and compressed cases.
Corresponding is much higher than unity at room temperature and thus is a favorable response.
The studies of power factor and efficiency at maximum power show that our proposed setup is suitable for application purposes.
The inclusion of the phononic contribution though suppresses the TE response, is still higher than unity.
shows an increasing trend with temperature.
The role of substrate, presence of dangling bonds, modulation of the electrode-molecule coupling strength, each of the scenarios exhibits favorable TE response.
In view of the promising results of the present work, our proposal provides a significant boost to the TE community. Various simple/complex molecular structures can be explored via our proposed non-synthetic strategy, that is, strain. The said exploration may yield non-trivial TE responses and may find suitable for designing efficient TE devices.
COMPETING INTERESTS STATEMENT
The authors declare that they have no known competing financial interests or personal relationships that could have appeared to influence the work reported in this paper.
DATA AVAILABILITY STATEMENT
Derived data supporting the findings of this study are available from the authors on request.
AUTHOR CONTRIBUTION STATEMENT
KM, SG, and SKM conceived the project. KM and SG performed the numerical calculations. KM, SG, and SKM analyzed the data and co-wrote the paper.
References
- Cullen and Allwood (2010) J. M. Cullen and J. M. Allwood, Energy 35, 2059 (2010).
- Bell (2008) L. E. Bell, Science 321, 1457 (2008).
- Snyder and Toberer (2008) G. J. Snyder and E. S. Toberer, Nature Materials 7, 105 (2008).
- He and Tritt (2017) J. He and T. M. Tritt, Science 357, eaak9997 (2017).
- Hicks and Dresselhaus (1993a) L. D. Hicks and M. S. Dresselhaus, Phys. Rev. B 47, 12727 (1993a).
- Tritt (2011) T. M. Tritt, Annual Review of Materials Research 41, 433 (2011).
- Zhang et al. (2014) Q. Zhang, Y. Sun, W. Xu, and D. Zhu, Advanced Materials 26, 6829 (2014).
- Dresselhaus et al. (2007) M. Dresselhaus, G. Chen, M. Tang, R. Yang, H. Lee, D. Wang, Z. Ren, J.-P. Fleurial, and P. Gogna, Advanced Materials 19, 1043 (2007).
- Kubala et al. (2008) B. Kubala, J. König, and J. Pekola, Phys. Rev. Lett. 100, 066801 (2008).
- Hicks and Dresselhaus (1993b) L. D. Hicks and M. S. Dresselhaus, Phys. Rev. B 47, 16631 (1993b).
- Zhang and Di (2020) F. Zhang and C.-a. Di, Chemistry of Materials 32, 2688 (2020).
- Russ et al. (2016) B. Russ, A. Glaudell, J. J. Urban, M. L. Chabinyc, and R. A. Segalman, Nature Reviews Materials 1, 16050 (2016).
- Cuevas and Scheer (2010) J. C. Cuevas and E. Scheer, Molecular electronics: an introduction to theory and experiment (World Scientific, 2010).
- Rincón-García et al. (2016) L. Rincón-García, C. Evangeli, G. Rubio-Bollinger, and N. Agraït, Chem. Soc. Rev. 45, 4285 (2016).
- Wang et al. (2009) D. Wang, L. Tang, M. Long, and Z. Shuai, The Journal of chemical physics 131, 224704 (2009).
- Kang et al. (2019) K. Kang, S. Schott, D. Venkateshvaran, K. Broch, G. Schweicher, D. Harkin, C. Jellett, C. Nielsen, I. McCulloch, and H. Sirringhaus, Materials Today Physics 8, 112 (2019).
- Kang et al. (2016) K. Kang, S. Watanabe, K. Broch, A. Sepe, A. Brown, I. Nasrallah, M. Nikolka, Z. Fei, M. Heeney, D. Matsumoto, K. Marumoto, H. Tanaka, S.-i. Kuroda, and H. Sirringhaus, Nature Materials 15, 896 (2016).
- Yamashita et al. (2019) Y. Yamashita, J. Tsurumi, M. Ohno, R. Fujimoto, S. Kumagai, T. Kurosawa, T. Okamoto, J. Takeya, and S. Watanabe, Nature 572, 634 (2019).
- Huang et al. (2016) D. Huang, C. Wang, Y. Zou, X. Shen, Y. Zang, H. Shen, X. Gao, Y. Yi, W. Xu, C.-a. Di, and D. Zhu, Angewandte Chemie International Edition 55, 10672 (2016).
- Pernstich et al. (2008) K. P. Pernstich, B. Rössner, and B. Batlogg, Nature Materials 7, 321 (2008).
- Zhang et al. (2015) F. Zhang, Y. Zang, D. Huang, C.-a. Di, X. Gao, H. Sirringhaus, and D. Zhu, Advanced Functional Materials 25, 3004 (2015).
- Zhang et al. (2021) Z. Zhang, N. Qi, Y. Wu, and Z. Chen, ACS Applied Materials & Interfaces 13, 44409 (2021).
- da Silva Filho et al. (2005) D. A. da Silva Filho, E.-G. Kim, and J.-L. Brédas, Advanced Materials 17, 1072 (2005).
- Yuan et al. (2014) Y. Yuan, G. Giri, A. L. Ayzner, A. P. Zoombelt, S. C. Mannsfeld, J. Chen, D. Nordlund, M. F. Toney, J. Huang, and Z. Bao, Nature communications 5, 1 (2014).
- Reyes-Martinez et al. (2015) M. A. Reyes-Martinez, A. J. Crosby, and A. L. Briseno, Nature Communications 6, 6948 (2015).
- Giri et al. (2011) G. Giri, E. Verploegen, S. C. B. Mannsfeld, S. Atahan-Evrenk, D. H. Kim, S. Y. Lee, H. A. Becerril, A. Aspuru-Guzik, M. F. Toney, and Z. Bao, Nature 480, 504 (2011).
- Matta et al. (2018) M. Matta, M. J. Pereira, S. M. Gali, D. Thuau, Y. Olivier, A. Briseno, I. Dufour, C. Ayela, G. Wantz, and L. Muccioli, Mater. Horiz. 5, 41 (2018).
- Landi et al. (2021) A. Landi, A. Peluso, and A. Troisi, Advanced Materials 33, 2008049 (2021).
- Ribeiro et al. (2009) R. M. Ribeiro, V. M. Pereira, N. M. R. Peres, P. R. Briddon, and A. H. C. Neto, New Journal of Physics 11, 115002 (2009).
- Naumis et al. (2017) G. G. Naumis, S. Barraza-Lopez, M. Oliva-Leyva, and H. Terrones, Reports on Progress in Physics 80, 096501 (2017).
- Mahan and Sofo (1996) G. D. Mahan and J. O. Sofo, Proceedings of the National Academy of Sciences 93, 7436 (1996).
- Zerah-Harush and Dubi (2015) E. Zerah-Harush and Y. Dubi, Phys. Rev. Applied 3, 064017 (2015).
- Datta (1997) S. Datta, Electronic transport in mesoscopic systems (Cambridge university press, 1997).
- Datta (2005) S. Datta, Quantum transport: atom to transistor (Cambridge university press, 2005).
- Finch et al. (2009) C. M. Finch, V. M. García-Suárez, and C. J. Lambert, Phys. Rev. B 79, 033405 (2009).
- Yang et al. (2020) N.-X. Yang, Q. Yan, and Q.-F. Sun, Phys. Rev. B 102, 245412 (2020).
- Mohiuddin et al. (2009) T. M. G. Mohiuddin, A. Lombardo, R. R. Nair, A. Bonetti, G. Savini, R. Jalil, N. Bonini, D. M. Basko, C. Galiotis, N. Marzari, K. S. Novoselov, A. K. Geim, and A. C. Ferrari, Phys. Rev. B 79, 205433 (2009).
- Ding et al. (2010) F. Ding, H. Ji, Y. Chen, A. Herklotz, K. Dörr, Y. Mei, A. Rastelli, and O. G. Schmidt, Nano Letters 10, 3453 (2010).
- Cheng et al. (2011) Y. C. Cheng, Z. Y. Zhu, G. S. Huang, and U. Schwingenschlögl, Phys. Rev. B 83, 115449 (2011).
- Abdulla et al. (2015) M. Abdulla, K. Refson, R. H. Friend, and P. D. Haynes, Journal of Physics: Condensed Matter 27, 375402 (2015).
- Mondal et al. (2021) K. Mondal, S. Ganguly, and S. K. Maiti, Scientific Reports 11, 17049 (2021).
- Ganguly and Maiti (2020) S. Ganguly and S. K. Maiti, Journal of Physics D: Applied Physics 54, 025301 (2020).
- Benenti et al. (2011) G. Benenti, K. Saito, and G. Casati, Phys. Rev. Lett. 106, 230602 (2011).
- Briones-Torres et al. (2021) J. A. Briones-Torres, R. Pérez-Álvarez, S. Molina-Valdovinos, and I. Rodríguez-Vargas, Scientific Reports 11, 13872 (2021).
- Zhang et al. (2007) W. Zhang, T. S. Fisher, and N. Mingo, Numerical Heat Transfer, Part B: Fundamentals 51, 333 (2007), https://doi.org/10.1080/10407790601144755 .
- Hopkins and Serrano (2009) P. E. Hopkins and J. R. Serrano, Phys. Rev. B 80, 201408 (2009).
- Hopkins et al. (2009) P. E. Hopkins, P. M. Norris, M. S. Tsegaye, and A. W. Ghosh, Journal of Applied Physics 106, 063503 (2009).
- Harrison (1980) W. A. Harrison, Electronic Structure and the Properties of Solids: The Physics of the Chemical Bond (Freeman, 1980).
- Kittel (2004) C. Kittel, Introduction to Solid State Physics, 8th ed. (Wiley, 2004).
- Liu et al. (2016) W. Liu, H. S. Kim, Q. Jie, and Z. Ren, Scripta Materialia 111, 3 (2016).
- Neighbours and Alers (1958) J. R. Neighbours and G. A. Alers, Phys. Rev. 111, 707 (1958).
- Heseltine et al. (1964) J. C. W. Heseltine, D. W. Elliott, and O. B. Wilson, The Journal of Chemical Physics 40, 2584 (1964), https://doi.org/10.1063/1.1725566 .
- Wang et al. (2004) Y. L. Wang, W. Ji, D. X. Shi, S. X. Du, C. Seidel, Y. G. Ma, H.-J. Gao, L. F. Chi, and H. Fuchs, Phys. Rev. B 69, 075408 (2004).
- Fritz et al. (2004) S. E. Fritz, S. M. Martin, C. D. Frisbie, M. D. Ward, and M. F. Toney, Journal of the American Chemical Society 126, 4084 (2004).
- Shioya et al. (2019) N. Shioya, R. Murdey, K. Nakao, H. Yoshida, T. Koganezawa, K. Eda, T. Shimoaka, and T. Hasegawa, Scientific Reports 9, 579 (2019).
- Takeyama et al. (2011) Y. Takeyama, S. Maruyama, and Y. Matsumoto, Crystal Growth & Design 11, 2273 (2011).
- Rycerz et al. (2007) A. Rycerz, J. Tworzydło, and C. W. J. Beenakker, Europhysics Letters (EPL) 79, 57003 (2007).
- Lewenkopf and Mucciolo (2013) C. H. Lewenkopf and E. R. Mucciolo, Journal of Computational Electronics 12, 203 (2013).
- Tsetseris and Pantelides (2005) L. Tsetseris and S. T. Pantelides, Applied Physics Letters 87, 233109 (2005), https://doi.org/10.1063/1.2139989 .
- Choudhary et al. (2005) D. Choudhary, P. Clancy, and D. Bowler, Surface Science 578, 20 (2005).
- Suzuki et al. (2006) T. Suzuki, D. Sorescu, and J. Yates, Surface Science 600, 5092 (2006).
- Yamaguchi (1999) T. Yamaguchi, Journal of the Physical Society of Japan 68, 1321 (1999).
- Becerril et al. (2008) H. A. Becerril, M. E. Roberts, Z. Liu, J. Locklin, and Z. Bao, Advanced Materials 20, 2588 (2008).
- Sakanoue and Sirringhaus (2010) T. Sakanoue and H. Sirringhaus, Nature Materials 9, 736 (2010).