BenchFaaS: Benchmarking Serverless Functions in an Edge Computing Network Testbed
Abstract
The serverless computing model has evolved as one of the key solutions in the cloud for fast autoscaling and capacity planning. In edge computing environments, however, the serverless model is challenged by the system heterogeneity and performance variability. In this paper, we introduce BenchFaaS, an open-source edge computing network testbed which automates the deployment and benchmarking of serverless functions. Our edge computing network considers a cluster of virtual machines and Raspberry Pis, and is designed to benchmark serverless functions under different hardware and network conditions. We measure and evaluate: (i) overhead incurred by testbed, (ii) performance of compute intensive tasks, (iii) impact of application payload size, (iv) scalability, and (v) performance of chained serverless functions. We share the lessons learnt in engineering and implementing the testbed. We present the measurement results and analyze the impact of networked infrastructure on serverless performance. The measurements indicate that a properly dimensioned edge computing network can effectively serve as a serverless infrastructure.
Index Terms:
serverless, edge, benchmark, functionsI Introduction
The Function-as-a-Service (FaaS) computing model removes decision-making on scaling thresholds, reduces costs by charging only when applications are triggered, and reduces application starting times [1]. Serverless, the execution model that FaaS implements, has been well studied in the cloud context [2]. Serverless furthermore adopts the most recent advances in containerization technologies, not only in the cloud, but also in edge computing [3, 4]. The serverless concept is especially attractive to application developers in a combined edge and cloud scenario to ensuring low latency together with high computing efficiency [5]. Today, even the computationally intensive applications, including deep learning models, run in edge computing systems [6].
From the networking perspective, it is critical to recognize that not only hardware appliances can impose limitations on serverless functions, but their placement in the network also plays a significant role in system performance. This is a vastly unexplored area today, and comes in addition to obvious and important known challenges, such as resource volatility and constraints, as well as heterogeneity [7]. In addition, containerization and software abstractions of heterogeneous edge devices have become essential to implement [8, 9]. Especially the so-called chaining of serverless functions take advantage of the modularity and flexibility of containerization [10]. To benchmark the performance of chaining functions is particularly challenging, especially in the context of the underlying network.
To address these challenges, we engineered BenchFaaS, a programmable and open-source edge computing network system testbed where users can run serverless functions over a Kubernetes cluster of virtual machines (VMs) and Raspberry Pis (RPs). The testbed can not only be configured to run on heterogenous edge computing resources, placed in various locations in the network, but the underlying network system can also be configured with various properties typical to wide area network (WAN), including varying network delays, variances and packet losses. We measure and evaluate: (i) overhead (or performance offset) of the testbed, (ii) performance of compute intensive tasks, (iii) impact of application payload size, (iv) scalability, and, (v) function chaining. The measurements indicate that a properly dimensioned system can effectively deploy resource constrained edge computing devices as a serverless network infrastructure.We show that resource dimensioning, and not only the delay performance, becomes a key factor to consider when designing serverless systems over edge computing networks.
BenchFaaS is offered as free and open source edge network testbed111F. Carpio and M. Michalke ”BenchFaaS” GitHub, 2022. [Online]. Available: https://github.com/fcarp10/benchfaas. suitable for serverless function performance benchmarking, and is fully reproducible. As such, it complements the related community-driven experimental studies, focused on the performance of different serverless platforms over third-party cloud/edge services [2, 9]. It also complements other related efforts focused on open source serverless platforms however without consideration of the underlying networked infrastructure [11, 4]. Earlier versions of BenchFaaS were conceptualized in our previous work [12].
The rest of the paper is organized as follows. Section II presents the architectural principles behind the testbed design. Section III describes the testbed configurations and benchmarking tests. Section IV analyzes the measurements. Section V concludes the paper.
II BenchFaaS Architectural Design
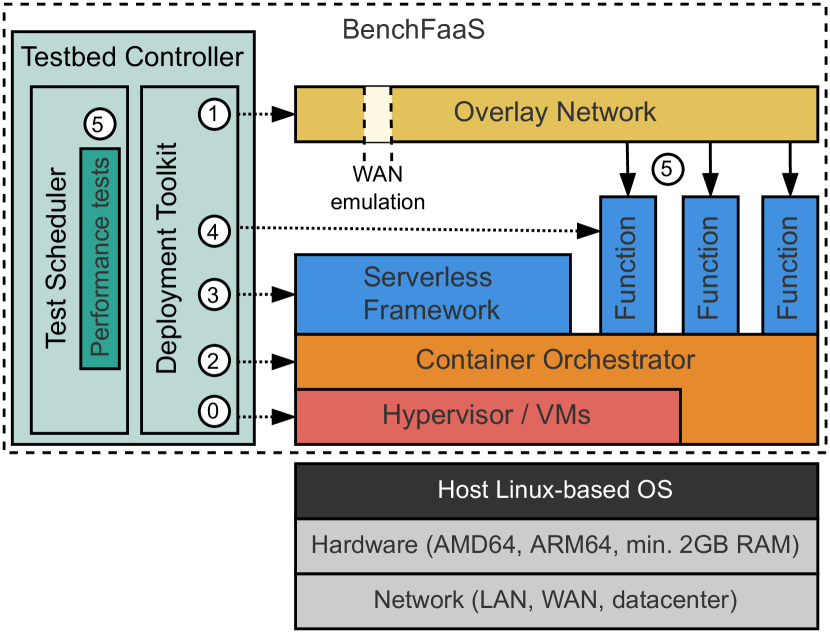
Building an edge computing system requires us to consider a heterogenous infrastructure distributed over different network segments. On the one hand, we need to support devices distributed over traditional LANs hidden behind NATs, and appliances allocated in cloud network domains hidden behind strict firewalls. On the other hand, the system needs to support heterogeneous devices; we consider the two most used CPU architectures today, i.e., AMD64 and ARM64, with the host operating system (OS) Linux-based and at least 2GB of RAM. We propose a system architecture as shown in Fig. 1. The remainder of this section provides more implementation details of the architecture deployment.
II-A Testbed Controller
The key component for BenchFaaS users is Deployment Toolkit (see Fig. 1) which automates the deployment of the different components and applies the specific programmable configuration of the testbed in five steps. In step 0, the testbed can be configured to use VMs, otherwise the functions can run over physical machines (PMs). In step 1, the emulation of the overlay network is configured, including emulation of delay, variance and packet loss parameters. In step 2 and step 3 the deployment of the container orchestrator and the installation of the serverless platform is applied, respectively. Once this is done, in step 4, all serverless functions are deployed. Then, Test Scheduler, in step 5, performs a series of benchmarking tests for serverless functions given a specific infrastructure and network setup. Both Test Scheduler and Deployment Toolkit are logically placed inside Testbed Controller, which can reconfigure the parameters and run the aforementioned steps for different network/hardware configuration setups.
In this way, the Testbed Controller is in charge of the deployment of all the software components and of carrying out the performance tests for a specific network and hardware setup; these tests are specific to the functions deployed and are user-defined. The salient feature of this controller is that it automates the deployment of all components over different network and hardware configurations in order to analyze the serverless performance of the system over different scenarios. All the code with specific instructions on how to configure the testbed, including how to deploy it over VMs or PMs, is freely available at the testbed github repository.
II-B Overlay Network
When connecting devices from different networks located behind NATs (Network Address Translation) or firewalls, it is required to either apply manual NAT configurations, firewall rules, or to use traditional privacy-oriented VPN solutions (such as OpenVPN or Wireguard). While these VPN solutions can create mesh VPN networks by tunneling all traffic, their configuration is laborious and does not scale with an increased number of connected devices. Instead, tools such as Nebula or Zerotier make use of easily scalable beaconing servers and UDP hole punching techniques to directly interconnect devices over the network, avoiding manual firewall configurations and creating, in this way, mesh overlay networks. These tools are not privacy-oriented, so not all the traffic generated by a host is tunneled, but only additional network interfaces are created to communicate with other nodes on the same overlay network. In our implementation we choose Nebula, the only free and open source tool suitable for the task in the edge context.
II-C Container Orchestrator
Container orchestrators are responsible for integrating, scaling, and managing containers, while at the same time providing various functions, such as security, networking, service discovery, and monitoring. From all available options today, Kubernetes is the most widely adopted in large production environments. It has the advantage of not being constrained to one specific container runtime, but open to Docker, containerd, CRI-O, or any following the Kubernetes Container Runtime Interface specifications. Some forks of Kubernetes have been created, such as K3s or k0s, specifically designed for constrained edge devices. While both K3s and k0s options are free and open source, we choose K3s for being the most stable version at the time of implementation.
II-D Serverless Framework
While containerization alone facilitates the packaging and deployment of applications, system administrators are still in charge of configuring the container orchestrators for scalability. The serverless model removes this need, and system administrators are not anymore required to deal with scaling issues. Cloud providers are already offering serverless services with solutions such as Amazon Lambda or Google Cloud functions which provide deployment of functions offering IDEs, SDKs, plugins, etc. Free and open source serverless platforms, such as OpenFaaS and OpenWhisk are currently under development. In our implementation, we use OpenFaaS which today provides a good maturity level and fewer hardware requirements as compared to OpenWhisk.
II-E Serverless Functions and Workflows
Serverless functions are pieces of code that once deployed are only executed when they are explicitly triggered and deallocated afterwards. Typically, these functions are single purpose, stateless and run for short periods of time. To create more complex applications, the so-called workflows are created by chaining functions. Chaining functions can be performed from the client side or from the server side. From the client side, the client concatenates the output from one function to the input of subsequent one and every function is independently triggered. This method follows the original philosophy behind serverless functions where the developer has full control of the workflows. However, from the performance perspective this method creates an overhead on the communication side which may result in higher response times. To address this, chaining can be done on the server side. This allows functions to trigger other functions, thus reducing the communication overhead, at the expense of client losing control of the workflows.
III Testbed Deployment and Configurations
III-A Testbed Deployment
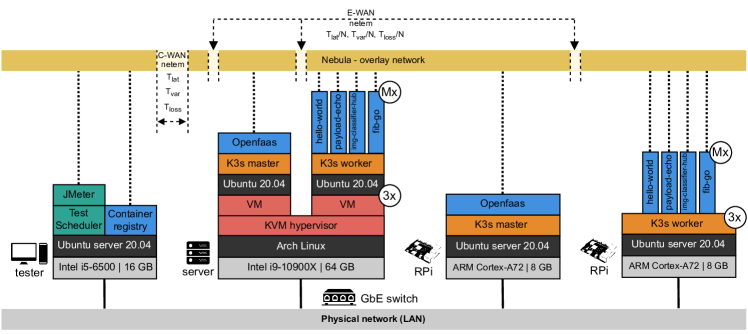
Fig. 2 shows the specific hardware configuration we use in our testbed to evaluate the performance of different combinations of VMs and PMs, as well as the software stack. More in detail, it consists of one tester machine, from where performance tests are launched, one server, where the VMs are deployed, and 4 Raspberry Pis (rp.metal), working as PMs; all connected to a GbE switch. The tester is a regular desktop computer with an Intel i5-6500 CPU and 16 GB of RAM memory running Ubuntu server 20.04. The Testbed Controller executes the serverless function tests using JMeter with cookies, and it disables keep-alive to prevent the re-use of TCP connections. Testbed Controller also considers the case where a local registry contains all the container images necessary for the deployment. The performance tests are launched to a specific cluster configuration (e.g., 2 VMs or 3 PMs). The server with an Intel i9-10900X CPU and 64 GB of RAM memory runs Arch Linux and deploys a KVM hypervisor where up to 4 VMs running Ubuntu 20.04 are allocated. Three different sizes of VMs can be configured: vm.small (1vCPU, 2GB of RAM), vm.medium (2vCPUs, 4GB of RAM) and vm.large (4vCPUs, 8GB of RAM). All VMs are clustered using K3s where, in all cases, one acts as a master and the other two as workers. On K3s master, all containers related to OpenFaaS are deployed, while the serverless functions are to be deployed only on the worker nodes. Similarly, Raspberry Pis are also clustered with the same configuration as the VMs, so one master node and up to three workers. We deploy version 4, with an ARM Cortex-A72 CPU and 8 GB of RAM running Ubuntu server 20.04.
III-B Network Configurations
All VMs and PMs are connected by an overlay network created using Nebula which creates specific virtual interfaces. On these interfaces, different WAN properties, specifically delay, variance and packet loss, are emulated by making use of the netem tool, included in the Linux Kernel. It should be noted that additional WAN network properties, such as bandwidth which we do not consider in this paper, could also be configured as long as they are supported by netem. We distinguish between centralized or distributed cluster configuration depending on how these emulated WAN values are applied. When WAN values are only added in between the tester machine and the rest of the cluster (i.e., C-WAN values, see Fig. 2), the testbed emulates a typical cloud scenario, where the cluster is centralized at a certain distance from the end-user. When WAN values are added in between the K3s nodes in the cluster (i.e., E-WAN values), the testbed emulates an edge scenario where the cluster is distributed over different locations. According to the typical network latencies reported in [13, 14], and the typical latency values measured for cloud and edge data centers [15], we can define five different network scenarios to emulate: local (loc), cloud (cld), edge worst case (ewst), edge typical case (etyp) and edge optimal case (eopt). In the local scenario (loc), no delay values are added to the overlay network at all, so this case is used as reference point. The cloud scenario (cld) adds C-WAN values (see Fig. 2) which correspond to the latency values that follow a normal distribution with a mean value of , variance and packet loss of . For the three edge cases (ewst, etyp and eopt) E-WAN values are used and defined as , and , respectively. Specifically, in the edge worst case (ewst) , so that the end-to-end delay values applied from the tester to any node are equivalent to the cloud case. The edge typical case (etyp) is configured to perform with more typical latency values, i.e., . The optimal edge case (eopt) is the best case scenario which, by considering real world measured values [15], would be equivalent to latencies below 10 ms, i.e., .
III-C Performance Tests and Serverless Functions
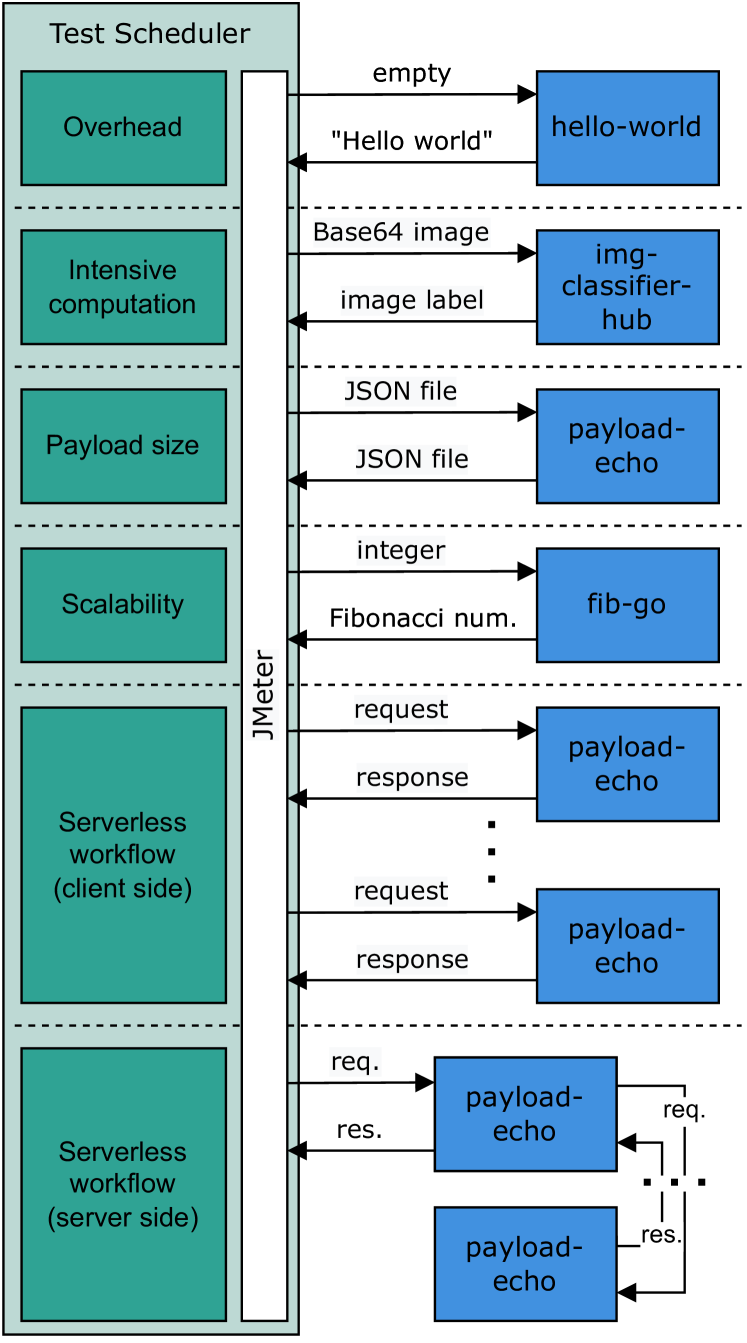
Once the testbed is deployed, including hardware and network configurations, the Test Scheduler launches different tests using JMeter (see Fig. 3) with four serverless functions: hello-world, img-classifier-hub, payload-echo and fib-go. In the first test, which we call Overhead, we trigger hello-world function to evaluate the impact on the response time caused by the testbed infrastructure itself. In this function, single thread test performs a certain number of requests with empty payload to the hello-world function. In the second test, called Intensive computation, we use img-classifier-hub, where a single thread performs a certain number of requests sending an encoded Base64 image as payload to the function. This function then decodes and classifies the image, making use of the pre-trained Inception v3 model, a convolutional neural network, and returns the corresponding label for the image. For testing purposes, the image we send is always the same one in order to avoid different decoding times. In the third test called Payload size, we measure the impact of the payload size on the response times when triggering serverless functions. To that end, we use payload-echo function which returns the exact same JSON file received with no further processing. In the fourth test, called Scalability, we use fib-go function, which calculates the Fibonacci number accordingly and returns the value, so the higher the integer value sent, the longer the processing time. In the last two tests, Serverless workflow, we again use payload-echo function, but this time to analyze function chaining. This test considers two operation modes, one for chaining functions on the client side and one for chaining on the server side. For chaining on the client side, JMeter triggers certain number of payload-echo functions sequentially and the elapsed time here considers the total time from when the first function is triggered until the response of the last function is received. For chaining on the server side, the process of triggering functions is nested on the server side, so functions themselves trigger other functions of the same type. The elapsed time here considers the response time of only the initially triggered function from JMeter side, since this one finishes after all functions have finished.
| loc | cld | ewst | etyp | eopt | ||
| overhead | rpi.metal | 14.0 - 3.0 | 40.0 - 6.0 | 40.0 - 4.0 | 31.0 - 3.0 | 24.0 - 3.0 |
| vm.large | 9.0 - 2.0 | 35.0 - 4.0 | 36.0 - 3.0 | 27.0 - 2.0 | 20.0 - 2.0 | |
| intensive | rpi.metal | 659.0 - 57.0 | 920.0 - 100.0 | 705.0 - 31.0 | 686.0 - 29.0 | 671.0 - 23.0 |
| vm.small | 181.0 - 9.0 | 429.0 - 80.0 | 241.0 - 15.0 | 214.0 - 12.0 | 196.0 - 8.0 | |
| vm.medium | 189.0 - 20.0 | 436.5 - 81.0 | 241.0 - 29.0 | 220.0 - 23.0 | 202.0 - 21.0 | |
| vm.large | 176.0 - 12.0 | 423.0 - 79.0 | 232.0 - 23.0 | 211.0 - 19.0 | 195.5 - 14.0 | |
| payload 1KB | rpi.metal | 18.0 - 2.0 | 44.0 - 5.0 | 44.0 - 3.0 | 35.0 - 3.0 | 28.0 - 2.0 |
| vm.large | 11.0 - 2.0 | 37.0 - 5.0 | 38.0 - 3.0 | 29.0 - 2.0 | 22.0 - 1.0 | |
| payload 10KB | rpi.metal | 26.0 - 3.0 | 62.0 - 5.0 | 64.0 - 4.0 | 50.0 - 3.0 | 39.0 - 3.0 |
| vm.large | 13.0 - 1.0 | 55.0 - 5.0 | 56.0 - 3.0 | 41.0 - 2.0 | 29.0 - 2.0 | |
| payload 100KB | rpi.metal | 74.0 - 7.0 | 359.0 - 82.0 | 208.0 - 15.0 | 153.0 - 18.0 | 112.0 - 11.0 |
| vm.large | 26.0 - 4.0 | 321.0 - 73.0 | 181.5 - 15.0 | 121.0 - 11.0 | 76.0 - 13.0 | |
| payload 1000KB | rpi.metal | 529.0 - 81.0 | 2084.0 - 503.0 | 796.0 - 122.0 | 677.0 - 96.0 | 612.0 - 79.0 |
| vm.large | 118.0 - 23.0 | 1904.0 - 462.0 | 592.0 - 86.0 | 429.0 - 53.0 | 291.0 - 31.0 |
IV Measurements
In this section, we show the measurements and the results obtained for each benchmarking test and for each pair of cluster configurations and network scenarios. To reduce bias due to the dynamic state of the allocated resources managed by the operating system, the results shown consider 10 repetitions for each test/hardware setup.
We use the previously defined tests, i.e., overhead, intensive computations, payload size, scalability and serverless workflows. Each test uses one or more threads, where each thread performs a certain number of HTTP requests to serverless functions specifically implemented for this purpose. Due to nature of the tests defined, the HTTP requests are performed at constant rate so that the performance of the system and the effect of the network can be better determined. It should be noted, however, that JMeter also allows for other distributions to be used by modifying accordingly the JMeter test plan files. All serverless functions have been implemented using the production-ready guidelines from OpenFaas and are publicly available on Github and Docker Hub222F. Carpio, “fcarp10/openfaas-functions,” GitHub, 2022. [Online]. Available: https://github.com/fcarp10/openfaas-functions.
IV-A Overhead
This measurement evaluates the impact on the response time caused by the testbed infrastructure itself, i.e., the performance offset. This test is used as a reference point to be able to compare the results of other tests. This single thread test performs 100 requests at 5 req/s to the hello-world function. Since this test does not require much processing, the hardware configurations considered only compare rp.metalwith vm.large, which both allocate the same amount of RAM. In this case, the cluster is configured with one master and one worker node. Table. I shows the median and IQR values of the response times in milliseconds of the overhead test. Starting with the local case (loc), we see how the RPs perform around 5 ms slower than the VMs. When comparing cld cases, we can see the results are shifted by around 25 ms with respect to the local cases, but with a higher variance as expected due to the emulated WAN values. When comparing the edge cases, we can see how ewst performs similar to cld, which is as expected since the emulated end-to-end WAN values are equivalent in both cases. We can also verify how etyp and eopt cases have lower response times as expected, but in all cases, VMs perform slightly faster than RPs.
IV-B Intensive computations
A single thread test performs 100 requests at 0.5 req/s at constant rate sending an encoded Base64 image as payload to the img-classifier-hub function. Since this test requires intensive processing, we analyze here RPs and all three VM sizes. At the same time, the cluster is only created with one master and one worker, since this function does not perform concurrent requests. Table I shows the obtained results for RPs and all three VM sizes. We can see how the performance of RPs is considerably worse than of any VM size, even though RPs have as much RAM as the large VMs. This shows the CPU limitations of RPs when requiring more intensive computing tasks. When comparing different network configurations, we can see how cld case performs considerably worse than any of the edge cases. This can be explained by the fact that sending a large payload, in this case the image to classify, over link with a higher latency directly interferes with TCP performance. This is not the case in the edge context where even with the comparable end-to-end latency, the master node is closer to the tester machine. Comparing the results with respect to the VM sizes shows a slightly improved response time with the increasing VM size, but the improvement is negligible.
IV-C Payload size
This test runs 100 requests at 0.2 req/s where each request sends a JSON file as payload to the payload-echo function. We consider different sizes (1, 10, 100 and 1000 KB of payload) for the JSON files. This test does not require much processing, so only RPs are compared to VM large, using in both cases one master and one worker. Table I shows the results obtained. When sending 1 KB, both RP and VM perform quite similar, with the VM being slightly faster overall. When comparing cloud and edge cases, we can see how the results are equivalent to the overhead test, albeit with slightly slower response times due to the higher payload size. With 10KB, the difference between each case becomes more evident with higher latencies overall. Moving to 100 KB case, we see how cld case here, performs worse than any of the edge cases, specially when using RPs. This behavior is even more obvious with 1000 KB of payload, even when using the large VM. As in the previous test, while both cld and ewst cases have the same emulated WAN values, the cloud performance is penalized by the higher latency to the master node, which directly interferes with TCP performance.
IV-D Scalability
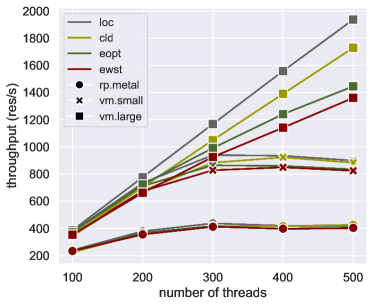
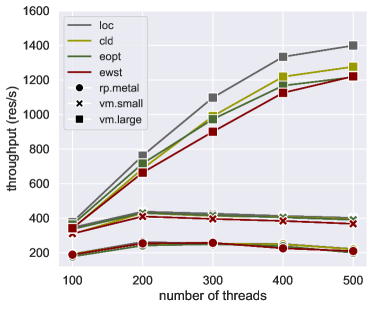
We evaluate scalability by opening multiple threads where each thread performs 1 request every 250 ms. In every request, an integer is specified to the fib-go function. The number of threads span from 100 to 500, meaning the system receives between 400 and 2000 req/s. The duration of the test is set to 5 minutes. Since this test is designed to stress the system, the cluster is set up with one master and three workers, using different VMs sizes and RPs. We show results comparing when (i) all threads are requesting for the Fibonacci number 1, so no extra processing required in the function, to (ii) when the requested Fibonacci number is 30, so that a larger processing load is required.
Fig. 4a shows the throughput for different number of threads comparing when asking for the Fibonacci number 1. Here, we can see already how RPs perform worse than any VM size with the performance peak at 300 threads delivering around 400 successful responses per second. Also, the vm.small achieves the maximum performance at 300 threads with around 900 responses per second. The performance of vm.large is not limited in this case by the number of threads, but increases linearly. There are also no larger differences in performance between loc and cld cases, specially when the system delivers maximum throughput. We also notice here that there are no major differences between ewst and eopt cases, but in both cases the throughput is much lower compared to the cld case. This shows how the cloud case performs much better overall than any edge case, achieving up to 1750 res/s in the best case scenario as compared to around 1400 res/s in the edge case. This is likely because of the intra-communication in the cluster that does not experience performance penalties as large as in the edge. When increasing the Fibonacci number to 30, see Fig. 4b, the overall throughput decreases, as expected. Here, we can better observe the impact of the network specially for vm.large where loc case performs much better than cld , but not much difference when compared to eopt and ewst since the processing time is the limiting factor.
IV-E Serverless Workflow
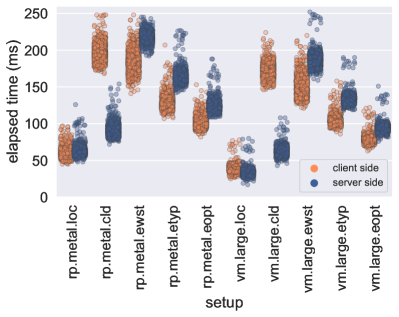
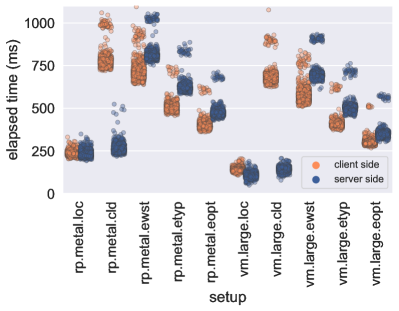
We now provide results when chaining serverless functions using the payload-echo function. The serverless workflow test performs 100 iterations at 10 req/s, considering one master and 3 worker nodes configured with either rp.metal or vm.large. Fig. 5a shows the strip plots of response time when chaining the payload-echo function 5 times from the client and the server sides, respectively. Here, we see how cld case is clearly affected when chaining on the client side compared to the server side. This is expected, due to the emulated WAN values which are only present in between the tester and the cluster, in cld case, making the chaining on the server side more advantageous. This is not the case, however, with any of the edge cases since emulated WAN values are equally applied to all nodes, so chaining on the server side actually increases the response time, since functions may trigger other functions that are deployed on different nodes, so the intra-latencies are penalizing the performance. The results are also coherent when increasing the number of functions to 20, see Fig. 5b, where all response times increase by around a factor 4, as expected. An important aspect to notice here is that while the performance of VMs is slightly better than RPs, the difference is not as remarkable, since there are no CPU intensive tasks involved in this test.
IV-F Discussion and Remarks
When comparing the performance of RPs vs VMs, we can see how RPs are as capable as VMs in tasks that do not require compute intensive tasks, but there is a clear limitation on the maximum throughput that can be achieved when scaling functions. The size of VMs also affects scaling, where the number of allocated resources limits the throughput of the system. On the one side, considering that serverless systems are, in general, not intended to be used with functions that require long computation times, in most of the cases we can say that RPs are appropriate. On the other side, since scalability is the key feature in serverless systems where a high number of concurrent requests is expected, the system needs to be properly dimensioned. With proper dimensioning of the system, RPs can be as performant as VMs in most of the use cases that the serverless paradigm is targeting.
Regarding the impact of network, we find that having a distributed cluster is, at first, suboptimal due to the intra-communication caused by the cluster nodes. In some cases, however, this effect is negligible compared to the benefits of having shorter distances between nodes. This is obvious when the function requires transferring large amounts of data, in which case the edge network system outperforms the cloud. However, considering that serverless functions are not intended for usage with large payloads, this advantage can be questioned, and it will depend on application design. The effect of the network is also irrelevant when the processing time is too high due to either limited resources or lack of proper scalability. We observed that distributed computing in the network is not always a better choice; instead, a proper, even a joint design of system and application maybe needed.
The main value of this testbed for users is in its reproducibility of the infrastructure and the results obtained, since it does not rely on either third party cloud services, the state of the real-world network or the Internet bandwidth. In addition, it is easy to automatically deploy, since new performance tests can be added in form of JMeter files together with new functions; once implemented, the rest of the system does not need to be reconfigured. At the same time, the testbed has its limitations. For instance, the impact of the programming language chosen for the functions is unknown, which maybe an important factor. We also have not tested the impact of bandwidth when analyzing the performance on serverless functions, which might be another important factor specially when sending higher payload sizes. Also, we did not optimize scalability, which means that we chose the threshold values for scaling functions based on experiments that provide the best results. This implies that the results in absolute values may actually get better by better adjusting the scaling parameters.
V Conclusions
This paper aimed at contributing to community-driven experimental studies in edge computer network systems, and shared lessons learnt in engineering a free and open source edge computing network testbed to benchmark serverless functions. The measurements indicated that edge computing network systems are valid candidates for serverless functions. Future work includes adding further performance tests to cover a broader range of serverless function scenarios as well as on working on optimizing the scaling mechanisms.
Acknowledgments
The authors acknowledge the financial support by the Federal Ministry of Education and Research of Germany in the program of ”Souverän. Digital. Vernetzt.” Joint project 6G-RIC, project ID: 16KISK031. This project has also received funding from the European Union’s Horizon 2020 research and innovation programme under grant agreement No 952644.
References
- [1] P. Castro, V. Ishakian, V. Muthusamy, and A. Slominski, “The rise of serverless computing,” Communications of the ACM, vol. 62, no. 12, pp. 44–54, 2019.
- [2] H. Martins, F. Araujo, and P. R. da Cunha, “Benchmarking serverless computing platforms,” Journal of Grid Computing, vol. 18, no. 4, pp. 691–709, 2020.
- [3] R. Morabito, “Virtualization on internet of things edge devices with container technologies: A performance evaluation,” IEEE Access, vol. 5, pp. 8835–8850, 2017.
- [4] A. Palade, A. Kazmi, and S. Clarke, “An Evaluation of Open Source Serverless Computing Frameworks Support at the Edge,” 2019 IEEE World Congress on Services (SERVICES), vol. 2642-939X, pp. 206–211, 2019.
- [5] A. Aske and X. Zhao, “Supporting multi-provider serverless computing on the edge,” in Proceedings of the 47th International Conference on Parallel Processing Companion, ser. ICPP ’18. New York, NY, USA: Association for Computing Machinery, 2018.
- [6] X. Wang, Y. Han, V. C. Leung, D. Niyato, X. Yan, and X. Chen, “Convergence of Edge Computing and Deep Learning: A Comprehensive Survey,” IEEE Communications Surveys and Tutorials, vol. 22, no. 2, pp. 869–904, 2020.
- [7] M. Caprolu, R. Di Pietro, F. Lombardi, and S. Raponi, “Edge Computing Perspectives: Architectures, Technologies, and Open Security Issues,” 2019 IEEE International Conference on Edge Computing (EDGE), pp. 116–123, 2019.
- [8] R. Morabito, V. Cozzolino, A. Y. Ding, N. Beijar, and J. Ott, “Consolidate IoT Edge Computing with Lightweight Virtualization,” IEEE Network, vol. 32, no. 1, pp. 102–111, 2018.
- [9] A. Das, S. Patterson, and M. Wittie, “EdgeBench: Benchmarking Edge Computing Platforms,” in 2018 IEEE/ACM International Conference on Utility and Cloud Computing Companion (UCC Companion). IEEE, dec 2018, pp. 175–180.
- [10] I. Baldini, P. Cheng, S. J. Fink, N. Mitchell, V. Muthusamy, R. Rabbah, P. Suter, and O. Tardieu, “The serverless trilemma: Function composition for serverless computing,” in Proceedings of the 2017 ACM SIGPLAN International Symposium on New Ideas, New Paradigms, and Reflections on Programming and Software, ser. Onward! 2017. New York, NY, USA: Association for Computing Machinery, 2017, pp. 89–103.
- [11] J. Li, S. Kulkarni, K. Ramakrishnan, and D. Li, “Analyzing open-source serverless platforms: Characteristics and performance,” 05 2021.
- [12] F. Carpio, M. Michalke, and A. Jukan, “Engineering and experimentally benchmarking a serverless edge computing system,” in 2021 IEEE Global Communications Conference (GLOBECOM), 2021, pp. 1–6.
- [13] F. C. C. (FCC), “Measuring broadband america tenth measuring broadband america fixed broadband report a report on consumer fixed broadband performance in the united states federal communications commission office of engineering and technology,” 01 2021. [Online]. Available: https://data.fcc.gov/download/measuring-broadband-america/2020/2020-Fixed-Measuring-Broadband-America-Report.pdf
- [14] O. Signal, “The state of mobile network experience. benchmarking mobile on the eve of the 5g revolution,” 2019. [Online]. Available: https://www.opensignal.com/sites/opensignal-com/files/data/reports/global/data-2019-05/the_state_of_mobile_experience_may_2019_0.pdf
- [15] B. Charyyev, E. Arslan, and M. H. Gunes, “Latency comparison of cloud datacenters and edge servers,” in GLOBECOM 2020 - 2020 IEEE Global Communications Conference, 2020, pp. 1–6.