Critical magnetic fluctuations in the layered ruthenates Ca2RuO4 and Ca3Ru2O7
Abstract
Materials realizing the XY model in two dimensions (2D) are sparse. Here we use neutron triple-axis spectroscopy to investigate the critical static and dynamical magnetic fluctuations in the square-lattice antiferromagnets Ca2RuO4 and Ca3Ru2O7. We probe the temperature-dependence of the antiferromagnetic (AFM) Bragg-intensity, the -width, the amplitude, and the energy-width of the magnetic diffuse scattering in vicinity to the Néel temperature to determine the critical behavior of the magnetic order parameter , correlation length , susceptibility , and the characteristic energy with the corresponding critical exponents , , , and , respectively. We find that the critical behaviors of the single-layer compound Ca2RuO4 follow universal scaling laws that are compatible with predictions of the 2D-XY model. The bilayer compound Ca3Ru2O7 is only partly consistent with the 2D-XY theory and best described by the three-dimensional Ising (3D-I) model, which is likely a consequence of the intra-bilayer exchange interactions in combination with an orthorhombic single-ion anisotropy. Hence, our results suggest that layered ruthenates are promising solid-state platforms for research on the 2D-XY model and the effects of 3D interactions and additional spin-space anisotropies on the magnetic fluctuations.
I Introduction
Critical fluctuations of the order parameter emerge in proximity to the transition temperature of second-order phase transitions. These fluctuations are characterized by a correlation length and a response time , which diverge at [1, 2, 3, 4]. In the critical regime close to , fundamental physical properties of a material, such as the magnetic susceptibility and the heat capacity, adopt critical behavior and can be described by power-laws , with critical exponents and [4, 5, 2, 3, 6]. Furthermore, the scaling behaviors in the spatial and time domains are related via [3], with the critical exponents of the inverse correlation length and of the characteristic energy . A hallmark of the corresponding scaling theory is the concept of universality [7, 8, 4], which stipulates that (for systems with short-range interactions) the critical exponents are independent of microscopic details, and depend exclusively on the dimensionality of space and the dimensionality of the order parameter. In magnetic systems, the scaling behavior of magnetic critical fluctuations thus encodes the spatial dimensionality of the system and possible magnetic anisotropies [4]. Along these lines, in particular the 2D-XY model has attracted significant attention, since it was employed as the model system for the unconventional vortex-unbinding transition proposed by Berezinskii, Kosterlitz, and Thouless (BKT) [9, 10, 11]. The fingerprints of BKT-transitions were observed in superfluid 4He films [12, 13] and proximity-coupled Josephson junction arrays [14, 15]. Yet, solid-state materials that realize the 2D-XY model are sparse [16, 17, 18, 19, 20].
A key experimental technique for the investigation of critical magnetic scattering is neutron triple-axis spectroscopy (TAS), which exploits the proportionality between the magnetic neutron scattering cross section and the dynamic scattering function , containing and [21, 22, 23]. More specifically, can be derived from TAS energy scans of the critical magnetic scattering, while corresponds to the energy-integrated -width in momentum space. Along these lines, pioneering studies investigated the critical magnetic fluctuations in classical magnetic systems, such as the 3D ferromagnet (FM) EuO [24, 25, 26] and the 3D antiferromagnet (AFM) RbMnF3 [27, 28]. Furthermore, TAS studies were carried out on systems with quasi-2D magnetic correlations, including the isotropic square-lattice AFMs Rb2MnF4 [29], Sr2CuO2Cl2, and Sr2Cu3O4Cl2 [30], as well as the AFM parent compounds of the cuprate superconductors [31], which exhibit 2D Heisenberg (2D-H) scaling properties above their Néel temperatures. More recently, critical magnetic fluctuations were investigated in 5-electron transition metal oxides (TMOs) using X-ray scattering. In single-layer Sr2IrO4, which exhibits a Mott-insulating AFM ground state with a effective total angular momentum due to strong spin-orbit coupling (SOC) [32, 33], 2D-H scaling with a small easy-plane anisotropy was reported [34, 35]. On the other hand, in bilayer Sr3Ir2O7 the scaling behavior close to the transition is consistent with the 3D Ising (3D-I) universality class, but significant deviations were found and attributed to disorder [36].
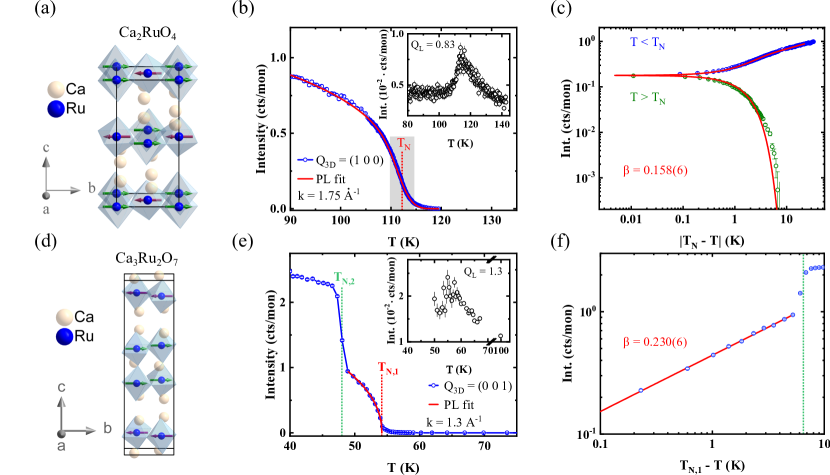
In 4-electron TMOs, such as single- and bilayer ruthenates, critical fluctuations have remained unexplored to date. Notably, ruthenates show a plethora of electronic ground states [37, 38, 39, 40, 41] such as unconventional superconductivity in Sr2RuO4 [42] and excitonic AFM order in the Mott insulator Ca2RuO4 [43, 44], arising from a delicate competition between the energy scales of SOC, crystal field splitting, Hund’s coupling, and inter-site exchange interactions. In the latter compound, spins are arranged in an AFM fashion within square-lattice RuO2 planes and stacked along the -axis in a G-type pattern [Fig. 1a] with a Néel temperature [45, 46, 47]. The excitonic character is believed to result from excitonic transitions between non-magnetic singlet (=0) and magnetic triplet states (=1) [43, 44]. The nature of the excitonic magnetism was recently corroborated by resonant inelastic x-ray scattering (RIXS) [48], Raman scattering [49], as well as inelastic neutron scattering (INS), detecting a soft amplitude mode (’Higgs-mode’) in the spin-wave spectrum [50].
The unquenched orbital angular momentum of the Ru magnetic moments in Ca2RuO4 further results in a highly unusual spectrum of transverse magnons in the AFM state [50]. The low-energy magnetic Hamiltonian derived from an analysis of this spectrum is dominated by an XY-type single-ion anisotropy, which is much larger than the nearest-neighbor exchange interaction and an Ising-type single-ion anisotropy resulting from an orthorhombic distortion of the crystal structure. At the same time, the INS experiments did not reveal any dispersion of the magnons perpendicular to the RuO2 layers, which implies that the interlayer interactions are much weaker than the interactions within the layers. The evidence for an approximate 2D-XY symmetry of the magnetic Hamiltonian derived from the analysis of the magnon dispersions has motivated the present study.
In contrast to the Mott insulator Ca2RuO4, the bilayer compound Ca3Ru2O7 is metallic in the paramagnetic state and maintains considerable electrical conductivity below the Néel temperature K [51]. The magnetic structure is A-type AFM (i. e. FM bilayers with alternating orientation along the -axis) [Fig. 1d] [51, 52]. A second magnetic transition associated with a reorientation of the spins from the - to the -axis in the RuO2 planes [53] and a greater reduction of the electrical conductivity occurs at K [51]. As the crystal structure of Ca3Ru2O7 comprises two closely spaced RuO2 layers within a unit cell [Fig. 1d], substantial interlayer interactions within a bilayer unit are expected and were indeed identified in INS studies of the magnon dispersions [54, 55]. As exchange interactions between bilayer units are weak, the dimensionality of the exchange-bond network is intermediate between 2D and 3D. The INS data also revealed an anisotropy gap, but were insufficient for a determination of the nature of the dominant anisotropy (Ising versus XY).
In this work, we use TAS to examine the critical scattering in single-layer Ca2RuO4 and bilayer Ca3Ru2O7 in vicinity and above . We extract the critical static and dynamical exponents to determine the spin dimensionalities and anisotropies, which we compare to the model Hamiltonians employed in previous INS and RIXS studies below . For Ca2RuO4, we derive the critical exponent of the order parameter from the temperature-dependence of the AFM (1 0 0) Bragg intensity. The static critical exponents and are extracted from the -width and amplitude, respectively, of the magnetic diffuse scattering around (1 0 0.83) above . We find that the temperature-dependence of the order parameter, -width, and amplitude are well-captured by a 2D-XY model, as expected based on the spin Hamiltonian extracted from the magnon dispersions [50]. The dynamic critical exponent is derived from the broadening in energy of the diffuse scattering at (1 0 0) for and is also in reasonable agreement with the 2D-XY model. For Ca3Ru2O7, we derive from the temperature-dependence of the AFM (0 0 1) Bragg intensity below , while , and are extracted from the -width, amplitude, and energy-width, respectively, of the diffuse scattering around (0 0 1) above . From a combined consideration of all extracted exponents, we conclude that the critical behavior of Ca3Ru2O7 is only partly consistent with the 2D-XY model, and is best described by the 3D-I model. We discuss these observations in the context of prior experiments on single-layer and bilayer iridates [34, 35, 36].
II Methods
High-quality single crystals of Ca2RuO4 and Ca3Ru2O7 were grown by the optical floating zone method [47], as described in Ref. [50]. Ca2RuO4 exhibits the orthorhombic space group Pbca at and the lattice parameters , , and [45]. Ca3Ru2O7 crystallizes in an orthorhombic space group Bb21m at with the lattice parameters , , and [52]. Single crystals that included orthorhombic (,)-twins were co-aligned on Si-plates with thicknesses of and arranged in Al-sample holders. In case of Ca2RuO4, approximately 100 single crystals were co-aligned, yielding a total mass of . In case of Ca3Ru2O7, approximately 30 single crystals were used with total mass of . The mosaicity of both sample arrays was 2-3 °. Due to the (,)-twinning, the scattering planes were (H 0 L)/(0 K L). All values of are given in reciprocal lattice units.
The two-axis mode experiments on Ca2RuO4 were carried out at the thermal neutron spectrometer TRISP [56, 57] at the FRM II neutron source at the Heinz Maier-Leibnitz Zentrum (MLZ), Garching. The instrument was operated with clockwise scattering sense at the monochromator and sample (, ) at . Additionally, first neutron spin-echo (NSE) measurements were conducted at with (TAS energy resolution/vanadium width meV) and the instrumental configuration , , and . The dynamic properties were measured at the cold neutron TAS FLEXX [58] at the BER II neutron source at the Helmholtz-Zentrum Berlin (HZB), Berlin. An instrumental configuration , , , open collimation, and a neutron wave vector were used. The energy resolution was . A Be-filter in addition to a velocity selector in the primary spectrometer was used to suppress higher monochromator orders. A small offset in the thermometry between TRISP and FLEXX was corrected by comparing the (1 0 0) peak intensities.
The experiments on Ca3Ru2O7 [59] were carried out at ThALES [60], which is a cold neutron TAS at the Institut Laue-Langevin (ILL), Grenoble. The instrument was operated (i) in two-axis mode with , and and (ii) in three-axis mode with , , and with double focusing monochromator and analyzer (energy resolution ). A Be-filter was used to suppress higher monochromator orders.
The cross section of magnetic neutron scattering [21, 61] is proportional to the dynamic scattering function , with and . Here, is a magnetic reciprocal lattice vector, the relative momentum transfer, and the incident and final neutron wave vectors. is related to the imaginary part of the generalized magnetic susceptibility via
| (1) |
The real and imaginary parts of the generalized susceptibility are Kramers–Kronig related. A general form of is given by , where is the real part of the static susceptibility and the spectral weight function, which is an even function of and satisfies the normalization condition . Above the ordering temperature, spin fluctuations at small are strongly damped and the spectral-weight function takes on a Lorentzian shape [21]:
| (2) |
To extract the inverse of the magnetic correlation length from -scans, we use the following Lorentzian form for the static susceptibility [4]
| (3) |
where corresponds to the staggered magnetic susceptibility. The Kramers-Kronig relation connects and via
| (4) | |||||
where was assumed [21, 61]. Hence, follows for the static case at . To determine S(), in principle, it would be required to measure the entire S(,) function and perform a numerical -integration, which can be avoided in 2D systems by using an energy integrating TAS configuration, as introduced by Birgeneau et al. [62]. In this configuration the TAS analyzer is removed (two-axis mode) and is aligned perpendicular to the 2D-layers, corresponding to the ab-plane in Ca2RuO4. The magnitude of varies with , but the relevant components of in the 2D planes are constant and independent of . In consequence, the detector signal corresponds to an energy integration with lower integration limit (energy-gain scattering) given by the thermal energy of the fluctuations, and upper limit (energy-loss scattering) given by the energy of the incident neutrons:
| (5) |
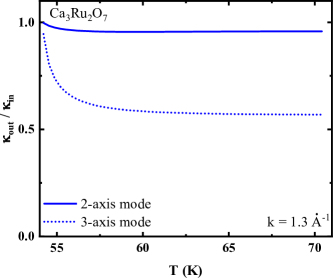
In the case of Ca2RuO4, we achieved this energy-integrating configuration with by choosing for . For Ca3Ru2O7, due to the 3D character of the AFM order [55], the ideal energy-integration configuration with can in principle not be obtained, as cannot be chosen arbitrarily. However, as discussed in App. A, the effect of this imperfect energy-integration on the measured linewidth in the two-axis configuration (without analyzer) is insignificant for our determination of the critical exponent . Thus, the two-axis data of Ca3Ru2O7 were not corrected for the integration effect.
III Results
III.1 Static critical properties of Ca2RuO4
In Ca2RuO4, the magnetic moments point along the -axis of the orthorhombic unit cell [45] [Fig. 1a] with a possible small canting in the -direction () [63]. The magnetic susceptibility in the paramagnetic state indicates quasi-2D spin fluctuations [64], which was recently also found from the magnon dispersion in the ordered phase [50], where the following parameters were derived: , for the Heisenberg and XY-type exchange couplings; and , for the single-ion terms of the tetragonal and orthorhombic symmetries, respectively. An interlayer coupling was not required to describe the magnon dispersion [50], which is in line with studies on 1% Ti-doped Ca2RuO4, where a very small meV was reported [65]. Hence, the strong tetragonal term and the small signal that Ca2RuO4 can be regarded as a quasi-2D-XY AFM.
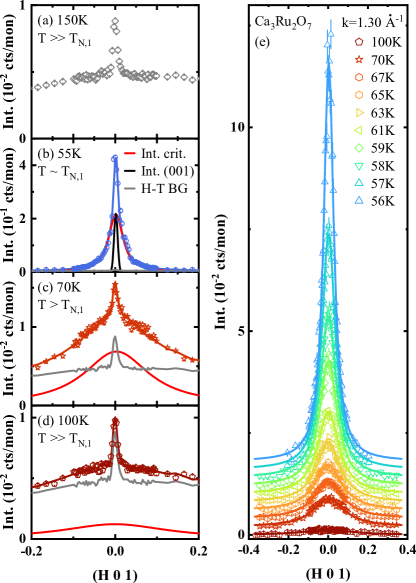
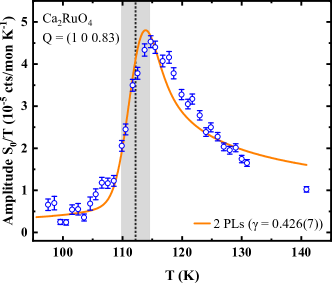
In the following TAS measurements on Ca2RuO4, we use the energy-integrating two-axis mode (see Methods and Ref. [62]), which can be applied due to the 2D-character of the magnetism, with critical fluctuations that are expected to be independent of . We perform -scans around , which lies on the rod of the 2D magnetic scattering intensity. This corresponds to an energy-integrating configuration with alignment of at for . Moreover, the advantage of a momentum that is slightly off from a magnetic Bragg peak position is that the signatures of critical scattering can be particularly pronounced [66]. Accordingly, we observe an enhancement of the scattered intensity at [inset in Fig. 1b] for temperatures in vicinity to the anticipated of approximately 110 K [64, 45]. More specifically, we observe that the critical scattering intensity peaks at a temperature slightly higher than 110 K. This behavior is likely related to the fact that of our Ca2RuO4 sample is not sharply defined, but a distribution of Néel temperatures is present [see gray shaded area in Fig. 1b], in spite of the confirmed excellent crystalline quality (see Methods and Ref. [50]). This variance of likely results from microstrains within the crystal, which emerge below the concomitant structural and metal-to-insulator transition at 360 K [46] and could be reminiscent of the (pseudo)spin-lattice coupling in Sr2IrO4 [67, 68]. In the following analysis, we take this distribution of into account, which allows us to extract the critical properties of Ca2RuO4 similarly to the case of a sharply defined .
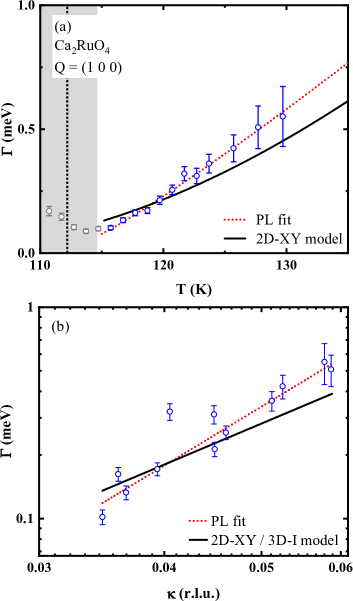
For an ideal second order phase transition, the order parameter (staggered magnetization ) is and vanishes above . Thus, the critical exponent can be determined from the measured nominal magnetic (1 0 0) peak intensity in Fig. 1b. In general, and the other critical exponents are extracted from the slopes of linear fits in double-logarithmic plots (see Ca3Ru2O7 below). However, due to the present variance of , the data in Fig. 1b cannot be described directly with the power law (PL) scaling function. Note that especially the intensity around does not show the expected sharp drop but is smeared out. This rounding of the intensity evolution cannot be attributed to critical scattering above , since the data in the inset of Fig. 1b indicate that the critical contribution is two orders of magnitude smaller. Thus, we fit the (1 0 0) data in the range 90 - 120 K () with a convolution of the above mentioned PL and a Gaussian distribution of with full width at half maximum (FWHM) [Fig. 1b]. The resulting fit parameters are , , and . The -value lies in between the limits of the 2D Ising (2D-I) ( [4]) and 2D-XY model ( [69, 70]), as suggested for a XY system with fourfold crystal field anisotropy (XY) [71]. Figure 1c shows and the fit curve on a double-logarithmic scale, illustrating that the PL fit provides an adequate description of the data below , and also for a range of temperatures above . Note that the strong deviation from a simple PL (straight line in double logarithmic plot) is due to the Gaussian distribution of .
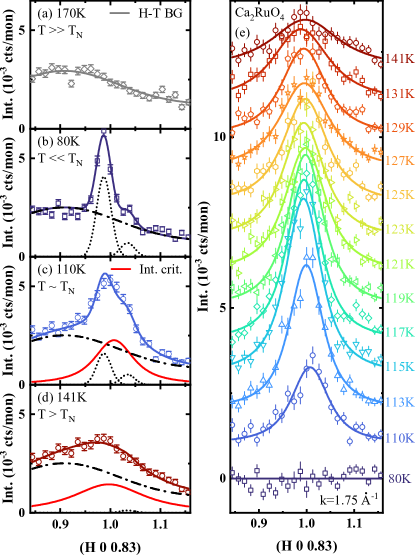
As a next step we perform -scans around (1 0 0.83) to determine the inverse correlation length [Fig. 2]. Prior to fitting of the scans with Voigt-profiles, we thoroughly determine the background (BG) contributions. Representative scans are shown in Fig. 2a-d. We identify several components of the BG: (i) A temperature-independent component, which is determined at 170 K [Fig. 2a], i.e. well above . The obtained fit (H-T BG) is employed as BG in the analysis of the data measured at all other temperatures (see dashed-dotted lines in Fig. 2a-d). (ii) The scan at the lowest measured temperature K [Fig. 2b] shows two incommensurate peaks besides the H-T BG. By comparing the temperature-dependent intensity of these resolution limited peaks with the intensities of the magnetic (1 0 0) [Fig. 1c] and (1 0 1) peaks [45], they can be assigned to the (1 0 1) peak of the main domain, and the (0 1 1) peak of the twin domain [63]. The (1 0 1) peak is likely associated with a ’B-centered’ phase with a different propagation vector and transition temperature [45]. Finally, we subtract the H-T BG and the aforementioned two peaks with proper -scaling from the -scans and obtain the corrected data shown in Fig. 2e. These data are well described by Voigt-profiles, which correspond to the convolution of the intrinsic Lorentzian with half-width-half-maximum (HWHM) [Eqn. (3)] and the Gaussian instrumental resolution. The constant width of the instrumental Gaussian (FWHM r.l.u.) was extracted from the 80 K scan in agreement with simulations carried out with the RESLIB [72] and TAKIN [73] softwares, respectively.
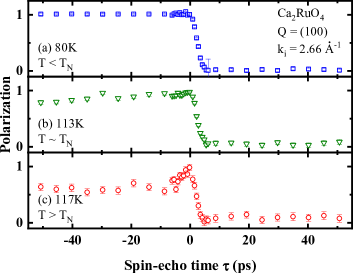
Prior to the discussion of the inverse correlation length extracted from Fig. 2e, we address the possible presence of concomitant longitudinal and transverse fluctuations. In general, critical longitudinal (parallel to the static ordering vector) and non-critical transverse fluctuations are expected to be both visible and not separated for all measurement configurations used in this work. However, neutron spin-echo (NSE) spectroscopy [74, 75, 76, 77] is capable to separate the two components [78]. To this end, we carried out high-resolution NSE measurements on Ca2RuO4 at TRISP (see Methods), at with . Figure 3 shows the resulting spin-echo polarization vs. the spin-echo time for selected temperatures, with the Larmor-frequency ( kHz/Oe) corresponding to the static magnetic fields in the spin-echo arms with length . A high-temperature BG (170 K) was subtracted from the data. According to Ref. [78], possible transverse fluctuations in Ca2RuO4 (along the -axis) would lead to a polarized signal for , i. e. for parallel magnetic fields . Conversely, longitudinal fluctuations (along the -axis) lead to a polarized signal for . Figure 3 shows a significant polarization at that depolarizes as a function of and , respectively, indicative for the -dependent linewidth of the critical fluctuations. By contrast, no significant polarization at was measured. Moreover, no oscillations of the polarization at small were observed, which are a hallmark of interference effects between transverse and longitudinal fluctuations [78]. Hence, we conclude that transverse fluctuations along the -axis are negligible or absent in Ca2RuO4 and we assume in the following that the fluctuations observed in the TAS experiments are also purely longitudinal. A possible explanation for this absence is that these fluctuations are gapped and thus not excited in the -range of our study.
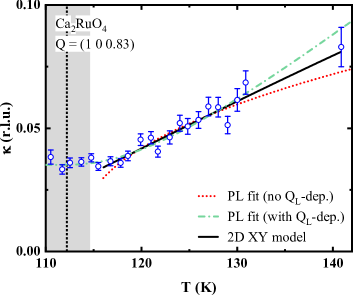
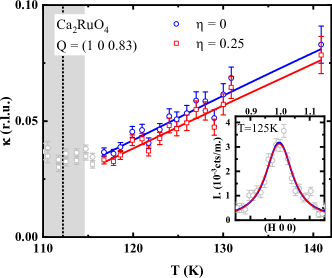
The inverse correlation length resulting from the fits in Fig. 2 is shown in Fig. 4. Notably, a -dependent broadening above () can be observed, while the -width is approximately constant for K. This is in contrast to the conventional critical scaling theory where should converge to zero at . In the following we will discuss several models to explain this saturation of at K: (i) An obvious reason for such lower bound of the linewidth are crystallographic defects [79, 80]. One possible type of defect in Ca2RuO4 can be domain walls of the structural twins, which can disrupt the long-range magnetic ordering. However, from the -width of the (1 0 0) magnetic peak (not shown here) we derive a domain size of , which is much larger than the extracted correlation length of at and . Thus we exclude domain size effects as the origin of the observed linewidth saturation. (ii) At , i.e. close to the 3D ordering, one expects a crossover of the critical fluctuations from a 2D to a 3D character with an increasing influence of the component on . This effect was described in Refs. [17, 81] and modelled by an effective with , , and . A fit of our experimental with a convolution of and the aforementioned Gaussian distribution of results in an exponent and , and describes the data over the entire measured -range (green dashed-dotted line in Fig. 4). The exponent matches the universal value of the 2D-I model ( [4]). From we obtain the ratio . This is in agreement with derived from INS on 1% Ti-doped Ca2RuO4 [65]. Assuming [50], this corresponds to an interlayer coupling .
The red dashed line in Fig. 4 shows a PL fit without a -offset at , i. e. without a dependence due to 3D correlations, convoluted with the variance of . Only the data for , i. e. beyond the saturation region, were included in the fit. The rounded shape of the red line towards results from the variance. The resulting is close to the mean-field (MF) value of , but is at odds with obtained in the previous PL fit with the offset in , although both fits give a satisfactory description of the data for . Furthermore, we note that a fit of with a 2D quantum Heisenberg model [82, 83, 84] with an anisotropy parameter accounting for 3D correlations close to [31] also gives a good agreement with the data, but we exclude this model due to the large easy-plane anisotropy in Ca2RuO4.
We now focus on the 2D-XY model, which was already suggested in the context of the magnon dispersion [50] and describes a topological phase transition accompanied by an unbinding of vortex/antivortex pairs [9, 10, 11]. The parameters of this model are the Kosterlitz-Thouless (KT) temperature , a critical exponent , and a dimensionless non-universal parameter [11, 85], which was previously determined to be approximately 1.9 [81]. The correlation length in this model is defined as [11]
| (6) |
For systems with magnetic long-range order the actual KT-transition at is usually obscured by the 3D ordering with nonzero interlayer couplings , which set in around . The relation between and is given by [69, 81]
| (7) |
Assuming , as derived from the above PL fit with dependence to capture the -offset, we obtain K, with denoting the KT temperature derived from Eqn. (7) and the KT temperature extracted from fits to in the following. As expected for a system with a KT temperature below , our data do not show any signatures of a transition around 82 K. Nonetheless, we use this model in the following to describe the scaling above , as it was demonstrated [86, 87, 88] and experimentally confirmed [17, 16, 89], that even a XY anisotropy much weaker than in the case of Ca2RuO4 can result in 2D-XY scaling. Hence, as a next step, we fit Eqn. (6) to for . Note that is much lower than the lower limit of the fitting range, i. e. a possible distribution of and KT temperatures in the sample will not affect the result of the fit significantly and is therefore not considered here. The resulting fit (solid black line in Fig. 4) with provides an excellent description of the data, and is in reasonable agreement with K from Eqn. (7). We note that a fit with as a free parameter did not converge, since it couples strongly to . Thus, was fixed to 1.9 [81]. We also note that was fixed to 0.25 [10], although can deviate from this value in specific models on critical scattering, which then would affect the line-shape of from the Lorentzian form employed in this work (see Methods). However, we find that in our case the deviation of the line-shape for is relatively subtle (see App. E) and lies below the detection threshold of the statistics of our data. Therefore, we use the simplest approach for in the present work, which is the Lorentzian-function.
In summary, the data in Fig. 4 are consistent with both, the 2D-XY (black solid line) and 2D-I (green dashed-dotted line) scaling behavior for K. Nevertheless, we rule out the latter scaling for the description of , as the critical peak amplitudes [Fig. 5] with the corresponding critical exponent (see below) are not compatible with the 2D-I model, although a crossover to 2D-I scaling close to is expected due to the orthorhombic anisotropy [50]. While this crossover from 2D-XY to 2D-I scaling presumably occurs in a -range very close to and is not resolved in our data, we attribute the observed saturation for K to a crossover to 3D coupling, which eventually drives the magnetic transition.
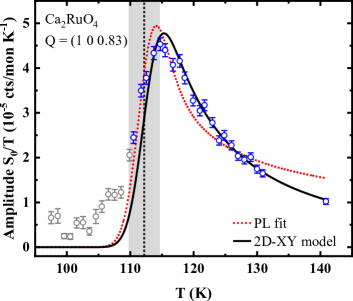
In addition to , we analyzed the staggered susceptibility , which also shows critical behavior close to . Related via the Kramers-Kronig relation, is proportional to (see Methods), i. e. the peak amplitude of the Lorentzian-profile . In the following, will be denoted as . Figure 5 shows the temperature dependence of the amplitude measured at (1 0 0.83). First, we fit a PL in the range , convoluted with the Gaussian distribution by assuming for . The agreement with the data is not convincing and the extracted critical exponent does not match universal values [4], especially not the value predicted for the 2D-I model (). Furthermore, since scaling theory predicts PL behavior for temperatures both above and below , we also carried out a fit over the entire -range (see App. B). Nevertheless, such fit yields a similar value for , corroborating that PL scaling is not suitable to capture the temperature dependence of the amplitudes. Next, we fit the range with the 2D-XY model by using the scaling relation [11]
| (8) |
with and from above. We fixed as suggested for the 2D-XY model [11]. The model gives a good description of the data with only one free parameter in the fit, that is, the proportionality constant in Eqn. (8).
III.2 Static critical properties of Ca3Ru2O7
Ca3Ru2O7 exhibits ferromagnetic (FM) bilayers [Fig. 1d], which are stacked in an AFM fashion along the -axis (A-type AFM) [51, 52]. From the magnon dispersion in the ordered phase [55, 54] the following terms of the Hamiltonian were derived: , for the nearest neighbor and intra-bilayer coupling; and , for the tetragonal and orthorhombic anisotropy, respectively. Notably, the magnon dispersion along the -direction and inter-bilayer coupling are very small or absent [55, 54]. Hence, Ca3Ru2O7 exhibits an easy-plane anisotropy and strongly coupled bilayers (large ) that can possibly act as one magnetic entity [90], suggesting that Ca3Ru2O7 could also be a candidate for quasi-2D-XY critical behavior. This calls for an investigation whether the critical behavior in the bilayer compound Ca3Ru2O7 falls either into the quasi-2D or the 3D limit, or corresponds to an intermediate case.
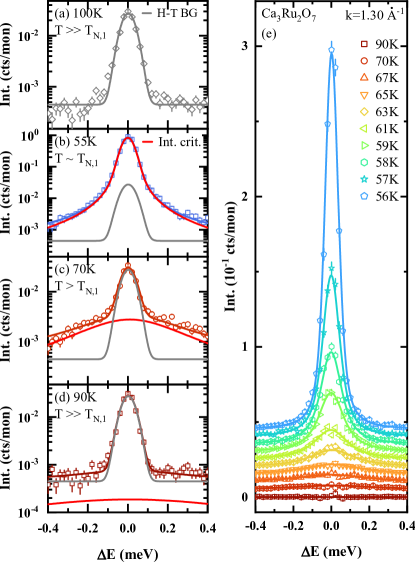
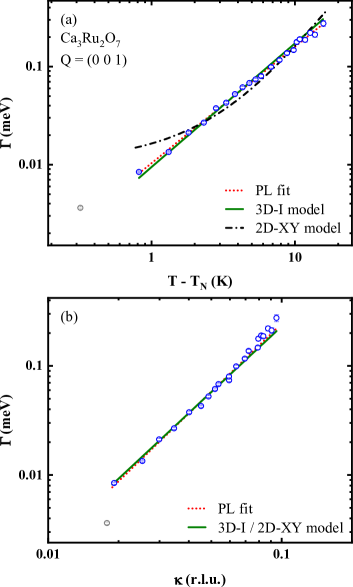
Figure 1e shows the magnetic (0 0 1) peak intensity measured upon warming, with a first-order transition at and a second-order transition at , in good agreement with Ref. [91]. In contrast to the magnetic peak of Ca2RuO4 [Fig. 1c], of Ca3Ru2O7 drops sharply towards , suggesting that possible distribution of Néel temperatures is negligible. We explain this observation with the appearance of less pronounced intrinsic crystal strains above the structural transition at . Moreover, in comparison to Ca2RuO4, the crystal-field distortions are expected to be weaker in Ca3Ru2O7 [55]. In order to establish the presence of critical scattering we measure the scattering intensity in distance to the (0 0 1) Bragg position at as a function of temperature (see inset Fig. 1e). Notably, the critical intensity in the inset in Fig. 1e peaks at and its magnitude is compatible with the remaining intensity for in Fig. 1e. A PL fit (without a distribution) in the range (), i. e. between and , yields a critical exponent and = 54.16(2) K [Fig. 1e,f]. Figure 1f shows and the PL fit on a double-logarithmic scale, suggesting a purely linear evolution of in such a plot for the measured temperatures. The obtained value of matches the universal value of the 2D-XY model ( [69, 70]), although it should be taken with caution as the point density in close vicinity of is sparse. Moreover, the intrinsic scaling behavior could be obfuscated due to a contribution in the scattering intensity from an overlap with the second transition at .
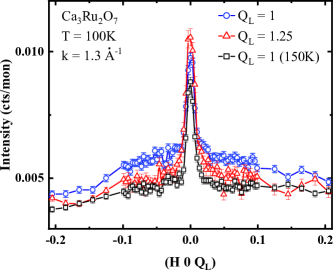
To extract and the amplitude of the critical scattering, we carried out -scans around (H 0 1) in the two-axis mode. The ideal energy-integrating configuration used for Ca2RuO4 is not applicable for 3D systems (see Methods). However, a numerical simulation confirmed that the integration according to Eqn. (5) is sufficiently satisfied for our two-axis configuration in Ca3Ru2O7 (see App. A). Furthermore, we note that for Ca3Ru2O7, spin-echo experiments to discern longitudinal and transverse fluctuations have not been carried out. Nonetheless, from the fact that in the present study both, the static and dynamical critical fluctuations in Ca3Ru2O7 are well captured by power-laws (see below), we conclude that the non-critical transverse fluctuations do not contribute significant intensity around [66]. From the -scans we subtracted two BG components: (i) A sharp peak at , which is clearly visible at high- (150 K) [Fig. 6a]. In addition, we performed a scan around (H 0 1.25) at 100 K and found that the sharp feature is independent of and (see App. C). Thus, we assign it to 2D diffuse nuclear scattering from disorder along the -axis due to e. g. stacking faults. (ii) The sharp resolution-limited (0 0 1) peak with Gaussian-width r.l.u. [Fig. 6b], which rapidly vanishes above . The (0 0 1) peak is intense at K and the extraction of critical scattering is not reliable. The BG corrected -scans can be captured by a Voigt-profile (intrinsic Lorentzian critical scattering convoluted with instrumental Gaussian-profile) [Fig. 6e]. A critical scattering intensity can be clearly observed at least up to 70 K. We note that there might be a contribution from critical fluctuations even at 100 K, but since it is very weak we do not consider this temperature in the following analysis.
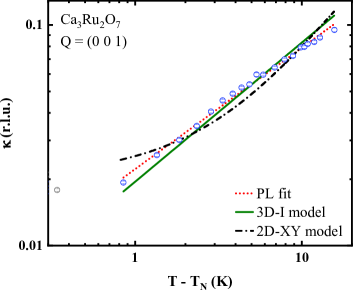
The resulting -width is plotted in Fig. 7 on double logarithmic scales. Note that in the following analysis of Ca3Ru2O7, we extract the critical exponents of the PLs from the slopes of linear fits in plots with double logarithmic scaling, whereas plots with linear scaling were employed in the above analysis of Ca2RuO4 [Fig. 4 and Fig. 5], due to the variance of in the latter material. The red dotted line is a linear fit in the range with the slope corresponding to the critical exponent in the scaling relation . The obtained lies between the values predicted for the 3D-I (, [6]) and the MF model (, [4]). The MF model, however, is at odds with the modeling of the magnon dispersion of Ca3Ru2O7 in Ref. [55], which used only nearest neighbor couplings and no long-ranged interactions in the spin Hamiltonian [4]. Thus, we assign the critical scaling of rather to the 3D-I model (green solid line in Fig. 7), which also captures the data well. In analogy to Ca2RuO4, we also fit of Ca3Ru2O7 with the 2D-XY model, using Eqn. (6), , and . The obtained KT-temperature is K, but the agreement between the fit (black dashed-dotted) and the data is unsatisfactory for most temperatures [Fig. 7]. We also test a fit with as a free parameter, since lower values of were reported in some experiments [92, 93] and derived in numerical calculations [85]. Such a fit (not shown here), with and , yields a better agreement with the data of Ca3Ru2O7. However, using the latter values of and as an input for the fit of the critical amplitudes (see below) results in a very strong deviation from the data (not shown here) and is therefore disregarded. In summary, we conclude that the 3D-I model is most appropriate to describe the critical behavior of above .
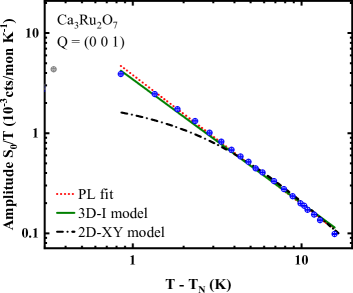
The critical exponent of the staggered susceptibility is obtained by fitting the corresponding peak amplitudes with the PL scaling in the range . From the slope of the corresponding linear fit (red dotted line) in the double-logarithmic plot [Fig. 8], we extract , which is close to the value predicted for the 3D-I model ( = 1.238, [6]), as indicated by the green solid line in Fig. 8. For the comparison with the 2D-XY model, we use Eqn. (8), with and , as well as K determined from the fit of above. In spite of a good agreement with the data at K (see black dashed-dotted line), the PL fits are more suitable to describe the scaling of the critical amplitudes closer to .
III.3 Dynamic critical properties of Ca2RuO4
Figures 9a-d display selected energy-scans at (1 0 0) measured on the cold neutron TAS FLEXX with . A -independent BG from elastic incoherent scattering recorded at 170 K was subtracted from the raw data. The BG corrected data are described by a fit with the sum of a resolution-limited Gaussian-peak (FWHM meV) and a Voigt-function capturing the critical scattering. The resolution was extracted from the width of the elastic magnetic scattering well-below . The free parameters of the fits are the amplitude of the Gaussian-peak, and the amplitude and width of the Voigt-peak. The amplitudes of the Gaussian and the Voigt match the intensities of the (1 0 0) peak [Fig. 1b] and the amplitude of the critical scattering at (1 0 0.83) [Fig. 1b, inset] (see App. D). An overview of the energy-scans and the resulting fit curves at selected temperatures is shown in Fig. 9e.

The resulting energy-width of the critical component is plotted in Fig. 10a. Above the data show a significant broadening, while below no systematic trend was observed. For these data () the intensity of the (1 0 0) peak is much stronger than the critical scattering and extraction of in the fit is not reliable. Therefore, we exclude this -range in the following scaling analysis (grey data points in Fig. 10a). To determine the dynamic critical exponent from above , in analogy to , we fit a convolution of the PL with a Gaussian distribution of (red dotted line). By assuming for , as predicted by dynamic scaling theory [3], the PL fit yields . In spite of the good agreement with the data in Fig. 10a, the error margin is relatively large and only the 3D-H model (, [3, 94]) and the 3D-I model (, [3, 6]) are reasonably close to the obtained exponent. However, 3D-scaling is not expected well above for this quasi-2D system. Furthermore, is far away from 2D-I scaling ( [95, 4]), which was discussed in the context of of Ca2RuO4 (green dashed-dotted line in Fig. 4).
Next, we examine the critical dynamics of Ca2RuO4 in terms of the 2D-XY model. For the motion of vortices a dynamic scattering function with a quadratic Lorentzian form (central peak) was derived [96, 97, 85], and also experimentally observed [98, 99, 16]. However, such a central peak is not present in our data [Fig. 9], which can be captured by a simple Lorentzian function. Thus, we use instead the dynamic scaling relation , suggested to be appropriate for relaxational dynamics in the 2D-XY model [100] to check for 2D-XY scaling above . The black solid line in Fig. 10a shows the scaling for the critical exponent , which was postulated for the 2D-XY model [100]. The agreement with the data is not as good as for the PL fit, although at high temperatures the 2D-XY scaling lies essentially within the error bars. The deviation at low temperatures could be due to the variance of or a crossover to a different scaling behavior. We note that using as a free fit parameter improves the agreement with the data, but the obtained value of (fit not shown here) is at odds with the theory for the universality class.
In addition, we determine directly from plotting vs. on double logarithmic scales [Fig. 10b]. In such a plot, the slope of a linear fit to the data corresponds to the critical exponent of the scaling relation . The resulting dynamical critical exponent (red dashed line) is not compatible with any known universal value. Note, however, that the vs. data points in Fig. 10b were obtained by interpolation, as the - and energy-scans on Ca2RuO4 were taken at different -positions and temperatures at two different instruments, which can lead to uncertainties. Specifically, the data points in Fig. 10b were generated by interpolating to the temperatures at which was measured and the same fitting range ( K) was included, where the impact on the distribution is negligible. Nevertheless, while the dynamical critical exponent of the linear fit deviates from a universal value, we find that the 2D-XY model (solid black line) with the exponent [100] captures the vs. data reasonably well [Fig. 10b].
III.4 Dynamic critical properties of Ca3Ru2O7
Figures 11a-d display selected energy-scans at the (0 0 1) peak of Ca3Ru2O7. A constant elastic incoherent high- BG is subtracted from the energy-scans, which was measured at K, where the contribution of critical scattering is negligible [Fig. 6d]. Subsequently, a single Voigt-function (Gaussian-width meV) is fitted to the scans. An overview of the energy-scans after BG subtraction with the corresponding fits is plotted in Fig. 11e for selected temperatures.
The resulting energy-width of Ca3Ru2O7 is shown in Fig. 12a on double logarithmic scales. The data are well-captured by a linear fit (red dotted line) in the range with a slope , corresponding to the critical exponent in the scaling relation . This exponent is close to the value predicted for the 3D-I model (, [3, 6]) indicated by the green solid line in Fig. 12a, which is consistent with the static critical properties. In analogy to Ca2RuO4, we also carry out a fit with the 2D-XY model, using the dynamic scaling relation with [100]. The resulting fit (black dashed-dotted line in Fig. 12a) describes the data reasonably well at high temperatures, but deviates strongly in proximity to .
Figure 12b shows a plot of vs. on double logarithmic scales, which allows us to determine directly. From the slope of a linear fit (red dotted line), we derive as the critical exponent, which is close to proposed for the 3D-I model [3, 101] and consistent with the scaling above. Notably, also corresponds to the 2D-XY model [100]. However, since the 3D-I scaling is also compatible with the temperature-dependence of the -width and critical amplitudes at of Ca3Ru2O7, we consider this model as most appropriate.
IV Discussion and conclusion
For Ca2RuO4, we revealed that the description of the static critical properties by PL scaling gave only partially satisfactory results, whereas application of the 2D-XY model provided a conclusive picture. In more detail, the obtained critical exponent is consistent with a 2D-XY model with fourfold crystal anisotropy (XYh4) [71]. The inverse correlation length , in principle, could be fitted with different PLs and the 2D-XY model. Specifically, the observed saturation of in the range between and + 4 K was captured by a PL with -dependence, likely indicating the presence of 3D fluctuations close to . Nevertheless, the employed PL fits, with and without offset, were not consistent with the 2D nature of Ca2RuO4 far above and results from fits of the amplitudes of the critical scattering. Instead, the 2D-XY model captured both, and the amplitude adequately. The resulting Kosterlitz-Thouless temperature was consistent with the ratio derived from the offset in . Our attempt to describe the amplitude of the critical scattering by PL scaling showed that the functional form does not capture the data appropriately and the extracted critical exponent is not compatible with universal values. Yet, 2D-XY scaling captured the critical amplitudes in a broad T-range around , in agreement with the Hamiltonian extracted from the magnon dispersion in the ordered phase [50]. The energy-width is best captured by a PL fit with , which is compatible with 3D AFM Heisenberg scaling (, [3, 94]). However, such a model for the dynamical critical scaling would be in stark contrast to the static critical behaviors, the magnon dispersion [50], and the quasi-2D character of Ca2RuO4. Consequently, we fitted the data with the 2D-XY model and [100], which also captures the data reasonably well.
In general, a crossover in the critical behavior from 2D-XY to Ising scaling close to can be expected in Ca2RuO4 due to the orthorhombic terms in the spin Hamiltonian [50]. The observed saturation of close to might be indicative for a dimensionality crossover to 3D scaling, whereas signatures of such a crossover were less clear in the analysis of the other critical exponents. This apparent absence can be due to the limited instrumental resolution of our TAS measurements and calls for a complementary high-resolution NSE study, focusing on the temperature range in close vicinity to . Notably, the enhanced energy resolution of NSE previously helped to resolve controversies about the scaling behavior of heavy Fermion superconductors [102] and revealed a crossover from Heisenberg to Ising scaling close to in the classical 3D AFM MnF2 due to uniaxial anisotropy [78]. Moreover, subtle signatures of additional phases, which were proposed to exist in Ca2RuO4 above the AFM order, such as orbital order [103, 104] and a Jahn-Teller driven spin-nematic phase [105], might be detectable in the critical scaling behavior measured with high-resolution NSE. Apart from that, it will be interesting to probe the existence of possible vortex/antivortex-pairs with cryogenic microscopy techniques, such as Lorentz transmission electron microscopy [106], which might be particularly pronounced in thin films of Ca2RuO4 [107].
Overall, the distribution in in our sample introduces some uncertainty in our analysis of the critical scattering in Ca2RuO4. Nonetheless, we find that our determination of the critical exponents of the -width, critical amplitudes, and energy-width is relatively insensitive to the details of the variance of . Along these lines, we performed fits (not shown here) assuming a difference of K to our above value of . The resulting values for and are closely similar to the above ones (difference smaller than the error bars). This is plausible since we fit the data only for K, where the impact of the distribution is relatively small. For the critical amplitudes, where the impact of the distribution on the critical exponent is expected to be strongest, as we fit in the range 110-140 K, we find a deviation of only four percent. Also in the case of the critical amplitudes, the change of the critical exponent is smaller than the error bars. This result suggests that even a putative uncertainty in our value of would not critically affect our determination of the critical exponents, corroborating the robustness of our analysis. A definitive determination of the critical behavior close to will require the synthesis of large, monolithic Ca2RuO4 single crystals, which appears to be out of reach of the methodologies currently at hand.
For the bilayer compound Ca3Ru2O7, which exhibits strong intra-bilayer couplings, the critical scaling was only partly compatible with the 2D-XY model. Although extracted from the temperature-dependence of the magnetic (0 0 1) peak matches the expected value for realistic 2D-XY systems [69, 70], the result should be taken with caution, due to a relatively low point density around and a possible overlap with the signal from the transition at . While the extracted is seemingly far from the corresponding value of the 3D-I model (, [6]), previous works in the context of Sr3Ir2O7 pointed out that a significant underestimation of can arise when the power law analysis is not narrowly focused around [36], which provides a possible reconciliation between our small and the proposed 3D-I scaling. The critical scaling of the -width, amplitude, and energy-width above showed deviations from the 2D-XY theory (especially at low temperatures), whereas the 3D-I model captured the data comprehensively. The Ising character of the magnetic correlations likely results from the orthorhombic anisotropy, which eventually drives the magnetic transition at . We remark, however, that in the vs. plot, 3D-I scaling and the 2D-XY model were indistinguishable, due to identical dynamical critical exponents of the universality classes ( = 2). Consequently, the 3D-I model provides the most conclusive description of the critical behaviors in Ca3Ru2O7, although a partial 2D-XY character can not be excluded. This ambiguity likely reflects the geometry of the exchange bonds in the bilayer structure of Ca3Ru2O7, which is intermediate between 2D and 3D. The theoretical description of the resulting crossover phenomena and detailed comparison with the experimental data are important challenges for future research.
In conclusion, our study of the critical magnetic correlations has confirmed Ca2RuO4 as a realization of the 2D-XY AFM on a square lattice. Along with Sr2IrO4, which hosts a nearly ideal 2D Heisenberg AFM [34, 35], this demonstration illustrates the power of 4- and 5-electron materials with strongly spin-orbit-entangled magnetic moments as a platform for fundamental research on quantum magnetism.
Acknowledgements.
Financial support by the European Research Council (Com4Com Advanced Grant No. 669550) and from the Deutsche Forschungsgemeinschaft (TRR80 Project No. 107745057) is gratefully acknowledged. Experiments were conducted at TRISP at FRM II in Garching, at FLEXX at BER II in Berlin, and at ThALES at ILL in Grenoble. We acknowledge helpful discussions with J. Bertinshaw, J. Porras, H.-A. Krug von Nidda, and P. Steffens.Appendix A Energy integration for Ca3Ru2O7
Due to the 3D character of the AFM order in Ca3Ru2O7 [55], the ideal energy-integration configuration with in general cannot be obtained, as cannot be chosen arbitrarily. To estimate the effects of inelasticity on the experimental -width we performed a numerical simulation, assuming an intrinsic and calculate , which nominally corresponds to the width in the experimental -scans. For the simulation we assume a Lorentzian with a -dependent -width , with and . Note that this choice of parameters is close to experimental values extracted from PL-fitting in the main text. Further, we assume a Lorentzian with a -dependent energy width [108, 27, 109]. Here, the -dependent energy-width is , with meV and . We then calculate the integral [Eqn. (5)] in the limits between and for each in the -scan and fit the resulting intensity with a Lorentzian with HWHM . The results of this simulation are shown in Fig. 13. Notably, for the two-axis mode, the reduction of the measured compared to the intrinsic is only of the order of a few percent. Such a change in the scaling behavior lies within our statistical error of the critical exponent . Hence, we did not correct the two-axis data of Ca3Ru2O7 for the integration effect.
For comparison, we conducted the same simulation also for the triple-axis case [Fig. 13], where we added a Gaussian-distribution with the energy-resolution ( for ) as FWHM. As expected, for the latter case the difference between and is substantially larger.
Appendix B Critical scattering amplitude of Ca2RuO4 below
Scaling theory predicts for the magnetic susceptibility PL behavior on both sides of for an ideal second-order phase transition. Specifically, for and with . The resulting critical exponent is slightly reduced compared to the exponent extracted from in the range K (), and still far from any universality class. This further supports the notion that the PL fit is not a proper choice for the description of the critical behavior in Ca2RuO4.
Appendix C Sharp background peak of Ca3Ru2O7
Figure. 15 shows that a sharp peak at is present in the scans around (H 0 ). This sharp peak is independent of and , and thus we assign it to 2D diffuse nuclear scattering from disorder along the -axis direction in Ca3Ru2O7.
Appendix D Energy-scan intensities of Ca2RuO4
Figure 16 displays the integrated intensities of the fit components deduced from the energy-scans of Ca2RuO4 at FLEXX. Upon heating, the intense sharp resolution limited peak decreases significantly while above the broad critical component is gradually taking over almost all the spectral weight besides the elastic component. For comparison we added the (1 0 0) peak intensity measured with -1 and normalized on the point of the entire integrated intensity. The scaling of the normalized (1 0 0) peak resembles that of the sharp component, and thus we assign the latter to elastic magnetic scattering from the (1 0 0) still present above due to the broad transition.

Appendix E Peak shape of -scans
As described in the Methods section, for the analysis of the -scans, we fitted the data with a Voigt-profile, i. e. a convolution of a Gaussian (instrumental resolution) and a simple Lorentzian function [Eqn. (3)]. Beyond this approximation, which is commonly used to describe critical scattering [20, 35, 36], subtle deviations from the Lorentzian form were proposed, accounting for the critical exponent [1, 4]:
| (9) |
with and predicted for 3D and 2D universality classes [4], respectively. Hence, the peak-shape of the -scans also includes information on the critical behavior of the system. For bilayer Ca3Ru2O7, the 3D character of the critical fluctuations above suggests consistent with the well-matching Voigt-fits [Fig. 6]. For single-layer Ca2RuO4, one would generally expect deviations from a simple Voigt-function due to the 2D character of the fluctuations. However, we find that in our case fits with and yield peak shapes that are essentially the same within the experimental error of our data [insets in Fig. 17]. Nevertheless, we carried out the analysis of the full set of -scans not only for (Ornstein-Zernike form, Eqn. (9)), but also for (2D-XY model, [11]). As can be seen in Fig. 17, the effect of on our -widths is small, and is negligible with respect to the corresponding scaling behavior of . Specifically, we obtain from 2D-XY fits [Eqn. (6)] on the non-Lorentzian data () for the Kosterlitz-Thouless temperature K for Ca2RuO4, which coincides within the statistical errors with the value discussed in the main text. Furthermore, we remark that in general a variety of other factors such as a non-Gaussian instrumental resolution and surface effects [110, 111] can also influence the peak-shape, which generally make the determination of challenging.
References
- Fisher and Burford [1967] M. E. Fisher and R. J. Burford, Theory of Critical-Point Scattering and Correlations. I. The Ising Model, Phys. Rev. 156, 583 (1967).
- Stanley [1971] H. E. Stanley, Introduction to phase transitions and critical phenomena, International series of monographs on physics (Oxford University Press, Oxford, 1971).
- Hohenberg and Halperin [1977] P. C. Hohenberg and B. I. Halperin, Theory of dynamic critical phenomena, Rev. Mod. Phys. 49, 435 (1977).
- Collins [1989] M. F. Collins, Magnetic critical scattering, Oxford series on neutron scattering in condensed matter (Oxford University Press, Oxford, 1989).
- Halperin and Hohenberg [1969] B. I. Halperin and P. C. Hohenberg, Scaling Laws for Dynamic Critical Phenomena, Phys. Rev. 177, 952 (1969).
- Pelissetto and Vicari [2002] A. Pelissetto and E. Vicari, Critical phenomena and renormalization-group theory, Phys. Rep. 368, 549 (2002).
- Griffiths [1970] R. B. Griffiths, Dependence of Critical Indices on a Parameter, Phys. Rev. Lett. 24, 1479 (1970).
- Kadanoff [1993] L. P. Kadanoff, Critical Behavior. Universality and Scaling, in From Order to Chaos, World Scientific Series on Nonlinear Science Series A, Vol. 1, edited by L. P. Kadanoff (World Scientific, 1993).
- Bereszinskii [1972] V. L. Bereszinskii, Destruction of Long-range Order in One-dimensional and Two-dimensional Systems Possessing a Continuous Symmetry Group. II. Quantum Systems., Sov. Phys. JETP 34, 610 (1972).
- Kosterlitz and Thouless [1973] J. M. Kosterlitz and D. J. Thouless, Ordering, metastability and phase transitions in two-dimensional systems, J. Phys. C: Solid State Phys. 6, 1181 (1973).
- Kosterlitz [1974] J. M. Kosterlitz, The critical properties of the two-dimensional xy model, J. Phys. C: Solid State Phys. 7, 1046 (1974).
- Bishop and Reppy [1978] D. J. Bishop and J. D. Reppy, Study of the Superfluid Transition in Two-Dimensional 4He Films, Phys. Rev. Lett. 40, 1727 (1978).
- Kosterlitz [2020] J. M. Kosterlitz, Superfluidity in Thin Films of 4He, J. Low Temp. Phys. 201, 541 (2020).
- Resnick et al. [1981] D. J. Resnick, J. C. Garland, J. T. Boyd, S. Shoemaker, and R. S. Newrock, Kosterlitz-Thouless Transition in Proximity-Coupled Superconducting Arrays, Phys. Rev. Lett. 47, 1542 (1981).
- Leemann et al. [1986] C. Leemann, P. Lerch, G. Racine, and P. Martinoli, Vortex dynamics and phase transitions in a two-dimensional array of Josephson junctions, Phys. Rev. Lett. 56, 1291 (1986).
- L. P. Regnault and J. Rossat-Mignod [1990] L. P. Regnault and J. Rossat-Mignod, Phase transitions in quasi two-dimensional planar magnets, in Magnetic Properties of Layered Transition Metal Compounds, Physics and Chemistry of Meterials with Low-Dimensional Structures, edited by L. J. Jongh (Springer International Publishing, Cham, 1990).
- Hirakawa et al. [1982] K. Hirakawa, H. Yoshizawa, and K. Ubukoshi, Neutron Scattering Study of the Phase Transition in Two-Dimensional Planar Ferromagnet K2CuF4, J. Phys. Soc. Jpn. 51, 2151 (1982).
- Bramwell et al. [1995] S. T. Bramwell, P. C. W. Holdsworth, and M. T. Hutchings, Static and Dynamic Magnetic Properties of Rb2CrCl4: Ideal 2D-XY Behaviour in a Layered Magnet, J. Phys. Soc. Jpn. 64, 3066 (1995).
- Rønnow et al. [2000] H. M. Rønnow, A. R. Wildes, and S. T. Bramwell, Magnetic correlations in the 2D honeycomb antiferromagnet MnPS3, Phys. B: Condens. Matter 276-278, 676 (2000).
- Klyushina et al. [2021] E. S. Klyushina, J. Reuther, L. Weber, A. T. M. N. Islam, J. S. Lord, B. Klemke, M. Månsson, S. Wessel, and B. Lake, Signatures for Berezinskii-Kosterlitz-Thouless critical behavior in the planar antiferromagnet BaNi2V2O8, Phys. Rev. B 104, 064402 (2021).
- Shirane et al. [2002] G. Shirane, J. M. Tranquada, and S. M. Shapiro, Neutron scattering with a triple-axis spectrometer: Basic techniques (Cambridge University Press, Cambridge, 2002).
- Chatterji [2006] T. Chatterji, Neutron scattering from magnetic materials, 1st ed. (Elsevier, Amsterdam, 2006).
- Squires [1996] G. L. Squires, Introduction to the theory of thermal neutron scattering, Dover books on physics (Dover, Mineola, NY, 1996).
- Als-Nielsen [1976] J. Als-Nielsen, Neutron Scattering and Spatial Correlation near the Critical Point, in Phase transitions and critical phenomena, edited by C. Domb and M. S. Green (Academic Press, London, 1976).
- Dietrich et al. [1976] O. W. Dietrich, J. Als-Nielsen, and L. Passell, Neutron scattering from the Heisenberg ferromagnets EuO and EuS. III. Spin dynamics of EuO, Phys. Rev. B 14, 4923 (1976).
- Böni and Shirane [1986] P. Böni and G. Shirane, Paramagnetic neutron scattering from the Heisenberg ferromagnet EuO, Phys. Rev. B 33, 3012 (1986).
- Tucciarone et al. [1971] A. Tucciarone, H. Y. Lau, L. M. Corliss, A. Delapalme, and J. M. Hastings, Quantitative Analysis of Inelastic Scattering in Two-Crystal and Three-Crystal Neutron Spectrometry; Critical Scattering from RbMnF3, Phys. Rev. B 4, 3206 (1971).
- Coldea et al. [1998] R. Coldea, R. A. Cowley, T. G. Perring, D. F. McMorrow, and B. Roessli, Critical behavior of the three-dimensional Heisenberg antiferromagnet RbMnF3, Phys. Rev. B 57, 5281 (1998).
- Christianson et al. [2001] R. J. Christianson, R. L. Leheny, R. J. Birgeneau, and R. W. Erwin, Critical dynamics of a spin-5/2 two-dimensional isotropic antiferromagnet, Phys. Rev. B 63, 140401(R) (2001).
- Kim et al. [2001] Y. J. Kim, R. J. Birgeneau, F. C. Chou, R. W. Erwin, and M. A. Kastner, Critical spin dynamics of the 2D quantum Heisenberg antiferromagnets Sr2CuO2Cl2 and Sr2Cu3O4Cl2, Phys. Rev. Lett. 86, 3144 (2001).
- Keimer et al. [1992] B. Keimer, N. Belk, R. J. Birgeneau, A. Cassanho, C. Y. Chen, M. Greven, M. A. Kastner, A. Aharony, Y. Endoh, W. Erwin, and G. Shirane, Magnetic excitations in pure, lightly doped, and weakly metallic La2CuO4, Phys. Rev. B 46, 14034 (1992).
- Kim et al. [2008] B. J. Kim, H. Jin, S. J. Moon, J.-Y. Kim, B.-G. Park, C. S. Leem, J. Yu, T. W. Noh, C. Kim, S.-J. Oh, J.-H. Park, V. Durairaj, G. Cao, and E. Rotenberg, Novel Jeff=1/2 Mott state induced by relativistic spin-orbit coupling in Sr2IrO4, Phys. Rev. Lett. 101, 076402 (2008).
- Kim et al. [2009] B. J. Kim, H. Ohsumi, T. Komesu, S. Sakai, T. Morita, H. Takagi, and T. Arima, Phase-sensitive observation of a spin-orbital Mott state in Sr2IrO4, Science 323, 1329 (2009).
- Fujiyama et al. [2012] S. Fujiyama, H. Ohsumi, T. Komesu, J. Matsuno, B. J. Kim, M. Takata, T. Arima, and H. Takagi, Two-dimensional Heisenberg behavior of J(eff)=1/2 isospins in the paramagnetic state of the spin-orbital Mott insulator Sr2IrO4, Phys. Rev. Lett. 108, 247212 (2012).
- Vale et al. [2015] J. G. Vale, S. Boseggia, H. C. Walker, R. Springell, Z. Feng, E. C. Hunter, R. S. Perry, D. Prabhakaran, A. T. Boothroyd, S. P. Collins, H. M. Rønnow, and D. F. McMorrow, Importance of XY anisotropy in Sr2IrO4 revealed by magnetic critical scattering experiments, Phys. Rev. B 92, 020406 (2015).
- Vale et al. [2019] J. G. Vale, S. Boseggia, H. C. Walker, R. S. Springell, E. C. Hunter, R. S. Perry, S. P. Collins, and D. F. McMorrow, Critical fluctuations in the spin-orbit Mott insulator Sr3Ir2O7, J. Phys.: Condens. Matter 31, 185803 (2019).
- Cao and de Long [2013] G. Cao and L. de Long, Frontiers of 4d- and 5d-Transition Metal Oxides (World Scientific Publishing Company, Singapore, 2013).
- Markovic et al. [2020] I. Markovic, M. D. Watson, O. J. Clark, F. Mazzola, E. Abarca Morales, C. A. Hooley, H. Rosner, C. M. Polley, T. Balasubramanian, S. Mukherjee, N. Kikugawa, D. A. Sokolov, A. P. Mackenzie, and P. D. C. King, Electronically driven spin-reorientation transition of the correlated polar metal Ca3Ru2O7, Proc. Natl. Acad. Sci. U.S.A. 117, 15524 (2020).
- Grigera et al. [2001] S. A. Grigera, R. S. Perry, A. J. Schofield, M. Chiao, S. R. Julian, G. G. Lonzarich, S. I. Ikeda, Y. Maeno, A. J. Millis, and A. P. Mackenzie, Magnetic field-tuned quantum criticality in the metallic ruthenate Sr3Ru2O7, Science 294, 329 (2001).
- Horio et al. [2021] M. Horio, Q. Wang, V. Granata, K. P. Kramer, Y. Sassa, S. Jöhr, D. Sutter, A. Bold, L. Das, Y. Xu, R. Frison, R. Fittipaldi, T. K. Kim, C. Cacho, J. E. Rault, P. Le Fèvre, F. Bertran, N. C. Plumb, M. Shi, A. Vecchione, M. H. Fischer, and J. Chang, Electronic reconstruction forming a C2-symmetric Dirac semimetal in Ca3Ru2O7, npj Quantum Mater. 6, 1 (2021).
- Sidis et al. [1999] Y. Sidis, M. Braden, P. Bourges, B. Hennion, S. Nishizaki, Y. Maeno, and Y. Mori, Evidence for Incommensurate Spin Fluctuations in Sr2RuO4, Phys. Rev. Lett. 83, 3320 (1999).
- Maeno et al. [1994] Y. Maeno, H. Hashimoto, K. Yoshida, S. Nishizaki, T. Fujita, J. G. Bednorz, and F. Lichtenberg, Superconductivity in a layered perovskite without copper, Nature 372, 532 (1994).
- Khaliullin [2013] G. Khaliullin, Excitonic magnetism in Van Vleck-type d4 Mott insulators, Phys. Rev. Lett. 111, 197201 (2013).
- Akbari and Khaliullin [2014] A. Akbari and G. Khaliullin, Magnetic excitations in a spin-orbit-coupled d4 Mott insulator on the square lattice, Phys. Rev. B 90, 035137 (2014).
- Braden et al. [1998] M. Braden, G. André, S. Nakatsuji, and Y. Maeno, Crystal and magnetic structure of Ca2RuO4: Magnetoelastic coupling and the metal-insulator transition, Phys. Rev. B 58, 847 (1998).
- Alexander et al. [1999] C. S. Alexander, G. Cao, V. Dobrosavljevic, S. McCall, J. E. Crow, E. Lochner, and R. P. Guertin, Destruction of the Mott insulating ground state of Ca2RuO4 by a structural transition, Phys. Rev. B 60, R8422 (1999).
- Nakatsuji and Maeno [2001] S. Nakatsuji and Y. Maeno, Synthesis and Single-Crystal Growth of Ca2-xSrxRuO4, J. Solid State Chem. 156, 26 (2001).
- Gretarsson et al. [2019] H. Gretarsson, H. Suzuki, H. Kim, K. Ueda, M. Krautloher, B. J. Kim, H. Yavaş, G. Khaliullin, and B. Keimer, Observation of spin-orbit excitations and Hund’s multiplets in Ca2RuO4, Phys. Rev. B 100, 045123 (2019).
- Souliou et al. [2017] S.-M. Souliou, J. Chaloupka, G. Khaliullin, G. Ryu, A. Jain, B. J. Kim, M. Le Tacon, and B. Keimer, Raman Scattering from Higgs Mode Oscillations in the Two-Dimensional Antiferromagnet Ca2RuO4, Phys. Rev. Lett. 119, 067201 (2017).
- Jain et al. [2017] A. Jain, M. Krautloher, J. Porras, G. H. Ryu, D. P. Chen, D. L. Abernathy, J. T. Park, A. Ivanov, J. Chaloupka, G. Khaliullin, B. Keimer, and B. J. Kim, Higgs mode and its decay in a two-dimensional antiferromagnet, Nat. Phys. 13, 633 (2017).
- McCall et al. [2003] S. McCall, G. Cao, and J. E. Crow, Impact of magnetic fields on anisotropy in Ca3Ru2O7, Phys. Rev. B 67, 094427 (2003).
- Yoshida et al. [2005] Y. Yoshida, S.-i. Ikeda, H. Matsuhata, N. Shirakawa, C. H. Lee, and S. Katano, Crystal and magnetic structure of Ca3Ru2O7, Phys. Rev. B 72, 054412 (2005).
- Bohnenbuck et al. [2008] B. Bohnenbuck, I. Zegkinoglou, J. Strempfer, C. Schüßler-Langeheine, C. S. Nelson, P. Leininger, H.-H. Wu, E. Schierle, J. C. Lang, G. Srajer, S. I. Ikeda, Y. Yoshida, K. Iwata, S. Katano, N. Kikugawa, and B. Keimer, Magnetic structure and orbital state of Ca3Ru2O7 investigated by resonant x-ray diffraction, Phys. Rev. B 77, 224412 (2008).
- Ke et al. [2011a] X. Ke, T. Hong, J. Peng, S. E. Nagler, G. E. Granroth, M. D. Lumsden, and Z. Q. Mao, Spin-wave excitation in the antiferromagnetic bilayer ruthenate Ca3Ru2O7, Phys. Rev. B 84, 014422 (2011a).
- Bertinshaw et al. [2021] J. Bertinshaw, M. Krautloher, H. Suzuki, H. Takahashi, A. Ivanov, H. Yavaş, B. J. Kim, H. Gretarsson, and B. Keimer, Spin and charge excitations in the correlated multiband metal Ca3Ru2O7, Phys. Rev. B 103, 085108 (2021).
- Keller et al. [2002] T. Keller, K. Habicht, H. Klann, M. Ohl, H. Schneider, and B. Keimer, The NRSE-TAS spectrometer at the FRM-2, Appl. Phys. A 74, s332 (2002).
- Keller and Keimer [2015] T. Keller and B. Keimer, TRISP: Three axes spin echo spectrometer, JLSRF 1, A37 (2015).
- Le et al. [2013] M. D. Le, D. L. Quintero-Castro, R. Toft-Petersen, F. Groitl, M. Skoulatos, K. C. Rule, and K. Habicht, Gains from the upgrade of the cold neutron triple-axis spectrometer FLEXX at the BER-II reactor, Nucl. Instrum. Methods Phys. Res. A 729, 220 (2013).
- Trepka et al. [2020] H. Trepka, M. Boehm, M. Hepting, M. J. Krautloher, and J. Porras, Complex magnetic fluctuations in Ca2RuO4 above the Néel temperature. Institut Laue-Langevin (ILL) doi:10.5291/ILL-DATA.4-03-1738 (2020).
- Boehm et al. [2007] M. Boehm, S. Roux, A. Hiess, and J. Kulda, ThALES—towards the next generation cold neutron three-axis spectrometer, J. Magn. Magn. Mater. 310, e965 (2007).
- Boothroyd [2020] A. Boothroyd, Principles of neutron scattering from condensed matter (Oxford University Press, Oxford, 2020).
- Birgeneau et al. [1971] R. J. Birgeneau, J. Skalyo, and G. Shirane, Critical Magnetic Scattering in K2NiF4, Phys. Rev. B 3, 1736 (1971).
- Porter et al. [2018] D. G. Porter, V. Granata, F. Forte, S. Di Matteo, M. Cuoco, R. Fittipaldi, A. Vecchione, and A. Bombardi, Magnetic anisotropy and orbital ordering in Ca2RuO4, Phys. Rev. B 98, 125142 (2018).
- Nakatsuji et al. [1997] S. Nakatsuji, S.-i. Ikeda, and Y. Maeno, Ca2RuO4: New Mott Insulators of Layered Ruthenate, J. Phys. Soc. Jpn. 66, 1868 (1997).
- Kunkemöller et al. [2015] S. Kunkemöller, D. Khomskii, P. Steffens, A. Piovano, A. A. Nugroho, and M. Braden, Highly Anisotropic Magnon Dispersion in Ca2RuO4: Evidence for Strong Spin Orbit Coupling, Phys. Rev. Lett. 115, 247201 (2015).
- Dietrich [1969] O. W. Dietrich, Critical magnetic fluctuations in MnF2, J. Phys. C: Solid State Phys. 2, 2022 (1969).
- Lupascu et al. [2014] A. Lupascu, J. P. Clancy, H. Gretarsson, Z. Nie, J. Nichols, J. Terzic, G. Cao, S. S. A. Seo, Z. Islam, M. H. Upton, J. Kim, D. Casa, T. Gog, A. H. Said, V. M. Katukuri, H. Stoll, L. Hozoi, J. van den Brink, and Y.-J. Kim, Tuning magnetic coupling in Sr2IrO4 thin films with epitaxial strain, Phys. Rev. Lett. 112, 147201 (2014).
- Porras et al. [2019] J. Porras, J. Bertinshaw, H. Liu, G. Khaliullin, N. H. Sung, J.-W. Kim, S. Francoual, P. Steffens, G. Deng, M. M. Sala, A. Efimenko, A. Said, D. Casa, X. Huang, T. Gog, J. Kim, B. Keimer, and B. J. Kim, Pseudospin-lattice coupling in the spin-orbit Mott insulator , Phys. Rev. B 99, 085125 (2019).
- Bramwell and Holdsworth [1993a] S. T. Bramwell and P. C. W. Holdsworth, Magnetization and universal sub-critical behaviour in two-dimensional XY magnets, J. Phys.: Condens. Matter 5, L53 (1993a).
- Bramwell and Holdsworth [1993b] S. T. Bramwell and P. C. W. Holdsworth, Universality in two–dimensional magnetic systems, J. Appl. Phys. 73, 6096 (1993b).
- Taroni et al. [2008] A. Taroni, S. T. Bramwell, and P. C. W. Holdsworth, Universal window for two-dimensional critical exponents, J. Phys.: Condens. Matter 20, 275233 (2008).
- A. Zheludev [2009] A. Zheludev, software:ResLib 3.4 (2009).
- Weber et al. [2016] T. Weber, R. Georgii, and P. Böni, Takin: An open-source software for experiment planning, visualisation, and data analysis, SoftwareX 5, 121 (2016).
- Mezei [1980] F. Mezei, Neutron Spin Echo: Proceedings of a Laue-Langevin Institut Workshop Grenoble, October 15-16, 1979, Lecture Notes in Physics, Vol. 128 (Springer, Berlin and Heidelberg, 1980).
- Keller et al. [2021] T. J. Keller, H. Trepka, K. Habicht, and B. Keimer, Neutron spin-echo instrumentation for magnetic scattering, Phys. Status Solidi B , 2100164 (2021).
- Mezei [1982] F. Mezei, Role of Spin-Nonconserving Forces in the Critical Dynamics of Fe at the Curie Point, Phys. Rev. Lett. 49, 1096 (1982).
- Mezei [1984] F. Mezei, Critical dynamics in isotropic ferromagnets, J. Magn. Magn. Mater. 45, 67 (1984).
- Tseng et al. [2016] K. F. Tseng, T. Keller, A. C. Walters, R. J. Birgeneau, and B. Keimer, Neutron spin-echo study of the critical dynamics of spin-5/2 antiferromagnets in two and three dimensions, Phys. Rev. B 94, 014424 (2016).
- Birgeneau et al. [1980] R. J. Birgeneau, R. A. Cowley, G. Shirane, J. A. Tarvin, and H. J. Guggenheim, Spin fluctuations in random magnetic-nonmagnetic two-dimensional antiferromagnets. II. Heisenberg percolation, Phys. Rev. B 21, 317 (1980).
- Cowley et al. [1980] R. A. Cowley, R. J. Birgeneau, G. Shirane, H. J. Guggenheim, and H. Ikeda, Spin fluctuations in random magnetic-nonmagnetic two-dimensional antiferromagnets. III. An Ising system, Phys. Rev. B 21, 4038 (1980).
- Als-Nielsen et al. [1993] J. Als-Nielsen, S. T. Bramwell, M. T. Hutchings, G. J. McIntyre, and D. Visser, Neutron scattering investigation of the static critical properties of Rb2CrCl4, J. Phys.: Condens. Matter 5, 7871 (1993).
- Chakravarty et al. [1988] S. Chakravarty, B. I. Halperin, and D. R. Nelson, Low-temperature behavior of two-dimensional quantum antiferromagnets, Phys. Rev. Lett. 60, 1057 (1988).
- Chakravarty et al. [1989] S. Chakravarty, B. I. Halperin, and D. R. Nelson, Two-dimensional quantum Heisenberg antiferromagnet at low temperatures, Phys. Rev. B 39, 2344 (1989).
- Hasenfratz and Niedermayer [1991] P. Hasenfratz and F. Niedermayer, The exact correlation length of the antiferromagnetic d=2+1 Heisenberg model at low temperatures, Phys. Lett. B 268, 231 (1991).
- Mertens et al. [1989] Mertens, Bishop, Wysin, and Kawabata, Dynamical correlations from mobile vortices in two-dimensional easy-plane ferromagnets, Phys. Rev. B 39, 591 (1989).
- Roscilde et al. [2003] T. Roscilde, A. Cuccoli, and P. Verrucchi, Phase transitions in anisotropic two-dimensional quantum antiferromagnets, Phys. Status Solidi B 236, 433 (2003).
- Cuccoli et al. [2003a] A. Cuccoli, T. Roscilde, R. Vaia, and P. Verrucchi, Detection of XY behavior in weakly anisotropic quantum antiferromagnets on the square lattice, Phys. Rev. Lett. 90, 167205 (2003a).
- Cuccoli et al. [2003b] A. Cuccoli, T. Roscilde, V. Tognetti, R. Vaia, and P. Verrucchi, Quantum Monte Carlo study of S=1/2 weakly anisotropic antiferromagnets on the square lattice, Phys. Rev. B 67, 104414 (2003b).
- Heinrich et al. [2003] M. Heinrich, H.-A. Krug von Nidda, A. Loidl, N. Rogado, and R. J. Cava, Potential signature of a Kosterlitz-Thouless transition in BaNi2V2O8, Phys. Rev. Lett. 91, 137601 (2003).
- Ke et al. [2011b] X. Ke, J. Peng, D. J. Singh, T. Hong, W. Tian, C. R. Dela Cruz, and Z. Q. Mao, Emergent electronic and magnetic state in Ca3Ru2O7 induced by Ti doping, Phys. Rev. B 84, 201102 (2011b).
- Cao et al. [1997] G. Cao, S. McCall, J. E. Crow, and R. P. Guertin, Observation of a Metallic Antiferromagnetic Phase and Metal to Nonmetal Transition in Ca3Ru2O7, Phys. Rev. Lett. 78, 1751 (1997).
- Gaveau et al. [1991] P. Gaveau, J. P. Boucher, L. P. Regnault, and Y. Henry, Magnetic–field dependence of the phosphorus nuclear spin–relaxation rate in the quasi–two–dimensional XY antiferromagnet BaNi2(PO4)2, J. Appl. Phys. 69, 6228 (1991).
- Hemmida et al. [2009] M. Hemmida, H.-A. Krug von Nidda, N. Büttgen, A. Loidl, L. K. Alexander, R. Nath, A. V. Mahajan, R. F. Berger, R. J. Cava, Y. Singh, and D. C. Johnston, Vortex dynamics and frustration in two-dimensional triangular chromium lattices, Phys. Rev. B 80, 054406 (2009).
- Campostrini et al. [2002] M. Campostrini, M. Hasenbusch, A. Pelissetto, P. Rossi, and E. Vicari, Critical exponents and equation of state of the three-dimensional Heisenberg universality class, Phys. Rev. B 65, 144520 (2002).
- Mazenko and Valls [1981] G. F. Mazenko and O. T. Valls, Dynamic critical exponent z in some two-dimensional models, Phys. Rev. B 24, 1419 (1981).
- Huber [1982] D. L. Huber, Dynamics of spin vortices in two-dimensional planar magnets, Phys. Rev. B 26, 3758 (1982).
- Mertens et al. [1987] Mertens, Bishop, Wysin, and Kawabata, Vortex signatures in dynamic structure factors for two-dimensional easy-plane ferromagnets, Phys. Rev. Lett. 59, 117 (1987).
- Hutchings et al. [1986] M. T. Hutchings, P. Day, E. Janke, and R. Pynn, Critical spin dynamics in Rb2CrCl4: A nearly two-dimensional easy-plane ferromagnet, J. Magn. Magn. Mater. 54-57, 673 (1986).
- Regnault et al. [1986] L. P. Regnault, J. P. Boucher, J. Rossat-Mignod, J. Bouillot, R. Pynn, J. Y. Henry, and J. P. Renard, Nonlinear excitations in ld and 2d magnetic systems, Physica B+C 136, 329 (1986).
- Jensen et al. [2000] L. M. Jensen, B. J. Kim, and P. Minnhagen, Dynamic critical exponent of two-, three-, and four-dimensional XY models with relaxational and resistively shunted junction dynamics, Phys. Rev. B 61, 15412 (2000).
- Hasenbusch [2020] M. Hasenbusch, Dynamic critical exponent z of the three-dimensional Ising universality class: Monte Carlo simulations of the improved Blume-Capel model, Phys. Rev. E 101, 022126 (2020).
- Haslbeck et al. [2019] F. Haslbeck, S. Säubert, M. Seifert, C. Franz, M. Schulz, A. Heinemann, T. Keller, P. Das, J. D. Thompson, E. D. Bauer, C. Pfleiderer, and M. Janoschek, Ultrahigh-resolution neutron spectroscopy of low-energy spin dynamics in UGe2, Phys. Rev. B 99, 014429 (2019).
- Zegkinoglou et al. [2005] I. Zegkinoglou, J. Strempfer, C. S. Nelson, J. P. Hill, J. Chakhalian, C. Bernhard, J. C. Lang, G. Srajer, H. Fukazawa, S. Nakatsuji, Y. Maeno, and B. Keimer, Orbital ordering transition in Ca2RuO4 observed with resonant X-ray diffraction, Phys. Rev. Lett. 95, 136401 (2005).
- Lotze and Daghofer [2021] J. Lotze and M. Daghofer, Suppression of effective spin-orbit coupling by thermal fluctuations in spin-orbit coupled antiferromagnets, Phys. Rev. B 104, 045125 (2021).
- Liu and Khaliullin [2019] H. Liu and G. Khaliullin, Pseudo-Jahn-Teller Effect and Magnetoelastic Coupling in Spin-Orbit Mott Insulators, Phys. Rev. Lett. 122, 057203 (2019).
- Togawa et al. [2021] Y. Togawa, T. Akashi, H. Kasai, G. W. Paterson, S. McVitie, Y. Kousaka, H. Shinada, J.-i. Kishine, and J. Akimitsu, Formations of Narrow Stripes and Vortex–Antivortex Pairs in a Quasi-Two-Dimensional Ferromagnet K2CuF4, J. Phys. Soc. Jpn. 90, 014702 (2021).
- Dietl et al. [2018] C. Dietl, S. K. Sinha, G. Christiani, Y. Khaydukov, T. Keller, D. Putzky, S. Ibrahimkutty, P. Wochner, G. Logvenov, P. A. van Aken, B. J. Kim, and B. Keimer, Tailoring the electronic properties of Ca2RuO4 via epitaxial strain, Appl. Phys. Lett. 112, 031902 (2018).
- Schulhof et al. [1970] M. P. Schulhof, P. Heller, R. Nathans, and A. Linz, Critical Magnetic Scattering in Manganese Fluoride, Phys. Rev. B 1, 2304 (1970).
- Steffens et al. [2011] P. Steffens, O. Friedt, Y. Sidis, P. Link, J. Kulda, K. Schmalzl, S. Nakatsuji, and M. Braden, Magnetic excitations in the metallic single-layer ruthenates Ca2-xSrxRuO4 studied by inelastic neutron scattering, Phys. Rev. B 83, 054429 (2011).
- Papoular et al. [1997] M. Papoular, M. D. Núñez-Regueiro, and M. Altarelli, Two-length-scale problem in critical scattering: Narrow-component line shape, Phys. Rev. B 56, 166 (1997).
- A. Cowley and M. Shapiro [2006] R. A. Cowley and S. M. Shapiro, Structural Phase Transitions, J. Phys. Soc. Jpn. 75, 111001 (2006).