Ultrafast laser pulse characterization by THG d-scan using optically enhanced graphene coatings
Abstract
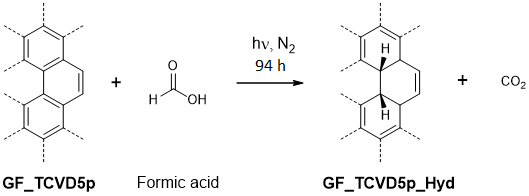
We have successfully functionalized 5 layers of TCVD-grown graphene by photoassisted transfer hydrogenation reaction with formic acid, in order to increase its nonlinear optical response and laser-induced damage resilience. Using the functionalized graphene samples, we were able to fully characterize sub-10 fs ultrashort laser pulses using THG dispersion-scan, with results that are in excellent agreement with the ones obtained with pristine graphene samples.
*Corresponding author: tsgomes@fc.up.pt
1 Introduction
Graphene consists of a single atomic layer of carbon atoms laid out in an hexagonal lattice and is a promising material for many ultrafast photonics applications [1, 2]. Its high nonlinear third-order optical susceptibility [3] allows for intense and broadband third-harmonic generation using femtosecond laser pulses at relatively low intensities, with the promising possibility of third-harmonic enhancement by using multi-layer graphene [4].
However, these low intensities are still sufficient to interact with graphene’s lattice [5], creating localized heating that leads to melting, vaporization, and/or sublimation [6]. The possibility of enhancing graphene’s nonlinear optical response, as well as its resilience to laser-induced damage, would certainly provide a solution to overcome this problem. Several techniques have already been studied in order to improve graphene’s nonlinear optical response, like embedding it on dieletric ressonant waveguide gratings [7], or using graphene metasurfaces [8].
In this Letter, we present a solution, based on photoassisted hydrogenation, to improve graphene’s laser-induced damage resilience, as well as increasing its nonlinear optical susceptibility. By measuring the third-harmonic signal as a function of the dispersion applied to the pulse, we get a d-scan trace, that allows to retrieve the spectral phase of the used ultrashort pulses via retrieval algorithms [9, 10].
2 Graphene Synthesis
Graphene was synthesized by Thermal Chemical Vapor Deposition (TCVD), according to a process based on the one previously reported by Kulyk et al. [11]. Briefly, 25 -thick copper foils (99.99%, MTI) were cut into 2x4 sheets and washed in acetone and isopropanol (15 min ultrasonication in each of the solvents). This substrate was placed inside the reactor, pre-heated to a temperature of 940 °C, and subjected to a 10 min annealing under 190 sccm of and 190 sccm of Ar, at 276 mbar. Next, the chamber was pumped down to 0.13 mbar and 200 sccm of air was introduced, for 5 min. Afterwards, the system was pumped down once again to 0.15 mbar and 50 sccm of were introduced, for 20 min. The gas was then pumped out and the chamber was brought up to atmospheric pressure using Ar. Next, the reaction chamber was pumped down to 0.3 mbar. The substrate was then subjected to a temperature ramp from to , under of and of Ar, followed by a annealing at in the same atmosphere. The pressure during these two steps was allowed to rise to and was then maintained at this value.
In the following stage, was introduced into the chamber, alongside 38 sccm of and 200 sccm of Ar. The flowrate of was set at 0.15 sccm for the first 6 min, followed by 1 min without any supply (but maintaining the same flowrates of and Ar), and finally 40 min of 0.10 sccm of . The sample was then rapidly pulled out towards the cold end of the reactor and all the gases were pumped out, followed by the pressurization of the chamber to atmospheric pressure with Ar.
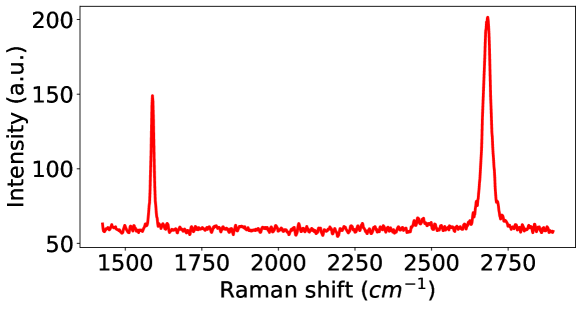
A Raman spectrum for the single-layer graphene can be seen in Figure 1. Raman spectroscopy shows the characteristic 2D and G peaks of graphene, with a large intensity ratio between them . Since the peaks are narrow and symmetrical, and the 2D peak (located at ) is more intense than the G peak (located at ), we can conclude that the grown sample is single-layer [12, 13, 14].
The as-grown single-layer graphene sheets were then successively transferred onto a fused silica substrate (1 mm-thick, University Wafer, grade JGS2), forming a stack of 5 layers of graphene. Each transfer was made by the widely used electrochemical bubbling technique, with PMMA, (average molecular weight 550 000, Alfa Aesar, 4.5 wt.% in anisole) as a supporting polymer [15].
3 Graphene Functionalization
For the functionalization process, the sample was then placed in a flat bottom flask. A 50 mL 1/1 (v/v) mixture of and was added. After degassing the solution with a stream for 15 minutes, the setup was exposed to illumination in xenon arc chamber fitted with a daylight filter during 94 hours. Afterwards, the substrate was removed from the solution and was thoroughly washed by rinsing with 100 mL ultrapure , and dried in an oven at , under vacuum.
For the functionalization characterization, X-ray photoelectron spectroscopy (XPS) was performed in a VG Scientific ESCALAB 200A spectrometer, using non-monochromatized Al radiation (1486.6 eV). To correct possible deviations caused by electric charge of the samples, the C1s band at 284.6 eV was taken as internal standard [16, 17]. The XPS spectra were deconvolved with the CasaXPS software, using non-linear least squares fitting routine after a Shirley-type background subtraction. The surface atomic percentages were calculated from the corresponding peak areas and using the sensitivity factors provided by the manufacturer.
XPS analysis was carried out to assess the type and relative amount of functional groups in the pristine and functionalized (from now on denominated hydrogenated) TCVD graphene materials. The relative amounts of the different elements were calculated from the corresponding peak areas and are shown in Fig. 3 for the pristine and hydrogenated TCVD graphene materials, respectively.
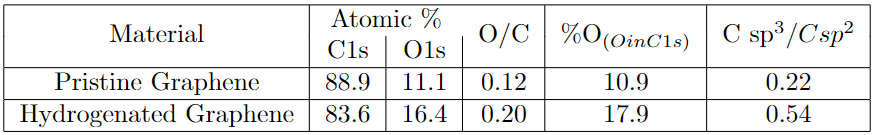
As can be seen in Fig. 3, there is an increase in the O relative atomic percentage upon funcionalization, and although it should be noted that the O1s high resolution spectra of these materials are non-reliable, due to the XPS sampling depth together with the fact that the samples are supported on fused silica substrates, the obtained O1s percentages are in agreement with the ones obtained from the C1s high resolution spectra: %O (O in C1s). These percentages, as well as the C / C ratio were obtained from the deconvolution of the C1s high resolution spectra, shown in Fig. 4.
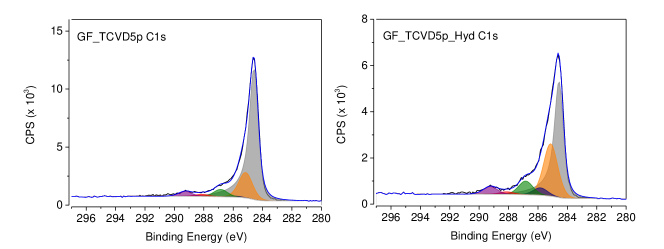
The spectra were fitted using an asymmetric line-shape for the component and a symmetric one for the other components. All groups were assigned as follows: regions (284.6 eV), and other topological defects (+0.6 eV), hydroxyl (C-OH, +1.3 eV), epoxy (C-O, +2.3 eV), carbonyl (C=O, +3.6 eV), and carboxyl (COOH, +4.7 eV) [18], and the results are presented in Fig. 5, for the pristine and hydrogenated TCVD graphene materials, respectively.
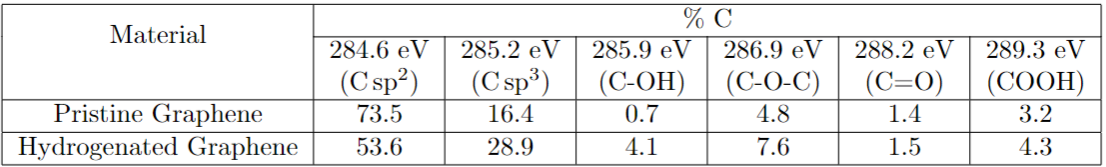
It is quite clear from Fig. 4 and 5, that there is a substancial increase in the C component in hydrogenated graphene upon the photoassisted transfer hydrogenation reaction, at the expense of C relative percentage, which indicates that the reaction was effective in transforming carbons from the basal plane of graphene into hydrogenated carbons.
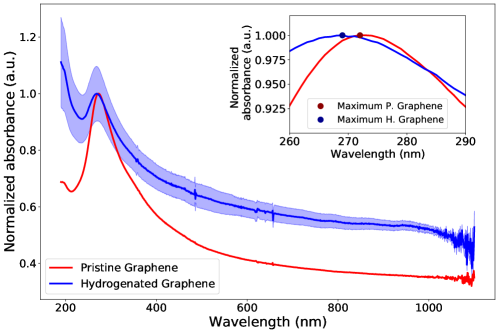
Fig. 6 depicts the normalized absorption spectra of the pristine and the hydrogenated graphene (averaged from 10 different zones). The absorption spectra were monitored in an Agilent 8453 UV-Visible spectrophotometer, in the range 190 – 1100 nm, with a 1 nm resolution. It is possible to identify the main absorption peak, , at , attributed to transitions from the aromatic rings. However, it is also possible to observe (inset) a blue shift in , from to , when going from the pristine to the hydrogenated material. This is due to the introduction of surface defects, namely the transformation of hybridized carbon into , as the degree of aromatic conjugation can be determined by the of the absorption spectra: the lower observed for the hydrogenated graphene means that more energy is needed for the electronic transition, as there are less transitions (conjugation) [19, 20]. This result corroborates the XPS observations regarding the transformation of into carbon upon the photoassisted hydrogenation.
4 Third-Harmonic Generation Dispersion-scan
To study the functionalization effect on the samples’ third-order nonlinear optical susceptibility, a THG d-scan setup was developed, which is shown in Figure 7. In our experiments, we used an ultra-broadband Ti:Sapphire laser oscillator (Femtolasers Rainbow CEP) delivering pulses with a central wavelength of , sub-10-fs duration, of energy and a repetition rate of . Like in most d-scan implementations, the setup comprises three sections: a variable compressor (usually already in place and responsible for adjusting the total dispersion applied to the laser pulse), a nonlinear signal generator (where the THG is performed) and a spectral measurement. In the variable compressor, the beam undergoes 8 bounces off ultra-broadband double-chirped mirrors (Laser Quantum Ltd) that introduce negative dispersion before crossing a pair of BK7-glass wedges for variable dispersion compensation. One of the wedges is connected to a motorized stage for scanning and fine-tuning the applied dispersion. The pulse energy is adjusted with a variable neutral-density filter prior to the nonlinear section, where the beam crosses the graphene sample and is focused back on the same sample with a concave silver-coated spherical mirror () at a incidence angle of (a smaller angle would have been preferable to minimize astigmatism, but this was the best compromise in our setup given our beam size and the useful aperture of the components). The peak intensity at the focus is of the order of . The resulting THG signal is then collimated with an aluminum-coated concave spherical mirror with the same focal length. Spherical mirrors were used instead of lenses to reduce chromatic aberration. Note that high-quality, low scatter off-axis parabolic mirrors could have been used instead. We opted for spherical mirrors at a relatively low incidence angle due to their better quality focused spot and higher focused intensity compared to standard off-axis parabolic mirrors.
The colinear fundamental and THG beams are sent through a wavelength separator composed of a pair of prisms, to spatially separate the two beams prior to the spectral measurement [21]. A double-pass scheme was used to remove spatial chirp (for clarity, only one pass is shown in Figure 7). The spectrum of the THG signal was then recorded as a function of dispersion with a fiber-coupled spectrometer (Ocean Optics HR4000) to obtain the measured THG d-scan trace. We scanned the dispersion in 150 steps over a 4-mm wedge insertion range for both samples, using an integration time of 500 ms.
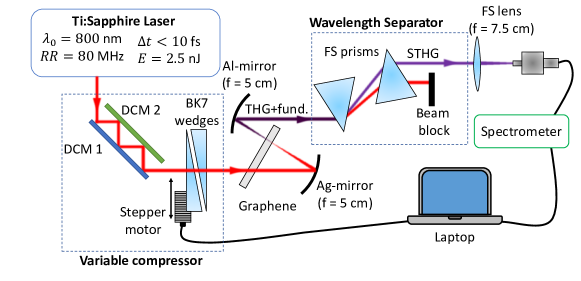
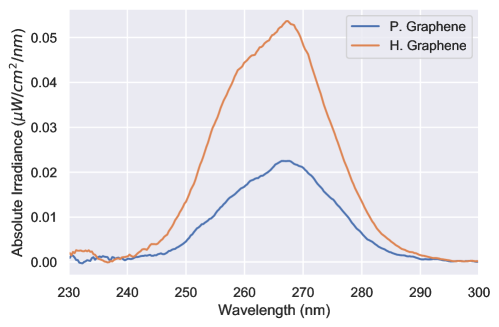
Figure 8 shows the third-harmonic signal measured for TCVD-grown 5 layers graphene, both hydrogenated and pristine. It is clear that the functionalization process led to an increase in the THG efficiency, since the THG signal suffered an increase of almost 2.5x compared to the signal obtained with the pristine graphene sample. For lower wavelengths, the THG signal seems to have increased its SNR, corresponding to an increase in the spectrum’s FWHM. However, in general terms, the structural shape of the third-harmonic signal has not changed.
By performing a d-scan measurement with both the hydrogenated and the pristine TCVD-grown 5 layers graphene sample (see Figure 9), we see that the SNR increased dramatically when generating third-harmonic with hydrogenated graphene. In both cases, a small tilt can be seen on the main trace, resulting from residual third-order dispersion.
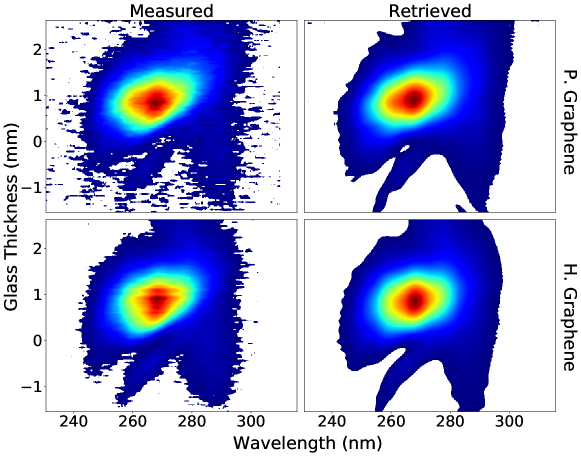
Following the d-scan measurements, an amplitude and phase retrieval was performed for both measurements. The retrieved d-scan traces shown correspond to one out of 10 retrievals, performed for different initial guesses (Gaussian spectra with random second- and third-order spectral phases). The retrieved spectral phase and intensity used to reconstruct the pulse’s temporal profile are the mean retrieved spectral phase and intensity of all retrievals.
Both retrievals show that the main features of the measured d-scan traces, namely the traces’ tilt and the small features that appear around the traces center of mass, are very well reproduced. The retrieved traces are similar to one another, showing that the functionalization process only increased the absolute THG efficiency.
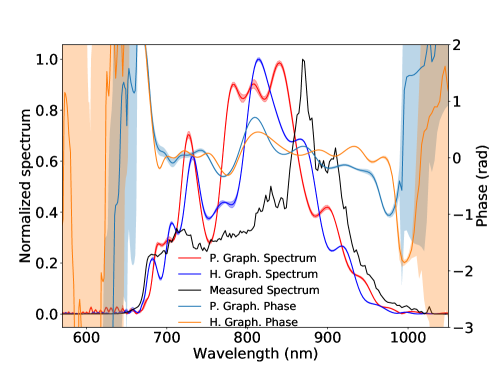
By retrieving the spectral phase and amplitude for both processes, we get the results from Figure 10. Both retrievals led to similar spectral phases, with small differences in the zones with lower spectral power. The phase uncertainty in both cases is very low on the region with high spectral power. Both spectral phases diverge rapidly for low and high wavelengths, and are relatively flat in the region, meaning that the pulses are well compressed. A small third-order spectral phase component can be seen in both retrieved phases, which is in good agreement with the traces’ small tilt.
The retrieved spectral power in both cases is similar to one another and to the measured spectrum.
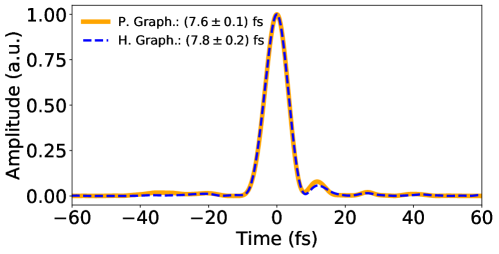
The temporal profile for both processes are shown in Figure 11. Both temporal profiles have similar behaviour: a main pulse followed by a weaker post-pulse, resulting once again from residual third-order dispersion. The retrieved temporal profiles are in good agreement with each other and with previous measurements obtained with the same laser source [10].
To study the effect of the functionalization process on the graphene’s damage threshold, measurements of the graphene’s integrated third-harmonic signal over time were performed. The results for both the hydrogenated and pristine graphene samples are shown in Figure 12.
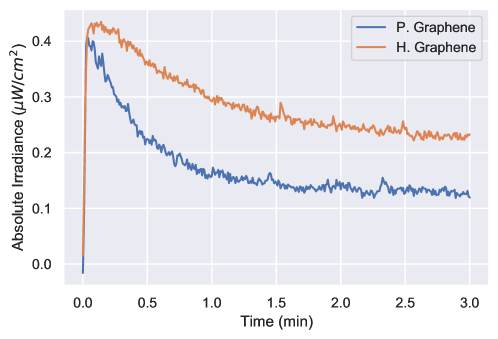
Several measurements were made in different points of the samples, to determine the average decay rate of the third-harmonic signal. It is important to note that the measurements were made with the same third-harmonic power, which was achieved by placing the hydrogenated graphene sample slightly out of focus. The results show that the decay rate for the hydrogenated sample was reduced by 30%, indicating that the functionalization improved the sample’s resilience to laser-induced damage. Although the hydrogenated graphene sample was not subjected to the same intensity as the pristine graphene sample, which can be an explanation of this damage reduction, it is clear that, with the same third-harmonic power - that is already sufficient for the complete ultrashort pulse characterization - the decay of the third-harmonic power is slower.
A possible explanation for the damage caused to the graphene’s sample is the strong DUV absorption. As already stated in Figure 6, pristine graphene has an absorption peak at around 270 nm, which is very close to the third-harmonic center wavelength, therefore being a possible explanation of the graphene’s degradation over time.
5 Conclusion
Single-layer graphene sheets were synthetized by TCVD on copper substrates. The as-grown sample was then successively transferred onto a fused silica substrate forming a stack of 5 graphene layers. The functionalization of as-grown graphene was accomplished by photoassisted hydrogenation reaction with formic acid, allowing increasing its nonlinear optical response and its laser-induced damage resilience.
References
- [1] Dun Mao, Chen Cheng, Feifan Wang, Yahui Xiao, Tiantian Li, Lorry Chang, Anishkumar Soman, Thomas Kananen, Xian Zhang, Michael Krainak, Po Dong, and Tingyi Gu. Device architectures for low voltage and ultrafast graphene integrated phase modulators. IEEE Journal of Selected Topics in Quantum Electronics, 27(2):1–9, 2021.
- [2] Jacek Gosciniak, Mahmoud Rasras, and Jacob B. Khurgin. Ultrafast plasmonic graphene photodetector based on the channel photothermoelectric effect. ACS Photonics, 7(2):488–498, 2020.
- [3] E. Hendry, P. J. Hale, J. Moger, A. K. Savchenko, and S. A. Mikhailov. Coherent nonlinear optical response of graphene. Phys. Rev. Lett., 105:097401, Aug 2010.
- [4] S.A. Mikhailov. Theory of the nonlinear optical frequency mixing effect in graphene. Physica E: Low-dimensional Systems and Nanostructures, 44(6):924 – 927, 2012. The proceedings of the European Materials Research Symposium on Science and Technology of Nanotubes, Nanowires and Graphene.
- [5] Adam Roberts, Daniel Cormode, Collin Reynolds, Ty Newhouse-Illige, Brian LeRoy, and Arvinder Sandhu. Response of graphene to femtosecond high-intensity laser irradiation. Applied Physics Letters, 99(051912), 2011.
- [6] Marc Currie, Joshua Caldwell, Francisco Bezares, Jeremy Robinson, Travis Anderson, Hayden Chun, and Marko Tadjer. Quantifying pulsed laser induced damage to graphene. Applied Physics Letters, 99:211909 – 211909, 2011.
- [7] Yan Zhao, Jiao Lu, Yanyan Huo, Baoyuan Man, and Tingyin Ning. Enhanced third harmonic generation from graphene embedded in dielectric resonant waveguide gratings. Optics Communications, 447:30 – 35, 2019.
- [8] Boyuan Jin, Tianjing Guo, and Christos Argyropoulos. Enhanced third harmonic generation with graphene metasurfaces. Journal of Optics, 19(9):094005, aug 2017.
- [9] Miguel Miranda, Cord L. Arnold, Thomas Fordell, Francisco Silva, Benjamín Alonso, Rosa Weigand, Anne L’Huillier, and Helder Crespo. Characterization of broadband few-cycle laser pulses with the d-scan technique. Opt. Express, 20(17):18732–18743, Aug 2012.
- [10] Miguel Miranda, Thomas Fordell, Cord Arnold, Anne L’Huillier, and Helder Crespo. Simultaneous compression and characterization of ultrashort laser pulses using chirped mirrors and glass wedges. Opt. Express, 20(1):688–697, Jan 2012.
- [11] Bohdan Kulyk, Alexandre F. Carvalho, António J.S. Fernandes, and Florinda M. Costa. Millimeter sized graphene domains through in situ oxidation/reduction treatment of the copper substrate. Carbon, 169:403–415, 2020.
- [12] Andrea C. Ferrari and Denis M. Basko. Raman spectroscopy as a versatile tool for studying the properties of graphene. Nature nanotechnology, 8 4:235–46, 2013.
- [13] A. C. Ferrari, J. C. Meyer, V. Scardaci, C. Casiraghi, M. Lazzeri, F. Mauri, S. Piscanec, D. Jiang, K. S. Novoselov, S. Roth, and A. K. Geim. Raman spectrum of graphene and graphene layers. Phys. Rev. Lett., 97:187401, Oct 2006.
- [14] Andrea C. Ferrari. Raman spectroscopy of graphene and graphite: Disorder, electron–phonon coupling, doping and nonadiabatic effects. Solid State Communications, 143(1):47–57, 2007. Exploring graphene.
- [15] Alexandre F. Carvalho, Tiago Holz, Nuno F. Santos, Marta C. Ferro, Manuel A. Martins, António J.S. Fernandes, Rui F. Silva, and Florinda M. Costa. Simultaneous cvd synthesis of graphene-diamond hybrid films. Carbon, 98:99–105, 2016.
- [16] D. Briggs. Handbook of x-ray photoelectron spectroscopy c. d. wanger, w. m. riggs, l. e. davis, j. f. moulder and g. e.muilenberg perkin-elmer corp., physical electronics division, eden prairie, minnesota, usa, 1979. 190 pp. $195. Surface and Interface Analysis, 3(4):v–v, 1981.
- [17] Yaoming Xie and Peter M. A. Sherwood. X-ray photoelectron-spectroscopic studies of carbon fiber surfaces. 11. differences in the surface chemistry and bulk structure of different carbon fibers based on poly(acrylonitrile) and pitch and comparison with various graphite samples. Chemistry of Materials, 2(3):293–299, 1990.
- [18] Alessandro Kovtun, Derek Jones, Simone Dell’Elce, Emanuele Treossi, Andrea Liscio, and Vincenzo Palermo. Accurate chemical analysis of oxygenated graphene-based materials using x-ray photoelectron spectroscopy. Carbon, 143, 11 2018.
- [19] Jianguang Feng, Hongzhou Dong, Beili Pang, Yingjie Chen, Liyan Yu, and Lifeng Dong. Tuning the electronic and optical properties of graphene quantum dots by selective boronization. J. Mater. Chem. C, 7:237–246, 2019.
- [20] Daniela C. Marcano, Dmitry V. Kosynkin, Jacob M. Berlin, Alexander Sinitskii, Zhengzong Sun, Alexander Slesarev, Lawrence B. Alemany, Wei Lu, and James M. Tour. Improved synthesis of graphene oxide. ACS Nano, 4(8):4806–4814, 2010. PMID: 20731455.
- [21] Francisco Silva, Miguel Miranda, Stephan Teichmann, Matthias Baudisch, Mathieu Massicotte, Frank Koppens, Jens Biegert, and Helder Crespo. Near to mid-IR ultra-broadband third harmonic generation in multilayer graphene: Few-cycle pulse measurement using THG dispersion-scan. In CLEO: 2013, page CW1H.5, San Jose, California, 2013. OSA.