Controlled Signaling and Transmitter Replenishment for MC with Functionalized Nanoparticles
Abstract.
In this paper, we propose novel Transmitter (Tx) models for Molecular Communication (MC) systems based on functionalized Nanoparticles. Current Tx models often rely on simplifying assumptions for the molecule release and replenishment mechanisms. In contrast, we propose a Tx model where the signaling molecule release is controlled by a switchable membrane driven by an external trigger. Moreover, we propose a reloading mechanism, where signaling molecules are harvested based on an enzymatic reaction. Hence, no repeated injection of signaling molecules is required. For the proposed Tx model, we develop a general mathematical description in terms of a discrete-time transfer function model. Furthermore, we investigate two realizations of the proposed Tx model, i.e., an idealized Tx relying on simplifying assumptions, and a realistic Tx employing practical components for the reloading and release mechanisms. Finally, we numerically evaluate the proposed model and compare our results to stochastic Particle Based Simulations.
1. Introduction
Molecular Communication (MC) is a bio-inspired communication paradigm employing molecules for information exchange. MC enables synthetic communication at the nanoscale, which paves the way for transformative applications in nanomedicine and health monitoring (Chude-Okonkwo et al., 2019; Akyildiz et al., 2015). For the design and optimization of MC systems it is crucial to develop models for its components, i.e., the Transmitter (Tx), the channel, and the Receiver (Rx). Various component models have been proposed, which can be roughly classified into point and volume Txs, diffusive, advective, and degradative channels, and active and passive Rxs (Jamali et al., 2019). However, most existing models do not properly reflect the characteristics of practical components due to various simplifications.
Specifically, the development of practical Tx models is crucial, since the majority of the works in the MC literature assume a point Tx, requiring instantaneous signaling molecule production and release (Jamali et al., 2019). However, realistic Tx models have to consider the following aspects: (i) the signal molecule production and propagation inside the Tx, and (ii) mechanisms for releasing signal molecules. A first step towards practical Tx models was made in (Noel et al., 2016), which studies a virtual spherical Tx with uniformly distributed molecules inside and a fully reflective spherical Tx with uniformly distributed molecules on its surface, respectively. However, both Tx models assume an instantaneous molecule production and release. The works in (Schäfer et al., 2020; Huang et al., 2022; Arjmandi et al., 2016; Schäfer et al., 2022) focus on the release mechanism and the propagation inside the Tx. In (Arjmandi et al., 2016), a spherical Tx with ion-channels in its membrane is investigated, where the release of the signal molecules is controlled by the opening and closing of the ion-channels through a voltage or ligands. In (Schäfer et al., 2020), the molecule release from a spherical Tx is controlled by a spatially and temporally adjustable semi-permeable membrane. A membrane-fusion based Tx is considered in (Huang et al., 2022), which encapsulates the signaling molecules in vesicles. The molecules are released when the vesicles fuse with the Tx membrane. While the aforementioned models can be considered as reservoir-based Tx models that control the release by membrane functionalization, in (Schäfer et al., 2022) polymer matrices are considered as Txs, which are already employed as practical drug carriers in medical applications. However, none of the works mentioned above take the production of signaling molecules into account. Besides the generation of molecules (e.g., via chemical reaction networks), molecule harvesting is a promising approach to generate signaling molecules. Recently, in (Ahmadzadeh et al., 2022) a molecular harvesting Tx is proposed, where molecules are released by release units (e.g., ion-channels (Arjmandi et al., 2016)) and re-captured if they hit a harvesting unit on the Tx surface.
In this paper, we propose a novel Tx model basing on the properties of functionalized Nanoparticles (NPs), which are promising candidates to be used as nodes in nanonetworks for sensing and localized treatment (Chude-Okonkwo et al., 2019; Akyildiz et al., 2015). The envisioned Tx provides a controlled molecule release mechanism based on switching the NP membrane between the open and closed states by an external trigger, e.g., a pH change of the surrounding environment. Furthermore, the proposed Tx exhibits a reloading mechanism for repeated signaling molecule production, which enables the harvesting of signaling molecules from the molecules already present in the surrounding environment of the Tx. In contrast to (Ahmadzadeh et al., 2022), the proposed reloading mechanism is based on an enzyme reaction inside the Tx to convert molecules surrounding the Tx to signaling molecules. Therefore, the proposed system can also be interpreted as a realization of media modulation (Brand et al., 2022), since the molecules that are converted to signal molecules by the NPs are already present in the environment surrounding the Tx. Thus an external injection of signaling molecules is not required. The main contributions of this paper are as follows:
-
•
We propose a novel Tx design for synthetic MC systems based on functionalized NPs. The proposed Tx enables controlled molecule release via a switchable membrane and reloading by harvesting molecules from the environment.
-
•
We develop a model for an idealized Tx realization based on instantaneous membrane switching and a simple first order reaction for the production of the signaling molecules.
-
•
We develop a second, more practical Tx model based on a non-instantaneous membrane switching mechanism employing a pH sensitive polymer and the conversion of molecules from the surrounding environment to signaling molecules by a realistic enzyme reaction.
The paper is organized as follows. In Section 2, we introduce the proposed Tx model for MC systems, including a general mathematical description. The general model is specialized to an idealized realization and a practical realization of the Tx in Sections 3 and 4, respectively. Finally, Section 5 presents numerical results, and our main conclusions are drawn in Section 6.
2. System Model
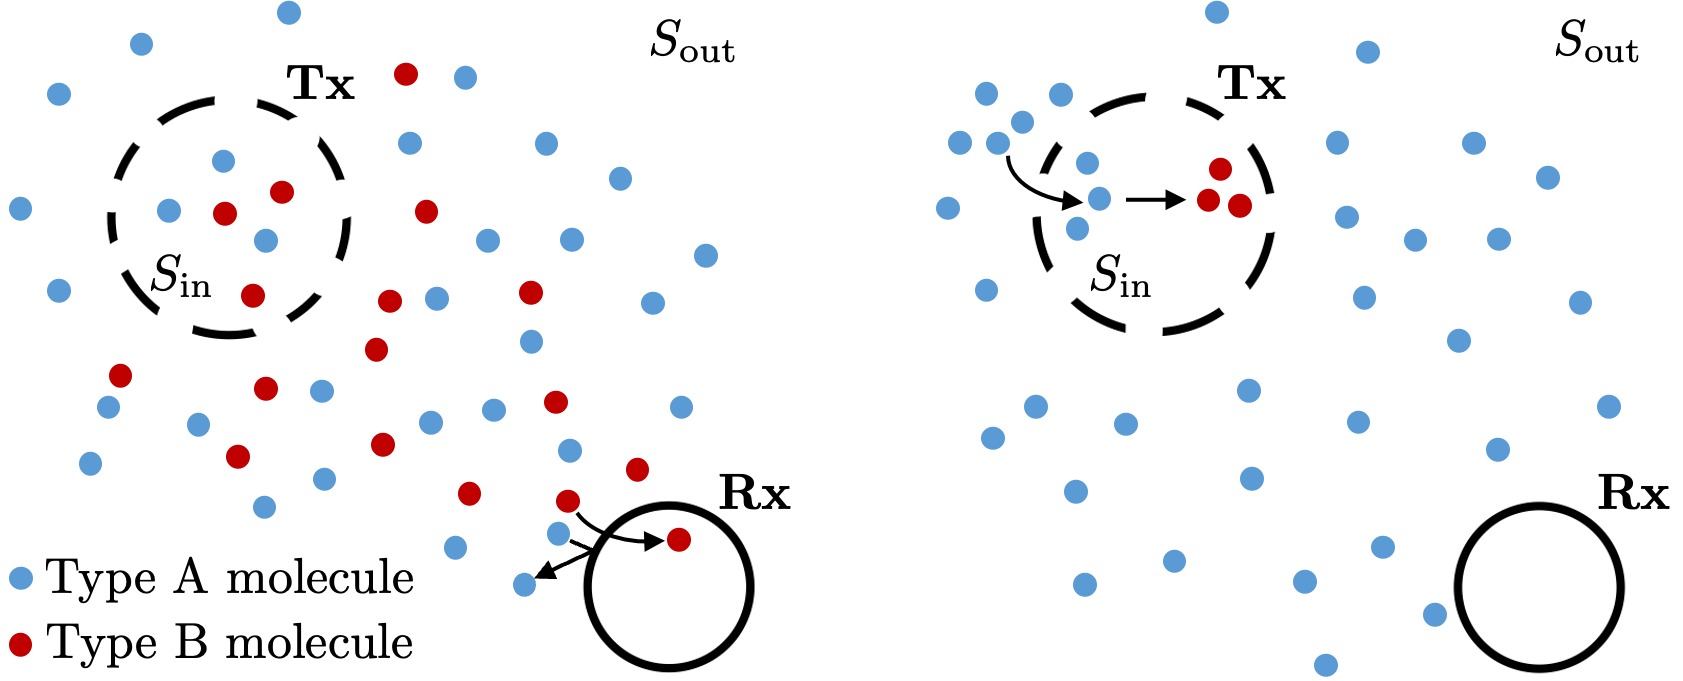
In this section, we describe the proposed Tx design employing functionalized NPs, see Fig. 1. The envisioned Tx comprises two main mechanisms, namely
-
(i)
a controlled release mechanism, which enables the release of signaling molecules controlled by an external stimulus (see Fig. 1, left hand side),
-
(ii)
a reloading mechanism enabling the production of signaling molecules inside the Tx from molecules recruited from the surrounding environment (see Fig. 1, right hand side).
Both mechanisms are facilitated by the design and functionalization of the NP. The controlled release mechanism (ii) is realized by functionalization of the NP with a switchable membrane allowing for the control of its permeability by an external stimulus. The reloading mechanism (i) is realized by enzymes encapsulated in the NP allowing for the conversion of molecules recruited from the surrounding environment, denoted as type A molecules, in signaling molecules, denoted as type B molecules. The switching of the NP membrane between the open and closed states is exploited for both the controlled release of type B molecules and the reloading of type A molecules, while the membrane is impermeable for enzymes in both states. In the following we denote the number of type A molecules in the environment, , and inside the NP volume, , by and , respectively (see Fig. 1).
To provide a tractable mathematical description of the proposed Tx, we make the following assumptions:
-
A1)
The environment with volume size is much larger than with size , i.e., .
-
A2)
Both volumes and are well mixed and .
A1 is motivated by the fact that the typical diameter of a NP is around hundreds of nanometer, while the diameter of a typical synthetic MC channel, e.g., a microliter reactor or a microfluidic channel, is around (Gräfe et al., 2014; Schäfer et al., 2021, 2022). A2 is justified if the propagation of molecules due to diffusion is relatively fast compared to the absorption rate of these molecules at the boundary of the NP. For , A2 is valid for the practical values chosen for the diffusion coefficient of the molecules, the number of molecules in , , and permeability of the NP. For , A2 is validated by the excellent agreement of the numerical results obtained from our proposed Tx model, relying on A2, and the results obtained from stochastic Particle Based Simulations (PBSs).
2.1. Transmitter Reloading Mechanism
The Tx reloading is based on the diffusion of type A molecules from into the NP and their conversion into type B signaling molecules, see right hand side of Fig. 1. Based on A1 and A2, the concentration of the type A molecules inside the NP can be modeled by the following Ordinary Differential Equation (ODE)
| (1) |
where denotes a derivative with respect to time , and and denote the concentration of type A molecules in in and , respectively. The time-dependent permeability in models the switchable Tx membrane111We obtained in from practical permeability values , actually measured in , by a relation to the surface area and of the NP, i.e., .. The function models the change of concentration due to the conversion of type A molecules into type B molecules, which depends on the inner concentration and the actual production mechanism. For example, if the production of type B molecules is realized by an enzyme reaction (see Sections 3 and 4), function may also depend on the enzyme and cofactor concentrations inside the NP volume .
Similar to (1), the concentration of type B signaling molecules in can be modeled by the following ODE
| (2) |
where and denote the concentration of type B molecules in in and , respectively. Similar to function in (1), the function models the change of due to the production of type B molecules from type A molecules.
2.2. Controlled Release of Signaling Molecules
The controlled release of type B molecules from the Tx into the environment depends on the NP permeability and on the difference between the inner and outer concentration of type B molecules which can be expressed as follows
| (3) |
2.3. Reception of Signaling Molecules
As Rx model, we adopt an absorbing spherical Rx with radius and distance from the Tx. Moreover, the Rx can only absorb type B molecules. The number of molecules absorbed by the Rx is obtained by convolving the number of molecules , released from the Tx surface over time, and the hitting probability of an instantaneous release from the surface of a spherical Tx previously proposed in (Huang et al., 2022), i.e.,
| (4) |
where denotes a convolution with respect to time and the number of type B molecules released by the Tx is given by , with Avogadro constant . The analytical expression for is given by (Huang et al., 2022, Eq. (9)).
3. Idealized Transmitter Model
In this section, we investigate an idealized realization of the Tx model proposed in Section 2. This idealized model will serve later as a benchmark for the practical Tx proposed in Section 4. To this end, we specialize the reloading and release mechanism to obtain mathematically tractable functions. We assume an instantaneous switching and a first order irreversible reaction for type B molecule production inside the NP. In particular, we assume that the membrane of the NP can be switched instantaneously between the closed and open states with permeability , i.e., . We model the production of type B signaling molecules from harvested type A molecules in by a simple first order reaction (Noel et al., 2014)
| (5) |
As further idealization we assume that reaction (5) takes place anywhere in with constant reaction rate in . With this assumption for the production of type B molecules, (1) simplifies to
| (6) |
where we further assume a constant type A molecule concentration in , i.e., . This assumption is justified by A1 and A2, i.e., due to the large number of molecules uniformly distributed in and the volume difference between and , the number of molecules diffusing into the NP does not significantly change the number of type A molecules in . Similarly, the ODEs in (2) and (3) simplify as follows
| (7) |
and
| (8) |
where we exploited A1 and A2 to assume an irreversible transmission of type B molecules through the Tx membrane, where the influx of type B molecules from the environment into the Tx is neglected (perfect sink).
3.1. Discrete-time Transfer Function Model
Due to the time-dependent permeability in (6)–(8), no closed form solution in the continuous-time domain can be derived. Therefore, we derive a discrete-time transfer function model for the system of ODEs (6)–(8) via the Impulse Invariant Transformation (IIT) (Schäfer et al., 2021). Applying the IIT to ODE (6) yields a scalar valued discrete-time state equation for the concentration of type A molecules in
| (9) |
with discrete-time index , sampling time (i.e., , and time-dependent parameter .
Similarly, applying an IIT to (7) and (8) yields
| (10) |
and
| (11) |
with and . The discrete-time solution in (9)–(11) has several benefits. First, the description in the discrete-time domain allows the incorporation of the time-variance introduced by permeability in terms of time-variant parameters and . Second, the proposed model allows a simple and computationally efficient solution of the ODEs in (6)–(8).
4. Practical Transmitter Model

In this section, we consider a realization of the Tx model proposed in Section 2 based on practical components for the production and controlled release of signaling molecules.
4.1. Membrane Switching Mechanism
The key property of the proposed Tx for both controlled release and reloading is the ability to open and close the NP membrane upon a controllable trigger signal. As a practical type of NP, we employ polymersomes, the synthetic counterpart of liposomes, with a pH-driven permeability switch, which consist of a multifunctional amphiphilic block copolymer. In particular, it consists of the biocompatible poly(ethylene glycol) (PEG) as the hydrophilic part and a statistical mix of two components in the hydrophobic part providing the pH sensitive membrane switching functionalities, see (Gaitzsch et al., 2012a; Gräfe et al., 2014) for details. For high pH values, i.e., , the membrane of the NP collapses, i.e., the membrane is non-permeable and molecules can neither diffuse out of the NP nor into it (permeability ). When the pH value is low, i.e., , the membrane swells and becomes permeable with permeability . Fig. 2 shows the switching process of the NP for multiple pH changes.
Compared to the idealized scenario, considered in Section 3, for practical NPs, the membrane switching is no longer instantaneous. In particular, upon the external pH trigger it takes approximately – until the membrane permeability reaches , see (Gaitzsch et al., 2012a, Fig. 3). A similar time delay applies for the closing process upon a pH increase. We note that the exact temporal evolution of the NP permeability is not known. Therefore, the change of from (closed) to (open) and vice versa is modeled by a linear increase and a linear decrease, respectively. Also the maximum permeability in the open state is not given in a closed form, but we estimated from the measurements provided in (Gaitzsch et al., 2012b) employing the methods from (Battaglia et al., 2006).
4.2. Production of Signaling Molecules
In the idealized scenario discussed in Section 3, we employed a first order reaction for signaling molecule production. In this section, we investigate a realistic mechanism for the production of signaling molecules by an enzyme reaction.
We realize the production of signaling molecules by the encapsulation of Mandelate Racemase (MR) into the NP. The enzyme MR performs a reversible one-substrate-reaction of -Mandelate (type A molecules) to -Mandelate (type B signaling molecules), and the reaction equations are as follows (Narmandakh and Bearne, 2010; Maurice and Bearne, 2002)
| (12) |
where E denotes the enzyme MR, and E(R)man and E(S)man denote intermediate complexes of MR and (R)-Mandelate ((R)man) and (S)-Mandelate ((S)man), respectively. The corresponding reaction rates are denoted by and , respectively. The production of (S)man molecules from (R)man molecules harvested from the surrounding environment is illustrated in Fig. 2.
MR exhibits several benefits making it a suitable enzyme for the practical realization of the proposed Tx. First, MR does not require a cofactor for the reaction to take place. This property enables a longer operating life of the Tx in practice, as MR produces signaling molecules as long as molecules can be harvested and is not bound by the number of cofactor molecules encapsulated into the NP. Second, MR is inexpensive and easy to synthesize in practice, which is beneficial for building a synthetic MC testbed in future work (Narmandakh and Bearne, 2010; Maurice and Bearne, 2002). However, compared to the simple first order reaction in (5), reaction (12) is bidirectional and does not convert all (R)man into (S)man. Instead the concentration of both reaches an equilibrium, i.e., half of the harvested molecules are converted into signaling molecules (see Fig. 2) (Maurice and Bearne, 2002). As reaction equation (12) of MR is more complex than the simple reaction equation in (5) it cannot be solved in a closed form nor simplified further (Maurice and Bearne, 2002).
We note that the enzyme chosen in the Tx also affects the Rx design. For MR, a practical absorbing Rx may comprise (S)-Mandelate Dehydrogenase which can oxidize (S)man signaling molecules into benzoylformate (Lehoux and Mitra, 1999). However, the detailed investigation of a practical Rx is left for future work. In this paper we adopt the absorbing Rx model introduced in Section 2.
4.3. Discrete-time Transfer Function Model
Similar to the discrete-time model derived for the idealized Tx model in Section 3.1, we now derive a discrete-time model for the practical realization of the proposed Tx.
Applying the IIT to the equations for the reloading mechanism (1) and (2), we obtain a non-linear discrete-time state equation for the concentration of (R)man in as follows
| (13) |
with . Concentrations , and denote the concentration of (R)man in and , and the concentration of MR in , respectively. Vector comprises all reaction rates of MR. The non-linear function describes the change of due to the enzyme reaction (12) facilitated by MR. Similarly, we obtain for the concentration of the (S)man signaling molecules in
| (14) |
with and the non-linear function modeling the change of due to the enzyme reaction. As previously mentioned, the reaction (12) cannot be solved analytically, i.e., we cannot express the number of (R)man molecules produces over time in terms of the number of (S)man molecules and vice versa. Therefore, functions in (13) and in (14) cannot be given in a closed form. Instead, and represent the numerical solution of (12) to calculate the change of and in each time step based on the previous time step. In general, a numerical solution for (12) can be obtained by the numerical methods described, e.g., in (Higham, 2008). We obtain a numerical solution for (12) as follows: First, we assume a pseudo steady state and derive a reaction rate equation for the three individual bidirectional reactions in (12) see, e.g., (Higham, 2008, Sec. 7) and (Segel and Slemrod, 1989). Second, we solve these individual reactions by an exponential approach and calculate them sequentially in each time step222Please find further information and the Python implementation used for numerical evaluation on: https://www.maximilianschaefer.org/publication/nanocom22/.
The concentration of (S)man molecules in adopts a similar shape as for the idealized realization in (11) as follows
| (15) |
with .
5. Numerical Evaluation
In this section, numerical results obtained for the models proposed in Sections 3 and 4 are presented along with results obtained from stochastic PBSs. The default parameter values are listed in Table 1.
5.1. Particle Based Simulation
For PBS we adopted the simulator design in (Schäfer et al., 2022). The simulator features three dimensional Brownian motion of type A and type B molecules. Both the first order reaction and the MR based reaction inside the NP are implemented using the methods in (Noel et al., 2014; Andrews and Bray, 2004). The propagation of molecules through the permeable membrane is realized by exploiting the concept for partial transmission presented in (Andrews, 2010, Sec. 4.5). Due to the large number of molecules in the environment, it is not feasible to track the position of all molecules. Therefore, the PBS only considers the molecules entering the NP during the simulation time by realizing the influx of molecules into the NP by a Monte Carlo simulation. In particular, the number of molecules entering the NP per time step follows a Binomial distribution with the time-dependent mean value .
| Parameter | Default Value | Description | Ref. |
|---|---|---|---|
| Diffusion coefficient | (Calderó et al., 2000) | ||
| Reaction rate | |||
| Reaction rate MR | (Maurice and Bearne, 2002) | ||
| Reaction rate MR | (Maurice and Bearne, 2002) | ||
| Reaction rate MR | (Maurice and Bearne, 2002) | ||
| Reaction rate MR | (Maurice and Bearne, 2002) | ||
| Reaction rate MR | (Maurice and Bearne, 2002) | ||
| Reaction rate MR | (Maurice and Bearne, 2002) | ||
| NP radius | (Gaitzsch et al., 2012a) | ||
| Radius of surrounding volume | |||
| Receiver radius | |||
| Tx-Rx-Distance | |||
| Maximum permeability | (Gaitzsch et al., 2012b; Battaglia et al., 2006) | ||
| Number of molecules in the surrounding environment | |||
| Simulation time step |
5.2. Evaluation of the Idealized Tx Realization
In this section, we investigate the idealized Tx model described in Section 3. The idealized model has several parameters to influence the reloading and release mechanism, i.e., the reaction rate , membrane switching times and . However, in this paper, we only vary the reaction rate and keep the switching times and permeability fixed. For comparability, the default reaction rate is chosen to produce approximately the same amount of signaling molecules per second as the practical Tx model.
Reloading Mechanism
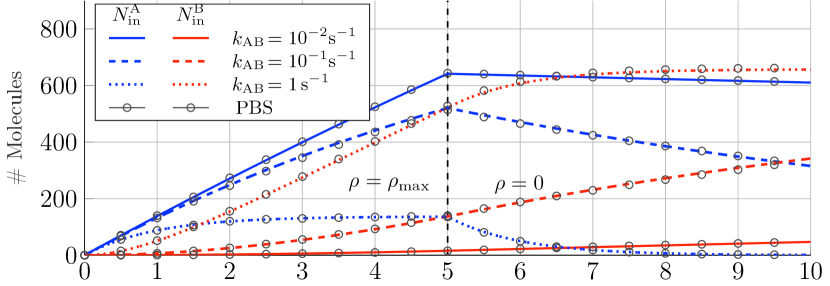
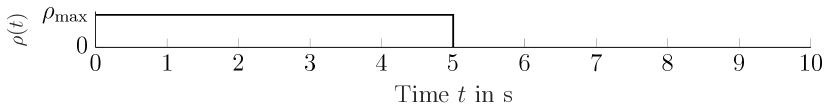
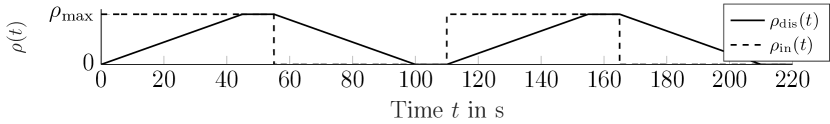
The top of Fig. 3 shows the amount of type A (blue curves) and type B molecules (red curves) inside the Tx for different reaction rates for the membrane switching pattern shown at the bottom with . We observe that the number of type A molecules increases during the open phase of the membrane and molecules can diffuse into the Tx from the environment. When the membrane is closed (), decreases because no molecules enter the Tx and the harvested type A molecules are converted into type B molecules. Next, we investigate the production of type B molecules and the impact of reaction rate . The red curves in Fig. 3 show the amount of type B molecules inside the Tx for different reaction rates . We observe, that the number of type B molecules produced per second increases for increasing because the probability that a harvested type A molecule is converted into a type B molecule increases. For (dashed line) and (solid lines), increases faster than during the open phase. This behavior can be explained by inspecting (6): For a small reaction rate , the influx of type A molecules (first term on the left hand side of (6)) is larger than the amount of type A molecules converted into type B molecules (second term on the right hand side of (6)). Next, we observe that the saturates around , while increases linearly for (dotted lines). In this case, the production of type B molecules and the harvesting of type A molecules reaches an equilibrium, i.e., for , does not increase further because all type A molecules entering the Tx are converted into type B molecules. Finally, we observe that only for , the reaction is fast enough to convert all harvested type A molecules into type B molecules during the closed phase.
Multiple Switching Phases and Reception
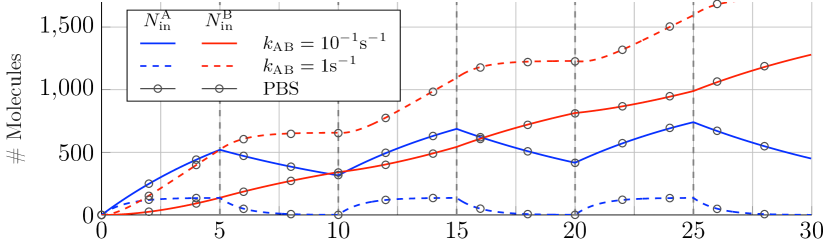

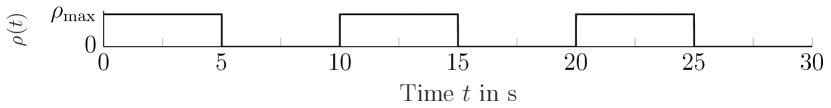
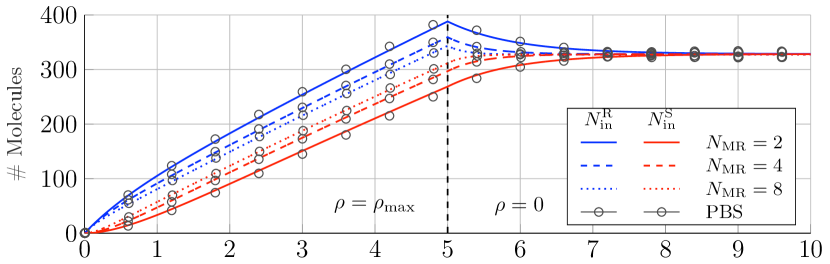
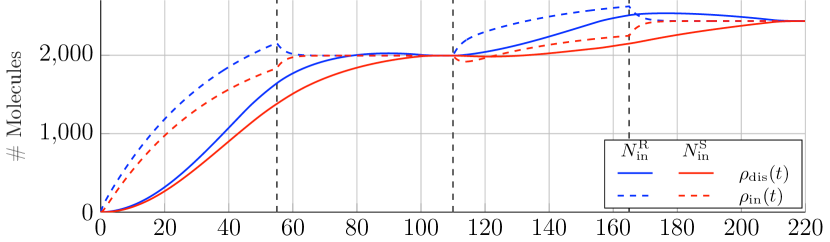
Now, we consider multiple switching intervals to investigate repeated reloading phases and molecule releases. The top plot of Fig. 4 shows the reloading of type A molecules and the production of signaling molecules for two different reaction rates . The center plot shows the accumulated number of signaling molecules released from the Tx, , and the accumulated number of signaling molecules absorbed by the Rx, . The bottom plot of Fig. 4 shows the membrane switching pattern for .
First, we observe that the behavior of the individual reloading processes is similar to that observed in Fig. 3. Next, we observe from the top plot of Fig. 4 that the number of type B molecules inside the Tx increases over the switching intervals. This effect has two reasons. First, due to the small permeability the amount of released type B molecules is smaller than the amount of type B molecules produced (see (7)). Second, the maximum capacity of the Tx, which is around , is not reached for the considered switching pattern. Each opening of the NP membrane not only starts a reloading process but also triggers a controlled release of signaling molecules from the Tx. To investigate the signaling properties, the center plot of Fig. 4 shows the amount of type B molecules released from the Tx (red curves) and received by the Rx (black curves). First, we observe that the individual releases of type B molecules from the Tx are clearly distinguishable (red curves). This clear differentiation between individual releases is due to the instantaneous switching of the Tx membrane which immediately starts and stops the transport of molecules when the Tx membrane opens and closes. This also leads to a clearly distinguishable reception of the individual releases at the Rx (black curves). Moreover, we observe from Fig. 4 that the amount of released and received molecules increases for an increasing reaction rate . This effect is directly related to the rate dependent production of type B signaling molecules inside the Tx as discussed in the previous section, cf. Fig. 3. Finally, we note that all results obtained with our model and the results from PBS match very well.
5.3. Evaluation of the Practical Tx Realization

In this section, we investigate the practical realization of the proposed Tx model described in Section 4. The practical model has two parameters to influence the reloading and release mechanism, i.e., the membrane switching times and the number of encapsulated enzymes . The permeability in the open state cannot be influenced as it depends on the practical components, e.g., the polymers, used for NP fabrication, see Section 4.1 and (Gräfe et al., 2014; Gaitzsch et al., 2012a). For the considered NP, the membrane permeability is controlled by the pH-value of , cf. Section 4.1. In the following, we assume that the pH in can be controlled perfectly, and therefore, we express different switching patterns in terms of the permeability .
Reloading Mechanism
First, we investigate the signaling molecule production facilitated by MR, and therefore, we employ the instantaneous switching pattern from Fig. 3. Fig. 5 shows the amount of (R)man (blue curves) and (S)man molecules (red curves) inside the Tx for different number of encapsulated MR enzymes. First, we observe that the number of (R)man (blue curves) and signaling (S)man molecules (red curves) inside the Tx reach an equilibrium. This effect is different compared to the properties of the previously discussed idealized Tx model. While the first order reaction (6) converts all molecules harvested from the environment into signaling molecules (see Fig. 3), the reaction facilitated by MR in (12) pursues an equilibrium between (R)man and (S)man molecules (Maurice and Bearne, 2002). Now, we investigate the impact of the number of enzymes encapsulated into the NP. We observe that for an increasing number of enzymes the equilibrium is reached faster, i.e., for the equilibrium is reached after closing (solid lines), while it is reached after closing for (dotted lines). However, the number of enzymes does not influence the number of produced (S)man molecules. Therefore, after Tx reloading, half of the harvested molecules are available as signaling molecules for transmission independent of .
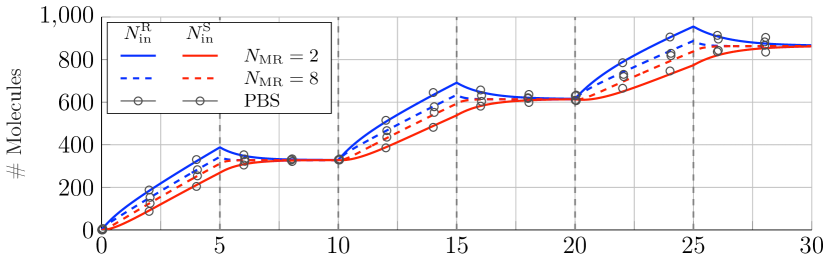
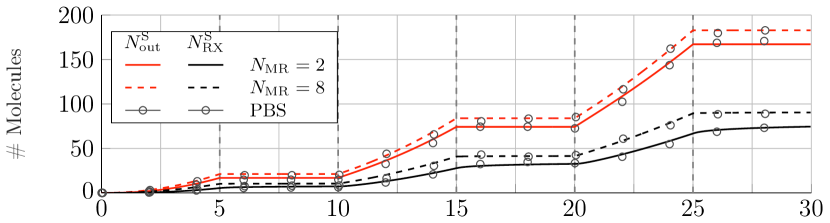

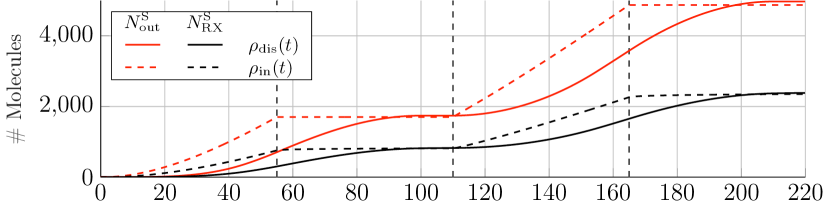
Multiple Switching Phases and Reception
Similar to the idealized realization, we now consider multiple switching intervals. The top plot of Fig. 6 shows the number of (R)man and (S)man molecules inside the Tx. The center plot shows the accumulated number of (S)man molecules released from the Tx, , and the accumulated number of (S)man molecules absorbed at the Rx, . In order to make these results comparable to those from Fig. 4, we applied the same instantaneous switching pattern (see bottom plot of Fig. 6). First, we observe that behavior of each individual switching process is similar to that observed in Fig. 5. In particular, whenever the Tx membrane is closed an equilibrium is reached between (R)man and (S)man. Next, we observe that the individual releases of signaling (S)man molecules are clearly distinguishable. Similar to the idealized Tx model, this effect is due to the instantaneous membrane switching pattern. Moreover, we observe that the amount of molecules released from the Tx and received by the Rx in each opening phase of the Tx membrane is approximately half as large as the amount released by the idealized Tx, see Fig. 4. This observation is consistent with the results shown in Fig. 5. In particular, MR does not convert all harvested molecules into signaling molecules but pursues an equilibrium between (R)man and (S)man inside the Tx. Therefore, only half of the harvested molecules are available as signaling molecules. Finally, we observe that the number of encapsulated enzyme only has minor influence on the number of released molecules, but it controls the time until the equilibrium is reached inside the Tx, see also Fig. 5. This is plausible, because increasing the number of enzymes increases the probability that a harvested molecule reacts, but does not influence the reaction rates nor the equilibrium, see (12). However, Fig. 6 shows that is an important design parameter for the proposed Tx. In particular, increasing decreases the time until the maximum number of signaling molecules is produced, and therefore, the duration of the closed phase between two transmission can be reduced. Finally, we note that the results obtained from the proposed model and the results obtained from PBS match very well.
Influence of Non-Instantaneous Switching
Now, we investigate the impact of a non-instantaneous membrane switching pattern for the practical NP described in Section 4. Therefore, we compare two switching patterns in the following. An idealized instantaneous switching pattern with and a realistic switching pattern where each membrane switch from open to close and vice versa is distributed over (see bottom of Fig. 7). The resulting long simulation durations for realistic switching durations makes the usage of PBS infeasible. Instead, we rely on the results of our proposed model as it can handle longer time sequences and we have shown in the previous sections that it matches the results from PBS very well. Fig. 7 shows the number of (R)man and (S)man molecules inside the Tx (top) and the number of molecules released from the Tx and received at the Rx (center). First, we observe that the total number of molecules inside the Tx, released from the Tx, and received by the Rx increased significantly due to the long switching intervals. Next, we observe that the equilibrium inside the Tx is reached faster for the instantaneous switching pattern than for the practical . Comparing the number of received molecules for (solid lines) and the instantaneous (dashed lines), we observe that the individual releases of signaling molecules from the Tx are no longer clearly distinguishable for the practical pattern . This effect is expected, because also spreads the release of molecules from the Tx over the switching intervals, i.e., the number of released molecules per second increases with increasing permeability. In contrast, for the instantaneous pattern the molecule release starts and stops immediately. These results reveal that the non-instantaneous switching of the practical Tx model has a significant influence on the received number of molecules. The resulting implication for the design of suitable detectors is left for future work.
6. Conclusions
In this paper, we proposed a novel Tx model for MC based on functionalized NPs, which overcomes common assumptions of existing Tx models. We presented a general mathematical model and specialized the system to a realization relying on idealized assumptions and a practical realization. In our numerical evaluation, we investigated the signaling molecule production mechanisms and the influence of multiple, (non-)instantaneous membrane switching cycles. By comparison to PBS, we confirmed the validity of our models.
The results of this paper are a first step towards the development of more practical Tx models for MC. Interesting topics for future work include a more detailed investigation of all design parameters for both the idealized and the practical realization of the proposed Tx model, the evaluation of the communication theoretical measures, e.g., the bit error rate, and the development of a experimental testbed to validate the proposed models with experimental data.
References
- (1)
- Ahmadzadeh et al. (2022) A. Ahmadzadeh, V. Jamali, and R. Schober. 2022. Molecule Harvesting Transmitter Model for Molecular Communication Systems. IEEE Open J. Commun. Soc. 3, January (2022), 391–410. https://doi.org/10.1109/OJCOMS.2022.3155648
- Akyildiz et al. (2015) I. F. Akyildiz, M. Pierobon, S. Balasubramaniam, and Y. Koucheryavy. 2015. The Internet of Bio-Nano Things. IEEE Commun. Mag. 53, 3 (2015), 32–40.
- Andrews (2010) S. S Andrews. 2010. Accurate Particle-based Simulation of Adsorption, Desorption, and Partial Transmission. Phys. Biol. 6, 4 (2010).
- Andrews and Bray (2004) S. S. Andrews and D. Bray. 2004. Stochastic Simulation of Chemical Reactions with Spatial Resolution and Single Molecule Detail. Phys. Biol. 1, 3 (2004), 137–151.
- Arjmandi et al. (2016) H. Arjmandi, A. Ahmadzadeh, R. Schober, and M. Nasiri Kenari. 2016. Ion Channel Based Bio-Synthetic Modulator for Diffusive Molecular Communication. IEEE Trans. Nanobiosci. 15, 5 (2016), 418–432.
- Battaglia et al. (2006) G. Battaglia, A. J. Ryan, and S. Tomas. 2006. Polymeric Vesicle Permeability: A Facile Chemical Assay. Langmuir 22, 11 (2006), 4910–4913.
- Brand et al. (2022) L. Brand et al. 2022. Media Modulation based Molecular Communication. submitted to IEEE Trans. Commun. (2022). https://doi.org/10.48550/ARXIV.2203.00722
- Calderó et al. (2000) G. Calderó, M. J. García-Celma, C. Solans, and R. Pons. 2000. Effect of pH on mandelic acid diffusion in water in oil highly concentrated emulsions (gel-emulsions). Langmuir 16, 4 (2000), 1668–1674. https://doi.org/10.1021/la990971w
- Chude-Okonkwo et al. (2019) U. Chude-Okonkwo, R. Malekian, and BT Maharaj. 2019. Advanced Targeted Nanomedicine: A Communication Engineering Solution. Springer, Cham.
- Gaitzsch et al. (2012a) J. Gaitzsch, D. Appelhans, L. Wang, G. Battaglia, and B. Voit. 2012a. Synthetic bio-nanoreactor: Mechanical and chemical control of polymersome membrane permeability. Ang. Chem. 51, 18 (2012), 4448–4451.
- Gaitzsch et al. (2012b) J. Gaitzsch, D. Appelhans, L. Wang, G. Battaglia, and B. Voit. 2012b. Synthetic Bio-nanoreactor: Mechanical and Chemical Control of Polymersome Membrane Permeability - Supporting Information. Ang. Chem. 51, 18 (2012), 4448–4451.
- Gräfe et al. (2014) D. Gräfe, J. Gaitzsch, D. Appelhans, and B. Voit. 2014. Cross-linked polymersomes as nanoreactors for controlled and stabilized single and cascade enzymatic reactions. Nanoscale 6, 18 (2014), 10752–10761. https://doi.org/10.1039/c4nr02155j
- Higham (2008) D. J. Higham. 2008. Modeling and Simulating Chemical Reactions. SIAM Rev. 50, 2 (2008), 347–368. https://doi.org/10.1137/060666457
- Huang et al. (2022) X. Huang, Y. Fang, A. Noel, and N. Yang. 2022. Membrane Fusion-Based Transmitter Design for Static and Diffusive Mobile Molecular Communication Systems. IEEE Trans. Commun. 70, 1 (2022), 132–148.
- Jamali et al. (2019) V. Jamali, A. Ahmadzadeh, W. Wicke, A. Noel, and R. Schober. 2019. Channel Modeling for Diffusive Molecular Communication-A Tutorial Review. Proc. IEEE 107, 7 (2019), 1256–1301. https://doi.org/10.1109/JPROC.2019.2919455
- Lehoux and Mitra (1999) I. E. Lehoux and B. Mitra. 1999. (S)-mandelate Dehydrogenase from Pseudomonas Putida: Mechanistic Studies with Alternate Substrates and pH and Kinetic Isotope Effects. Biochem. 38, 18 (1999), 5836–5848. https://doi.org/10.1021/bi990024m
- Maurice and Bearne (2002) M. St Maurice and S. L. Bearne. 2002. Kinetics and Thermodynamics of Mandelate Racemase Catalysis. Biochem. 41, 12 (2002), 4048–4058.
- Narmandakh and Bearne (2010) Ariun Narmandakh and Stephen L. Bearne. 2010. Purification of Recombinant Mandelate Racemase: Improved Catalytic Activity. Protein Expression and Purification 69, 1 (2010), 39–46. https://doi.org/10.1016/j.pep.2009.06.022
- Noel et al. (2014) A. Noel, K. C. Cheung, and R. Schober. 2014. Improving Receiver Performance of Diffusive Molecular Communication with Enzymes. IEEE Trans. Nanobiosci. 13, 1 (2014), 31–43. https://doi.org/10.1109/TNB.2013.2295546
- Noel et al. (2016) A. Noel, D. Makrakis, and A. Hafid. 2016. Channel Impulse Responses in Diffusive Molecular Communication with Spherical Transmitters. In Proc. CSIT Biennial Symp. Commun.
- Schäfer et al. (2022) M. Schäfer et al. 2022. Channel Responses for the Molecule Release from Spherical Homogeneous Matrix Carriers. accepted for publication in IEEE Trans. Mol. Biol. Multi-Scale Commun. (2022). https://doi.org/10.48550/arXiv.2106.0839
- Schäfer et al. (2021) M. Schäfer, W. Wicke, L. Brand, R. Rabenstein, and R. Schober. 2021. Transfer Function Models for Cylindrical MC Channels with Diffusion and Laminar Flow. IEEE Trans. Mol. Biol. Multi-Scale Commun. 7, 4 (Dec. 2021), 271–287.
- Schäfer et al. (2020) M. Schäfer, W. Wicke, W. Haselmayr, R. Rabenstein, and R. Schober. 2020. Spherical Diffusion Model with Semi-Permeable Boundary: A Transfer Function Approach. In IEEE Int. Conf. Commun. (ICC). 1–7.
- Segel and Slemrod (1989) L. A. Segel and M. Slemrod. 1989. The Quasi-Steady-State Assumption: A Case Study in Perturbation. SIAM Rev. 31, 3 (1989), 446–477.