Superconducting Phases of the Square-Lattice Extended Hubbard Model
Abstract
We study the square-lattice extended Hubbard model with on-site and nearest-neighbor interactions by exact diagonalization. We show that non-equilibrium quench dynamics can help determine the equilibrium phase transition boundaries, which agree with the calculations of fidelity metric, dynamical structure factor, and correlation function. At half filling, the phase diagrams in the strong-coupling regime include spin density wave and -wave superconductivity at large positive , charge density wave (extended -wave superconductivity) at large positive (negative) , and -wave superconductivity at large negative with vanishing . The energies of different particle sectors also help determine the phase separation region. With carrier doping, charge fluctuation result in strong competition between different orders, making it more difficult to identify the leading instability on finite-size cluster. Nevertheless, the more exotic -wave superconducting pairing is found to be enhanced when the system is heavily overdoped by holes, especially in interaction parameter range relevant to the cuprate superconductors.
I Introduction
One of the most intriguing but challenging topics in condensed matter concerns studying correlation effects in many interacting particles. Strongly correlated systems exhibit various symmetry-breaking states, such as superconductivity, which can arise from the interplay of spin, charge, and lattice degrees of freedom [1, 2]. Already in 1950s, the Bardeen–Cooper–Schrieffer theory successfully explained the mechanism of conventional superconductors through phonon-mediated electron pairs [3]. In late 1980s, the discovery of copper-based high-temperature superconductors – later identified with a -wave pairing symmetry [4] – reformed our understanding of correlated materials [5]. Although the ultimate theory for high-temperature superconductivity remains controversial, the strong electron repulsive interactions in copper orbitals are believed to play crucial roles [6, 7, 8]. Unconventional superconductivity also has been explored in other transition-metal oxides. For example, the infinite-layer nickelates share similar electronic structures with the cuprates and become superconducting at 20% hole doping [9]. Moreover, superconductivity in the ruthenates was identified with a triplet -wave pairing [10, 11, 12, 13, 14], although the claim was challenged by recent experiments [15, 16]. In any case, these unconventional superconducting phases are believed to originate from strong electron correlation effects.
The simplest toy model to describe electronic correlation is the single-band Hubbard model with a local on-site interaction . This simple model already can explain the behaviors of Mott insulator, stripe order [17, 18, 19, 20], strange metal [21, 22, 23], and to some extent -wave superconductivity [24, 25, 26, 27]. As a natural extension, more recent studies have considered a non-local Coulomb interaction (denoted as ) in the so-called extended Hubbard model (EHM). A repulsive can induce a charge density wave (CDW), and an attractive was argued to favor spin-triplet superconductivity [28, 29]. Already in 1D systems, a -wave superconducting phase was predicted for repulsive and attractive in EHM [30, 31, 32, 33, 34]. Similar studies have been explored in 2D systems [35, 36, 37, 38, 39, 40], using weak-coupling theory or with approximation in treating interaction effect. To understand and design exotic phases like -wave superconductivity, it is necessary to study EHM in the strong-coupling regime.
Moreover, recent ARPES experiments on 1D cuprate chains have revealed a sizeable attractive Coulomb interaction between nearest-neighbor (NN) electrons [41]. Although not as strong as the on-site Coulomb repulsion, this attractive interaction is comparable to the electron hopping integral, and thereby should not be ignored [42]. The structural similarities among the cuprates also suggest that attractive NN interaction may exist in quasi-2D cuprate materials in general. Since electron-phonon coupling may be its origin, this attractive interaction should be even stronger in a 2D copper-oxide plane, because of the richer phonon modes and stronger impact of ligands. Therefore, studying the 2D EHM could be important for understanding high- pairing mechanism.
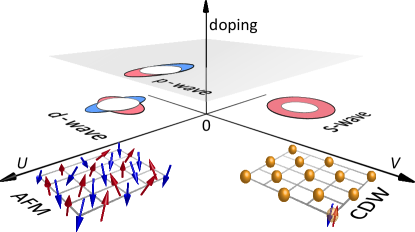
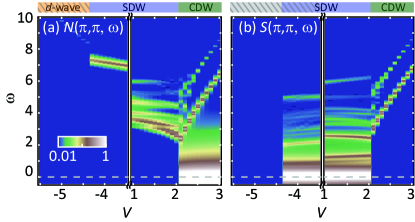
In this paper, we systematically study the phase diagrams of the square-lattice EHM as functions of interaction strengths and doping levels. Studying strong correlation effect is challenging, and most theoretical and computational methods are based on various levels of approximation in handling the interaction. Here we choose to use exact diagonalization (ED), which has the advantage that electron interaction effect can be treated exactly. We employ ED to compute quench dynamics, fidelity metrics, and various correlation functions. While the ED study is restricted to finite-size clusters, we will show that the phase boundaries determined by ED agree with the functional renormalization group (fRG) results in the weak-coupling limit [38], and our approach remains valid in the strong-coupling limit. Figure 1 illustrates the main results of our study. At half filling, spin density wave (SDW) is dominant at positive , and -wave superconductivity is dominant at negative and small . On the other hand, a positive induces a charge density wave (CDW), and a negative can cause phase separation. When the system is heavily overdoped by hole carriers, the more exotic -wave superconducting correlation can be enhanced at large positive and small negative . We also determine the phase separated region by computing the energies of different particle sectors. These results will be relevant to various physical systems such as the cuprates and cold-atoms experiments [43, 44].
II Model and Methods
The extended Hubbard model (EHM) reads
Here, creates an electron with spin (= or ) at lattice site , and is the corresponding fermion number operator. represents a pair of near-neighbor (NN) sites. is the hopping amplitude. and are respectively the on-site and NN interaction strengths; a positive (negative) value corresponds to repulsive (attractive) force. Here, and we explore both positive and negative interactions in the range and . We note that a small, attractive NN Coulomb interaction has been identified in ARPES experiments in doped cuprate chains [41]. While longer-range interactions beyond NN might also be present, their strengths are expected to be weaker and remain to be established experimentally. We solve Eq. (II) using the ED technique, which can treat correlation effects exactly for arbitrary interaction strength. The main challenge of ED is that the Hilbert space size grows exponentially with the lattice size, so the calculations are limited to finite-size clusters. Here, we focus on a square cluster (under periodic boundary condition), which exhibits the proper symmetry for studying the competition between wave and -wave superconductivity. On this site cluster, we study hole doping levels at 0% (half filling with 1 electron per site on average), 12.5%, 25%, 37.5%, and 50% (quarter filling with 0.5 electron per site on average).
The ED algorithm proceeds as follows. We first construct the Hamiltonian matrix using an eigenbasis of the fermion number operator. We then perform matrix diagonalization to obtain the ground state with interaction parameters . Depnding on and the doping level, ground state degeneracy can occur, and these degenerate states have to be considered when computing the expectation values of physical observables. The actual diagonalization is performed using iterative Krylov sub-space methods as implemented in the PETSc [45, 46] and SLEPc [47, 48] libraries. The Krylov-Schur technique is utilized to resolve degenerate eigenstates.
After obtaining the ground state(s) for a Hamiltonian with interactions , we next perform an interaction quench, where the Hamiltonian undergoes a sudden change to with interactions at time . The state at time is obtained by acting the time evolution operator on the state at time :
| (2) |
Here, is the ground state of . The time evolution calculation is again performed using a Krylov method in PETSc, which requires only repeated matrix-vector multiplications to construct the Krylov subspace , without the need to explicitly construct the matrix exponential operator . In our calculations, we typically evolve the system to a final time , with a time step . For selected sets of interaction parameters, we have performed additional calculations with varying time steps to ensure that the numerical error due to a finite time discretization is negligible.
With available, we compute the equal-time correlation functions for different order parameters. In particular, the correlations with the following operators are predominant at half filling:
| (3) | |||||
| (4) | |||||
| (5) | |||||
Here, () is the charge (spin) density operator in momentum space, relevant to a CDW (SDW) phase at ordering vector . and are real-space -wave and -wave pairing operators, respectively. Upon doping, other superconducting instabilities can occur, and we also study the pairing operators for extended -wave (-wave), -wave, and -wave superconductivity:
| (9) |
By symmetry, the value of -wave correlation is identical to that of -wave in our ED calculations. After obtaining for the above order parameters, we Fourier transform the time-domain data to extract the spectral features in frequency space. As shown later, the Fourier spectra are closely related to the equilibrium system’s charge and spin excitation energies, which exhibit distinct behaviors in different broken-symmetry phases.
To extract the charge and spin gaps of the equilibrium system, we also compute the charge and spin dynamical structure factors:
| (10) | |||||
| (11) |
Here, is the equilibrium ground state of with energy , and is a finite spectral broadening chosen to be in this study.
Finally, we also compute the fidelity of quantum state overlap , where is the ground state with interactions , and represents a small deviation from . If ground state degeneracy occurs, the fidelity value can be obtained by a singular value decomposition of the overlap matrix with matrix elements . Here, () is the -th (-th) degenerate ground state for interaction (), and the largest singular value is chosen to represent the fidelity. The fidelity approach is powerful for determining phase transitions in quantum many-body systems [49, 50]. In particular, if and belong to the same broken-symmetry phase, is expected to be equal or close to unity. On the other hand, if and have a distinct nature, will be reduced from unity, which thereby signals a quantum phase transition with a small change in the interaction parameters. Using quench dynamics, spectral gaps, and fidelity metrics, we are able to probe quantum phase transition boundaries using ED with results in agreement with fRG in the weak-coupling limit, and to propose phase diagrams in the strong-coupling regime.
III Results and Discussion
III.1 Weak-Coupling Limit
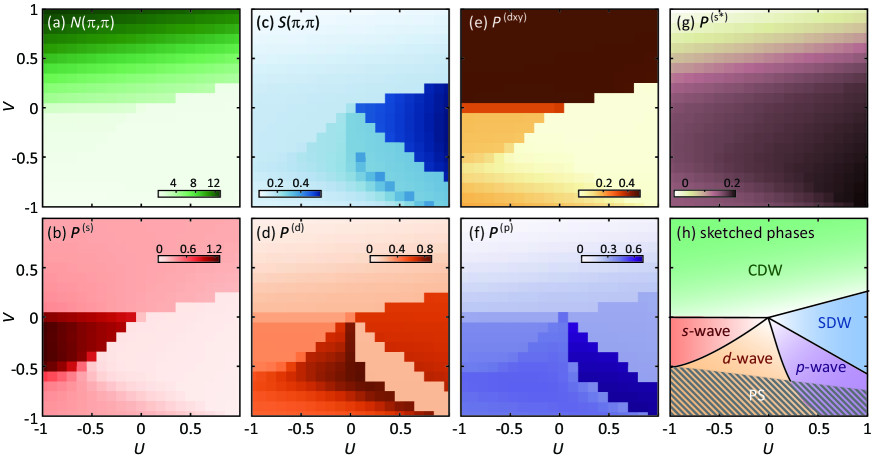
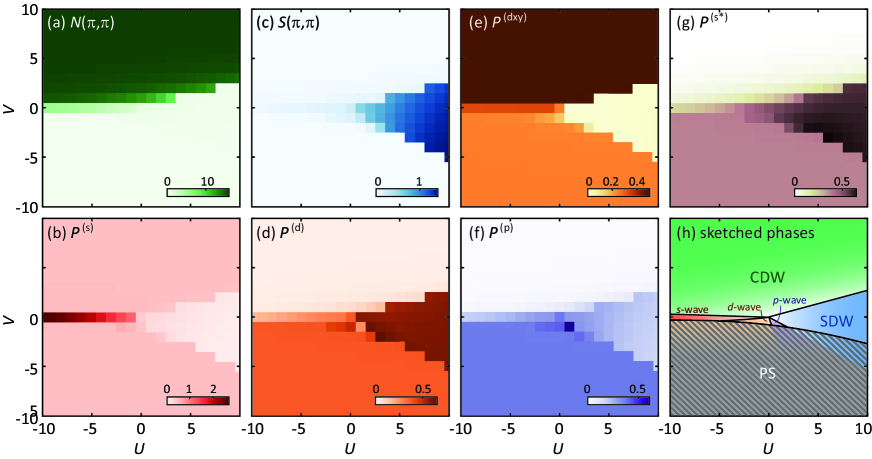
We first focus on a small interaction range and , where we can benchmark ED against fRG [38, 51]. Figure 2 shows equilibrium correlation functions for different order parameters in Eqs. (3)-(9) as functions of interaction strengths . The phase separation (PS) region is determined from the energy difference between different particle sectors (see Appendix). Overall, a positive will stabilize a charge density wave (CDW), as manifested in Fig. 2(a). Moreover, with will further enhance the tendency towards the CDW state. In contrast, a predominant positive is expected to support a spin density wave (SDW), as seen in Fig. 2(c).
The ED results show several salient features for the evolution of superconducting correlations with interactions. In particular, -wave correlation is largely enhanced when and [Fig. 2(b)]. The -wave correlation can increase when and [Fig. 2(d)]. The -wave correlation also can increase when and [Fig. 2(f)]. Other correlations with different pairing symmetries, such as or , also can be suppressed or enhanced depending on the interactions [Fig. 2(e) and (g)]. As discussed later, these more exotic superconductivity pairings may be enhanced at larger interaction strengths or at higher doping levels.
In principle, correlation functions computed on a finite-size cluster cannot determine directly the symmetry breaking phases, as we cannot observe true phase transitions but only cross-over phenomena. Other approaches such as finite-size extrapolation for all orders are needed to determine the leading instability in the thermodynamic limit [52, 53, 27, 54, 55], which for ED is not practical beyond 16-site calculations. In our results, however, it is clear that the regions where correlation functions show apparent enhancement or suppression are already reminiscent of the actual phase boundaries obtained by previous fRG studies [38]. Our weak-coupling phase diagram at half filling is summarized in Fig. 2(h). Compared to fRG [38], our result includes additionally a PS region, and a region with strong -wave superconducting instability, which is also suggested by mean-field theory [39].
To help determine phase boundaries, we first consider equilibrium calculations of the quantum fidelity . Figure 3(a) shows the fidelity calculations along the path at a fixed , with an interaction step . This path is depicted by the arrow line in the figure inset. The fidelity (blue line) exhibits two dips around and 0, and the number of ground state degeneracy (green line) also changes at . We emphasize that our correlation and fidelity calculations are always performed on a “homogeneous state”, instead of a phase-separated one. Our 16-site cluster at a fixed particle sector is too small to show the spatially inhomogeneous PS with both hole-rich and hole-deficient regions. Instead, the PS information is obtained by computing the ground-state energies in different particle sectors (see Appendix). Therefore, although in Fig. 3(a) the fidelity path shows a transition between -wave and -wave superconductivity in the homogeneous state, it is understood that the actual ground state of the system should be phase separated when there is a strong negative . Gray dashed lines are utilized to indicate the PS region in Fig. 3. The same understanding and labeling scheme apply to all the following discussion and figures.
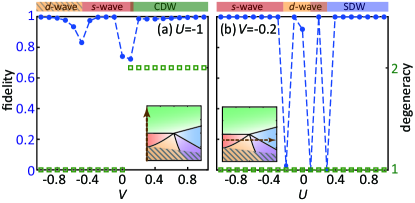
With the above caveat in mind, Fig. 3(a) together with the correlation functions in Fig. 2 suggest that the system starts from PS at , transits to -wave superconductivity around , and enters the CDW state at . Since -wave superconductivity and the CDW phase are expected to be degenerate when and , this explains why our calculations appear to show a broader boundary near .
Figure 3(b) shows the fidelity calculations along the path at a fixed , with an interaction step . The fidelity exhibits three dips around , 0.1, and 0.3, while the ground state remains non-degenerate throughout the whole path (indicated by the arrow line in the figure inset). In accord with our phase diagram in Fig. 2(h), the system starts from the -wave phase at , transits to -wave superconductivity around , and enters the SDW state at . We note that the fidelity calculation and correlation functions in Fig. 2 appear to show additional presence of a -wave state. Since our ground state is a true quantum many-body wavefunction, both leading and sub-leading instabilities may be picked up in the ED calculations. In fact, since and -wave superconductivities have similar mean-field energies when and [39], these different orders may coexist in certain regions of the phase diagram.
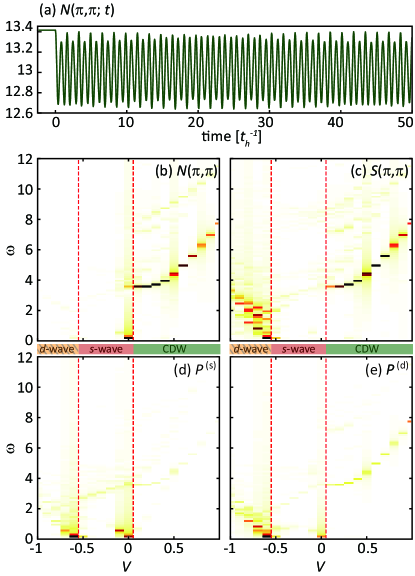
We next discuss using non-equilibrium quench dynamics to determine equilibrium phase boundaries. Unlike the fidelity metric, which is mainly a theoretical tool, quantum quench of interaction can be prepared for example in optical-lattice or ultrafast experiments [56, 57, 58, 59], and the subsequent dynamics can be obtained by measuring correlation functions in time domain. Figure 4(a) shows an example equal-time measurement for charge correlation with ordering [corresponding to the operator in Eq. (3)]. The original equilibrium system at time is the ground state of Hamiltonian with interactions , which supports a CDW. At time , the Hamiltonian is quenched to with interactions . then oscillates in time at . For each quenched calculation, we perform Fourier transformations for different equal-time correlations for the operators in Eqs. (3)-(9), in order to extract the characteristic oscillation frequencies associated with quenched dynamics.
Figures 4(b)-(e) show the resulting Fourier spectra of quenched dynamics for CDW, SDW [for ], -wave, and -wave superconductivity [for ], respectively. The horizontal axis represents the post-quench value of . We follow the same path as depicted in Fig. 3(a) inset: at a fixed , with a quench step of . The Fourier spectra exhibit distinct behaviors depending on the quenched Hamiltonian. In Fig. 4(b), the Fourier spectra of charge correlation show a clear gap for . The gap size rises with increasing , changing from at to at . In Fig. 4(c), the Fourier spectra of spin correlation also show a similar gap for . The spectral intensity of this gap is largely suppressed between . Noticeably, new low-energy modes emerge below . In general, the Fourier spectra of quenched -wave [Fig. 4(d)] and -wave [Fig. 4(e)] superconducting correlations resemble those of charge and spin correlations. We note again that the calculations are performed on a homogeneous state; gray dashed lines in the figure indicate regions where phase separation would occur. Based on the quench behaviors, Figs. 4(b)-(e) can be separated into three regions [indicated by the vertical dashed red lines]: a phase separated state for , -wave superconductivity for , and CDW for . The quench calculations agree well with the fidelity results, demonstrating the applicability of using a novel non-equilibrium approach to probe equilibrium phase transitions.
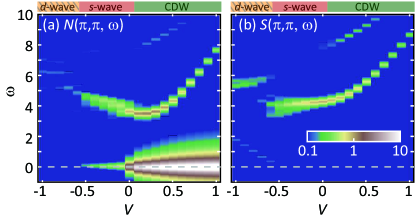
To understand the spectral features of quenched measurements, we compute the charge and spin dynamical structure factors at the ordering vector . Here, in Eqs. (10)-(11) is the equilibrium ground state of (the Hamiltonian with the after-quench interactions). As seen in Fig. 5(a), shows a clear charge gap for , and the gap behaves similarly as that in Fig. 4(b): The gap starts as at and increases with increasing , and it reaches at . For , the system develops CDW order by spontaneously breaking the discrete charge symmetry, so it lacks a low-energy excitation (Goldstone mode). On the other hand, exhibits a strong elastic peak for . This elastic peak in the CDW phase is due to doubly degenerate ground states: one with zero momentum and the other with momentum . As seen in Fig. 5(a), changes its behavior for , where the elastic peak disappears and the charge gap increases with decreasing . The result implies a phase transition near . Another phase boundary near can be inferred from in Fig. 5(b), where a low energy mode emerges below . The above results show that the Fourier spectra of equal-time correlations after quantum quench can track the excitation energies in and . However, while dynamical correlations provide information on the underlying broken-symmetry phase (if there is one), they cannot inform directly how close the ground state is to a phase transition, which instead can potentially be inferred by experiments with varying strengths of quenched interaction to examine whether the system resides in proximity to a phase boundary or in a deeply ordered state.
III.2 Strong-Coupling Regime
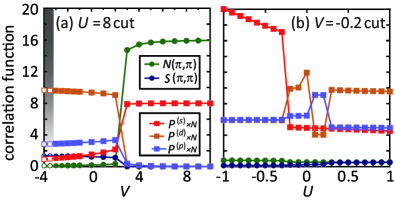
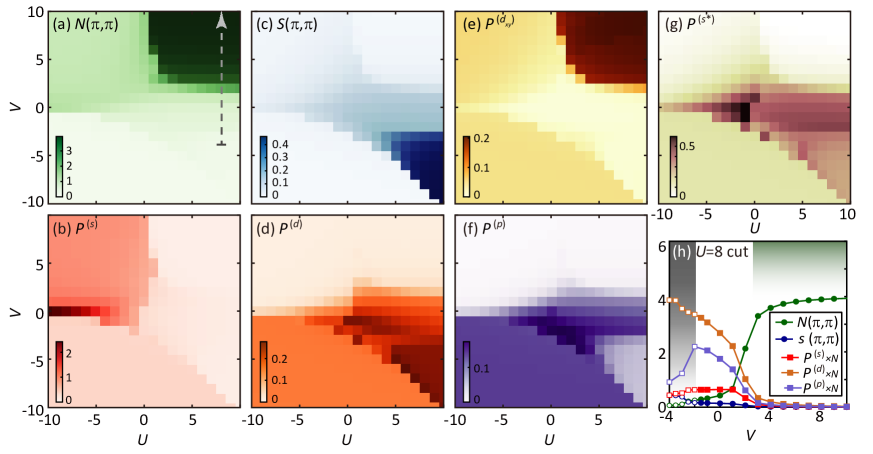
After establishing the abilities of using quantum fidelity and quench dynamics to probe phase boundaries in the weak-coupling limit, we now focus on the strong-coupling regime: and . Figure 6 shows equilibrium correlation functions , which exhibit overall four distinct regions: A positive will favor a CDW [Fig. 6(a)], and together with it will further enhance the CDW state. In contrast, a predominant positive will stabilize a SDW [Fig. 6(c)], and the SDW phase boundary along the -axis is enlarged with increasing . In the atomic limit, on a half-filled -site square lattice, the energy of the CDW state is (since there are doubly occupied sites), while that of the SDW phase is (since there are distinct interaction bonds without double counting). Therefore, the CDW to SDW transition boundary should occur at , which is consistent with our calculations and previous studies [60, 36, 37].
Near and , the system exhibits strong -wave pairing correlations, as indicated by the dark red strip in Fig. 6(b). When , the phase diagram has a substantial region dominated by -wave pairing [Fig. 6(d)]. However, we note that with a predominant negative , the system will tend to be phase separated (into hole-rich and hole-deficient regions) [60], which again can be understood qualitatively using energy consideration in the atomic limit. The actual phase boundary between a homogeneous ground state and a phase-separated one can be quantitatively determined from the total energy calculations in different particle sectors (see Appendix). Based on the above results, we depict the strong-coupling half-filled EHM phase diagram in Fig. 6(h).
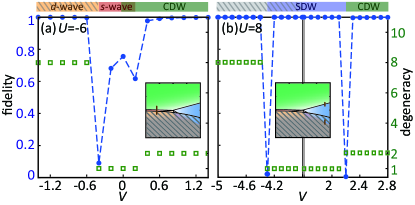
Following the strategy used in the weak-coupling system, we first resort to fidelity calculations to help determine the phases boundaries. For , the ED correlation functions in Fig. 6 suggest that the phase diagram consists of three regions, separated by phase boundaries around . The evolutions of correlation strengths for different order parameters as functions of (with ) and of (with ) are further displayed in Fig. 7. Figure 8(a) shows the fidelity (blue line) and the number of degenerate ground states (green line) along the path at , as depicted in the figure inset. The fidelity deviates from unity between , and the number of ground state degeneracy also changes accordingly. Therefore, based on the correlation function and fidelity results, the system begins as PS at , then transits to the -wave phase at , and reaches the CDW state at . Compared to the case in Fig. 3(a), a more attractive will slightly enlarge the -wave phase boundary along the -axis.
For , the -wave pairing is largely suppressed, and the phase diagram shows three regions consisting of CDW, SDW, and PS. Figure 8(b) shows the fidelity and the number of ground state degeneracy along the path at , as depicted in the figure inset. The fidelity basically remains unity except at the critical values and , where the fidelity drops to almost zero, signaling two phase transition boundaries. Therefore, the system begins as PS at , transits to the SDW phase at , and reaches the CDW state at . Overall, the phase boundaries suggested by fidelity match the regions where correlation functions change more abruptly.
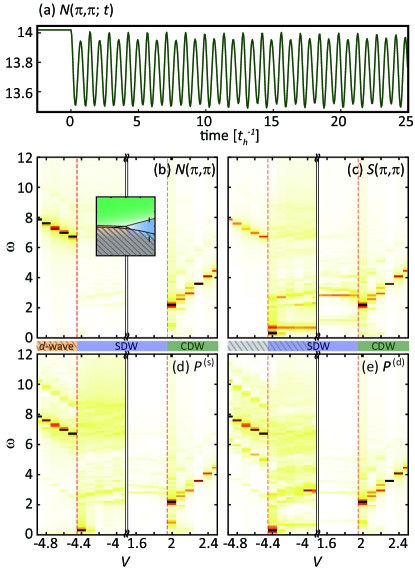
We next discuss the quench dynamics. Figure 9(a) shows the equal-time measurement for charge correlation at . The original system at time is the ground state of Hamiltonian with interactions , which supports a CDW. At time , the Hamiltonian is quenched to with interactions . then oscillates in time at . Figures 9(b)-(e) show the resulting Fourier spectra of quenched dynamics for CDW, SDW, -wave, and -wave superconductivity, respectively. The horizontal axis represents the post-quench value of . Here we follow the same path as depicted in the inset of Fig. 8(b), at a fixed , with a quench step of . As shown in Fig. 9(b), the “charge gap” behaves quite differently below and above . Above , the gap is enhanced by , showing an increasingly more robust CDW phase. Between , the spectra for the correlation in Fig. 9(c) exhibits low-energy excitation (Goldstone mode) of the spontaneous spin symmetry breaking SDW state. We note again that the calculations are performed on a homogeneous state; gray dashed lines in the figure indicate regions where phase separation would occur. Overall, the quench dynamics spectra can track the charge and spin gaps in the dynamical structure factors and shown in Fig. 10.
III.3 Doped Systems
As shown above, the phase boundaries determined by fidelity and quench dynamics agree well with the correlation function calculations. In hole-doped systems, we thereby use mainly the correlation function results with additional fidelity calculations. We note that in doped systems, since the momentum dependence and the competition with electron itinerary become more important, it can become challenging to determine the leading instability on a finite-size cluster. Therefore, instead of specifying the exact phases, we will focus on the trends of different order parameters evolving with the interaction strength. In particular, we concentrate on the heavily overdoped regime with 50% hole doping. In this case, the system exhibits strong -wave superconductivity correlation in the interaction parameter space relevant to the cuprate superconductors [41]. In general, the boundaries of phase transition (or cross-over phenomenon on a finite-size cluster) evolve smoothly from the half-filled phase diagram in Fig. 6 to the 50% hole doped system in Fig. 11. The results for other hole fillings are shown in the Appendix.
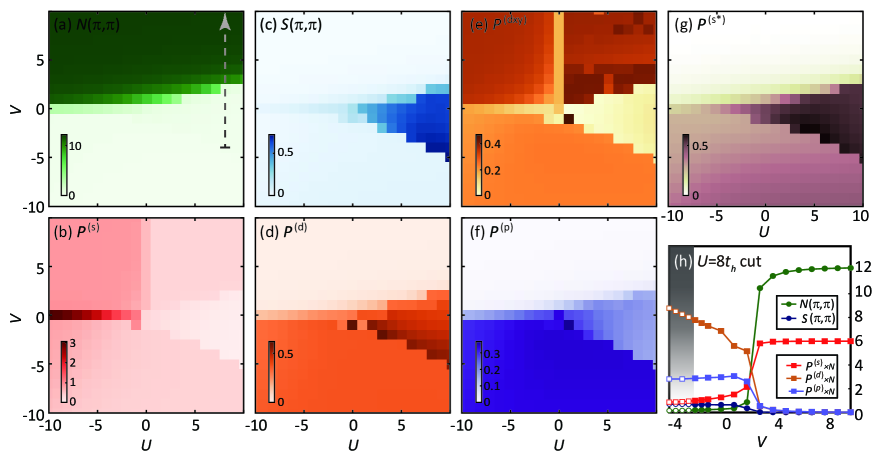
Figure 11 shows the correlation functions for different order parameters computed at 50% hole doping in the strong-coupling regime: and . When , the correlations are dominated by CDW for and -wave superconductivity for . -pairing correlation is also found to be enhanced when and , and it may be the leading instability for a small, positive [36]. When , most of the phase diagram resides in the PS region, especially for . The PS boundary for each doping is determined from the total energy calculations in different particle sectors and is shown in the Appendix. Even if is positive but with (where is negative), the system remains phase-separated. Interestingly, when is positive and dominates over , both -wave and -wave superconducting correlations can be strongly enhanced.
The evolution of the correlation strengths for different order parameters as a function of (at fixed ) is shown in Fig. 11(h). For the parameter set with a negative () relevant to the cuprates, -wave and -wave correlations have comparable strengths. In general, a repulsive will favor an inter-site phase-changing superconducting order parameter (like -wave or -wave pairing), and an attractive can enhance superconducting correlations while suppressing other competing states like CDW [61]. This enhancement of superconductivity by is beyond the impact of a next-nearest-neighbor hopping [27, 61]. An attractive can further favor -wave superconductivity due to enhanced NN triplet states especially near 50% hole doping [34]. In mean-field calculations [39], the two phases could possibly coexist. This is consistent with the dominance of the -wave instability in 1D systems [28, 29, 34], where the -wave competitor is geometrically forbidden. Therefore, it would be interesting to investigate more extensively near this parameter regime both theoretically and experimentally, which may hold the promise of realizing the more exotic -wave superconductivity.
IV Conclusion
We have performed extensive exact diagonalization (ED) calculations to study the extended Hubbard model (EHM) for both attractive and repulsive and values, ranging from weak to strong coupling regimes. We have utilized the correlation functions and fidelity metrics to explore how different superconducting phases and their boundaries evolve with the interaction parameters and doping levels. We also have shown that a more novel, experimentally accessible non-equilibrium quench approach can help determine the phase boundary of the equilibrium system. While our ED studies are limited to finite-size clusters, the resulting phase boundaries agree well with other numerical techniques like functional Renormalization Group [38] in the weak-coupling limit. The ED approach remains valid in the strong-coupling limit, and the results should be reliable at a semi-quantitative level. The quenched dynamics in general cannot be easily and accurately computed by other numerical methods, either. Therefore, our exact treatment of the model in finite-size systems also provide systematic benchmark results for other computational techniques [62, 63] capable of addressing the thermodynamic limit, and an experimental roadmap for exploring different superconducting order parameters.
Our results indicate that the EHM is a potential platform to realize the more exotic -wave superconductivity in the repulsive- and (slightly) attractive- parameter regime, especially when the system is heavily overdoped by hole carriers. This study is timely, since an attractive has recently been identified experimentally in doped 1d cuprate chains [41]. The parameter regime is also where -wave superconductivity shows strong instability in our calculations. In the actual cuprate materials, the and values can behave differently in response to external stimuli, such as strain, pressure, and laser field, so it is likely to induce transitions near a phase boundary to favor certain instability via heterostructure, high pressure, or ultrafast techniques. Studying a possible -wave state in EHM using other computational approaches or experiments can be intriguing and important area for future research.
ACKNOWLEDGMENTS
The authors thank Zecheng Shen for the help in preparing the manuscript. W.C.C. and Y.W. acknowledge support from the National Science Foundation (NSF) award DMR-2132338. C.C.C. acknowledges support from NSF Awards OIA-1738698 and DMR-2142801. The calculations were performed on the Frontera computing system at the Texas Advanced Computing Center. Frontera is made possible by NSF Award OAC-1818253.
References
- Dagotto [1994] E. Dagotto, Correlated Electrons in High-temperature Superconductors, Rev. Mod. Phys. 66, 763 (1994).
- Davis and Lee [2013] J. S. Davis and D.-H. Lee, Concepts Relating Magnetic Interactions, Intertwined Electronic Orders, and Strongly Correlated Superconductivity, Proc. Natl. Acad. Sci. 110, 17623 (2013).
- Bardeen et al. [1957] J. Bardeen, L. N. Cooper, and J. R. Schrieffer, Microscopic Theory of Superconductivity, Phys. Rev. 106, 162 (1957).
- Tsuei and Kirtley [2000] C. Tsuei and J. Kirtley, Pairing Symmetry in Cuprate Superconductors, Rev. Mod. Phys. 72, 969 (2000).
- Bednorz and Müller [1986] J. G. Bednorz and K. A. Müller, Possible High Tc Superconductivity in the Ba-La-Cu-O System, Z. Phys. B Con. Mat. 64, 189 (1986).
- Anderson [1987] P. W. Anderson, The Resonating Valence Bond State in and Superconductivity, Science 235, 1196 (1987).
- Zhang and Rice [1988] F. Zhang and T. Rice, Effective Hamiltonian for the Superconducting Cu Oxides, Phys. Rev. B 37, 3759 (1988).
- Lee et al. [2006] P. A. Lee, N. Nagaosa, and X.-G. Wen, Doping a Mott Insulator: Physics of High-temperature Superconductivity, Rev. Mod. Phys. 78, 17 (2006).
- Li et al. [2019] D. Li, K. Lee, B. Y. Wang, M. Osada, S. Crossley, H. R. Lee, Y. Cui, Y. Hikita, and H. Y. Hwang, Superconductivity in an Infinite-layer Nickelate, Nature 572, 624 (2019).
- Maeno et al. [1994] Y. Maeno, H. Hashimoto, K. Yoshida, S. Nishizaki, T. Fujita, J. Bednorz, and F. Lichtenberg, Superconductivity in a Layered Perovskite Without Copper, Nature 372, 532 (1994).
- Rice and Sigrist [1995] T. Rice and M. Sigrist, : an Electronic Analogue of ?, J. Condens. Matter Phys. 7, L643 (1995).
- Baskaran [1996] G. Baskaran, Why is not a High Tc Superconductor? Electron Correlation, Hund’s Coupling and -wave Instability, Phys. B: Condens 223, 490 (1996).
- Mackenzie and Maeno [2003] A. P. Mackenzie and Y. Maeno, The Superconductivity of and the Physics of Spin-triplet Pairing, Rev. Mod. Phys. 75, 657 (2003).
- Nelson et al. [2004] K. Nelson, Z. Mao, Y. Maeno, and Y. Liu, Odd-parity Superconductivity in , Science 306, 1151 (2004).
- Pustogow et al. [2019] A. Pustogow, Y. Luo, A. Chronister, Y.-S. Su, D. Sokolov, F. Jerzembeck, A. P. Mackenzie, C. W. Hicks, N. Kikugawa, S. Raghu, E. D. Bauer, and S. E. Brown, Constraints on the Superconducting Order Parameter in from Oxygen-17 Nuclear Magnetic Resonance, Nature 574, 72 (2019).
- Ishida et al. [2020] K. Ishida, M. Manago, K. Kinjo, and Y. Maeno, Reduction of the Knight Shift in the Superconducting State and the Heat-up Effect by NMR Pulses on , J. Phys. Soc. Japan 89, 034712 (2020).
- Zheng et al. [2017] B.-X. Zheng, C.-M. Chung, P. Corboz, G. Ehlers, M.-P. Qin, R. M. Noack, H. Shi, S. R. White, S. Zhang, and G. K.-L. Chan, Stripe Order in the Underdoped Region of the Two-dimensional Hubbard Model, Science 358, 1155 (2017).
- Huang et al. [2017] E. W. Huang, C. B. Mendl, S. Liu, S. Johnston, H.-C. Jiang, B. Moritz, and T. P. Devereaux, Numerical Evidence of Fluctuating Stripes in the Normal State of High-Tc Cuprate Superconductors, Science 358, 1161 (2017).
- Huang et al. [2018] E. W. Huang, C. B. Mendl, H.-C. Jiang, B. Moritz, and T. P. Devereaux, Stripe Order from the Perspective of the Hubbard Model, npj Quantum Mater. 3, 22 (2018).
- Ponsioen et al. [2019] B. Ponsioen, S. S. Chung, and P. Corboz, Period 4 Stripe in the Extended Two-dimensional Hubbard Model, Phys. Rev. B 100, 195141 (2019).
- Kokalj [2017] J. Kokalj, Bad-metallic Behavior of Doped Mott Insulators, Phys. Rev. B 95, 041110 (2017).
- Huang et al. [2019] E. W. Huang, R. Sheppard, B. Moritz, and T. P. Devereaux, Strange Metallicity in the Doped Hubbard Model, Science 366, 987 (2019).
- Cha et al. [2020] P. Cha, A. A. Patel, E. Gull, and E.-A. Kim, Slope Invariant T-linear Resistivity from Local Self-energy, Phys. Rev. Res. 2, 033434 (2020).
- Maier et al. [2005] T. A. Maier, M. Jarrell, T. Schulthess, P. Kent, and J. White, Systematic Study of -wave Superconductivity in the 2D Repulsive Hubbard Model, Phys. Rev. Lett. 95, 237001 (2005).
- Zheng and Chan [2016] B.-X. Zheng and G. K.-L. Chan, Ground-state Phase Diagram of the Square Lattice Hubbard Model from Density Matrix Embedding Theory, Phys. Rev. B 93, 035126 (2016).
- Ido et al. [2018] K. Ido, T. Ohgoe, and M. Imada, Competition Among Various Charge-inhomogeneous States and -wave Superconducting State in Hubbard Models on Square Lattices, Phys. Rev. B 97, 045138 (2018).
- Jiang and Devereaux [2019] H.-C. Jiang and T. P. Devereaux, Superconductivity in the Doped Hubbard Model and its Interplay with Next-nearest Hopping , Science 365, 1424 (2019).
- Lin and Hirsch [1986] H. Lin and J. Hirsch, Condensation Transition in the One-dimensional Extended Hubbard Model, Phys. Rev. B 33, 8155 (1986).
- Penc and Mila [1994] K. Penc and F. Mila, Phase Diagram of the One-dimensional Extended Hubbard Model with Attractive and/or Repulsive Interactions at Quarter filling, Phys. Rev. B 49, 9670 (1994).
- Lin et al. [1995] H. Lin, E. Gagliano, D. Campbell, E. Fradkin, and J. Gubernatis, The Phase Diagram of the One-Dimensional Extended Hubbard Model, in The Hubbard Model (Springer, 1995) pp. 315–326.
- Lin et al. [1997] H. Lin, E. Gagliano, and D. Campbell, Phase Separation in the 1-D Extended Hubbard Model, Phys. C: Supercond. 282, 1875 (1997).
- Xiang et al. [2019] Y.-Y. Xiang, X.-J. Liu, Y.-H. Yuan, J. Cao, and C.-M. Tang, Doping Dependence of the Phase Diagram in One-dimensional Extended Hubbard Model: a Functional Renormalization Group Study, J. Condens. Matter Phys. 31, 125601 (2019).
- Shinjo et al. [2019] K. Shinjo, K. Sasaki, S. Hase, S. Sota, S. Ejima, S. Yunoki, and T. Tohyama, Machine Learning Phase Diagram in the Half-filled One-dimensional Extended Hubbard Model, J. Phys. Soc. Japan 88, 065001 (2019).
- Qu et al. [2022] D.-W. Qu, B.-B. Chen, H.-C. Jiang, Y. Wang, and W. Li, Spin-triplet Pairing Induced by Near-neighbor Attraction in the Extended Hubbard Model for Cuprate Chain, Commun. Phys. 5, 257 (2022).
- Wahle et al. [1998] J. Wahle, N. Blümer, J. Schlipf, K. Held, and D. Vollhardt, Microscopic Conditions Favoring Itinerant Ferromagnetism, Phys. Rev. B 58, 12749 (1998).
- Onari et al. [2004] S. Onari, R. Arita, K. Kuroki, and H. Aoki, Phase Diagram of the Two-dimensional Extended Hubbard Model: Phase Transitions Between Different Pairing Symmetries When Charge and Spin Fluctuations Coexist, Phys. Rev. B 70, 094523 (2004).
- Aichhorn et al. [2004] M. Aichhorn, H. G. Evertz, W. von der Linden, and M. Potthoff, Charge Ordering in Extended Hubbard Models: Variational Cluster Approach, Phys. Rev. B 70, 235107 (2004).
- Huang et al. [2013] W.-M. Huang, C.-Y. Lai, C. Shi, and S.-W. Tsai, Unconventional Superconducting Phases for the Two-dimensional Extended Hubbard Model on a Square Lattice, Phys. Rev. B 88, 054504 (2013).
- Nayak and Kumar [2018] S. Nayak and S. Kumar, Exotic Superconducting States in the Extended Attractive Hubbard Model, J. Condens. Matter Phys. 30, 135601 (2018).
- van Loon and Katsnelson [2018] E. van Loon and M. Katsnelson, The Extended Hubbard Model with Attractive Interactions, J. Phys. Conf. Ser. 1136, 012006 (2018).
- Chen et al. [2021] Z. Chen, Y. Wang, S. N. Rebec, T. Jia, M. Hashimoto, D. Lu, B. Moritz, R. G. Moore, T. Devereaux, and Z.-X. Shen, Anomalously Strong Near-Neighbor Attraction in Doped 1D Cuprate Chains, Science 373, 1235 (2021).
- Li and Johnston [2022] S. Li and S. Johnston, Suppressed Superexchange Interactions in the Cuprates by Bond-stretching Oxygen Phonons, arXiv:2205.12678 (2022).
- Mazurenko et al. [2017] A. Mazurenko, C. S. Chiu, G. Ji, M. F. Parsons, M. Kanász-Nagy, R. Schmidt, F. Grusdt, E. Demler, D. Greif, and M. Greiner, A Cold-atom Fermi-Hubbard Antiferromagnet, Nature 545, 462 (2017).
- Bohrdt et al. [2021] A. Bohrdt, L. Homeier, C. Reinmoser, E. Demler, and F. Grusdt, Exploration of Doped Quantum Magnets with Ultracold Atoms, Ann. Phys. 435, 168651 (2021).
- Balay et al. [2019] S. Balay, S. Abhyankar, M. F. Adams, J. Brown, P. Brune, K. Buschelman, L. Dalcin, A. Dener, V. Eijkhout, W. D. Gropp, D. Karpeyev, D. Kaushik, M. G. Knepley, D. A. May, L. C. McInnes, R. T. Mills, T. Munson, K. Rupp, P. Sanan, B. F. Smith, S. Zampini, H. Zhang, and H. Zhang, PETSc Web page, https://www.mcs.anl.gov/petsc (2019).
- Balay et al. [1997] S. Balay, W. D. Gropp, L. C. McInnes, and B. F. Smith, Efficient Management of Parallelism in Object Oriented Numerical Software Libraries, in Modern Software Tools in Scientific Computing, edited by E. Arge, A. M. Bruaset, and H. P. Langtangen (Birkhäuser Press, 1997) pp. 163–202.
- Hernandez et al. [2003] V. Hernandez, J. E. Roman, and V. Vidal, SLEPc: Scalable Library for Eigenvalue Problem Computations, Lect. Notes Comput. Sci. 2565, 377 (2003).
- Hernandez et al. [2005] V. Hernandez, J. E. Roman, and V. Vidal, SLEPc: A Scalable and Flexible Toolkit for the Solution of Eigenvalue Problems, ACM Trans. Math. Softw. 31, 351 (2005).
- Gu [2010] S.-J. Gu, Fidelity Approach to Quantum Phase Transitions, Int. J. Mod. Phys. B 24, 4371 (2010).
- Jia et al. [2011] C. Jia, B. Moritz, C.-C. Chen, B. S. Shastry, and T. Devereaux, Fidelity Study of the Superconducting Phase Diagram in the Two-dimensional Single-band Hubbard Model, Phys. Rev. B 84, 125113 (2011).
- Metzner et al. [2012] W. Metzner, M. Salmhofer, C. Honerkamp, V. Meden, and K. Schönhammer, Functional Renormalization Group Approach to Correlated Fermion Systems, Rev. Mod. Phys. 84, 299 (2012).
- Ying et al. [2014] T. Ying, R. Mondaini, X. Sun, T. Paiva, R. Fye, and R. Scalettar, Determinant Quantum Monte Carlo Study of -wave Pairing in the Plaquette Hubbard Hamiltonian, Phys. Rev. B 90, 075121 (2014).
- Terletska et al. [2017] H. Terletska, T. Chen, and E. Gull, Charge Ordering and Correlation Effects in the Extended Hubbard Model, Phys. Rev. B 95, 115149 (2017).
- Chung et al. [2020] C.-M. Chung, M. Qin, S. Zhang, U. Schollwöck, and S. R. White, Plaquette Versus Ordinary -wave Pairing in the -Hubbard Model on a Width-4 Cylinder, Phys. Rev. B 102, 041106 (2020).
- Jiang and Kivelson [2022] H.-C. Jiang and S. A. Kivelson, Stripe Order Enhanced Superconductivity in the Hubbard Model, Proc. Natl. Acad. Sci. 119 (2022).
- Meinert et al. [2014] F. Meinert, M. J. Mark, E. Kirilov, K. Lauber, P. Weinmann, M. Gröbner, A. J. Daley, and H.-C. Nägerl, Observation of Many-body Dynamics in Long-range Tunneling after a Quantum Quench, Science 344, 1259 (2014).
- Will et al. [2015] S. Will, D. Iyer, and M. Rigol, Observation of Coherent Quench Dynamics in a Metallic Many-body State of Fermionic Atoms, Nature Commum. 6, 1 (2015).
- Guardado-Sanchez et al. [2018] E. Guardado-Sanchez, P. T. Brown, D. Mitra, T. Devakul, D. A. Huse, P. Schauß, and W. S. Bakr, Probing the Quench Dynamics of Antiferromagnetic Correlations in a 2D Quantum Ising Spin System, Phys. Rev. X 8, 021069 (2018).
- Guardado-Sanchez et al. [2021] E. Guardado-Sanchez, B. M. Spar, P. Schauss, R. Belyansky, J. T. Young, P. Bienias, A. V. Gorshkov, T. Iadecola, and W. S. Bakr, Quench Dynamics of a Fermi Gas with Strong Nonlocal Interactions, Phys. Rev. X 11, 021036 (2021).
- Dagotto et al. [1994] E. Dagotto, J. Riera, Y. Chen, A. Moreo, A. Nazarenko, F. Alcaraz, and F. Ortolani, Superconductivity Near Phase Separation in Models of Correlated Electrons, Phys. Rev. B 49, 3548 (1994).
- Peng et al. [2023] C. Peng, Y. Wang, J. Wen, Y. S. Lee, T. P. Devereaux, and H.-C. Jiang, Enhanced Superconductivity by Near-neighbor Attraction in the Doped Extended Hubbard Model, Phys. Rev. B 107, L201102 (2023).
- Linnér et al. [2023] E. Linnér, C. Dutreix, S. Biermann, and E. Stepanov, Coexistence of -wave Superconductivity and Phase Separation in the Half-Filled Extended Hubbard Model with Attractive Interactions, arXiv preprint arXiv:2301.10755 (2023).
- Jiang et al. [2023] S. Jiang, D. J. Scalapino, and S. R. White, A Single-band Model with Enhanced Pairing from DMRG-based Downfolding of the Three-band Hubbard Model, arXiv preprint arXiv:2303.00756 (2023).
APPENDIX
Appendix A Phase Separation Region
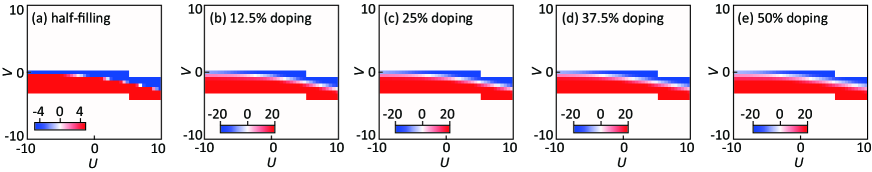
Our exact diagonalization calculations are performed on a square-lattice -site cluster, with a fixed particle sector at a given filling. The cluster size is too small to observe directly the inhomogeneous sparation of hole-rich and hole-deficient regions. Instead, the PS information for a given set of interaction parameters can be obtained by computing the total energies in different particle sectors. For example, at the filling with electrons on an -site cluster, the energy difference is computed:
| (12) |
Here, is the energy of the homogeneous ground state with electron occupation number ; and are respectively the energies of the hole-rich and hole-deficient states on an -site cluster. Figure 12 shows the false-color intensity plots as functions of for different hole-doped systems. A sign change (from negative to positive) in would signal transition to a phase-separated state, which helps determine the phase boundary of the PS region.
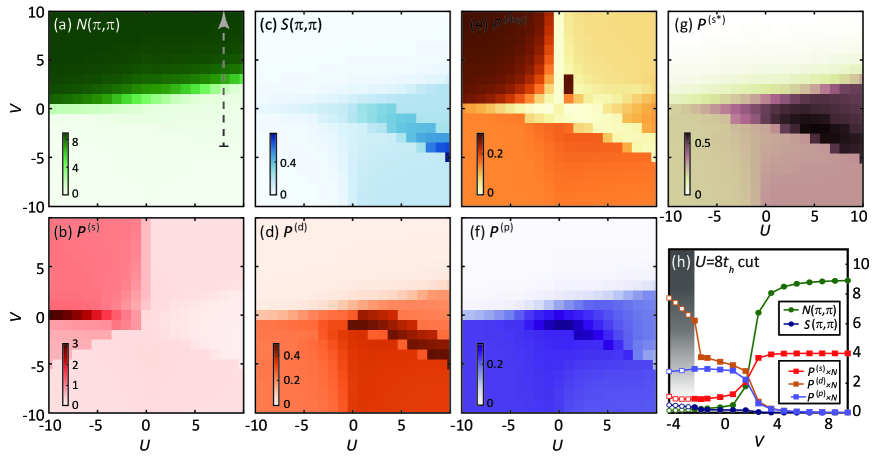
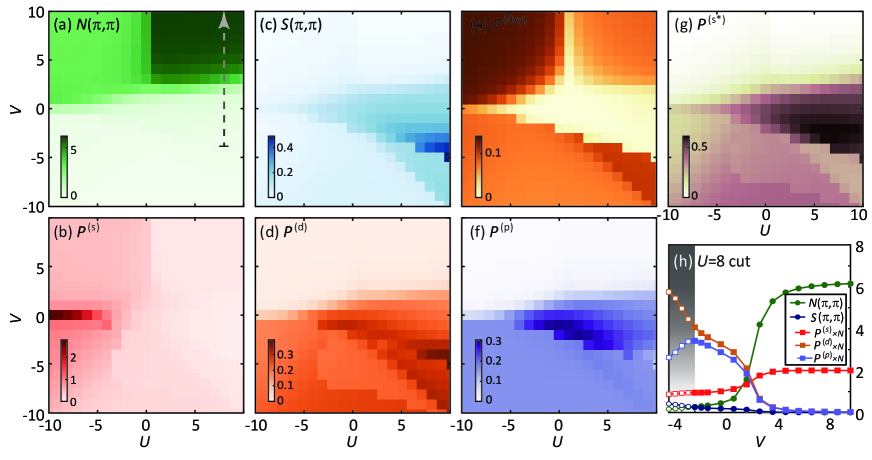
Appendix B Correlation Functions at Other Doping Levels
The correlation functions for different order parameters computed in the strong-coupling regime ( and ) for 12.5%, 25%, and 37.5% hole-doped systems are shown in Figs. 13, 14, and 15, respectively. As discussed above, the PS region for each doping is determined from the energy difference calculation in different particle sectors and is indicated by gray shade in panel (h) of the figure.