| Theoretical study of the stability of the tetradymite-like phases of Sb2S3, Bi2S3, and Sb2Se3 | |
| E. Lora da Silva,∗a J. M. Skelton,b P. Rodríguez-Hernández, c A. Muñoz, c M. C. Santos, d,e D. Martínez-García, f R. Vilaplana, g and F. J. Manjón e | |
| We report a comparative theoretical study of the Pnma and R-3m phases of Sb2S3, Bi2S3, and Sb2Se3 close to ambient pressure. Our enthalpy calculations at 0 K show that at ambient pressure the R-3m (tetradymite-like) phase of Sb2Se3 is energetically more stable than the Pnma phase, contrary to what is observed for Sb2S3 and Bi2S3, and irrespective of the exchange-correlation functional employed in the calculations. The result for Sb2Se3 is in contradiction to experiments where all three compounds are usually grown in the Pnma phase. This result is further confirmed by free-energy calculations taking into account the temperature dependence of the unit-cell volumes and phonon frequencies. Lattice dynamics and elastic tensor calculations further show that both Pnma and R-3m phases of Sb2Se3 are dynamically and mechanically stable at zero applied pressure. Since these results suggest that the formation of the R-3m phase for Sb2Se3 should be feasible at close to ambient conditions, we provide a theoretical crystal structure and simulated Raman and infrared spectra to help in its identification. We also discuss the results of the two published works that have claimed to have synthesized tetradymite-like Sb2Se3. Finally, the stability of the R-3m phase across the three group-15 A2X3 sesquichalcogenides is analysed based on their van der Waals gap and X-X in-plane geometry. |
1 Introduction
Since the identification of the trigonal tetradymite-like R-3m phases of group-15 sesquichalcogenides (i.e. Sb2Te3, Bi2Se3, Bi2Te3; 1) as 3D topological insulators,1, 2 the family of A2X3 sesquichalcogenides has attracted a great deal of attention from the scientific community. Three-dimensional topological insulators represent a new class of matter, with insulating bulk electronic states and topologically-protected metallic surface states arising from time-reversal symmetry and strong spin-orbit coupling. These properties make them of potential interest for spintronics and quantum computing applications.3 Due to this fundamental interest and potential applications, the identification of new topological insulators and materials with superconducting properties is currently an important research area in condensed matter science.
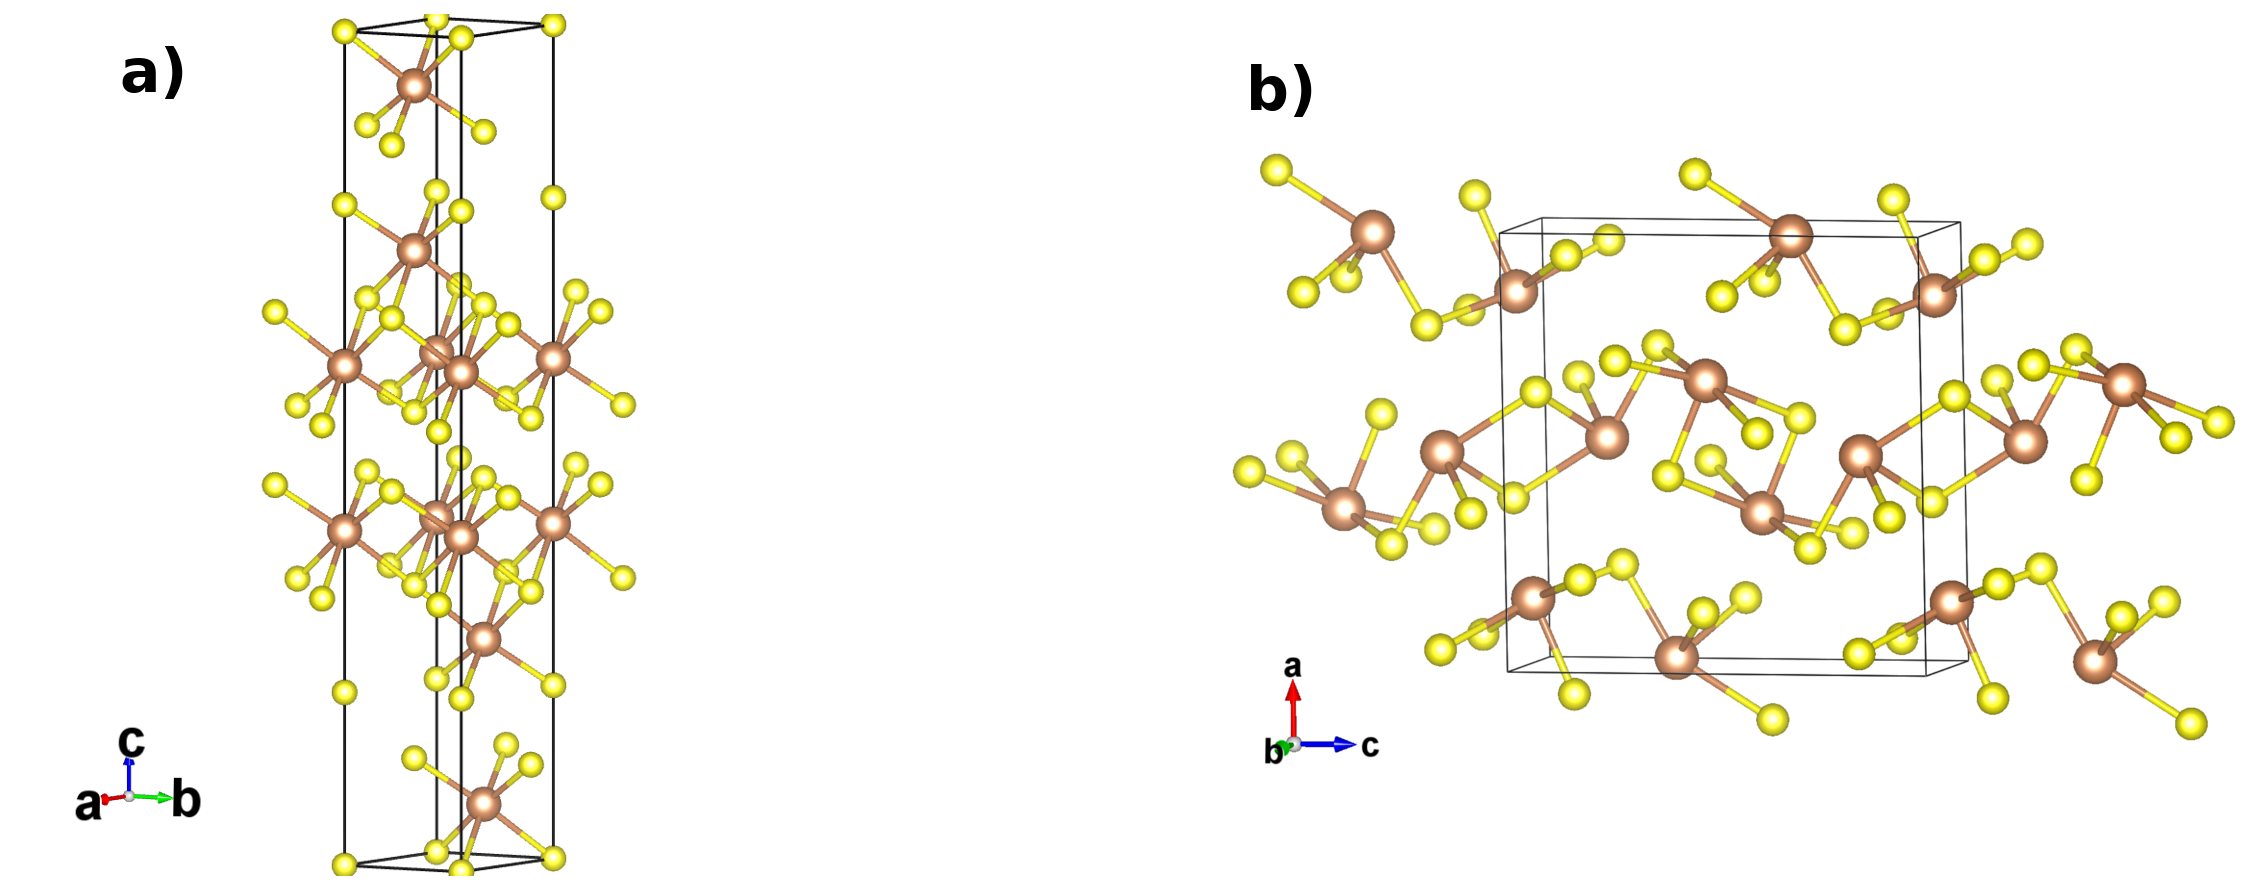
The stibnite (Sb2S3), bismuthinite (Bi2S3), and antimonselite (Sb2Se3) minerals are also group-15 sesquichalcogenides but do not crystallize in the tetradymite-like R-3m structure under ambient conditions but instead adopt the orthorhombic U2S3-type Pnma structure (Fig. 1.b). Sb2S3, Bi2S3, and Sb2Se3 are semiconductors with band-gap widths of 1.7, 1.3, and 1.2 eV respectively.4, 5 These materials are used in a wide range of technological applications including photovoltaics (solar cells), X-ray computed tomography detectors, fuel cells, gas sensors, and for detection of biomolecules.6, 7, 8, 9, 10, 11, 12 Additionally, Sb2Se3 has recently found a number of other applications including in solid-state batteries, fiber lasers, and photoelectrochemical devices.13, 14, 15, 16
Since several phases, including the Pnma phase, have been synthesized for Bi2Se3, which usually crystallizes in the tetradymite-like R-3m structure,17, 18, 19, 20 it is natural to wonder whether the R-3m structure could be adopted by other sesquichalcogenides that generally adopt the U2S3-type structure, viz. Sb2S3, Bi2S3, and in particular Sb2Se3. In fact, several theoretical studies have been performed over the years to investigate the properties of the hypothetical tetradymite-like Sb2Se3 structure. Some of these works have suggested that this phase should undergo a topological quantum phase transition under compression,21, 22 while one found that tetradymite-like Sb2Se3 is dynamically stable and is a topological insulator at ambient pressure.23 Interestingly enough, the R-3m phase of group-15 sesquichalcogenides is characterized by a unique type of bonding termed "metavalent bonding" that not only underpins the topological properties but also makes these materials useful for phase-change memories, as highly efficient thermoelectrics, and for photonic devices.24
In 2013 an experimental study claimed to have observed the R-3m phase of Sb2Se3, with a topological transition occurring at 2 GPa,25 but the tetradymite-like structure of Sb2Se3 was not confirmed beyond doubt. On the other hand, a comparative experimental and theoretical study of the three U2S3-type sesquichalcogenides suggested the Pnma structure to be stable up to 50 GPa.26 This is supported by several experimental high-pressure studies on Sb2Se3 in which the Pnma structure was found to be stable up to 50 GPa and above.27, 28 However, one study observed a pressure-induced isostructural phase transition at 12 GPa and a further transition to a disordered Im-3m structure above 50 GPa, followed by a pressure-induced amorphization on releasing the pressure.29 Despite the apparent stability of the Pnma phase, experimental high-pressure studies have also found that Pnma-type Sb2Se3 becomes a topological superconductor at 2.5 K and around 10 GPa,30 exhibiting highly-conducting spin-polarized surface states similar to those observed for Bi2Se3.31 Furthermore, a recent study has claimed to have synthesized the R-3m structure of Sb2Se3 by atomic layer epitaxy on a buffer layer of Bi2Se3.32 We can therefore conclude that while the bulk of the experimental evidence suggests the R-3m phase of Sb2Se3 is not observed at high pressure, it is not conclusive whether this phase could potentially be formed under favourable synthesis conditions.
In the light of the above studies, it is interesting to compare the stabilities of the Pnma and R-3m structural phases of the the three U2S3-type sesquichalcogenides at close to ambient conditions, and to confirm whether or not the R-3m phase could be synthetically accessible. In this work, we report a set of systematic density-functional theory (DFT) calculations on the Pnma and R-3m phases of the three U2S3-type sesquichalcogenides under ambient conditions and at pressures of up to 10 GPa. We show that the Pnma phase of Sb2S3 and Bi2S3 is energetically more stable than the R-3m phase over this pressure range, but that, unexpectedly, the R-3m phase of Sb2Se3 is predicted by several exchange-correlation (xc) functionals to be more stable than the Pnma phase close to ambient conditions. To aid in future experimental efforts to prepare the R-3m phase of Sb2Se3, we also confirm its dynamical and mechanical stability and provide a theoretical structure and vibrational spectra to support its identification. Finally, we also discuss the only two works that, to our knowledge, have claimed to have prepared the tetradymite-like phase of Sb2Se3 at close to ambient conditions.
2 Methods
The structural properties of the different crystalline phases of Sb2S3, Bi2S3, and Sb2Se3 were calculated within the framework of pseudopotential plane-wave density-functional theory.33 The Vienna Ab-initio Simulation Package (VASP) code 34 was employed to perform simulations. The revised Perdew-Burke-Ernzerhof generalized-gradient approximation (GGA) functional for solids (PBEsol) 35, 36 was used for all calculations. Additional calculations were also performed with the local-density approximation (LDA)37 functional and the dispersion-corrected PBE-D2 38 functional to examine the effect of the xc functional on the results. Projector augmented-wave (PAW) pseudopotentials including six valence electrons for S[3s23p4] and Se[4s24p4] and fifteen valence electrons for Sb[4d105s25p3] and Bi[5d106s26p3] were used to model the ion cores. Convergence of the total energy was achieved with a plane-wave kinetic-energy cut-off of 600 eV. The Brillouin-zone (BZ) was sampled with -centered Monkhorst-Pack 39 grids with appropriate subdivisions for the different structural phases of the three compounds, viz.: Pnma - 6 10 6 and R-3m - 12 12 12.
Structural relaxations were performed by allowing the atomic positions and the unit-cell parameters to optimise at a series of different volumes in order to confirm the stability of both the Pnma and R-3m phases in a pressure range from 0-10 GPa. At each volume we obtain the (isotropic) external pressure for the applied compression and the corresponding structural parameters. The pressure-volume (-) curves for each of the compounds were fitted to a third-order Birch-Murnaghan equation of state 40, 41 to obtain the equilibrium volume, the bulk modulus, and its pressure derivative. The enthalpy as a function of volume were computed using the relation , where is the total electronic energy of the system, is pressure, and is the volume. Comparison of the curves of the different polymorphs can provide insight into the relative thermodynamic stabilities over the studied pressure range.
Lattice-dynamics calculations were performed on the Pnma and R-3m phases of Sb2Se3 at a series of cell volumes corresponding to different applied pressures. The phonon frequencies were computed by using the supercell finite-displacement method implemented in the Phonopy package 42 with VASP as the force calculator. 43 Supercell expansions of 2 4 2 for the Pnma phase and 2 2 2 for the R-3m phases were used to enable the exact calculation of frequencies at the zone center () and unique zone-boundary wavevectors, which were interpolated to obtain phonon-dispersion curves together with density of states curves on uniform 50 50 50 -centered q-point meshes.
Infrared (IR) and Raman spectra were calculated for the ground-state R-3m phase of Sb2Se3 using the methods described in Ref. 44 and implemented in the Phonopy-Spectroscopy package.45 The spectral linewidths were obtained by computing the third-order force constants, of a 2 2 2 expansion of the primitive-cell, and following the many-body perturbative approach described in detail in Refs. 44 and 46 and implemented in the Phono3py software.46
Elastic tensors were computed to assess the mechanical stability of the Pnma and R-3m phases of Sb2Se3 at zero pressure, by employing the central-difference method where the unique components of the elastic tensor are determined by performing six finite distortions of the lattice and deriving the tensor elements from the strain-stress relationship.47 For these calculations, it was necessary to increase the plane-wave energy cutoff to converge the stress tensor, which was achieved by systematically increasing the plane-wave cutoff up to 950 eV. We then employed the ELATE software 48 to analyze the linear compressibility using the computed stress tensors.
3 Results and Discussion
3.1 Structural properties of the Pnma phase
In order to verify the accuracy of our theoretical calculations as a prior step before attempting to study of the potential R-3m phases of Sb2S3, Bi2S3 and Sb2Se3, we first calculated the equilibrium lattice parameters, bulk moduli and pressure derivatives of the Pnma phases and compared them to other experimental and theoretical studies in the literature (Tab. 1).
| Sb2Se3 | Sb2S3 | Bi2S3 | ||||
| a0 (Å) | 11.75a | 11.24a | 11.19a | |||
| Theo. | Exp. | Theo. | Exp. | Theo. | Exp. | |
| 11.80b | 11.80f | 11.27b | 11.30b,j,k | 11.41b | 11.27p | |
| 11.52c | 11.79g | 11.02c | 11.31l,m | 11.00n | 11.33q | |
| 11.91d | 11.30h | 11.58o | ||||
| 11.53e | 11.08i | |||||
| b0 (Å) | 3.98a | 3.83a | 3.96a | |||
| Theo. | Exp. | Theo. | Exp. | Theo. | Exp. | |
| 3.99b | 3.98f | 3.81c | 3.84b,j,k | 3.97b | 3.97p | |
| 3.96c,e | 3.99g | 3.84h | 3.84l,m | 3.94n | 3.98q | |
| 3.98d | 3.83b,i | 3.99o | ||||
| c0 (Å) | 11.30a | 10.91a | 10.94a | |||
| Theo. | Exp. | Theo. | Exp. | Theo. | Exp. | |
| 11.28b | 11.65f,g | 10.89b | 11.23b,j,l,m | 11.01b | 11.13p | |
| 11.22c,e | 10.79c | 11.24k | 10.83n | 11.18q | ||
| 11.70d | 11.22h | 11.05o | ||||
| 10.81i | ||||||
| V0 (Å3) | 528.11a | 469.6a | 484.4a | |||
| Theo. | Exp. | Theo. | Exp. | Theo. | Exp. | |
| 531.1b | 547.1f | 470.4b | 486.0b | 498.3b | 498.4p | |
| 511.8c | 547.5g | 453.0c | 487.7i,m,j | 469.1n | 501.6q | |
| 598.1r | 552.5s | 529.9r | 488.2k | 510.1o | ||
| 511.6q | ||||||
| B0 (GPa) | 31.1a | 31.5a | 42.3a | |||
| Theo. | Exp. | Theo. | Exp. | Theo. | Exp. | |
| 70.5c | 30.0f | 32.2b | 37.6b | 83.6n | 36.6p | |
| 32.7s | 80.3c | 26.9j | 32.3o | 38.9q | ||
| 27.2k | 36.5q | 37.5u | ||||
| 41.4t | ||||||
| B | 6.6a | 6.6a | 6.8a | |||
| Theo. | Exp. | Theo. | Exp. | Theo. | Exp. | |
| 6.1f | 6.2b | 3.8b | 5.9q | 6.4p | ||
| 5.6s | 7.9j | 6.4o | 5.5q | |||
| 6.0k | 4.6u | |||||
| 7.8t | ||||||
This work, 22footnotemark: 2Ref. 26, 33footnotemark: 3Ref. 49, 44footnotemark: 4Ref. 50, 55footnotemark: 5Ref. 51, 66footnotemark: 6Ref. 27, 77footnotemark: 7Ref. 52, 88footnotemark: 8Ref. 53, 99footnotemark: 9Ref. 54, 1010footnotemark: 10Ref. 55, 1111footnotemark: 11Ref. 56, 1212footnotemark: 12Ref. 57, 1313footnotemark: 13Ref. 58, 1414footnotemark: 14Ref. 59, 1515footnotemark: 15Ref. 60, 1616footnotemark: 16Ref. 61, 1717footnotemark: 17Ref. 62, 1818footnotemark: 18Ref. 63, 1919footnotemark: 19Ref. 30, 2020footnotemark: 20Ref. 64, 2121footnotemark: 21Ref. 65
The Pnma phase of the A2X3 sesquichalcogenides comprises layers stacked by weak interactions along the -axis, the description of which is challenging for conventional DFT functionals.63, 51, 26
The calculated lattice parameters of Sb2Se3 (a0 = 11.75 Å, b0 = 3.98 Å and c0 = 11.30 Å) are in good agreement with the experimental measurements in Refs. 27 and 52 (a0 = 11.80 Å, b0 = 3.97 Å, c0 = 11.65 Å and a0=11.79 Å, b0 = 33.98 Å and c0 = 11.65 Å, respectively), and also with other ab initio calculations. 26, 49, 50, 51 The most notable deviation of our calculated values from experimental measurements is a 3% reduction of the c0 parameter, which unsurprisingly leads to an underestimation of the V0 of 3-4% compared to experiment. Our results are comparable to the theoretical results in Ref. 26, where calculations were also carried out using PAW pseudopotentials and the PBEsol functional. The c0 of 11.70 Å quoted in Ref. 50 is much larger than the present results but closer to experiments, while the a0 parameter has a larger error compared to experiments. We attribute this to the use of the PBE functional in this study, which has a tendency to overestimate volumes and has been shown to do so by 10% for the antimony chalcogenides. 63). On the other hand, the LDA tends to underestimate volumes, as can be seen in the lattice parameters quoted in Refs. 51, 49 and 59. Interestingly, the difference in the -axis lengths between the theoretical and experimental studies are very small, which we attribute to the fact that this crystallographic direction corresponds to covalently-bonded chains of atoms.
Our calculated lattice parameters for the Pnma phase of Sb2S3 show similar trends to those for Sb2Se3. As shown on Tab. 1, the calculated parameters agree well with experimental measurements 26, 55 and other theoretical results.26, 49, 53, 54 We note, however, and as for Sb2Se3 the lattice parameters obtained from LDA calculations tend to underestimate compared to experiments, resulting in discrepancies with the a0 quoted in Refs. 49 and 54, although the parameter is closer to our PBEsol results than the PBE values quoted in Ref. 53, which actually show better agreement with experimental results.26, 55
Our results obtained for Bi2S3 are also consistent with experimental measurements and other theoretical studies in the literature. We note that calculations performed on Bi2S3 using the Armiento and Mattsson 2005 parametrized GGA functional (AM05)66, 67, 68 seem to show a slightly better reproduction of c0 parameter compared to experiments.26
The calculated B0 and B obtained by fitting the - curves of Sb2Se3 to a third-order Birch-Murnaghan equation are B0 = 31.1 GPa (B = 6.6), which is close to the experimental value of B0 = 30 GPa (B = 6.1) from Ref. 27 and B0 = 32.7 GPa (B = 5.6) from Ref. 60. For Sb2S3, we obtained B0 = 31.5 GPa (B = 6.6), which is within the range of experimental values 26, 55, 56, 64 and consistent with the PAW/PBEsol calculations in Ref. 26. These results are also close to those experimentally measured for the As-doped stibnite mineral.69 Finally, our values of B0 = 42.3 GPa (B = 6.8) for Bi2S3 are again consistent with other DFT calculations 60, 62 and the experimental values reported in Refs. 61, 62 and 65.
3.2 Energetic Stability of the Pnma and R-3m phases at 0 K and up to 10 GPa
Since our calculations on the Pnma phases were found to be in good agreement with experimental and theoretical studies, we proceeded to carry out a theoretical study of the potential R-3m phases of Sb2S3, Bi2S3, and Sb2Se3 to probe whether this phase could be energetically competitive from ambient pressure up to 10 GPa.
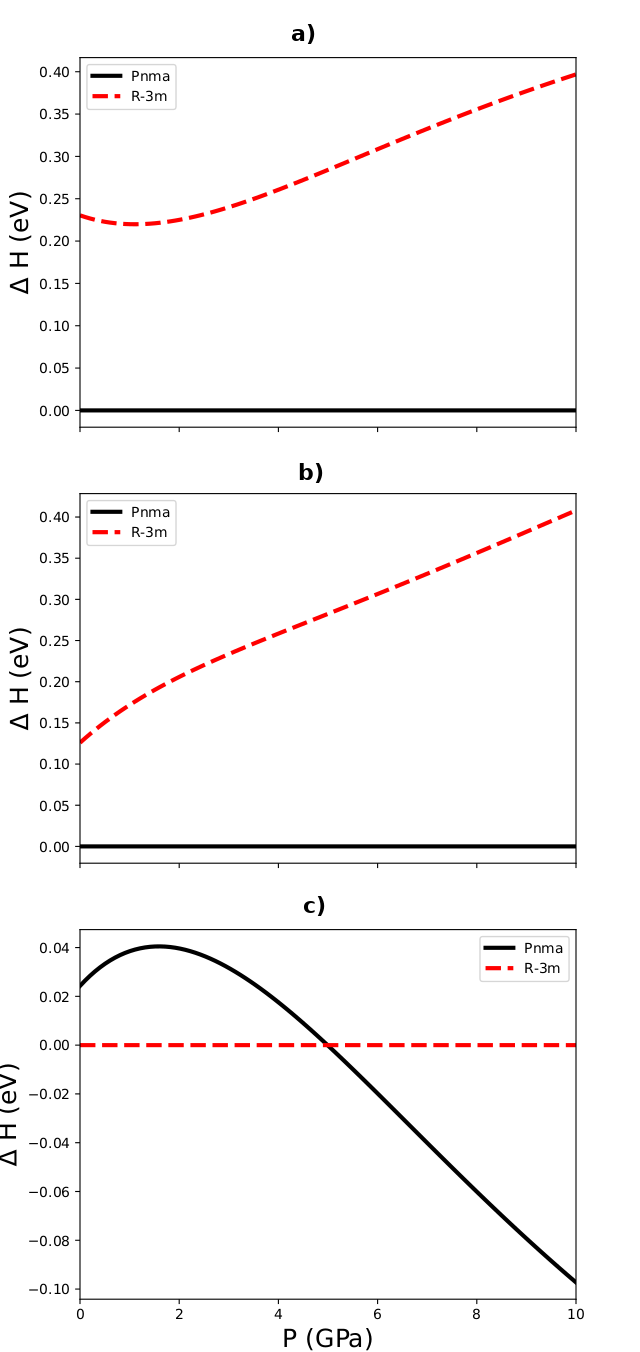
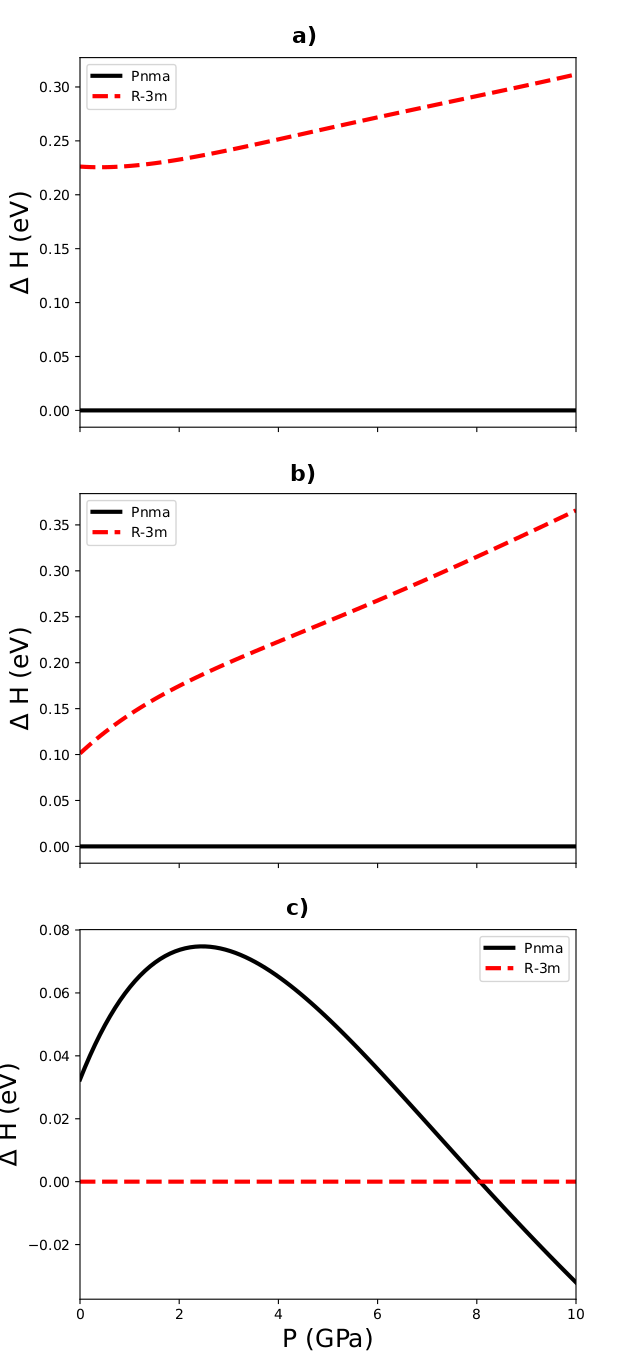
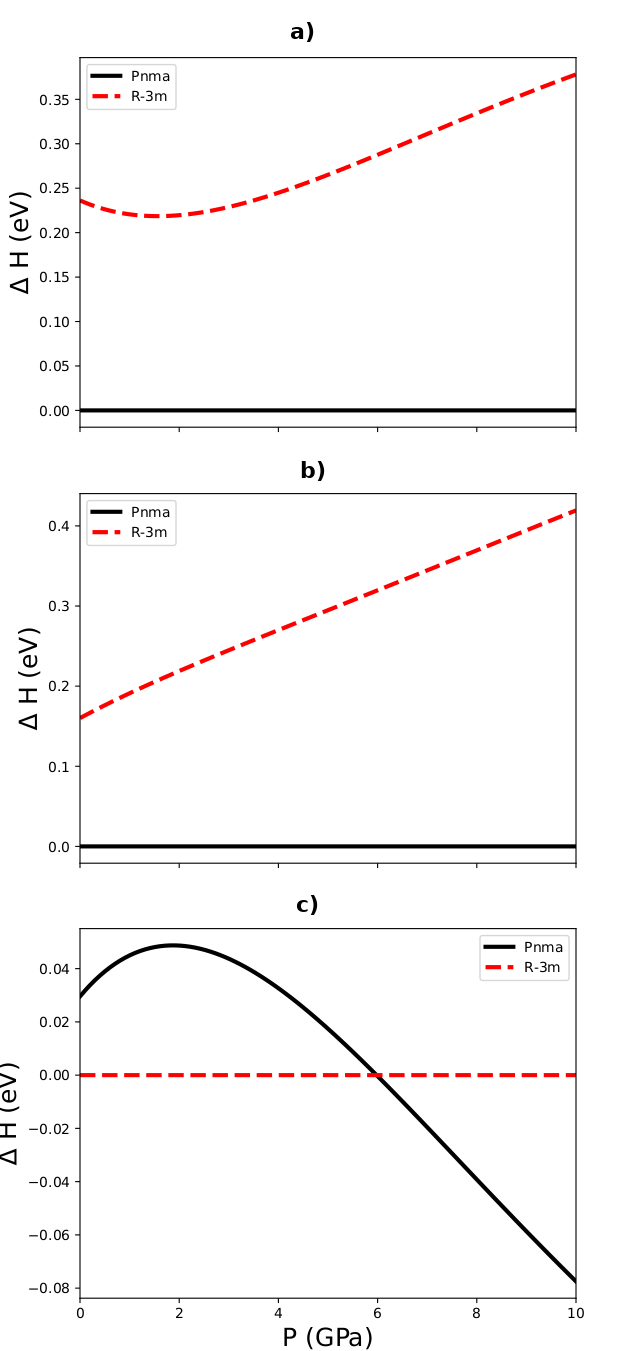
Figs. 2a, 2b, and 2c show the pressure-dependence of the enthalpy differences between the R-3m and Pnma phases of Sb2S3, Bi2S3, and Sb2Se3, respectively. We find that the orthorhombic Pnma phase is the most energetically stable phase of Bi2S3 and Sb2S3 at all pressures examined, as expected from experiments that obtained this phase both under ambient conditions and at high pressure. Surprisingly, however, our simulations indicate that the R-3m phase of Sb2Se3 is more stable than the Pnma below 4.8 GPa, indicating that both the Pnma and R-3m phases are energetically competitive over this range. This in principle contradicts existing experimental studies on Sb2Se3 that have so far consistently obtained the Pnma phase under ambient conditions. We note however that the energy difference between the two phases is only 22.71 meV per f.u., which is lower than the kBT 25 meV at 300 K that would be required for the phase transition to occur under ambient conditions.
In order to rule out the possibility that the above results on the three sesquichalcogenides could be due to inaccuracies with the PBEsol xc functional, we also computed the enthalpies of the two phases with two additional xc functionals, namely the LDA 37 and the PBE-D2 method using the PBE GGA functional with the Grimme dispersion correction.38 The results of these calculations are presented as an Appendix (Sec. 5.1). The unit-cell volumes of the Pnma phases obtained with the two functionals are underestimated and overestimated with respect to the PBEsol results shown in Tab. 1, as expected. As for PBEsol, the two additional functionals predict that at ambient pressure the R-3m phase of Sb2Se3 is more energetically stable than the Pnma phase, and remains so up to 6 GPa (LDA) and 8 GPa (PBE-D2). On the other hand, both functionals predict the Pnma phases of Sb2S3 and Bi2S3 are more stable than the R-3m phase at least up to 10 GPa.
3.3 Energetic stability of the low-pressure Pnma and R-3m phases of Sb2Se3 at finite temperature
The calculations in the previous section were performed at 0 K without taking into consideration the contributions to the free energy from crystal vibrations (phonons). In order to probe whether these effects could alter the energy ordering between the Pnma and R-3m phases of Sb2Se3, we performed lattice-dynamics calculations on the equilibrium and compressed structures to evaluate the constant-volume Hemholtz and constant-pressure Gibbs free energies at zero pressure (/; Fig. 3).
The is obtained by summing the lattice energy (here the DFT total energy) and the vibrational contributions to the internal energy and entropy from the zero-point atomic motion and thermal population of the harmonic phonon energy levels.70 As shown in Fig. 3, the predict that at zero pressure the R-3m phase remains the most stable across the temperature range examined with no crossing of the free energy to suggest a transition to the Pnma phase. At 0 K, the difference in the between the two phases is 27.24 meV per f.u., which is 4.53 meV higher than the difference in due to the addition of the zero-point energy (i.e. the differences in the phonon frequencies selectively stabilise the R-3m phase). At 300 K, the difference between the phases shows a negligible increase of 0.11 meV per F.U. to 27.35 meV.
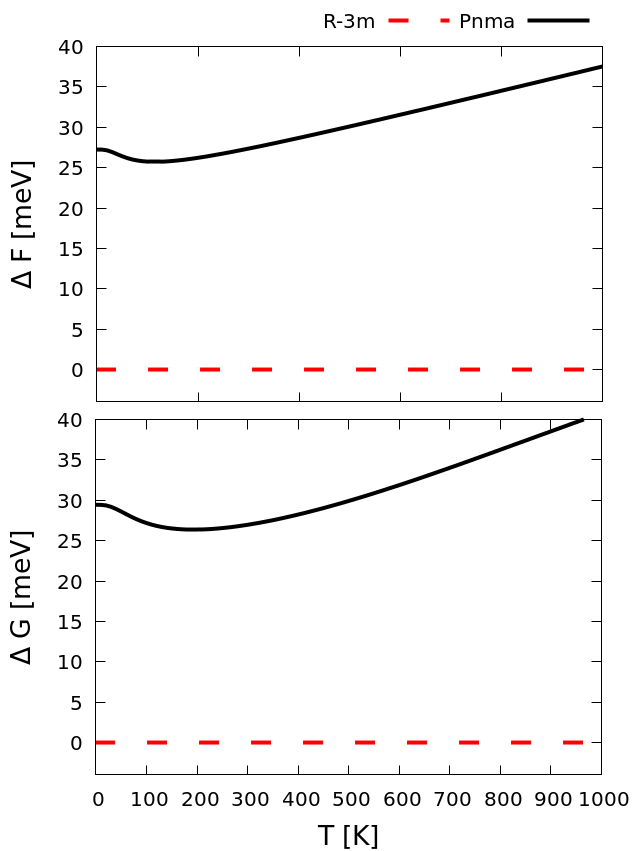
Another factor that can influence in the ordering of two competing phases is thermal expansion. Variation of the lattice volume due to thermal expansion/contraction impacts both the lattice energy and the phonon contributions to the free energy. This can be accounted for through the quasi-harmonic approximation (QHA) where the thermal expansion of the lattice is predicted from the volume dependence of the lattice energy, phonon frequency spectrum and phonon free energy. 70, 71 The free energy is computed for a series of unit-cell volumes and the equilibrium volume and Gibbs free energy at a finite temperature is obtained by minimizing for a given (constant) pressure. Fig. 3 shows the difference in between the Pnma and R-3m phases of Sb2Se3. When taking into account the thermal expansion the R-3m phase still remains the most stable phase with respect to the Pnma phase from 0-1000 K with similar energy difference of 29.43 meV at 0 K to that predicted using the constant-volume , and a slight decrease in the energy difference to 26.96 meV at 300 K.
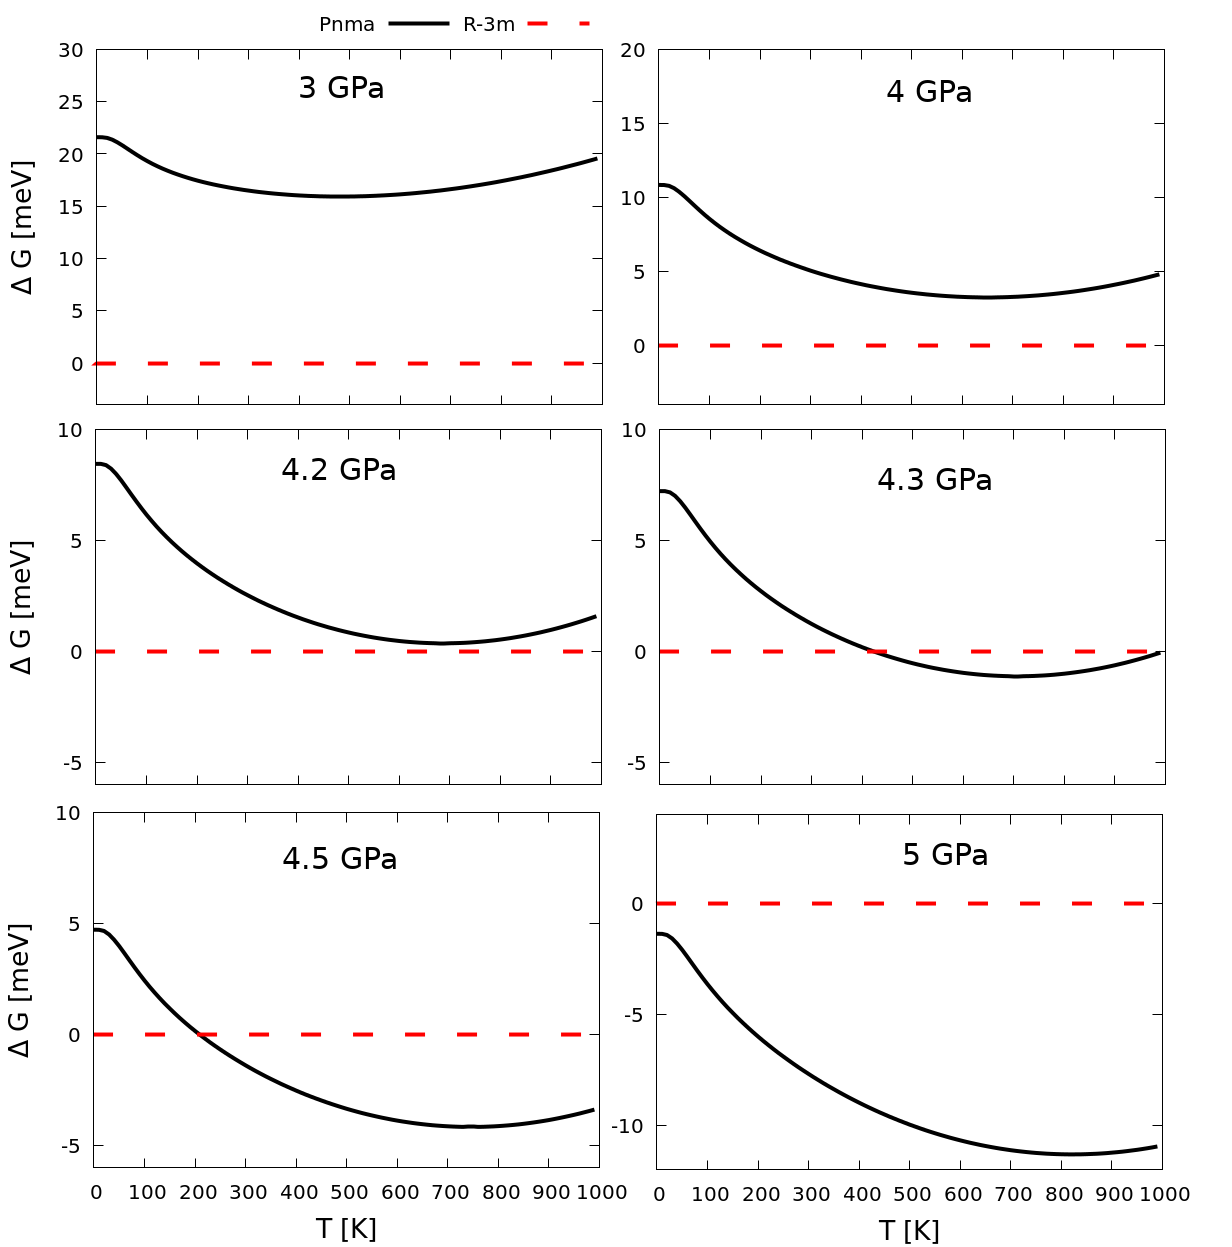
To investigate the effect of pressure on the free energy we also computed the difference in the Gibbs energy between the two phases at applied pressures between 0-5 GPa (Fig. 4). For = 3 and 4 GPa, these calculations predict the R-3m phase to be the most energetically stable phase across the 0-1000 K temperature range examined, but it can be clearly seen that pressure reduces the energy differences between the two phases. At 4 GPa, the smallest energy difference between the two phases of 3.25 meV is predicted to occur between 650-700 K. Increasing the pressure slightly to 4.2 GPa results in the energies of the two phases becoming nearly equal at around 400 K, and at 4.3 GPa a phase transition from R-3m to Pnma is preducted to occur around this temperature. At 4.5 GPa the predicted transition temperature decreases to 200 K, and at 5 GPa the Pnma phase becomes the most energetically favorable structure across the entire temperature range examined.
In summary, free-energy calculations including phonon contributions and thermal expansion therefore at zero applied pressure provude further evidence that the R-3m phase of Sb2Se3 is more stable than the Pnma phase. Interestingly, neither the nor predict a decrease in the energy difference, from which we infer that phonon contributions to the free energy selectively stabilise the R-3m phase, at least at zero applied pressure. Under low pressures between 4.2-4.4 GPa the Gibbs free energies predict a pressure-induced transition between the R-3m and Pnma phases near room temperature conditions, which is similar to the 4.8 GPa transition pressure predicted from the 0 K enthalpies without zero-point energy corrections (Fig. 2). We attribute the small decrease in the predicted transition pressure to the different impacts of volume on the phonon spectra of the two phases.
3.4 Dynamical stability of the Pnma and R-3m phases of Sb2Se3
Energetic stability is a necessary but not sufficient condition for a structural phase to be synthetically accessible. One should therefore also confirm the dynamical stability of the system, which can be done by studying the phonon frequency spectrum. If imaginary frequencies are present in the phonon dispersion, this is an indication that the system is not a minimum on the structural potential-energy surface (and is instead e.g. a transition state or hilltop in multidimensional space), and would spontaneously convert to a lower-energy structure and thus be kinetically unstable under a given set of conditions.72, 73, 74, 75, 76, 77
We therefore investigated dynamical stability of R-3m Sb2Se3 to confirm whether this structure could potentially be synthesized at or close to ambient conditions. To do so we evaluated the phonon band dispersion and density of states (DoS) curves of the R-3m phase at 0 zero pressures and different temperatures using the QHA method described in the previous section (Fig. 5). For comparison we also present the phonon band structure and DoS of the Pnma phase. Both structures show real frequencies across the whole of the Brillouin zone, indicating that both are dynamically stable under ambient conditions (i.e. 0 GPa and room temperature) and confirming that, as implied by the energetics calculations, both phases should be accessible given appropriate synthesis conditions.
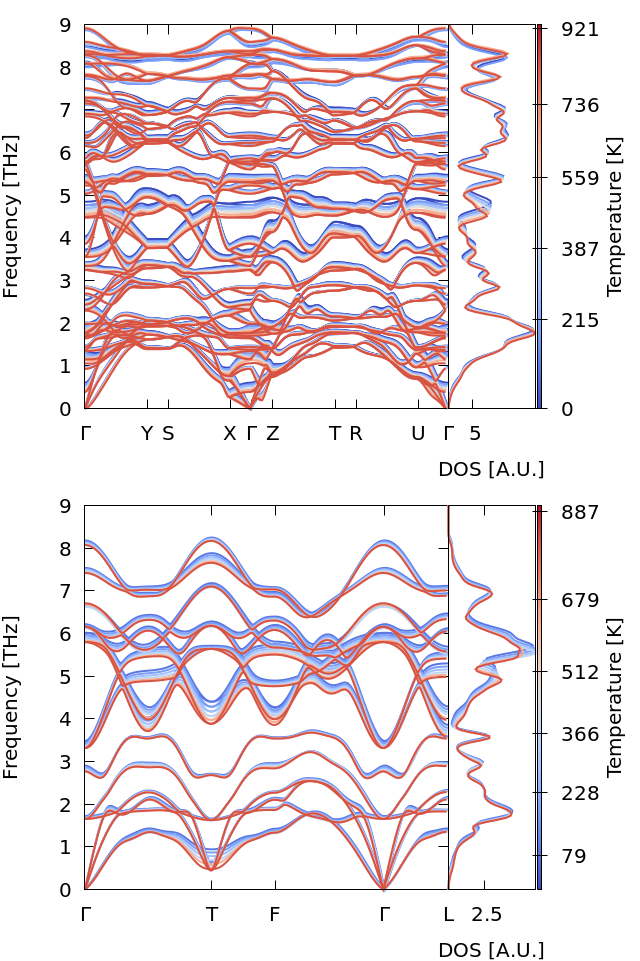
In this context, we note that these results are consistent with a recent theoretical study of the R-3m phase of Sb2Se3, which reported phonon dispersion curves and confirmed the dynamical stability of this phase at 0 GPa and 0 K.23 This study also reported formation energies of Sb2Se3 as evidence for the energetic stability of the R-3m phase. In addition, ab initio molecular dynamics calculations23 have confirmed that the R-3m phase remains structurally stable at 300 K.
3.5 Mechanical stability of the Pnma and R-3m phases of Sb2Se3
Having established the energetic and dynamical stability of R-3m Sb2Se3 at zero pressure, we also checked the mechanical (elastic) stability as a third condition that must be fulfilled for this system to be synthetically accessible. This is achieved by calculating the elastic constants and confirming that they obey the Born stability criteria when the solid is subjected to homogeneous deformations.72, 78, 79 Tab. 2 lists the calculated elastic constants of the Pnma and R-3m phases of Sb2Se3 at zero pressure.
| c11 | c22 | c33 | c12 | c13 | c23 | c44 | c55 | c66 | |
|---|---|---|---|---|---|---|---|---|---|
| Pnma | 30.92 | 81.65 | 55.20 | 17.32 | 15.10 | 26.89 | 17.83 | 25.21 | 7.69 |
| c11 = c22 | c33 | c12 | c13 = c23 | c15 = -c25 = c46 | c44 = c55 | c66 | |
|---|---|---|---|---|---|---|---|
| R-3m | 90.81 | 40.21 | 25.85 | 21.61 | -12.00 | 25.10 | 32.48 |
To confirm the accuracy of our calculated elastic constants, we computed the linear compressibility of both phases using the ELATE analysis tools. 48 For both phases, only directions corresponding to positive linear compressibilities were obtained, indicating that both phases are mechanically stable under ambient conditions. In the case of the R-3m phase, we obtained linear compressibilities between = 4.9 TPa-1 (hexagonal -axis) and = 19.5 TPa-1 (hexagonal -axis) with an anisotropy value of 3.95. For the Pnma phase, the compressibilities fall between = 3.7 TPa-1 (-axis) and = 25.7 TPa-1 (-axis) with an anisotropy of 6.87. These values are of the same order as the experimental axial compressibilities of the Pnma phase of Sb2Se3 ( = 15.2 TPa-1, = 3.9 TPa-1, = 8.3 TPa-1).62 Tab. 3 summarises the elastic moduli calculated from the elastic constants, and we note that the bulk modulus of Pnma Sb2Se3 (31.8 GPa) is similar to that obtained from the Birch-Murnaghan fit (c.f. Tab. 1), which confirms that the elastic constants are adequately converged.
| B0 (GPa) | (GPa) | (GPa) | ||
| Pnma | 31.82 | 44.10 | 17.38 | 0.27 |
| R-3m | 40.00 | 65.56 | 26.72 | 0.23 |
The calculated elastic constants in Tab. 2 fulfill the necessary and sufficient Born criteria for the mechanical stability of orthorhombic (Eq. 1) and rhombohedral (Eq. 2) systems.79 The calculated elastic constants therefore indicate that both the R-3m and Pnma phases of Sb2Se3 are mechanically stable under ambient conditions.
| (1) | |||
| (2) |
The elastic tensors of the Pnma phase of Sb2Se3 have been calculated previously calculated.49 However, in these calculations the components were overestimated as clearly shown by comparison of the bulk modulus with experiments. Part of the disagreement could be due to the low cut-off energy used in those calculations.
In summary, our calculations on Sb2Se3 demonstrate that the Pnma and R-3m phases are energetically competitive under ambient conditions and that both phases are dynamically and mechanically stable. Given that it should in principle be possible to obtain the R-3m phase, but it has yet to be reported experimentally, it is possible that the R-3m phase is difficult to form due to kinetic reasons, i.e. that the Pnma phase is formed faster than the R-3m phase under typical synthesis conditions. We note that the R-3m phase did not appear on the pressure/temperature phase diagram prepared by Pfeiffer et al.,80 although this study did not attempt to vary the synthesis conditions at close to ambient pressure, which the present calculations suggest would allow this phase to be obtained. In any case, our calculations raise the possibility that the R-3m phase could potentially be prepared under slightly non-equilibrium conditions. Therefore, to help identify R-3m Sb2Se3 in future experiments, we provide in the following section a reference structure and vibrational spectra at zero pressure.
3.6 Crystal structure and vibrational spectra of R-3m Sb2Se3
Table 4 detailed the predicted equilibrium crystal structure (lattice parameters and atomic positions) of R-3m Sb2Se3 obtained using the PBEsol xc functional. (The calculations with PBE+D2 and LDA yield slightly different lattice parameters, viz. PBE+D2 - =4.02 Å, =28.81 Åand =403.89 Å3; and LDA - =3.99 Å, =27.58 Å, and =381.61 Å3.) The predicted lattice parameters are in good agreement with those reported for other tetradymite-like sesquichalcogenides.81 The optimised and are slightly smaller than those of Bi2Se3 and much smaller than those of Sb2Te3.81
| a0 (Å) | c0 (Å) | V0 (Å3) | B0 (GPa) | B |
|---|---|---|---|---|
| 4.01 | 28.16 | 392.16 | 50.56 | 4.16 |
| Site | Sym. | x | y | z | |
| Sb1 | 6c | 3m | 0.00000 | 0.00000 | 0.60082 |
| Se1 | 3a | -3m | 0.00000 | 0.00000 | 0.00000 |
| Se2 | 6c | 3m | 0.00000 | 0.00000 | 0.78792 |
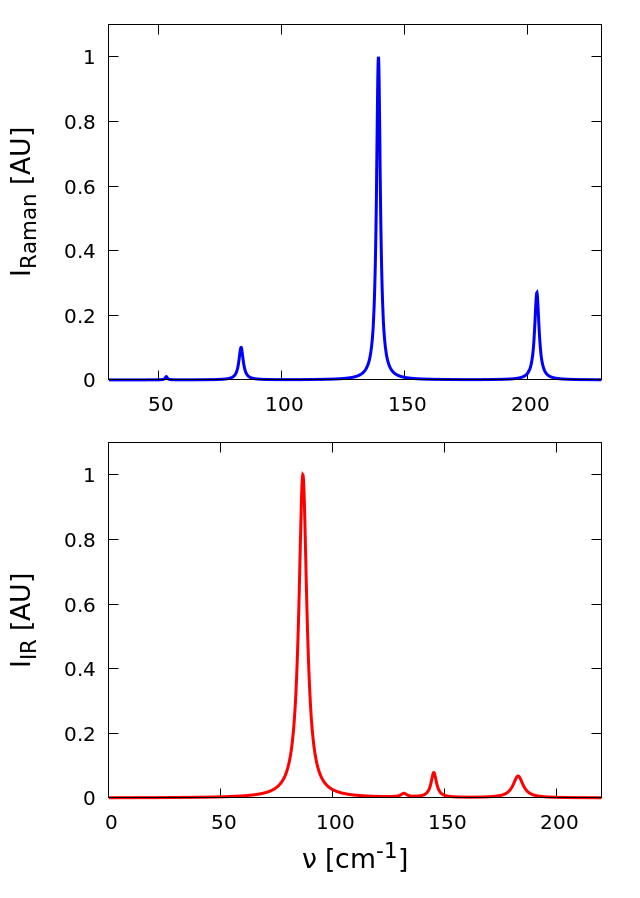
We have also computed the Raman and infrared (IR) spectra of the equilibrium structure to provide spectral signatures that could be used to identify the R-3m phase in experiments using routine characterisation techniques (Fig. 6).
The frequencies, irreducible representations and IR/Raman intensities associated with each of the zone-centre (-point) vibrational modes are listed in Table 5.
| Irr.eps. | Frequency | Raman Intensity | IR Intensity | Spectral Linewidths |
| (cm-1) | (105 Å4 amu-1) | (e2 amu-1) | (cm-1) | |
| E | 53.3 | 0.02 | Inactive | 1.02 |
| A | 83.7 | 0.37 | Inactive | 2.11 |
| E | 86.6 | Inactive | 3.47 | 4.32 |
| E | 131.7 | Inactive | 0.03 | 3.13 |
| E | 139.4 | 3.32 | Inactive | 1.89 |
| A | 145.1 | Inactive | 0.18 | 2.94 |
| A | 182.8 | Inactive | 0.29 | 5.38 |
| A | 203.8 | 1.02 | Inactive | 2.16 |
The inversion symmetry in the R-3m structure leads to mutual exclusion between the IR and Raman activity of the modes, with each spectrum being characterized by four bands.81 The most intense Raman band occurs around 139 cm-1 (E), while a second prominent feature is predicted at 204 cm-1 (A). The frequency of this A mode is higher than in Bi2Se3 but lower than in In2Se3, as expected from the difference in mass between In, Sb and Bi.82, 83 Lower-frequency E and A modes with much lower intensities are also found around 53 and 84 cm-1, respectively, which are again slightly blue-shifted when compared to the corresponding frequencies calculated for Bi2Se3.82 There are four IR-active modes, two with E symmetry (87 and 132 cm-1) and two with A symmetry (145 and 183 cm-1). Of these, the 87 cm-1 mode is the most prominent in the spectrum, while the second E mode at 132 cm-1 is comparatively weak. The two A bands have moderate ans comparable intensities and form a pair of smaller features at higher frequencies. As expected given the mass difference, the IR-active modes in Sb2Se3 again have slightly higher frequencies than those calculated for Bi2Se3.82
It is also worth comparing our predicted structural and vibrational properties of R-3m Sb2Se3 to the published works pertaining to the possible synthesis of this phase. In 2013, Bera et al. 25 claimed to observed the R-3m phase of Sb2Se3 at room temperature. However, the experimental lattice parameters were not disclosed and the reported Raman spectrum is not consistent with our theoretical spectrum, although our spectrum is consistent with simulations performed in the same study. We also note that our calculations of the pressure coefficients for the Raman- and IR-active modes of tetradymite Sb2Se3 (not shown) indicate that all the modes should show positive pressure coefficients, which is again consistent with the theoretical results in Ref. 25.
If we consider that the band gap of tetradymite-like Sb2Se3 should be similar to or even larger than that of tetradymite-like Bi2Se3, we would expect the Raman spectrum of tetradymite-like Sb2Se3 to be similar. We may therefore conclude that the experimental Raman spectra reported in Ref. 25 is not consistent with tetradymite-like Sb2Se3. In this vein, we note that the appearance of soft Raman modes with negative pressure coefficient at low pressure as reported in Ref. 25 are similar to those of Se and Te nano- or micro-clusters.84, 85, 86, 87 Such features are either formed during synthesis or induced by laser heating in Raman scattering measurements at high laser powers, as has recently been discussed.87
Recently, Matetskiy et al. 32 claim to have observed the tetradymite-like phase of Sb2Se3 in MBE-deposited layers over a thick buffer layer of tetradymite-like Bi2Se3. This study reported a lattice parameter of =4.048 Å for 5 quintuple layers of tetradymite-like Sb2Se3. The quintuple layers were observed in scanning-tunnelling microscopy (STM) to be of 1 nm in thickness, meaning that the lattice parameter, corresponding to three quintuple layers, would be 30 Å. Both the reported and lattice parameters are consistent with our calculated values. Furthermore, electron dispersion obtained from angle-resolved photoemission spectroscopy (ARPES) is compatible with the R-3m phase. It is therefore highly probable that tetradymite-like Sb2Se3 was synthesized for the first time in this study. Unfortunately, this study did not report vibrational spectra that would allow for additional comparison to our predictions.
3.7 On the observation of the R-3m phase in A2X3 sesquichalcogenides
An analysis of the bonding in layered materials under ambient conditions, including the tetradymite-like BX and AVIBX chalcogenides and also the transition metal dichalcogenides (TMDs), has recently been performed by plotting the van der Waals (vdW) gap spacing vs. the X-X plane spacing.88 The vdW gap spacing is defined as the interplanar distance across the interlayer space, whereas the X-X plane distance is the interplanar width across the intralayer space.89, 88 In Ref. 88, it was concluded from the strong correlation that TMDs show a pure interlayer vdW interaction, whereas the tetradymite-like chalcogenides do not because the vdW gap spacing is much smaller than expected for their X-X plane spacing, which is indicative of a stronger interlayer interaction than that expected for pure vdW interactions.
It has recently been suggested that the vdW gap spacings in tetradymite-like group-15 sesquichalcogenides are smaller than those found for pure vdW materials, e.g. GaSe, InSe and TMDs. This has been attributed to the presence of the extra delocalized electrons between the layers that contribute an electrostatic component to the bonding that is not present in pure vdW materials.90, 24 These delocalized electrons arise from a new type of bonding, termed "metavalent bonding", between the cations and anions inside the quintuple layers of the tetradymite-like structure, which has been demonstrated by the observation of a net charge difference between the layers in group-15 sesquichalcogenides 91 and through a topological study of the electronic charge density of SnSb2Te4.92 In essence, metavalent bonding results in the cations and anions providing extra electrons to the space between the layers, which in turn supports a stronger interlayer interaction.
In Fig. 7 we compare the experimental and theoretical vdW gap spacing vs. the X-X plane spacing for all tetradymite-like BX (B=As,Sb,Bi; X=S,Se,Te) sesquichalcogenides. 89, 88 (The theoretical results are obtained with PBEsol and dispersion-corrected PBE.)
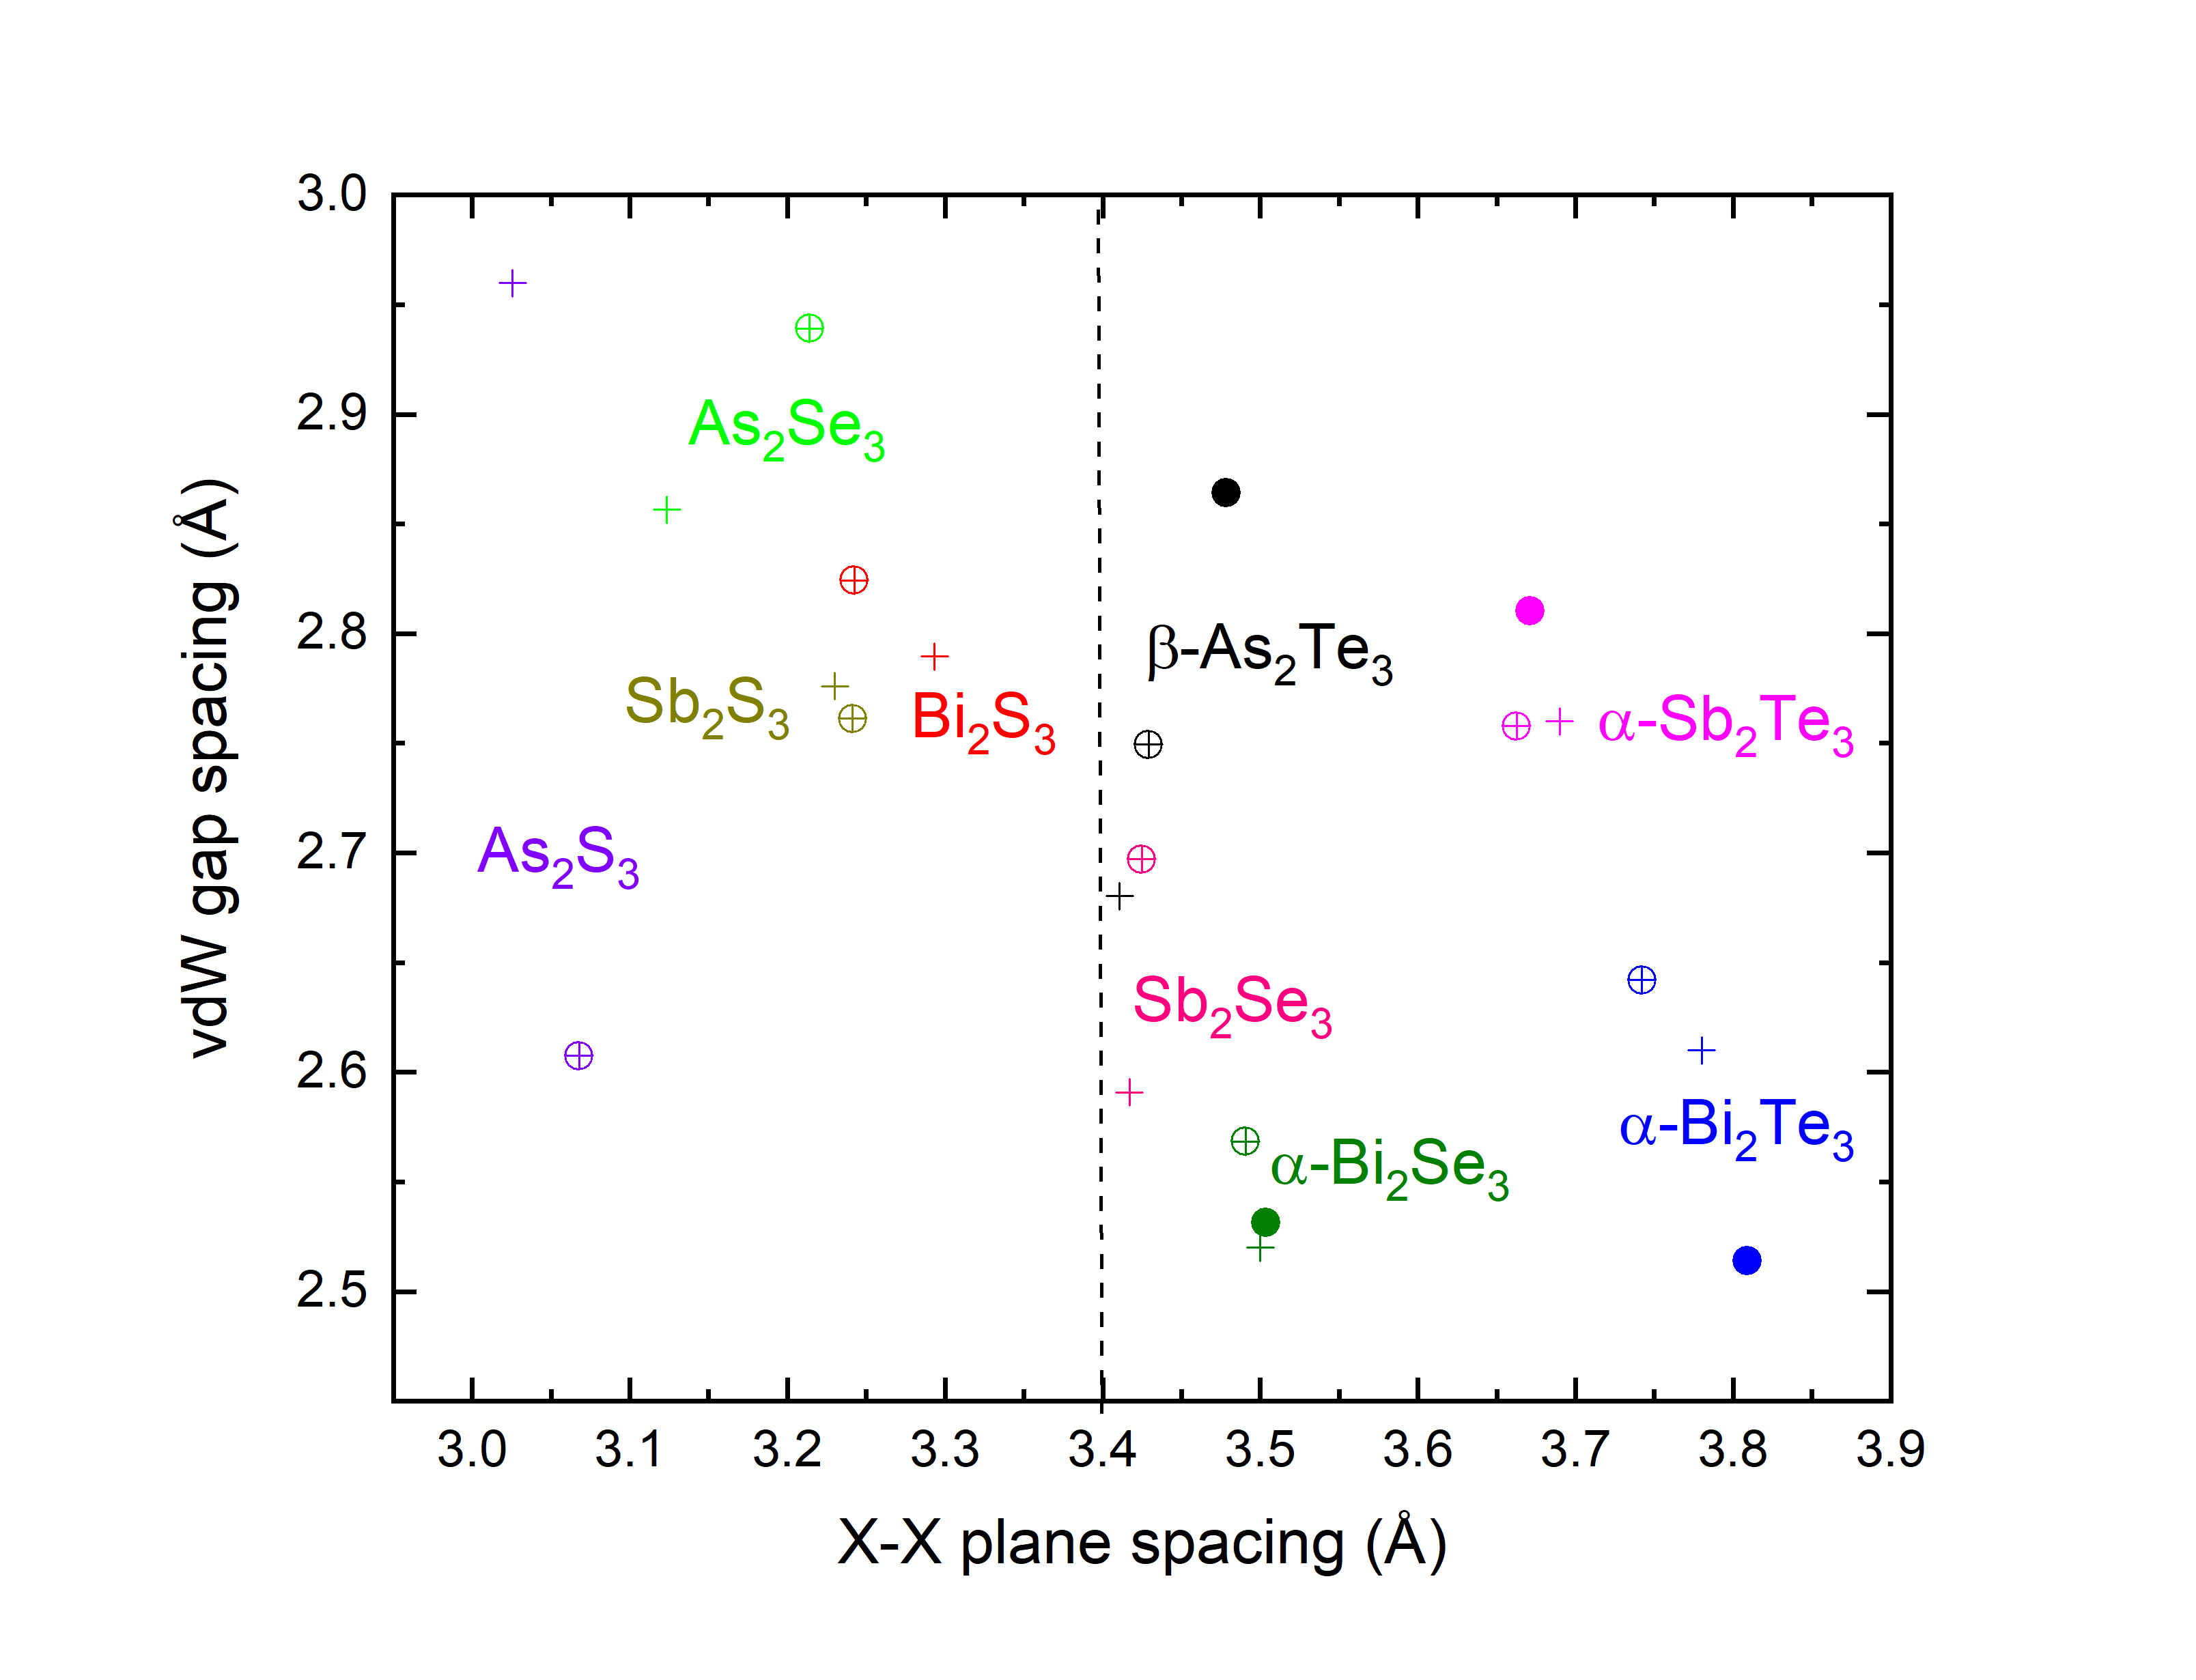
Fig. 7 shows that the compounds usually synthesized in the tetradymite-like structure (i.e. -As2Te3, -Sb2Te3, -Bi2Te3 and -Bi2Se3) have a very small vdW gap spacing (typically below 2.9 Å) and a large X-X plane spacing (typically above 3.4 Å). It is rather striking that the Te-Te plane spacing in -As2Te3 is below 3.5 Å, which is quite far from the values for other Te sesquichalcogenides and close to the values of the Se-Se plane spacings in Se sesquichalcogenides such as Bi2Se3. In this regard, it can be inferred that all compounds with a stable tetradymite-like structure at room conditions (see Fig. 5 of Ref. 88) show vdW-gap spacings distributed in a narrow X-X plane spacing region between 3.4 and 3.8 Å. Since As2Se3 and Sb2Se3 do not usually crystallize in the tetradymite-like structure, it could be similarly inferred that the region located between 3.4 Å< X-X plane spacing < 3.8 Å and a vdW gap spacing < 2.9 Å imposes a limit of stability for the formation of the tetradymite structure in BX and AVIBX chalcogenides. This is consistent with: i) the location of -Bi2Se3 and -As2Te3 close to the lower limit value of X-X plane spacing; ii) the metastable tetradymite-like phase of -As2Te3 obtained under ambient conditions; and (iii) the metastable orthorhombic Pnma phase of Bi2Se3 (guanajuatite) under ambient conditions,97, 17, 98, 99 which is isostructural to Bi2S3, Sb2S3 and Sb2Se3 and has been found in HP studies on -Bi2Se3 (paraguanajuatite) on decreasing the pressure.54, 69
Most importantly, the vdW gap spacings and X-X plane spacings calculated for Sb2Se3 with PBEsol and PBE, with dispersion corrections, are similar to those obtained for group-15 tetradymite-like sesquichalcogenides. This lends further support to the idea that the R-3m phase of Sb2Se3 should be synthetically accessible with a structure similar to that predicted in our calculations. Unfortunately, despite the fact that R-3m Sb2Se3 does appear to have been synthesized recently,32, 88 a complete structural characterization has yet to be reported and therefore several of our calculated parameters cannot be compared to experimental. We thus hope that the present study may stimulate further attempts to prepare and characterise the R-3m phase of Sb2Se3.
Finally, by observing Fig. 7 we also note that all group-15 sesquisulphides, for which theoretical R-3m structures are located below 3.4 Å of the X-X gap spacing, do not seem to be stable in this phase at room conditions according to our calculations. This is in good agreement with the high predicted enthalpies of this phase of Sb2S3 and Bi2S3. However, this does not necessarily mean that the R-3m phase of these compounds could not be synthesized, as it is known that R-3m As2Se3 can be prepared at high pressure and high temperature, which indicates that the tetradymite-like structure of As2Se3 is metastable under ambient conditions.80, 100, 101, 102 It is therefore possible that tetradymite-like As2S3, Sb2S3 and Bi2S3 could also potentially be synthesized.
4 Conclusions
We have performed a comparative theoretical study of the Pnma and R-3m phases of Sb2S3, Bi2S3, and Sb2Se3 considering applied pressures of up to 10 GPa. Our calculations predict that at ambient pressure the R-3m (tetradymite-like) phase of Sb2Se3 is energetically more stable than the Pnma phase, in contrast to Sb2S3 and Bi2S3. This result contradicts the fact that all three compounds are usually grown on the Pnma phase. Further energetic studies of both Sb2Se3 phases show that the higher energetic stability of the R-3m phase with respect to the Pnma phase is predicted by three different xc functionals and is unaffected by the phonon contributions to the free energy and thermal expansion at finite temperature. Lattice dynamics and elastic tensor calculations further show that both phases of Sb2Se3 are dynamically and mechanically stable at zero pressure Our calculations therefore suggest that the formation of this phase should be feasible at close to ambient conditions.
To aid in its identification, we have provided a theoretical crystal structure and predicted IR and Raman spectra. We also discussed the results of the only two published works, to the best of our knowledge, that have claimed to have synthesized tetradymite-like Sb2Se3, and concluded that there is a high probability that this phase has recently been synthesized by molecular beam epitaxy on a thick buffer layer of tetradymite-like Bi2Se3.
Finally, we have discussed the stability and metastability of the R-3m structure for all group-15 sesquichalcogenides on the basis of the values of the vdW gap spacings and the X-X plane spacings, which again suggests that the R-3m phase of Sb2Se3 should be synthetically accessible. We hope that this work will stimulate further investigation of tetradymite-like Sb2Se3 as well as the corresponding phase of As2Se3 and other sesquichalcogenides. These type of sesquichalcogenides could potentially show topological properties interesting for spintronics and quantum computation at moderate pressures, and also have interest as phase change materials and highly-efficient thermoelectric materials, as well as for photonic devices.
Author Contributions
E.L.d.S., M.C.S., J.M.S., P.R.H. and A.M. performed the ab-initio calculations. E.L.d.S., M.C.S., J.M.S., P.R.H., A.M., D.M.G., R.V., and F.J.M. contributed to the interpretation and discussion of results. F.J.M. supervised the project. E.L.d.S., M.C.S., J.M.S., P.R.H., A.M., D.M.G., R.V., and F.J.M. have contributed equally to the discussion and drafting of the paper. All authors have read and agreed to the published version of the manuscript.
Conflicts of interest
There are no conflicts to declare.
Acknowledgements
This publication is part of the project MALTA Consolider Team network (RED2018-102612-T), financed by MINECO/AEI/10.13039/501100003329; by I+D+i projects PID2019-106383GB41/42/43, financed by MCIN/AEI/10.13039/501100011033; by project PROMETEO/2018/123 (EFIMAT), financed by Generalitat Valenciana; and by the European Union Horizon 2020 research and innovation programme under Marie Sklodowska-Curie grant agreement No. 785789-COMEX. E.L.d.S., A. M., and P. R.-H. acknowledge computing time provided by MALTA-Cluster at the University of Oviedo and Red Española de Supercomputación (RES) through the computer resources at MareNostrum with technical support provided by the Barcelona Supercomputing Center (QCM-2018-3-0032). E.L.d.S. also acknowledges the Network of Extreme Conditions Laboratories (NECL), financed by FCT and co-financed by NORTE 2020, through the programme Portugal 2020 and FEDER. J.M.S. is grateful to UK Research and Innovation for the support of a Future Leaders Fellowship (MR/T043121/1) and to the the University of Manchester for the previous support of a Presidential Fellowship.
Data availability
Raw data from this study can be obtained from the corresponding author on reasonable request.
License statement
For the purpose of open access, the author has applied a Creative Commons Attribution (CC BY) licence to any Author Accepted Manuscript version arising.
5 Appendix
5.1 Enthalpy vs pressure curves obtained using different exchange-correlation Functionals
In order to confirm the variation of the enthalpy with pressure Pnma and R-3m phases of the three sesquichalcogenides presented in Fig. 2 and obtained using the PBEsol functional, we performed similar calculations using dispersion-corrected PBE (PBE-D2; Fig. 8) and the LDA (9). For the Sb2Se3 we find that both additional functionals also predict that the R-3m phase is energetically the most stable under ambient conditions. There is however some variation in the predicted transition pressure, with PBEsol and the LDA predicting similar pressures but PBE-D2 predicting a slightly higher transition point.
Notes and references
- Chen et al. 2009 Y. L. Chen, J. G. Analytis, J.-H. Chu, Z. K. Liu, S.-K. Mo, X. L. Qi, H. J. Zhang, D. H. Lu, X. Dai, Z. Fang, S. C. Zhang, I. R. Fisher, Z. Hussain and Z.-X. Shen, Science, 2009, 325, 178.
- Zhang et al. 2009 H. Zhang, C.-X. Liu, X.-L. Qi, X. Dai, Z. Fang and S.-C. Zhang, Nat. Phys., 2009, 5, 438.
- Hasan and Kane 2010 M. Z. Hasan and C. L. Kane, Rev. Mod. Phys., 2010, 82, 3045.
- Black et al. 1957 J. Black, E. M. Conwell, L. Seigle and C. W. Spencer, J. Phys. Chem. Solids, 1957, 2, 240.
- Filip et al. 2013 M. R. Filip, C. E. Patrick and F. Giustino, Phys. Rev. B, 2013, 87, 205125.
- Sa Moon et al. 2010 S.-J. Sa Moon, Y. Itzhaik, J.-H. Yum, S. M. Zakeeruddin, G. Hodes and M. Grätzel, J. Phys. Chem. Lett., 2010, 1, 1524.
- Patrick and Giustino 2011 C. E. Patrick and F. Giustino, Adv. Funct. Mater., 2011, 21, 4663.
- Zhou et al. 2015 Y. Zhou, L. Wang, S. Chen, S. Qin, X. Liu, J. Chen, D. Xue, M. Luo, Y. Cao, Y. Cheng, E. Sargent and J. Tang, Nat. Photonics, 2015, 9, 409.
- Wang et al. 2017 L. Wang, D. Li, K. Li, C. Chen, H.-X. Deng, L. Gao, Y. Zhao, F. Jiang, L. Li, F. Huang, Y. He, H. Song, G. Niu and J. Tang, Nat. Energy, 2017, 2, 17046.
- Rabin et al. 2006 O. Rabin, J. Perez, J. Grimm, G. Wojtkiewicz and R. Weissleder, Nat. Materials, 2006, 5, 118.
- Yao et al. 2006 K. Yao, Z. Zhang, X. Liang, Q. Chen, L.-M. Peng and Y. Yu, J. Phys. Chem. B, 2006, 110, 21408.
- Cademartiri et al. 2009 L. Cademartiri, F. Scotognella, P. O’Brien, B. Lotsch, J. Thomson, S. Petrov, N. Kherani and G. Ozin, Nano Lett., 2009, 9, 1482.
- Mamta et al. 2021 Mamta, Y. Singh, K. Maurya and V. Singh, Sol. Energy Mater. Sol. Cells, 2021, 230, 111223.
- Chen et al. 2022 S. Chen, T. Liu, Z. Zheng, M. Ishaq, G. Liang, P. Fan, T. Chen and J. Tang, J. Energy Chem., 2022, 67, 508.
- 15 Q. Li, W. Zhang, J. Peng, D. Yu, Z. Liang, W. Zhang, J. Wu, G. Wang, H. Li and S. Huang, Adv. Funct. Mater., n/a, 2112776.
- Ma et al. 2021 X. Ma, W. Chen, L. Tong, S. Liu, W. Dai, S. Ye, Z. Zheng, Y. Wang, Y. Zhou, W. Zhang, W. Fang, X. Chen, M. Liao and W. Gao, Opt. Laser Technol., 2021, 143, 107286.
- Kang et al. 2017 Y. Kang, Q. Zhang, C. Fan, W. Hu, C. Chen, L. Zhang, F. Yu, Y. Tian and B. Xu, J. Alloys Compd., 2017, 700, 223.
- Kulbachinskii et al. 2018 V. Kulbachinskii, S. Buga, N. Serebryanaya, N. Perov, V. Kytin, S. Tarelkin, R. Bagramov, N. Eliseev and V. Blank, J. Phys. Conf. Ser., 2018, 969, 012152.
- Tumelero et al. 2016 M. A. Tumelero, L. C. Benetti, E. Isoppo, R. Faccio, G. Zangari and A. A. Pasa, J. Phys. Chem, 2016, 120, 11797.
- Serebryanaya et al. 2020 N. Serebryanaya, S. Buga, R. Bagramov, I. Pahomov, N. Eliseev and V. Blank, Phys. Status Solidi B, 2020, 257, 2000145.
- Liu et al. 2011 W. Liu, X. Peng, C. Tang, L. Sun, K. Zhang and J. Zhong, Phys. Rev. B, 2011, 84, 245105.
- Li et al. 2013 W. Li, X. Wei, J.-X. Zhu, C. Ting and Y. Chen, Phys. Rev. B, 2013, 89, 035101.
- Cao et al. 2018 G. Cao, H. Liu, J. Liang, L. Cheng, D. Fan and Z. Zhang, Phys. Rev. B, 2018, 97, 075147.
- Kooi and Wuttig 2020 B. J. Kooi and M. Wuttig, Adv. Mat., 2020, 32, 1908302.
- Bera et al. 2013 A. Bera, K. Pal, D. V. S. Muthu, S. Sen, P. Guptasarma, U. V. Waghmare and A. K. Sood, Phys. Rev. Lett., 2013, 110, 107401.
- Ibañez et al. 2016 J. Ibañez, J. A. Sans, C. Popescu, J. López-Vidrier, J. J. Elvira-Betanzos, V. P. Cuenca-Gotor, O. Gomis, F. J. Manjón, P. Rodríguez-Hernández and A. Muñoz, J. Phys. Chem. C, 2016, 120, 10547.
- Efthimiopoulos et al. 2013 I. Efthimiopoulos, J. Zhang, M. Kucway, C. Park, R. Ewing and Y. Wang, Sci. Rep., 2013, 3, 2665.
- Anversa et al. 2016 J. Anversa, S. Chakraborty, P. Piquini and R. Ahuja, Appl. Phys. Lett., 2016, 108, 212601.
- Cheng et al. 2020 H. Cheng, J. Zhang, P. Yu, C. Gu, X. Ren, C. Lin, X. Li, Y. Zhao, S. Wang and Y. Li, J. Phys. Chem, 2020, 124, 3421.
- Kong et al. 2014 P. Kong, F. Sun, L. Xing, J. Zhu, S. Zhang, W. Li, X. Wang, S. Feng, X. Yu, J. Zhu, R. C. Yu, W. Yang, G. Shen, Y. Zhao, R. Ahuja, H. Mao and C. Jin, Sci. Rep., 2014, 4, 6679.
- 31 S. Das, A. Sirohi, G. Kumar Gupta, S. Kamboj, A. Vasdev, S. Gayen, P. Guptasarma, T. Das and G. Sheet, Phys. Rev. B, 97, 235306.
- Matetskiy et al. 2020 A. V. Matetskiy, V. V. Mararov, I. A. Kibirev, A. V. Zotov and A. A. Saranin, J. Condens. Matter Phys., 2020, 32, 165001.
- Hohenberg and Kohn 1964 P. Hohenberg and W. Kohn, Phys. Rev., 1964, 136, B864.
- Kresse and Furthmüller 1996 G. Kresse and J. Furthmüller, Comput. Mat. Sci., 1996, 6, 15.
- Perdew et al. 2008 J. P. Perdew, A. Ruzsinszky, G. I. Csonka, O. A. Vydrov, G. E. Scuseria, L. A. Constantin, X. Zhou and K. Burke, Phys. Rev. Lett., 2008, 100, 136406.
- Perdew et al. 2009 J. P. Perdew, A. Ruzsinszky, G. I. Csonka, O. A. Vydrov, G. E. Scuseria, L. A. Constantin, X. Zhou and K. Burke, Phys. Rev. Lett., 2009, 102, 039902.
- Perdew and Zunger 1981 J. P. Perdew and A. Zunger, Phys. Rev. B, 1981, 23, 5048.
- Grimme 2006 S. Grimme, J. Comp. Chem., 2006, 27, 1787.
- Monkhorst and Pack 1976 H. J. Monkhorst and J. D. Pack, Phys. Rev. B, 1976, 13, 5188.
- Murnaghan 1944 F. D. Murnaghan, Proc. Natl. Acad. Sci., 1944, 30, 244.
- Birch 1947 F. Birch, Phys. Rev., 1947, 71, 809.
- Togo et al. 2008 A. Togo, F. Oba and I. Tanaka, Phys. Rev. B, 2008, 78, 134106.
- Chaput et al. 2001 L. Chaput, A. Togo, I. Tanaka and G. Hug, Phys. Rev. B, 2001, 84, 094302.
- Skelton et al. 2017 J. Skelton, L. Burton, A. Jackson, F. Oba, S. Parker and A. Walsh, Phys. Chem. Chem. Phys., 2017, 19, 12452.
- 45 J. M. Skelton, Phonopy-spectroscopy, https://github.com/JMSkelton/Phonopy-Spectroscopy.
- Togo et al. 2015 A. Togo, L. Chaput and I. Tanaka, Phys. Rev. B, 2015, 91, 094306.
- Page and Saxe 2002 Y. Page and P. Saxe, Phys. Rev. B, 2002, 65, 104104.
- Gaillac et al. 2016 R. Gaillac, P. Pullumbi and F.-X. Coudert, J. Phys. Condens. Matter, 2016, 28, 275201.
- Koc et al. 2012 H. Koc, A. M. Mamedov, E. Deligoz and H. Ozisik, Solid State Sci., 2012, 14, 1211.
- Kuganathan 2009 N. Kuganathan, E-J. Chem., 2009, 6, S147.
- Deringer et al. 2015 V. L. Deringer, R. P. Stoffel, M. Wuttig and R. Dronskowski, Chem. Sci., 2015, 6, 5255.
- Voutsas et al. 1985 G. P. Voutsas, A. G. Papazoglou, P. J. Rentzeperis and D. Siapkas, Z. Kristall., 1985, 171, 261.
- B. Nasr et al. 2011 T. B. Nasr, H. Maghraoui-Meherzi, H. Abdallah and R. Bennaceur, Physica B, 2011, 406, 287.
- Liu et al. 2013 Y. Liu, K. Chua, T. C. Sum and C. Gan, Phys. Chem. Chem. Phys., 2013, 16, 345.
- Lundegaard et al. 2003 L. Lundegaard, R. Miletich, T. Balic-Zunic and E. Makovicky, Phys. Chem. Minerals, 2003, 30, 463.
- Efthimiopoulos et al. 2016 I. Efthimiopoulos, C. Buchan and Y. Wang, Sci. Rep., 2016, 6, 24246.
- Bayliss and Nowacki 2015 P. Bayliss and W. Nowacki, Z. Kristall., 2015, 135, 308.
- Kyono et al. 2002 A. Kyono, M. Kimata, M. Matsuhisa, Y. Miyashita and K. Okamoto, Phys. Chem. Miner., 2002, 29, 254.
- Koc et al. 2014 H. Koc, H. Ozisik, E. Deligöz, A. M. Mamedov and E. Ozbay, J. Mol. Model., 2014, 20, 2180.
- Zahedi and Xiao 2015 E. Zahedi and B. Xiao, Comp. Mat. Sci., 2015, 101, 301.
- Lundegaard et al. 2005 L. Lundegaard, E. Makovicky, T. Ballaran and T. Balic-Zunic, Phys. Chem. Minerals, 2005, 32, 578.
- Efthimiopoulos et al. 2014 I. Efthimiopoulos, J. Kemichick, X. Zhou, S. Khare, D. Ikuta and Y. Wang, J. Phys. Chem. A, 2014, 118, 1713.
- Carey et al. 2014 J. J. Carey, J. P. Allen, D. O. Scanlon and G. W. Watson, J. Solid State Chem., 2014, 213, 116.
- Wang et al. 2018 Y. Wang, M. Yanmei, G. Liu, J. Wang, Y. Li, Q. Li, J. Zhang, Y. Ma and G. Zou, Sci. Rep., 2018, 8, 14795.
- Li et al. 2016 C. Li, J. Zhao, Q. Hu, Z. Liu, Z. Yu and H. Yan, J. Alloys Compd., 2016, 688, 329.
- Mattsson et al. 2008 A. E. Mattsson, R. Armiento, J. Paier, G. Kresse, J. M. Wills and T. R. Mattsson, J. Chem. Phys., 2008, 128, 084714.
- Armiento and Mattsson 2005 R. Armiento and A. E. Mattsson, Phys. Rev. B, 2005, 72, 085108.
- Mattsson and Armiento 2009 A. E. Mattsson and R. Armiento, Phys. Rev. B, 2009, 79, 155101.
- Fan et al. 2014 D. Fan, J. Xu, J. Liu, Y. Li and H. Xie, High Temp. High Press., 2014, 43, 351.
- Sternik and Parlinski 2005 M. Sternik and K. Parlinski, J. Chem. Phys., 2005, 123, 204708.
- da Silva et al. 2015 E. L. da Silva, J. M. Skelton, S. C. Parker and A. Walsh, Phys. Rev. B, 2015, 91, 144107.
- Born 1940 M. Born, Proc. Cambridge Philos. Soc., 1940, 36, 160.
- Dove 1993 M. T. Dove, Introduction to Lattice Dynamics, Cambridge University Press, 1993.
- Dove 2003 M. T. Dove, Structure and Dynamics: An Atomic View of Materials, Oxford Master Series in Physics, 2003.
- Dove 2015 M. T. Dove, Am. Min., 2015, 82, 213.
- Venkataraman 1979 G. Venkataraman, Bull. Mater. Sci., 1979, 1, 129.
- Di Gennaro et al. 2013 M. Di Gennaro, S. Saha and M. Verstraete, Phys. Rev. Lett., 2013, 111, 025503.
- Karki et al. 1997 B. B. Karki, G. J. Ackland and J. Crain, J. Phys. Condens. Matter., 1997, 9, 8579.
- Mouhat and Coudert 2014 F. Mouhat and F.-X. Coudert, Phys. Rev. B, 2014, 90, 224104.
- Pfeiffer 2009 S. Pfeiffer, PhD thesis, Universität Stuttgart, 2009.
- Manjón et al. 2013 F. J. Manjón, R. Vilaplana, O. Gomis, E. Pérez-González, D. Santamaría-Pérez, V. Marín-Borrás, A. Segura, J. González, P. Rodríguez-Hernández, A. Muñoz, C. Drasar, V. Kucek and V. Muñoz Sanjosé, Phys. Status Solidi B, 2013, 250, 669.
- Vilaplana et al. 2011 R. Vilaplana, D. Santamaría-Pérez, O. Gomis, F. J. Manjón, J. González, A. Segura, A. Muñoz, P. Rodríguez-Hernández, E. Pérez-González, V. Marín-Borrás, V. Muñoz Sanjose, C. Drasar and V. Kucek, Phys. Rev. B, 2011, 84, 184110.
- Vilaplana et al. 2018 R. Vilaplana, S. G. Parra, A. Jorge-Montero, P. Rodríguez-Hernández, A. Munoz, D. Errandonea, A. Segura and F. J. Manjón, Inorg. Chem., 2018, 57, 8241.
- Vilaplana et al. 2013 R. Vilaplana, O. Gomis, F. J. Manjón, H. M. Ortiz, E. Pérez-González, J. López-Solano, P. Rodríguez-Hernández, A. Muñoz, D. Errandonea, V. V. Ursaki and I. M. Tiginyanu, J. Phys. Chem., 2013, 117, 15773.
- Cuenca-Gotor et al. 2016 V. P. Cuenca-Gotor, J. A. Sans, J. Ibáñez, C. Popescu, O. Gomis, R. Vilaplana, F. J. Manjón, A. Leonardo, E. Sagasta, A. Suárez-Alcubilla, I. G. Gurtubay, M. Mollar and A. Bergara, J. Phys. Chem., 2016, 120, 19340.
- Lindberg and Weinstein 2016 G. P. Lindberg and B. A. Weinstein, Phys. Rev. B, 2016, 94, 134102.
- Manjón et al. 2021 F. J. Manjón, S. Gallego-Parra, P. Rodríguez-Hernández, A. Muñoz, C. Drasar, V. Muñoz-Sanjosé and O. Oeckler, J. Mater. Chem. C, 2021, 9, 6277.
- Wang et al. 2018 R. Wang, F. R. L. Lange, S. Cecchi, M. Hanke, M. Wuttig and R. Calarco, Adv. Funct. Mater., 2018, 28, 1705901.
- Wilson and Yoffe 1969 J. Wilson and A. Yoffe, Adv. Phys., 1969, 18, 193.
- Cheng et al. 2019 Y. Cheng, O. Cojocaru-Mirédin, J. Keutgen, Y. Yu, M. Küpers, M. Schumacher, P. Golub, J.-Y. Raty, R. Dronskowski and M. Wuttig, Adv. Mat., 2019, 31, 1904316.
- Cheng et al. 2017 H. Cheng, J. Zhang, Y. Li, G. Li and X. Li, J. Appl. Phys., 2017, 121, 225902.
- Sans et al. 2020 J. A. Sans, R. Vilaplana, E. L. da Silva, C. Popescu, V. P. Cuenca-Gotor, A. Andrada-Chacón, J. Sánchez-Benitez, O. Gomis, A. L. J. Pereira, P. Rodríguez-Hernández, A. Muñoz, D. Daisenberger, B. García-Domene, A. Segura, D. Errandonea, R. S. Kumar, . Oeckler, P. Urban, J. Contreras-García and F. J. Manjón, Inorg. Chem., 2020, 59, 9900.
- Morin et al. 2015 C. Morin, S. Corallini, J. Carreaud, J.-B. Vaney, G. Delaizir, J.-C. Crivello, E. B. Lopes, A. Piarristeguy, J. Monnier, C. Candolfi, V. Nassif, G. J. Cuello, A. Pradel, A. P. Goncalves, B. Lenoir and E. Alleno, Inorg. Chem., 2015, 54, 9936.
- NAK 1963 J. Phys. Chem. Solids, 1963, 24, 479.
- Adam 2007 A. Adam, Mater. Res. Bull., 2007, 42, 1986–1994.
- Anderson and Krause 1974 T. L. Anderson and H. B. Krause, Acta Crystallogr. B, 1974, 30, 1307.
- Vereshchagin et al. 1965 L. Vereshchagin, E. Itskevich, E. Atabaeva and S. Popova, Fiz. Tverd. Tela, 1965, 6, 2223.
- Atabaeva et al. 1973 E. Atabaeva, N. Bendeliani and S. Popova, Fiz. Tverd. Tela, 1973, 75, 3508.
- Y. et al. 1973 A. E. Y., M. S. A. and P. S. V., Kristallografiya, 1973, 18, 173.
- Lityagina et al. 2015 L. Lityagina, L. Kulikova, I. Zibrov, T. Dyuzheva, N. Nikolaev and V. Brazhkin, J. Alloys Compd., 2015, 644, 799.
- Kirkinsky et al. 1985 V. A. Kirkinsky, A. P. Ryaposov and V. G. Yakushev, in Chalcogenides of As, Sb and Bi under High Pressures, pp. 108, Novosibirsk: Nauka, 1985, p. 108.
- Kirkinsky et al. 1969 V. A. Kirkinsky, A. P. Ryaposov and V. G. Yakushev, Fiz. Tverd. Tela, 1969, 11, 2382.