Photoionisation cross sections of ultracold 88Sr in 1P1 and 3S1 states at 390 nm and the resulting blue-detuned magic wavelength optical lattice clock constraints
Abstract
We present the measurements of the photoionisation cross sections of the excited 1P1 and 3S1 states of ultracold 88Sr atoms at 389.889 nm wavelength, which is the magic wavelength of the 1S0-3P0 clock transition. The photoionisation cross section of the 1P1 state is determined from the measured ionisation rates of 88Sr in the magneto-optical trap in the 1P1 state to be 2.20(50)10-20 m2, while the photoionisation cross section of 88Sr in the 3S1 state is inferred from the photoionisation-induced reduction in the number of atoms transferred through the state in an operating optical lattice clock to be 10-18 m2. Furthermore, the resulting limitations of employing a blue-detuned magic wavelength optical lattice in strontium optical lattice clocks are evaluated. We estimated photoionisation induced loss rates of atoms at 389.889 nm wavelength under typical experimental conditions and made several suggestions on how to mitigate these losses. In particular, the large photoionisation induced losses for the 3S1 state would make the use of the 3S1 state in the optical cycle in a blue-detuned optical lattice unfeasible and would instead require the less commonly used 3D1,2 states during the detection part of the optical clock cycle.
1 Introduction
Optical atomic clocks have proven to be excellent research instruments in various fields ranging from ultra-precise metrology [1, 2, 3, 4, 5], tests of fundamental physics [6, 5] to searches for new matter in astrophysics [7, 8, 9, 10]. Along with improving atomic optical clocks, the factors limiting their performance have become increasingly important. The perturbing effects induced by the environment, like light shifts [11], black-body radiation (BBR) shifts [12], and collisional shifts [13], are matters of growing experimental concern. Several solutions have been implemented to counteract these undesirable effects, like Pauli blocking mechanism [14, 15], temperature decreasing through cryogenic systems [16], and light shift cancellation by magic-wavelength-based optical traps [17, 18].
A blue-detuned optical trap has been proposed as an alternative to commonly used red-detuned optical traps [19]. In blue-detuned optical traps, atoms are confined near the minimum of light intensity, leading to a significant reduction of light-induced perturbations. On the other hand, if the energy of the blue-detuned trapping light photon is above the atomic ionisation threshold, it may lead to atomic losses. Moreover, they were proposed together with the red-detuned conveyor belt optical lattice as a way to realise an active optical atomic clock based on superradiance [20]. In the present work, we analyse the feasibility of the blue-detuned magic wavelength for the optical trapping of strontium atoms and possible atomic losses due to photoionisation.
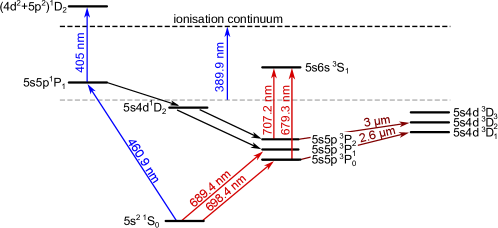
A blue-detuned magic wavelength for the 1S0-3P0 clock transition in 87Sr was experimentally determined to be 389.889(9) nm [19]. While these blue-detuned magic wavelength photons do not have sufficient energy to ionise the atoms directly from the strontium clock (1S0 and 3P0) states, other states that are involved during the normal operation of the strontium optical lattice clock are potentially affected by the photoionisation (see the region between the dashed lines in Fig. 1). For instance, the first stage of cooling down the atoms before loading them into the optical lattice is generally based on the 1S0-1P1 transition (460.9 nm in Fig. 1), and the repumping during detection is based on the 3P0-3S1 and 3P2-3S1 transitions (679.3 nm and 707.2 nm, respectively, in Fig. 1) [21, 22, 23].
To determine photoionisation cross sections for and levels, we used two different experimental methods. To investigate the photoionisation effect on the 1P1 state, we compared the dynamics of loading atoms into the magneto-optical trap (MOT) with and without the ionising blue-detuned magic wavelength 389.889 nm light, alternately. To measure the photoionisation cross section for 3S1 state, we detect atomic losses from the optical lattice trap induced by the presence of an ionisation laser beam at blue-detuned magic wavelength during the strontium optical lattice clock operation. The results of both measurements were used to analyse how the photoionisation by the blue-detuned magic wavelength light affects the performance of the optical atomic clocks under typical experimental conditions. Since the magic wavelength does not depend heavily on the particular isotope, as was shown for the red-detuned magic wavelength of Sr at 813 nm [24], we based our research on a more abundant bosonic 88Sr isotope without limiting the generality of our results.
2 Experiment
2.1 Experimental setup
The photoionisation experiment has been performed on the Sr optical lattice atomic clock setup described in detail in [25] operating on 88Sr bosonic isotope. A basic cycle of this clock consists of cooling and loading atoms into a 1D red-detuned optical lattice trap, an interrogation of the clock transition by an ultra-stable clock laser, and detection of the resulting atomic population in the ground () and the excited () clock states [21]. Cooling and loading of atoms into the optical lattice trap are achieved by two consecutive MOTs, operating on the - (blue MOT) and - (red MOT) transitions, respectively. The clock - transition is interrogated by the -pulse Rabi excitation. The clock cycle is concluded by the detection phase that measures the ratio of populations in and states with the help of an electron shelving scheme [26], including fluorescence imaging on - transition and optical pumping on - and - transitions.
The photoionisation laser beam is synthesised via frequency doubling of a TiSa tunable laser light inside a bow-tie enhancement cavity. The resulting laser beam is spatially filtered with polarisation-maintaining single-mode fibre and expanded by sets of lenses to either =7.034(85) mm and =6.07(30) mm or =2.19(11) mm and =1.88(12) mm beam waist radii and directed on atoms trapped by the blue MOT or the optical lattice trap, respectively. The diameter of the ionisation beam is much larger than the typical dimensions of atomic clouds, i.e., 2.4 mm 2.4 mm and 157 µm 66 µm for blue MOT and the optical lattice, respectively. The frequency of the ionising laser is stabilised to a wavemeter through an analogue feedback loop with an accuracy better than 100 MHz.
2.2 Photoionisation of the
To determine photo-induced losses from the 1P1 state due to blue-detuned magic 389.889 nm light, we analysed the fluorescence signal at 461 nm emitted by 88Sr atoms during the blue MOT loading phase. To ensure that the is the only possible ionised state, the repumping laser beams for the and states were switched off (see Fig. 1). The photoionisation cross section was determined by comparing the loading rates of the MOT fluorescence with and without the photoionising 389.889 nm light. This technique has proven very efficient in measuring absolute ionisation cross sections of trapped atoms [27, 28].
The rate equation for the number of atoms loaded into the MOT can be expressed as [29]
| (1) |
where is the MOT loading rate, is the combined loss coefficient due to collisions with background gases, optical pumping to the metastable states and other possible single atom losses, is the loss coefficient due to photoionisation, is the loss coefficient due to light-assisted collisions between Sr atoms, and is the spatial density of trapped atoms. In this approach, photoionisation is considered as another mechanism of losses, linearly dependent on the number of atoms. The approach is valid if the photoionising beam does not modify the density distribution of the MOT (e.g. by a dipole force), which is always fulfilled in our setup.
The experiment was performed in the low-density regime, which means that the mean free path of the atoms is larger than the size of the trapped atomic cloud. A typical number of strontium atoms in a blue MOT of a diameter of 2 mm is 6108 [25]. It gives an atomic density of 1011 cm-3. Using the 88Sr collision cross-section of 10-13 cm2 [30], the mean free path of the atoms trapped in the blue MOT is 100 cm, which is very large compared to the size of the MOT. The low-density regime enables us to neglect the last term in Eq. (1) as the collisions between trapped atoms are negligible. This yields the simplified rate equation
| (2) |
Integration of Eq. (2) over time gives the formula for the dependence of the number of atoms on time during MOT loading
| (3) |
where .
The loss coefficient is related to the intensity of the ionising light through the expression
| (4) |
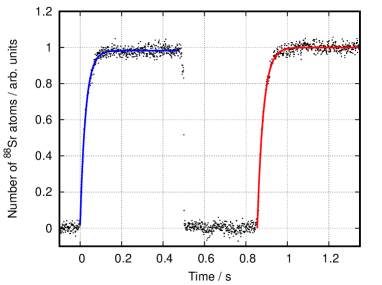
where is the fraction of atoms in excited state, is the photoionisation cross section, and is the ionising photon flux. The frequency is determined with the type B standard uncertainty derived from the accuracy of the wavemeter. To find the value of the coefficient, two blue MOT loading curves were recorded sequentially in the presence and absence of the photoionisation laser beam (see Fig. 2). By fitting Eq. (3) independently to both curves, we obtained loading rates and and determined by their difference. The typical loading curves detected in the experiment are presented in Fig. 3. For these curves, the loss coefficients are =34.08(80) s-1 and =37.9(1.5) s-1, which corresponds to the reduction of the 1/e MOT loading time from 29.34(69) ms to 26.4(1.0) ms. To block the scattered light from the ionisation laser, the blue MOT fluorescence was filtered by a 461 nm interference filter and then focused on a photodiode.

To determine the fraction of atoms in the excited state a model for two-level system was used
| (5) |
where is the total intensity of the blue MOT trapping laser light, is the - transition saturation intensity (427 W/m2), is the natural decay rate of the excited 1P1 state ( MHz) and is the trapping laser detuning from resonance (typically 2). The population fraction of the atoms in 1P1 state was varied by changing the trapping laser intensity. To calibrate the trapping laser intensity, a small portion of the trapping 461 nm laser light was uncoupled before splitting and sent to a photodetector to monitor the intensity .
The detuning was continuously measured by an optical frequency comb. The related uncertainties and were determined as standard deviations of their means. The intensity of the trapping laser light and its detuning from the resonance were continuously recorded by data acquisition software. The trapping beam is expanded to a diameter of 2 cm and is split into three retro-reflected beams. The typical value of the total intensity of the blue MOT trapping laser light seen by atoms, taking into account losses on viewports and optics, is 30 W/m. The methods that calibrate population dependence on the MOT beams intensity, described e.g. in [31, 28], are not used here since they require laser light intensities exceeding the saturation of the transition. Instead, the measured values of and are directly used in Eq. (5).
2.3 Photoionisation of the
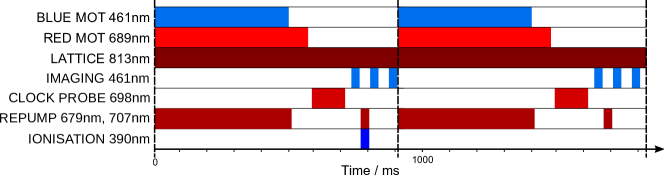
To measure the photoionisation cross section of state at 389.889 nm, we employed a different experimental approach. The experiment was performed during the standard clock cycle of the strontium optical lattice clock described in detail elsewhere [25]. The timing sequence of the laser beams used in the experiment is shown in Fig. 4. After sequential cooling in blue and red MOT Sr, atoms are transferred into the 1D vertical red-detuned magic wavelength optical lattice at 813 nm and interrogated by an ultrastable clock laser. The clock laser is locked to the - transition in the second, independent strontium optical lattice clock. The clock laser interrogation pulse, long with respect to the transition Rabi frequency, is applied exactly on the transition centre frequency and excites one-half of the atoms () to the state while the rest of the atoms () remain in the ground state. Subsequently, after that, Sr atoms initially excited to the state are pumped back to the ground state through the , , and states with 679.3 nm and 707.2 nm transitions (see Figs. 1 and 4). The number of previously excited atoms is then determined by the second imaging pulse at 461 nm. The detection is concluded by a background image of the empty trap.
A pulse of the photoionising beam added during the repumping phase of the first clock cycle opens a new channel of losses due to photoionisation from the 3S1 state. Therefore, it decreases repumping efficiency and, consequently, reduces the number of atoms recorded by the second imaging pulse. The photoionisation cross section is inferred from the photoionisation-induced reduction in the number of atoms , where and are the excited-state populations detected sequentially in the presence (the first cycle in Fig. 4) and absence of the photoionisation beam (the second cycle in Fig. 4), respectively.
3 Results
3.1 Photoionisation cross section at blue magic wavelength
The photoionisation cross section was determined from the loss coefficient and characteristics of both the blue MOT and the ionising beam. The atomic distribution in the blue MOT detected by a CCD camera is well described by the Gaussian-like profile
| (6) |
where are MOT radii (about 1.2 mm, typically). The averaged intensity of the ionising light seen by atoms in the blue MOT is given by
| (7) |
where is the total number of atoms in the MOT, and and are distributions of the intensity of the beam and the atoms, respectively. The intensity profile of the photoionising beam was determined by a CCD beam profiler measurement and corrected with the coefficient of transmission through the vacuum chamber viewports. The intensity of the ionising light was power-locked and continuously monitored by a photodiode, and the related uncertainty was calculated as a standard error of the mean of the recorded photodiode readout. The photodiode was calibrated based on the uncertainties related to the atomic distribution, namely and .
The photoionisation cross section was calculated according to Eq. (4) by combining the measured values of the excited state fraction , loss coefficient , and the intensity , monitored and recorded during measurements. We recorded 12 to 20 pairs of MOT loading curves sequentially with (the first curve) and without the photoionisation beam (the second curve) for each wavelength of the photoionisation beam separately. For each pair of curves, we determined the ionisation loss rate as the difference , where and were determined by fitting the Eq. (3) to the first or the second curve, respectively. The uncertainty was calculated independently for each wavelength as the standard deviation of the mean. Finally, the uncertainty of the photoionisation cross section was calculated as a combined standard uncertainty with several independent quantities, namely , , , , and .
To verify our experimental method, we extended the range of photoionisation wavelengths to cover the autoionisation resonance near 405 nm [32, 33, 34]. This way, we enabled comparison with previous measurements of the autoionisation resonance performed with different experimental approaches [35, 36]. The measurements of were carried out for wavelengths in a range from 378.4 nm to 407 nm. The results are shown in Fig. 5.
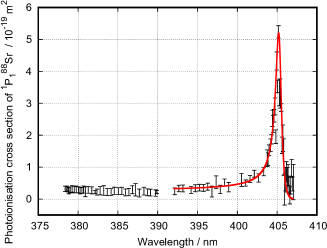
By fitting a Fano profile [37] to the measured points, we determined the position of the resonance and its peak value to be =405.196(44) nm and =5.20(94)10-19 m2, respectively. To exclude another possible resonance observed on the high energy wing of the measured photoionisation spectra, the fitting range was limited to the experimental points above 392 nm. The gap in results between 390 nm and 392 nm is due to technical problems related to the locking of TiSa laser within the corresponding range. Our results are consistent with the results presented previously by Mende et al. (=405.213(2) nm, = 5.6(1.1)10-19 m2) [35] and by Sami-ul-Haq et al. (= 405.177(16) nm, =5.45(98)10-19 m2) [36]. Note that previous measurements, unlike ours, did not involve cold atomic samples.
At the blue magic 389.889 nm wavelength, the photoionisation cross section is equal to 2.20(50)10-20 m2 (see Fig. 5). Our result is consistent with the value deduced from the curve reported by Mende et al. [35] 1.46(29)10-20 m2, within the 20% uncertainty claimed by the author. In our case, the most significant factor contributing to the uncertainty of comes from the fluctuation of the number of atoms loaded into the blue MOT. The atom number fluctuation affects the fitting uncertainty, however, as the statistical error, it is averaged, and it does not contribute to the final result, only to its uncertainty.
In the second set of experiments, the photoionisation cross section from the excited state was determined by
| (8) |
where and are the averaged excited state population and its averaged photoionisation-induced reduction during the repumping through the state, respectively, is the averaged intensity of the photoionisation radiation seen by atoms in the optical lattice calculated according to Eq. (7), and is the interaction time between photoionisation beam and the atoms in the state. The value of 43 ns was determined on the basis of both and transition probabilities [38] and the natural lifetime of the state [39, 40]. Additionally, in calculating the interaction time , we included repumping to the excited state back from and states. The ionisation beam was power-locked with an intensity of 26270(80) W/m2 at the Gaussian-profile peak. The diameters of the beam (2.19(11)1.88(12) mm) are much larger than the dimensions of the illuminated atomic cloud (157(10) µm x 66(6) µm). To ensure the stability of the number of atoms throughout each experimental cycle, we monitored both ground-state populations and independently. The experimental points satisfying the relation were excluded resulting in 3292 points left for further analysis. To be less prone to the oscillations of the number of atoms, we made the interleaved measurements randomly staggered by the manual triggering of consecutive cycles.
The determination of the cross section based on Eq. (8) yields 10-18 m The uncertainty of the was calculated as the combined standard uncertainty involving the uncertainties , , , and . The frequency type B uncertainty is derived from the resolution of the wavemeter. All the other terms are calculated as the standard deviations of their means.
3.2 Study of feasibility: strontium optical clock with blue-detuned magic wavelength optical lattice
In this section, we use our measured photoionisation cross sections of and states to estimate the impact of the loss of the atoms from these states due to the ionisation in a blue-detuned magic wavelength optical lattice on an optical strontium clock operation and suggest possible mitigation measures.
As mentioned above, in a blue-detuned magic wavelength optical lattice, atoms are confined at the minima of light intensity as opposed to a red-detuned magic wavelength optical lattice. However, the atoms cannot be trapped in a simple 1D blue-detuned magic wavelength lattice trap because they will escape along the radial directions. Confinement in all three orthogonal directions can be achieved, for instance, by a 3D optical lattice trap, made up of three independent 1D optical lattices [41]. Moreover, a 3D optical lattice will reduce the influence of interactions between atoms on the optical clock’s accuracy [42].
To reach the accuracy goal of state-of-the-art optical lattice clocks, all frequency shifts connected with motional effects must be suppressed. When each atom is confined in a single lattice site to a region much smaller than the wavelength of the clock probing laser, and any tunnelling between sites is negligible, the Doppler and recoil shifts are suppressed, and the atoms are in the Lamb-Dicke regime [43, 44]. This implies different limits on minimal required potential depth depending on the direction of the probing of the clock transition by a clock laser beam, either horizontal or vertical. On the other hand, higher potential means higher losses due to photoionisation.
3.2.1 Horizontal direction
In a horizontal periodic potential, the states with the same vibrational quantum number in different potential wells are degenerated in energy, amplifying tunnelling between the wells. This will spread out the spatial wave functions of the atoms so that they are not localised to a single well and create a band structure in their energy spectrum. This yields, depending on the initial state of the atoms in the trap, a broadening and a shift of the atomic transition of the order of the bandwidth of the lowest energy band of the system [45]. Figure 3 of [45] shows the corresponding bandwidth with the bandwidth in units of the recoil energy associated with the absorption or emission of a photon of the lattice light and in Hz units calculated for 813 nm magic wavelength.
Since the recoil energy scales like , where is the wavenumber of the lattice light, in the blue-detuned lattice, for instance, the bandwidth of mHz, corresponding to the accuracy range, requires the potential depth above
3.2.2 Vertical direction
For a vertical clock laser probe beam, the approach from the previous subsection is no longer valid due to the presence of gravity. In the periodic potential in an accelerated frame, energies of atoms in adjacent lattice sites are shifted, and the Hamiltonian no longer supports bound states. This means that an atom in a vertical optical lattice will eventually tunnel to a continuum. Fortunately, the timescale of this process increases exponentially with lattice depth [45], and this is not an issue with the lattice depths considered here. Therefore, we must adopt the formalism of Wannier-Stark states [46]. The external Hamiltonian of an atom with mass in a vertical lattice optical trap of the depth is given as
| (9) |
where is the atom quasimomentum in z-direction. The eigenstates of this Hamiltonian are called Wannier-Stark states , where denotes th well of the lattice. We have constructed the Wannier-Stark state as the sum of Wannier states in different lattice sites (i.e. the eigenstates of Hamiltonian in Eq. (9) without gravity) where every Wannier function is weighed by the appropriate Bessel function [47]. Fig. 6 shows the spatial representation of Wannier-Stark states centred around site for different values of the lattice depth . The states are calculated for 390 nm blue-detuned lattice and, for comparison, for widely-used 813 nm red-detuned lattice. In both cases, we assumed that the tunnelling between different energy bands is negligible, i.e. the atom can only tunnel between lattice sites of the ground energy band.
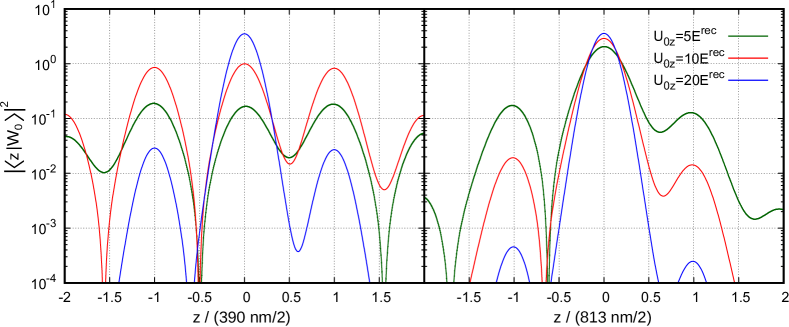
As seen in Fig. 6, for an 813 nm red-detuned optical lattice, the Wannier-Stark state consists of a main central peak and two smaller "revival" peaks in the adjacent wells, even for shallow lattices. These revival peaks decay quickly with increasing lattice depth, with revival peaks being hundred times smaller at lattice depths of and the wave function being practically localised to one lattice site[45]. To achieve similar ratios of the main and side peaks for a 390 nm blue-detuned lattice, the lattice should be at least twice as deep, i.e. because of the shorter distance between lattice sites and thus smaller energy shifts in the adjacent sites.
To examine the effects of coupling the Wannier-Stark states to their neighbours by the 1S0-3P0 probe beam, we consider the Wannier-Stark ladder of states with an internal two-level energy structure . The Wannier-Stark ladder is a set of Wannier-Stark states with one state in each lattice site. Wannier-Stark states in the adjacent lattice sites are separated in energy by corresponding to the change in gravitational potential between sites. For Sr, this separation between adjacent sites is equal to Hz for 390 nm blue-detuned lattice. The energy difference between the ground state and the excited state of the atom is given by . The probe beam couples the and states with different coupling strengths , where and for coupling of WS states in the same lattice site and for coupling to neighbouring lattice sites, respectively. This coupling corresponds to a translation in momentum space [45]:
| (10) |
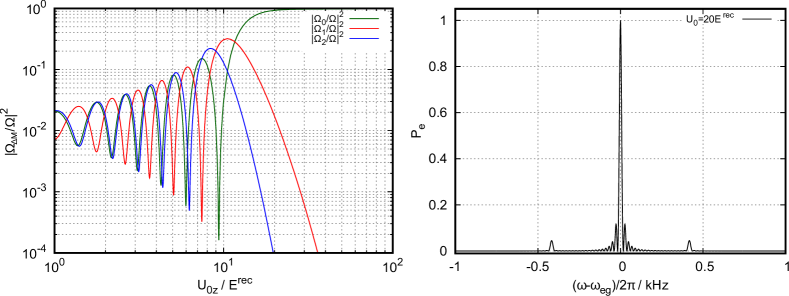
where is the wavevector of the coupling probe laser and is the Rabi frequency. The relative coupling strengths of the "carrier" and the first 4 "sidebands" as a function of lattice depth are shown in Fig. 7 (left). For very shallow optical lattices with depths below the couplings show strong oscillations similar to those in [48]. For higher lattice depths, couplings to neighbouring lattice sites rapidly decay and the atom becomes trapped in a single lattice with strong suppression of tunnelling between sites. Additionally, Fig. 7 (left) shows that for shallow lattice it is possible to choose different ratios of coupling parameters by tight control of lattice depth. This control over coupling parameters allows engineering of the extent of atomic wavefunctions through the adjustment of trap depth and thereby lowering the collisional frequency shifts arising the on-site p-wave and neighbouring-site s-wave interactions, as done for 813 nm optical lattice[49]. For lattice depth of , coupling strengths to the nearest and second-nearest lattice site are and times weaker than coupling between the ground and excited WS state in the same lattice site.
To calculate the populations of the ground and excited WS states, we considered the evolution of the different states under coupling to the probe laser by numerically solving the set of differential equations [45]
| (11) | |||
where and are the probability amplitudes of the ground and excited state, respectively, and . In these calculations we assume that the atom can only tunnel to the nearest lattice site and the initial state is a pure WS state.
The computed resonances for a blue-detuned vertical optical lattice with depth of , an effective Rabi frequency Hz and interaction time of 50 ms are shown in Fig. 7 (right). The central resonance corresponds to the clock transition frequency and two frequency sidebands located at arise from weak tunnelling of atoms to neighbouring sites and are completely symmetric with respect to the central resonance.
The results presented in Figs. 7 shows that the blue-detuned vertical lattice with depth of has similar level of suppression of the tunelling and of the effects of the atom dynamics as the deep red-detuned optical lattice [45]. To hold the atoms in a 3D blue-detuned magic lattice, it is required that the energies of the first few lattice states are smaller than the lattice depth. The 20 trap depth corresponds to around 14 µK and it is sufficiently deep to hold atoms cooled down by using the - (red MOT) transition — typical temperatures achieved in the last cooling stage are of the order of 1 µK.
3.2.3 Photoionisation losses due to blue magic lattice
The previous subsections show that the minimal required optical trap potential depth for an effective operation of an optical strontium clock based on the blue-detuned 390 nm magic wavelength is on the order of , assuming vertical probing of the clock transition. Now we want to estimate the losses due to the presence of the 3D blue-detuned lattice potential during a commonly used optical strontium clock operation cycle.
To characterise the photoionisation losses, we consider two parts of the clock cycle when atoms are being cooled and trapped by the blue MOT and when the atoms are already loaded into the optical lattice. We assume that the 3D lattice potential is present during the whole clock cycle.
Atoms trapped in the blue MOT
The photoionisation losses can lower the total number of the atoms loaded into the blue MOT, which would decrease the number of atoms transferred into the 3D optical lattice trap and consequently lower the signal-to-noise ratio of the observed clock line. In the blue MOT phase atoms are cooled and trapped through the 1P1 state. About % of atoms escape the closed cooling transition 1SP1 and must be repumped. Typically, the repumping through the 3S1 state is chosen [50]. However, as the photoionisation of the state by the blue-detuned light at 390 nm is significant, a different repumping scheme, e.g., through the state [51, 52], is preferable.
In most of the present realisations of optical lattice clock, the centres of the blue MOT and the lattice trap overlap and the waist of the 1D optical lattice is much smaller than the atomic cloud trapped in the blue MOT. At the same time, with some notable exceptions [53], the optical lattice is shallow in comparison with the temperature of blue MOT atoms and they can freely pass the optical lattice area. Therefore, any losses due to photoionisation in the blue MOT due to the blue magic 3D lattice can appear only when atoms are passing the optical lattice region.
To estimate the losses, we assume a typical blue MOT condition with maximum total intensity of the trapping beams equal to 30 W/m2 and their detuning from atomic resonance , and use Eq. (5) to calculate the relative population of atoms in the 1P1 state, .
For the specific case of equal depths of all three blue detuned 1D lattices, and each of the depths equals to considered in the previous subsection, the intensity (averaged over time and space) of the 390 nm light experienced by the atoms passing the optical lattices periodic potentials, is W/m2. The resulting loss coefficient (Eq. (4)) is equal to s-1.
Assuming that blue MOT lifetime is limited by the collisions with the residual background gas molecules, the order of magnitude of the loss coefficient in rate Eqs. (1 - 3) in real experimental system can be approximated by the collisional loss rate due to the collisions with H2 reported in [54], resulting in s-1 at the vacuum of mbar. The loss rate connected with atoms’ decay to metastable state in the case of operating blue MOT without repumpers is around 35 s-1. Therefore, Eq. (3) shows that the blue MOT will be effectively depleted in the region where it overlaps with the 3D optical lattice trap made of three deep 1D optical lattices.
To overcome this loss of atoms, one can reduce the lattice intensity or even turn off the lattice beams during the blue MOT phase. Temporary switching off lattice light is technically feasible, e.g. with the power build-up cavity installed inside the vacuum setup on a low expansion glass spacer. The lattice laser can be safely switched back on and relocked during the red MOT phase, which lasts a few tens of ms. Another possibility is to store cold atoms during the blue MOT phase in the dark state [55] or to use cold atomic beam loading directly the red MOT [56].
Atoms trapped in the 3D optical lattice
After the interrogation of the clock transition, the populations of the ground and excited states are determined using the optical repumping through the 1P1 and 3S1 states, as discussed before. The effective intensity of the ionising light seen by an atom trapped in the motional ground state of the optical lattice is determined by the modulus of its wave function , approximated in horizontal and vertical directions by Wannier and Wannier-Stark states, respectively. Due to the short lifetimes of the atoms in the 3S1 state, the spatial distribution of the atoms is determined by their preceding, metastable 3P0 state (the short lifetime prevents changing the shape of the distribution in the new potential corresponding to the 3S1 state polarisability before they decay to the lower states, which are not susceptible to photoionisation). The 88Sr atoms have the same polarisabilities in the 3P0 and 1S0 states at the optical trapping magic wavelength (at 389.889 nm these polarisabilities are equal to 459 a.u. as calculated using the data in Ref. [57]), therefore in our calculations, we have used numerically calculated Wannier and Wannier-Stark states for a given potential scaled in the units of .
The effective intensity from 1D lattice along axis is calculated by
| (12) |
w here is the standing wave intensity distribution and is the maximum intensity of each of 1D traps in direction. It should be pointed out that the effective intensity is calculated differently than the average intensity from Eq. 7. is the average intensity of light from a single non-reflected photoionization beam with Gaussian intensity distribution, whereas the is the effective intensity which induces photoionization of atoms in the ground Wannier or Wannier-Stark state of the blue-detuned optical lattice periodic potential.
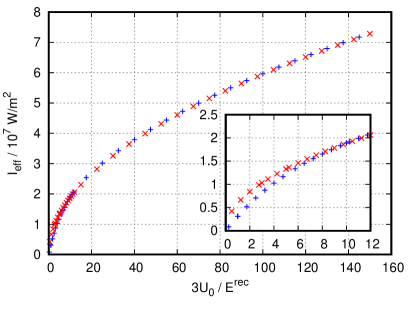
Figure 8 depicts the dependence of the total effective intensity in 3D lattice on the total amplitude of the potential . The blue crosses depict the values numerically calculated for Wannier-Stark (Wannier) states for the vertical (horizontal) directions in an optical lattice. In general, for deep enough optical lattice traps the calculations can be greatly simplified by approximating the system in Eq. (12) by a harmonic potential and its Gaussian ground states, which yields a square-root dependence of the effective intensity on the lattice potential (red crosses).
In the considered lattice consisting of three independent 1D lattices, each deep, the W/m2. To calculate the rate of losses for 3S1 state, we replace in Eq. 4 the average intensity with the effective intensity . The resulting rate of losses of atoms in the 3S1 state due to photoionisation is s-1, which
is of the order of
the 3S1 state decay rate due to
the natural lifetime.
Such a large loss rate significantly limits the applicability of the blue magic lattice with a -based repumping scheme.
A possible solution is to employ an alternative repumping scheme through the states (see Fig. 1). As these states lie below the photoionisation threshold for blue-detuned optical lattice, they are not affected by the photoionisation induced losses from 390 nm wavelength light. However, the high IR wavelengths of 2.6 µm for the 3P0-3D1 and 3 µm for the 3P2-3D2 transition make the use of these transitions experimentally challenging as the lasers at these wavelengths are often not readily available. Additionally, the longer lifetimes of µs for 3D1[1] and µs for 3D2 state (the value deduced from the energy diagram in [51]) would require longer repumping times during the detection of the clock transition.
3.2.4 AC Stark shift from independent 1D lattices
To prevent interference between independent 1D lattices, small frequency detunings must exist between the light of each of the 1D lattices. While the detuning from the magic wavelength of the 1D lattice optical clock would add a considerable light shift to the clock frequency, in the 3D lattice the effective light shift can be still controlled at the required level. One can assume that the 1D optical lattice in the clock laser interrogation axis can be precisely tuned to the magic wavelength. With blue detuned optical lattice, all higher-order effects will be suppressed as atoms are trapped close to the intensity minimum. According to our calculations, a trapping depth of 20 is enough for clock operations in the vertical direction. Tunnelling in horizontal directions do not have to be suppressed that well, and we assume individual trap depth to be 20 as well. With the vertical lattice tuned to the magic wavelength, the required minimal detuning of two other individual lattice beams is determined by the atomic oscillation period and thus by the trap frequency. For a trapping depth of 20 , the trap frequency is around 135 kHz. With detuning around a few times the trap frequency, we can assume that potential can trap atoms efficiently. Both horizontal lattice beams can be detuned to opposite sides of magic wavelength, which in case of identical intensity and almost perfectly linear light shift scaling around magic wavelength [19] should cancel out individual light shifts. If we assume detuning of plus and minus 500 kHz of each horizontal lattice beam and a relative intensity difference of 3%, the induced effective light shift from detuning from both horizontal lattice beams can be controlled to the level of around . For both horizontal lattices detuned by 1 MHz and an intensity mismatch of 5%, the induced effective light shift is still around . For this estimation, we use the dependence of the intensity seen by atoms calculated in subsection 3.2.3.
4 Conclusion
In conclusion, we have determined the values of the 88Sr photoionisation cross section at blue-detuned magic wavelength 389.889 nm to be 2.20(50)10-20 m2 and 10-18 m2, for the excited states 1P1 and 3S1, respectively. Additionally, we have measured the photoionisation cross section for the 1P1 state in a range from 378.4 nm to 407 nm and determined the position and the peak value of the autoionisation resonance (4d2+5p2) to be 405.196(44) nm and 5.20(94)10-19 m2, respectively. These results are consistent with the results previously reported [35, 36], which, unlike ours, did not involve cold atomic systems.
To examine the potential feasibility of the blue-detuned magic wavelength strontium optical lattice trap, we have estimated photoionisation-induced atomic losses in a three-dimensional optical lattice trap operating at the minimal intensity required to fulfil the Lamb-Dicke regime [43, 44] for the clock transition. For a 3D lattice with lattice depths of we found the rate of photoionization losses for 1P1 and 3S1 to be s-1 and s-1, respectively, and we have compared these losses with other channels of atomic losses during the standard operation of an optical lattice strontium clock. We also make several suggestions on mitigating the photoionisation losses for 1P1 and states, thus ensuring that neither of these loss channels is a critical defect for a blue-detuned lattice clock. In particular, the large photoionisation loss rate in the blue-detuned optical lattice makes the use of 3S1 state in the optical clock cycle unfeasible and would instead require the use of the less commonly 3D1 state which, while feasible, adds additional experimental difficulties due to the high IR wavelengths of the relevant 3P0-3D1 and 3P2-3D2 transitions.
Interestingly, the non-destructive measurements of the clock transition probability(e.g. [58, 59]), assuming a different way of repumping, still seem compatible with the blue-detuned trap. The non-destructive measurements that utilise 461 ńm light assume that the excited level is not populated thanks to detuning and low power of the local oscillator and probe beams (down to 30 uW at the waist of 75 um and detuning of 2 GHz in the newest experiments, that corresponds to the relative population of atoms in the 1P1 state, ), because any atom in the excited 1P1 state in the optical lattice is lost from the relatively shallow optical trap.
Moreover, the schemes of a continuous superradiant optical active clocks that were proposed in [20] and related works that use a blue-detuned magic wavelength to realize the Lamb-Dicke regime are not using either the first-stage cooling or excitation readout in the presence of the blue-detuned optical lattice, therefore their feasibility is not affected by high photoionisation cross sections. The losses can, however, impact newer proposals, that would improve the proposed scheme by including repumping of superradianting atoms by external incoherent pumping [60, 61].
Funding
H2020 Future and Emerging Technologies (No 820404, iqClock project); The European Metrology Programme for Innovation and Research (EMPIR) Programme cofinanced by the Participating States and from the European Union’s Horizon 2020 Research and Innovation Programme (EMPIR 17FUN03 USOQS); Fundacja na rzecz Nauki Polskiej (TEAM/2017-4/42); Narodowe Centrum Nauki (2017/25/B/ST2/00429, 2017/25/Z/ST2/03021).
Acknowledgements
The measurements were performed at the National Laboratory FAMO (KL FAMO) in Toruń, Poland, and were supported by a subsidy from the Polish Ministry of Science and Higher Education.
Disclosures
The authors declare no conflicts of interest.
Data availability
Data underlying the results presented in this paper are available in the open data repository [62].
References
- [1] T. Nicholson, S. Campbell, R. Hutson, G. Marti, B. Bloom, R. McNally, W. Zhang, M. Barrett, M. Safronova, G. Strouse, W. L. Tew, and J. Ye, “Systematic evaluation of an atomic clock at total uncertainty,” \JournalTitleNature Communications 6, 6896 (2016).
- [2] M. Schioppo, R. C. Brown, W. F. McGrew, N. Hinkley, R. J. Fasano, K. Beloy, T. H. Yoon, G. Milani, D. Nicolodi, J. A. Sherman, N. B. Phillips, C. W. Oates, and A. D. Ludlow, “Ultrastable optical clock with two cold-atom ensembles,” \JournalTitleNature Photonics 11 (2016).
- [3] C. Lisdat, G. Grosche, N. Quintin, C. Shi, S. M. F. Raupach, C. Grebing, D. Nicolodi, F. Stefani, A. Al-Masoudi, S. Dörscher, S. Häfner, J.-L. Robyr, N. Chiodo, S. Bilicki, E. Bookjans, A. Koczwara, S. Koke, A. Kuhl, F. Wiotte, F. Meynadier, E. Camisard, M. Abgrall, M. Lours, T. Legero, H. Schnatz, U. Sterr, H. Denker, C. Chardonnet, Y. Le Coq, G. Santarelli, A. Amy-Klein, R. Le Targat, J. Lodewyck, O. Lopez, P.-E. Pottie, “A clock network for geodesy and fundamental science,” \JournalTitleNature Communications 7, 12443 (2016).
- [4] J. Grotti, S. Koller, S. Vogt, S. Häfner, U. Sterr, C. Lisdat, H. Denker, C. Voigt, L. Timmen, A. Rolland, F. N. Baynes, H. S. Margolis, M. Zampaolo, P. Thoumany, M. Pizzocaro, B. Rauf, F. Bregolin, A. Tampellini, P. Barbieri, M. Zucco, G. A. Costanzo, C. Clivati, F. Levi, and D. Calonico, “Geodesy and metrology with a transportable optical clock,” \JournalTitleNature Physics 14 (2018).
- [5] M. Takamoto, I. Ushijima, N. Ohmae, T. Yahagi, K. Kokado, H. Shinkai, and H. Katori, “Test of general relativity by a pair of transportable optical lattice clocks,” \JournalTitleNature Photonics (2020).
- [6] P. Delva, J. Lodewyck, S. Bilicki, E. Bookjans, G. Vallet, R. Le Targat, P.-E. Pottie, C. Guerlin, F. Meynadier, C. Le Poncin-Lafitte, O. Lopez, A. Amy-Klein, W.-K. Lee, N. Quintin, C. Lisdat, A. Al-Masoudi, S. Dörscher, C. Grebing, G. Grosche, A. Kuhl, S. Raupach, U. Sterr, I. R. Hill, R. Hobson, W. Bowden, J. Kronjäger, G. Marra, A. Rolland, F. N. Baynes, H. S. Margolis, and P. Gill, “Test of Special Relativity Using a Fiber Network of Optical Clocks,” \JournalTitlePhys. Rev. Lett. 118, 221102 (2017).
- [7] P. Wcisło, P. Morzyński, M. Bober, A. Cygan, D. Lisak, R. Ciuryło, and M. Zawada, “Experimental constraint on dark matter detection with optical atomic clocks,” \JournalTitleNat. Astron. 1, 0009 (2016).
- [8] P. Wcisło, P. Ablewski, K. Beloy, S. Bilicki, M. Bober, R. Brown, R. Fasano, R. Ciuryło, H. Hachisu, T. Ido, J. Lodewyck, A. Ludlow, W. McGrew, P. Morzyński, D. Nicolodi, M. Schioppo, M. Sekido, R. Le Targat, P. Wolf, X. Zhang, B. Zjawin, and M. Zawada, “New bounds on dark matter coupling from a global network of optical atomic clocks,” \JournalTitleScience Advances 4 (2018).
- [9] B. M. Roberts, P. Delva, A. Al-Masoudi, A. Amy-Klein, C. Bærentsen, C. F. A. Baynham, E. Benkler, S. Bilicki, S. Bize, W. Bowden, J. Calvert, V. Cambier, E. Cantin, E. A. Curtis, S. Dörscher, M. Favier, F. Frank, P. Gill, R. M. Godun, G. Grosche, C. Guo, A. Hees, I. R. Hill, R. Hobson, N. Huntemann, J. Kronjäger, S. Koke, A. Kuhl, R. Lange, T. Legero, B. Lipphardt, C. Lisdat, J. Lodewyck, O. Lopez, H. S. Margolis, H. Álvarez-Martínez, F. Meynadier, F. Ozimek, E. Peik, P.-E. Pottie, N. Quintin, C. Sanner, L. D. Sarlo, M. Schioppo, R. Schwarz, A. Silva, U. Sterr, C. Tamm, R. L. Targat, P. Tuckey, G. Vallet, T. Waterholter, D. Xu, and P. Wolf, “Search for transient variations of the fine structure constant and dark matter using fiber-linked optical atomic clocks,” \JournalTitleNew Journal of Physics 22, 093010 (2020).
- [10] C. J. Kennedy, E. Oelker, J. M. Robinson, T. Bothwell, D. Kedar, W. R. Milner, G. E. Marti, A. Derevianko, and J. Ye, “Precision metrology meets cosmology: Improved constraints on ultralight dark matter from atom-cavity frequency comparisons,” \JournalTitlePhys. Rev. Lett. 125, 201302 (2020).
- [11] C. Shi, J.-L. Robyr, U. Eismann, M. Zawada, L. Lorini, R. Le Targat, and J. Lodewyck, “Polarizabilities of the clock transition,” \JournalTitlePhys. Rev. A 92, 012516 (2015).
- [12] T. Middelmann, S. Falke, C. Lisdat, and U. Sterr, “High Accuracy Correction of Blackbody Radiation Shift in an Optical Lattice Clock,” \JournalTitlePhys. Rev. Lett. 109, 263004 (2012).
- [13] K. Gibble, “Scattering of Cold-Atom Coherences by Hot Atoms: Frequency Shifts from Background-Gas Collisions,” \JournalTitlePhys. Rev. Lett. 110, 180802 (2013).
- [14] K. Gibble and B. J. Verhaar, “Eliminating cold-collision frequency shifts,” \JournalTitlePhys. Rev. A 52, 3370–3373 (1995).
- [15] S. Gupta, Z. Hadzibabic, M. W. Zwierlein, C. A. Stan, K. Dieckmann, C. H. Schunck, E. G. M. van Kempen, B. J. Verhaar, and W. Ketterle, “Radio-Frequency Spectroscopy of Ultracold Fermions,” \JournalTitleScience 300, 1723–1726 (2003).
- [16] I. Ushijima, M. Takamoto, M. Das, T. Ohkubo, and H. Katori, “Cryogenic optical lattice clocks,” \JournalTitleNature Photonics 9, 185–189 (2015).
- [17] H. Katori, M. Takamoto, V. G. Pal’chikov, and V. D. Ovsiannikov, “Ultrastable Optical Clock with Neutral Atoms in an Engineered Light Shift Trap,” \JournalTitlePhys. Rev. Lett. 91, 173005 (2003).
- [18] I. Ushijima, M. Takamoto, and H. Katori, “Operational Magic Intensity for Sr Optical Lattice Clocks,” \JournalTitlePhys. Rev. Lett. 121, 263202 (2018).
- [19] M. Takamoto, H. Katori, S. I. Marmo, V. D. Ovsiannikov, and V. G. Pal’chikov, “Prospects for Optical Clocks with a Blue-Detuned Lattice,” \JournalTitlePhys. Rev. Lett. 102, 063002 (2009).
- [20] G. A. Kazakov and T. Schumm, “Active optical frequency standard using sequential coupling of atomic ensembles,” \JournalTitlePhys. Rev. A 87, 013821 (2013).
- [21] A. D. Ludlow, M. M. Boyd, J. Ye, E. Peik, and P. O. Schmidt, “Optical atomic clocks,” \JournalTitleRev. Mod. Phys. 87, 637–701 (2015).
- [22] M. Takamoto, F.-L. Hong, R. Higashi, and H. Katori, “An optical lattice clock,” \JournalTitleNature 435, 321–324 (2005).
- [23] A. D. Ludlow, M. M. Boyd, T. Zelevinsky, S. M. Foreman, S. Blatt, M. Notcutt, T. Ido, and J. Ye, “Systematic study of the clock transition in an optical lattice,” \JournalTitlePhys. Rev. Lett. 96, 033003 (2006).
- [24] T. Takano, R. Mizushima, and H. Katori, “Precise determination of the isotope shift of 88Sr-87Sr optical lattice clock by sharing perturbations,” \JournalTitleApplied Physics Express 10, 072801 (2017).
- [25] M. Bober, P. Morzyński, A. Cygan, D. Lisak, P. Masłowski, M. Prymaczek, P. Wcisło, P. Ablewski, M. Piwiński, S. Wójtewicz, K. Bielska, D. Bartoszek-Bober, R. S. Trawiński, M. Zawada, R. Ciuryło, J. Zachorowski, M. Piotrowski, W. Gawlik, F. Ozimek, and C. Radzewicz, “Strontium optical lattice clocks for practical realization of the metre and secondary representation of the second,” \JournalTitleMeasurement Science and Technology 26, 075201 (2015).
- [26] H. G. Dehmelt, “Monoion oscillator as potential ultimate laser frequency standard,” \JournalTitleIEEE Transactions on Instrumentation and Measurement IM-31, 83–87 (1982).
- [27] T. P. Dinneen, C. D. Wallace, K.-Y. N. Tan, and P. L. Gould, “Use of trapped atoms to measure absolute photoionization cross sections,” \JournalTitleOpt. Lett. 17, 1706–1708 (1992).
- [28] M. Witkowski, R. Munoz-Rodriguez, A. Raczyński, J. Zaremba, B. Nagórny, P. S. Żuchowski, R. Ciuryło, and M. Zawada, “Photoionization cross sections of the and states of rb in simultaneous magneto-optical trapping of rb and hg,” \JournalTitlePhys. Rev. A 98, 053444 (2018).
- [29] C. Gabbanini, S. Gozzini, and A. Lucchesini, “Photoionization cross section measurement in a Rb vapor cell trap,” \JournalTitleOptics Communications 141, 25 – 28 (1997).
- [30] G. Ferrari, R. E. Drullinger, N. Poli, F. Sorrentino, and G. M. Tino, “Cooling of Sr to high phase-space density by laser and sympathetic cooling in isotopic mixtures,” \JournalTitlePhys. Rev. A 73, 023408 (2006).
- [31] M. H. Shah, H. A. Camp, M. L. Trachy, G. Veshapidze, M. A. Gearba, and B. D. DePaola, “Model-independent measurement of the excited fraction in a magneto-optical trap,” \JournalTitlePhys. Rev. A 75, 053418 (2007).
- [32] P. Ewart and A. F. Purdie, “Laser ionization spectroscopy of Rydberg and autoionization levels in Sr I,” \JournalTitleJ. Phys. B 9, 437–441 (1976).
- [33] P. Esherick, “Bound, even-parity and spectra of Sr,” \JournalTitlePhys. Rev. A 15, 1920–1936 (1977).
- [34] M. Baig, M. Yaseen, R. Ali, A. Nadeem, and S. Bhatti, “Near-threshold photoionization spectra of strontium,” \JournalTitleChemical Physics Letters 296, 403 – 407 (1998).
- [35] W. Mende, K. Bartschat and M. Kock, “Near-threshold photoionization from the Sr I (5s5p)1P state,” \JournalTitleJournal of Physics B: Atomic, Molecular and Optical Physics 28, 2385–2393 (1995).
- [36] S. ul Haq, S. Mahmood, N. Amin, Y. Jamil, R. Ali, and M. A. Baig, “Measurements of photoionization cross sections from the 5s5p 1P1 and 5s6s 1S0 excited states of strontium,” \JournalTitleJournal of Physics B: Atomic, Molecular and Optical Physics 39, 1587–1596 (2006).
- [37] U. Fano, “Effects of Configuration Interaction on Intensities and Phase Shifts,” \JournalTitlePhys. Rev. 124, 1866–1878 (1961).
- [38] G. García and J. Campos, “Transition probabilities for triplet levels of Sr(I),” \JournalTitleJournal of Quantitative Spectroscopy and Radiative Transfer 39, 477–483 (1988).
- [39] G. Jöhnsson, C. Levinson, A. Persson, and C. G. Wahlström, “Natural radiative lifetimes in the 1P1 and 1F3 sequences of Sr I,” \JournalTitleZ. Rev. A 316, 255–258 (1984).
- [40] S. G. Porsev, A. D. Ludlow, M. M. Boyd, and J. Ye, “Determination of Sr properties for a high-accuracy optical clock,” \JournalTitlePhys. Rev. A 78, 032508 (2008).
- [41] S. Will, From atom optics to quantum simulation. Interacting bosons and fermions in three-dimensional optical lattice potentials (Springer-Verlag Berlin Heidelberg, 2013).
- [42] S. L. Campbell, R. B. Hutson, G. E. Marti, A. Goban, N. Darkwah Oppong, R. L. McNally, L. Sonderhouse, J. M. Robinson, W. Zhang, B. J. Bloom, and J. Ye, “A fermi-degenerate three-dimensional optical lattice clock,” \JournalTitleScience 358, 90–94 (2017).
- [43] R. H. Dicke, “The effect of collisions upon the doppler width of spectral lines,” \JournalTitlePhys. Rev. 89, 472–473 (1953).
- [44] D. J. Wineland and W. M. Itano, “Laser cooling of atoms,” \JournalTitlePhys. Rev. A 20, 1521–1540 (1979).
- [45] P. Lemonde and P. Wolf, “Optical lattice clock with atoms confined in a shallow trap,” \JournalTitlePhys. Rev. A 72, 033409 (2005).
- [46] G. H. Wannier, “Wave functions and effective hamiltonian for bloch electrons in an electric field,” \JournalTitlePhys. Rev. 117, 432–439 (1960).
- [47] M. Glück, A. R. Kolovsky, and H. J. Korsch, “Wannier–Stark resonances in optical and semiconductor superlattices,” \JournalTitlePhysics Reports 366, 103 – 182 (2002).
- [48] G. Tackmann, B. Pelle, A. Hilico, Q. Beaufils, and F. Pereira dos Santos, “Raman-laser spectroscopy of wannier-stark states,” \JournalTitlePhys. Rev. A 84, 063422 (2011).
- [49] T. Bothwell, C. Kennedy, A. Aeppli, D. Kedar, J. Robinson, E. Oelker, A. Staron, and J. Ye, “Resolving the gravitational redshift across a millimetre-scale atomic sample,” \JournalTitleNature 602, 420–424 (2022).
- [50] Courtillot, I., Quessada-Vial, A., Brusch, A., Kolker, D., Rovera, G. D., and Lemonde, P., “Accurate spectroscopy of Sr atoms,” \JournalTitleEur. Phys. J. D 33, 161–171 (2005).
- [51] P. G. Mickelson, Y. N. M. de Escobar, P. Anzel, B. J. DeSalvo, S. B. Nagel, A. J. Traverso, M. Yan, and T. C. Killian, “Repumping and spectroscopy of laser-cooled Sr atoms using the (5s5p)3P2–(5s4d)3D2 transition,” \JournalTitleJournal of Physics B: Atomic, Molecular and Optical Physics 42, 235001 (2009).
- [52] S. Zhang, P. Ramchurn, M. Menchetti, Q. Ubaid, J. Jones, K. Bongs, and Y. Singh, “Novel repumping on 3P0 3D1 for Sr magneto-optical trap and Landé g factor measurement of 3D1,” \JournalTitleJournal of Physics B: Atomic, Molecular and Optical Physics 53, 235301 (2020).
- [53] X. Baillard, M. Fouché, R. L. Targat, P. G. Westergaard, A. Lecallier, Y. L. Coq, G. D. Rovera, S. Bize, and P. Lemonde, “Accuracy evaluation of an optical lattice clock with bosonic atoms,” \JournalTitleOpt. Lett. 32, 1812–1814 (2007).
- [54] M. Abdel-Hafiz, P. Ablewski, A. Al-Masoudi, H. Álvarez Martínez, P. Balling, G. Barwood, E. Benkler, M. Bober, M. Borkowski, W. Bowden, R. Ciuryło, H. Cybulski, A. Didier, M. Doležal, S. Dörscher, S. Falke, R. M. Godun, R. Hamid, I. R. Hill, R. Hobson, N. Huntemann, Y. Le Coq, R. Le Targat, T. Legero, T. Lindvall, C. Lisdat, J. Lodewyck, H. S. Margolis, T. E. Mehlstäubler, E. Peik, L. Pelzer, M. Pizzocaro, B. Rauf, A. Rolland, N. Scharnhorst, M. Schioppo, P. O. Schmidt, R. Schwarz, Ç. Şenel, N. Spethmann, U. Sterr, C. Tamm, J. W. Thomsen, A. Vianello, and M. Zawada, “Guidelines for developing optical clocks with fractional frequency uncertainty,” \JournalTitlearXiv e-prints arXiv:1906.11495 (2019).
- [55] S. Stellmer, M. K. Tey, B. Huang, R. Grimm, and F. Schreck, “Bose-Einstein Condensation of Strontium,” \JournalTitlePhys. Rev. Lett. 103, 200401 (2009).
- [56] C.-C. Chen, S. Bennetts, R. G. Escudero, B. Pasquiou, and F. Schreck, “Continuous Guided Strontium Beam with High Phase-Space Density,” \JournalTitlePhys. Rev. Applied 12, 044014 (2019).
- [57] X. Zhou, X. Xu, X. Chen, and J. Chen, “Magic wavelengths for terahertz clock transitions,” \JournalTitlePhys. Rev. A 81, 012115 (2010).
- [58] G. Vallet, E. Bookjans, U. Eismann, S. Bilicki, R. L. Targat, and J. Lodewyck, “A noise-immune cavity-assisted non-destructive detection for an optical lattice clock in the quantum regime,” \JournalTitleNew Journal of Physics 19, 083002 (2017).
- [59] R. Hobson, W. Bowden, A. Vianello, I. R. Hill, and P. Gill, “Cavity-enhanced non-destructive detection of atoms for an optical lattice clock,” \JournalTitleOpt. Express 27, 37099–37110 (2019).
- [60] C. Hotter, D. Plankensteiner, L. Ostermann, and H. Ritsch, “Superradiant cooling, trapping, and lasing of dipole-interacting clock atoms,” \JournalTitleOpt. Express 27, 31193–31206 (2019).
- [61] A. Bychek, C. Hotter, D. Plankensteiner, and H. Ritsch, “Superradiant lasing in inhomogeneously broadened ensembles with spatially varying coupling [version 2; peer review: 2 approved],” \JournalTitleOpen Research Europe 1 (2021).
- [62] W. Marcin, B. Sławomir, M. Bober, D. Kovac̆ić, V. Singh, A. Tonoyan, and M. Zawada, “Photoionisation losses in a strontium optical lattice clock operating at blue-detuned magic wavelength light,” (2022). RepOD https://doi.org/10.18150/LQ6WUK.