Possible unconventional order parameter in single crystals of SrPt3P superconductor
Abstract
Anisotropic properties of single crystals of SrPt3P were studied using London penetration depth and electrical resistivity measurements. The upper critical field, , was determined from four-probe electrical resistivity measurements for three orthogonal directions of a magnetic field with respect to the crystal. The London penetration depth, , was determined from the magnetic susceptibility of the Meissner-London state measured using a tunnel-diode resonator technique. Whereas and the normal-state are practically identical for all three magnetic field orientations, the London penetration depth shows significant unidirectional anisotropy. The low-temperature is exponentially attenuated when a small excitation radiofrequency magnetic field, , is applied along the direction, in which case screening currents flow in the plane, while for the other two orientations, and , the London penetration depth shows a much weaker, , variation. Such unusual and contrasting behavior of the two anisotropies, and , imposes significant constraints on the possible order parameter. Although our measurements are insufficient to derive conclusively the superconducting gap anisotropy, qualitatively, order parameter with two point nodes and a modulation in the perpendicular direction is consistent with the experimental observations.
I Introduction
Superconductivity in platinum-based phosphides, APt3P (A = Sr, Ca, La), was discovered by Takayama et al. in 2012 [1]. Similar to non-centrosymmetric superconductors LaPt3Si and CePt3Si, these compounds have distorted anti-perovskite structure but preserve the inversion symmetry. The APt3P compounds show apparently large variation of the electron-phonon (EP) coupling strength from weak to strong with the EP coupling constant values of, 0.57, 0.86 and 1.33, for LaPt3P, CaPt3P and SrPt3P, respectively [2, 3].
SrPt3P has superconducting transition temperature, K, the highest among the 5d electron superconductors. From the heat capacity measurements, Takayama et al. concluded that SrPt3P is an wave superconductor. Its superconductivity is in a strong coupling limit with the characteristic ratio, , notably exceeding the weak-coupling value of [1]. This feature was attributed to the presence of soft phonon modes. The conclusion about the wave character of the superconducting gap was further supported by the nuclear magnetic resonance (NMR) measurements of the Knight shift, though no Hebel-Slichter peak was observed [4]. In an wave scenario, this feature can also be due to the enhanced phonon damping. Nonlinear magnetic field dependence of the Hall resistivity was interpreted as coming from the multiple pockets of the Fermi surface, potentially hinting at the multi-band superconductivity [1]. Hu et al. investigated the effect of Pd-doping in polycrystalline SrPt3P and found that there is a complex interplay between electron correlations, electron-phonon coupling, and spin-orbit coupling [5]. In principle, such features may support unconventional order parameters [6, 7].
To probe the nature of superconducting pairing in SrPt3P, London penetration depth was measured in polycrystalline samples using transverse-field SR [8]. Combined with the measurements of the critical field, the authors proposed that SrPt3P is a two-band superconductor with equal gaps but different coherence lengths in different Fermi surface sheets. However, such a scenario is impossible considering that there is only one characteristic length scale (one ) for the spatial variation of the order parameter [7, 6].
On the theoretical side, from first principle calculations, Chen et al. suggested possible unusual superconductivity in SrPt3P caused by a charge density wave and strong spin-orbit coupling [9]. In contrast, Subedi et al. concluded that SrPt3P is a conventional wave superconductor in which spin-orbit coupling plays only “a marginal role” [2]. Many more theoretical works studying the electronic structure and phonon modes followed [10, 11, 12, 13, 14, 15].
In this situation, it is important not only to establish the overall thermodynamic behavior of SrPt3P, but also to determine the anisotropy of the superconducting order parameter. This cannot be done on polycrystalline samples and requires crystals of sufficiently large size in all directions. The growth of SrPt3P single crystals is non-trivial and requires high-pressure, high-temperature synthesis, similar to MgB2 [16]. First single crystals of SrPt3P were synthesized in 2016 [17], and they are used in this study.
In this paper, we report our investigation of the anisotropic London penetration depth, , the upper critical field, , and electrical resistivity, , in single crystals SrPt3P. Based on the results, we suggest that SrPt3P may, indeed, support an unconventional order parameter with point nodes.
II Experimental
Single crystals of SrPt3P were grown under high pressure in a cubic anvil cell and were mechanically separated from the flux as described in detail elsewhere [17]. It has nearly cubic crystal structure, Å, Å[17]. Unfortunately, such difficult conditions result in samples whose facets are not oriented in prime crystallographic directions. We therefore assign three orthogonal axes based on sample shapes: -, -, and -axes assigned for a resistivity measurement sample, and -, -, and -axes for a London penetration depth measurement sample. The shortest directions are labeled as and , the longest directions for and . Since the response in each of those directions is a linear combination of the responses in “true” axes, observation of electronic anisotropy would mean a true anisotropic response of the crystal.
A crystal for the resistivity measurement was 0.6 mm long and 0.10.1 mm2 in cross-section. Silver wires of 50 m diameter were soldered to the sample using tin flux [18, 19], in a standard four-probe resistivity configuration. The contact resistance was in the m range. Resistivity measurements were performed in a Quantum Design PPMS down to 1.8 K in magnetic fields up to 9 T in configurations axis, axis and axis. Sample orientation was controlled by attaching the sample to different sides of a plastic parallelopiped, see Ref.[20] for details. The upper critical field was determined from electrical resistivity measurements using different criteria as described in the text below.
The temperature variations of the London penetration depth were measured by using a self-oscillating tunnel diode resonator (TDR) when sample temperature varied down to 400 mK () [21, 22]. The TDR circuit resonates at 14 MHz and the frequency shift is measured with one part per billion (ppb) precision. Its inductor coil generates an ac magnetic field, , so that the sample is always in the Meissner state at the temperatures of interest. The size of the sample was 600 5 m (axis), 250 m 5 m (axis), 155 5 m (axis). The sample was mounted on a 1 mm diameter sapphire rod and inserted into an inductor coil of 2 mm diameter. The coil and the sample were in vacuum in a 3He cryostat with sample and TDR circuit temperatures actively stabilized by independent closed-loop LakeShore temperature controllers. The London penetration depth was measured on the same crystal in three different configurations; , and axes. The resonant frequency of the tank circuit containing the sample depends on the total inductance of the sample in the coil, and it is straightforward to show that the frequency shift compared to the empty resonator is proportional to the total magnetic susceptibility of a sample up to a calibration factor that depends on the sample dimensions, demagnetizing factor, and parameters of the coil. The calibration constant is established for each experimental run by mechanically pulling the sample out of the coil at the base temperature of about 400 mK. Technical details of the technique are provided elsewhere [22, 23, 24, 25].
III Results
III.1 Upper critical field
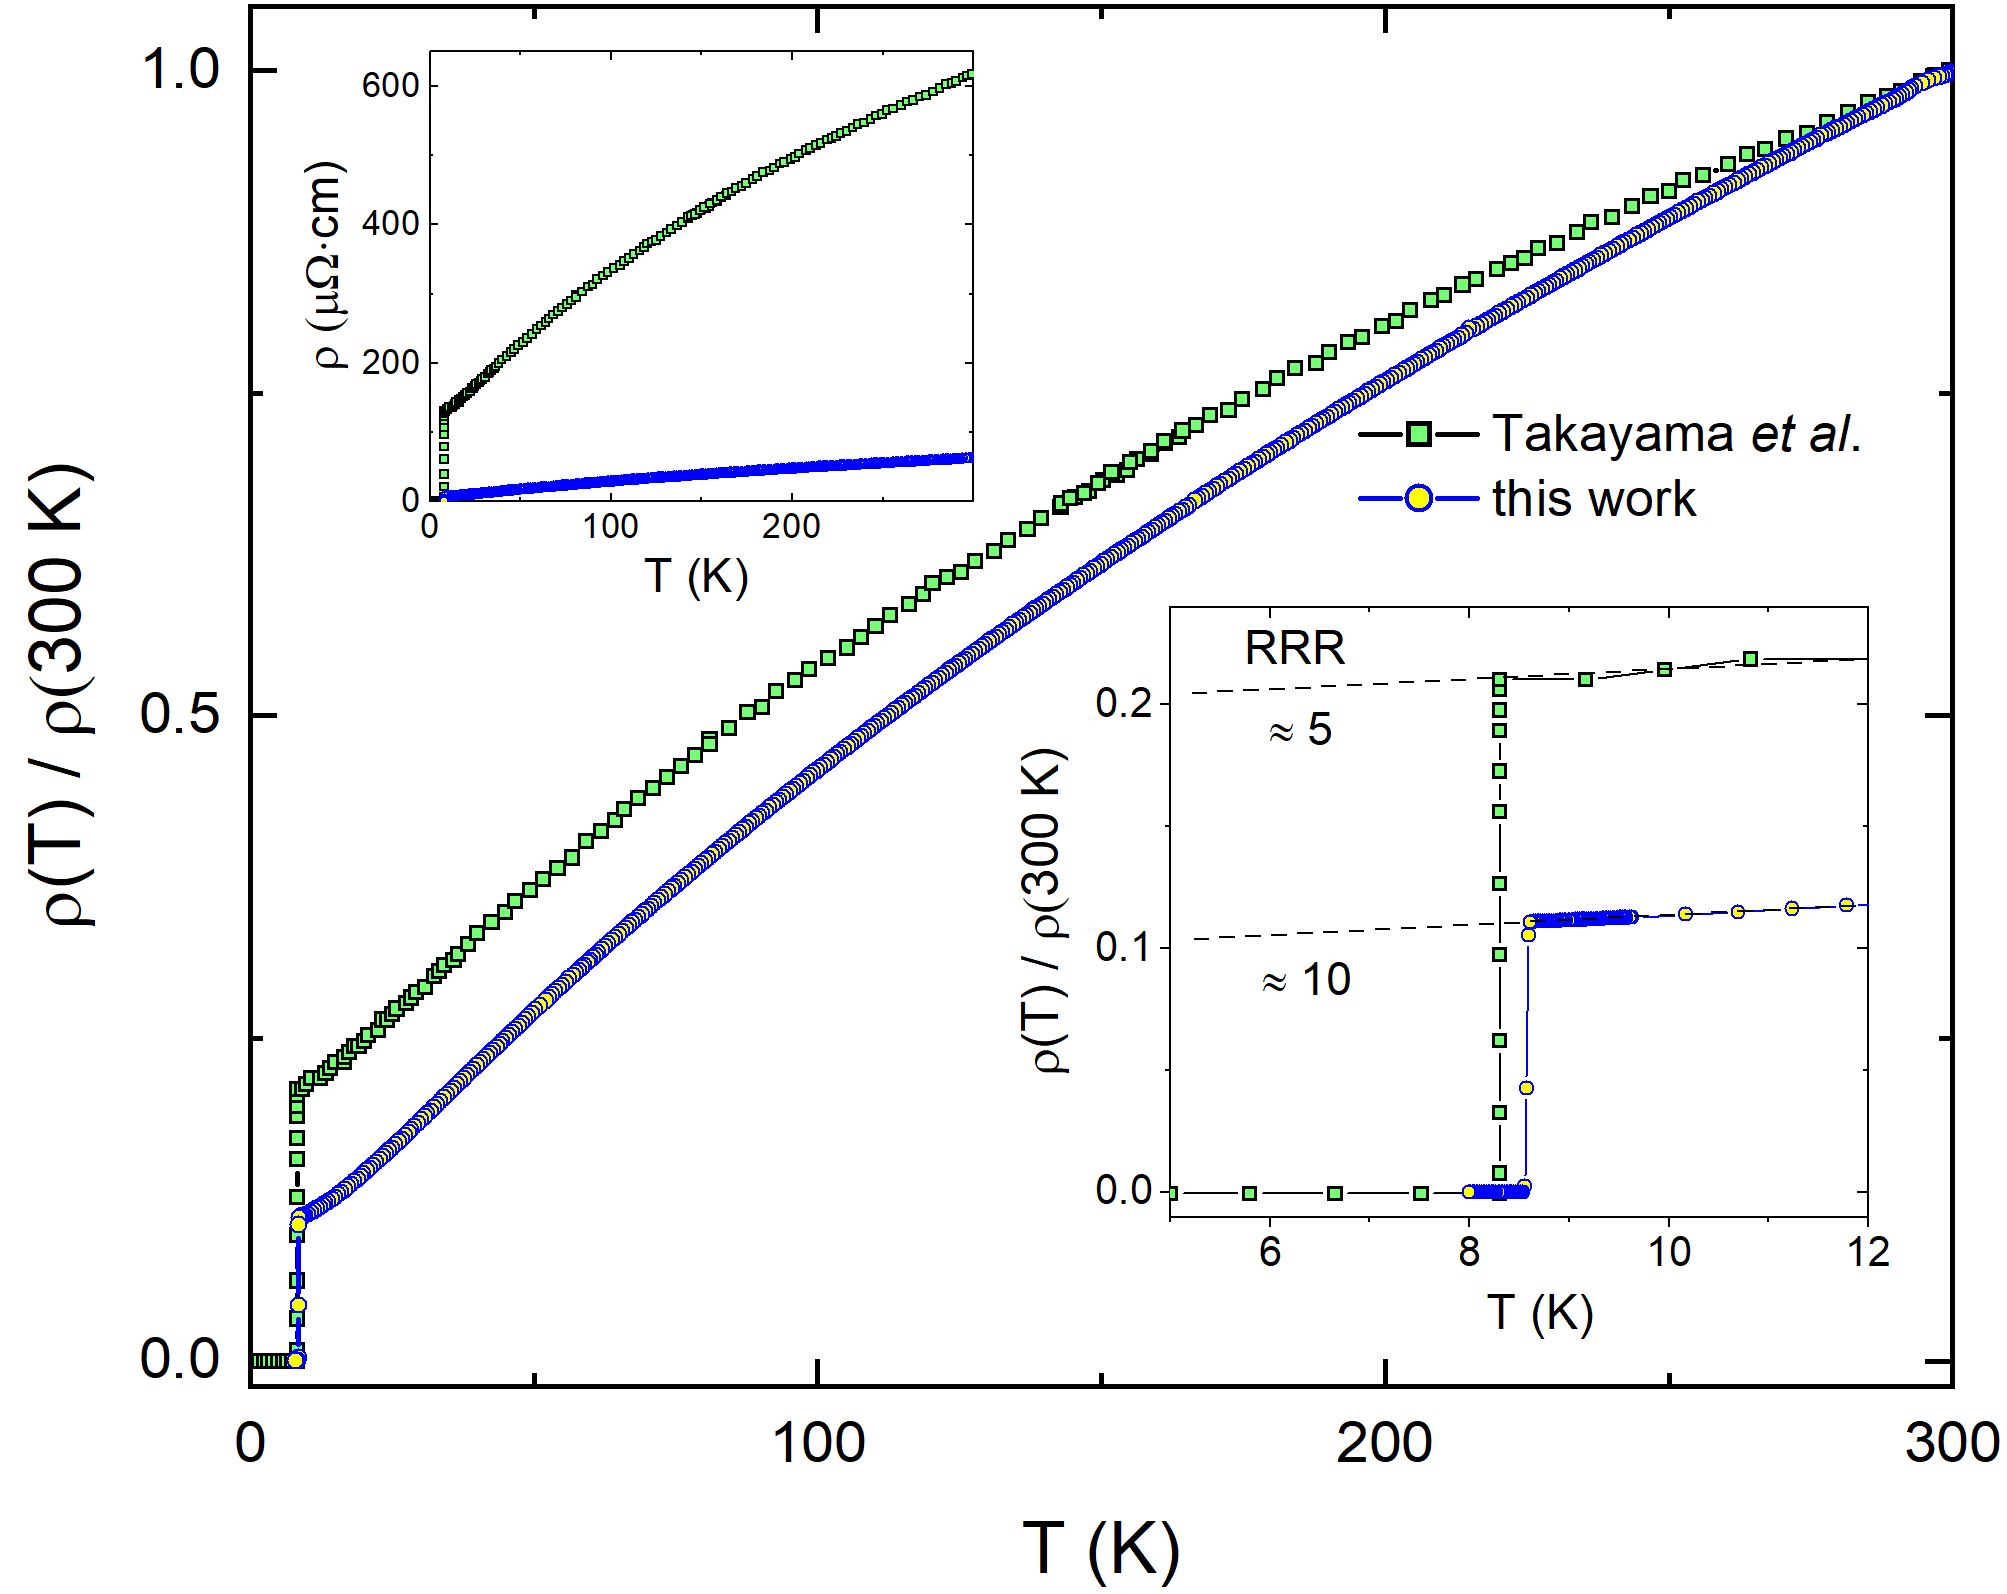
Figure 1 shows the temperature-dependent resistivity of SrPt3P single crystal and compares it with the polycrystalline sample data reported by Takayama et al.[1]. As shown in the upper-left inset, the single crystalline sample of the present study has much lower resistivity over the whole temperature range. The normalized resistivity in the main panel shows similar temperature dependence between single crystal and polycrystalline samples, but the residual resistivity ratio is higher in a single crystal by a factor of two, RRR . The right-bottom inset zooms at the superconducting transition. Note that the transition temperature, , is also somewhat higher in the single crystalline sample. Assuming that a single crystal has a lower scattering rate than a polycrystalline one, this implies a violation of the Anderson theorem, which would be compatible with an anisotropic or nodal gap.
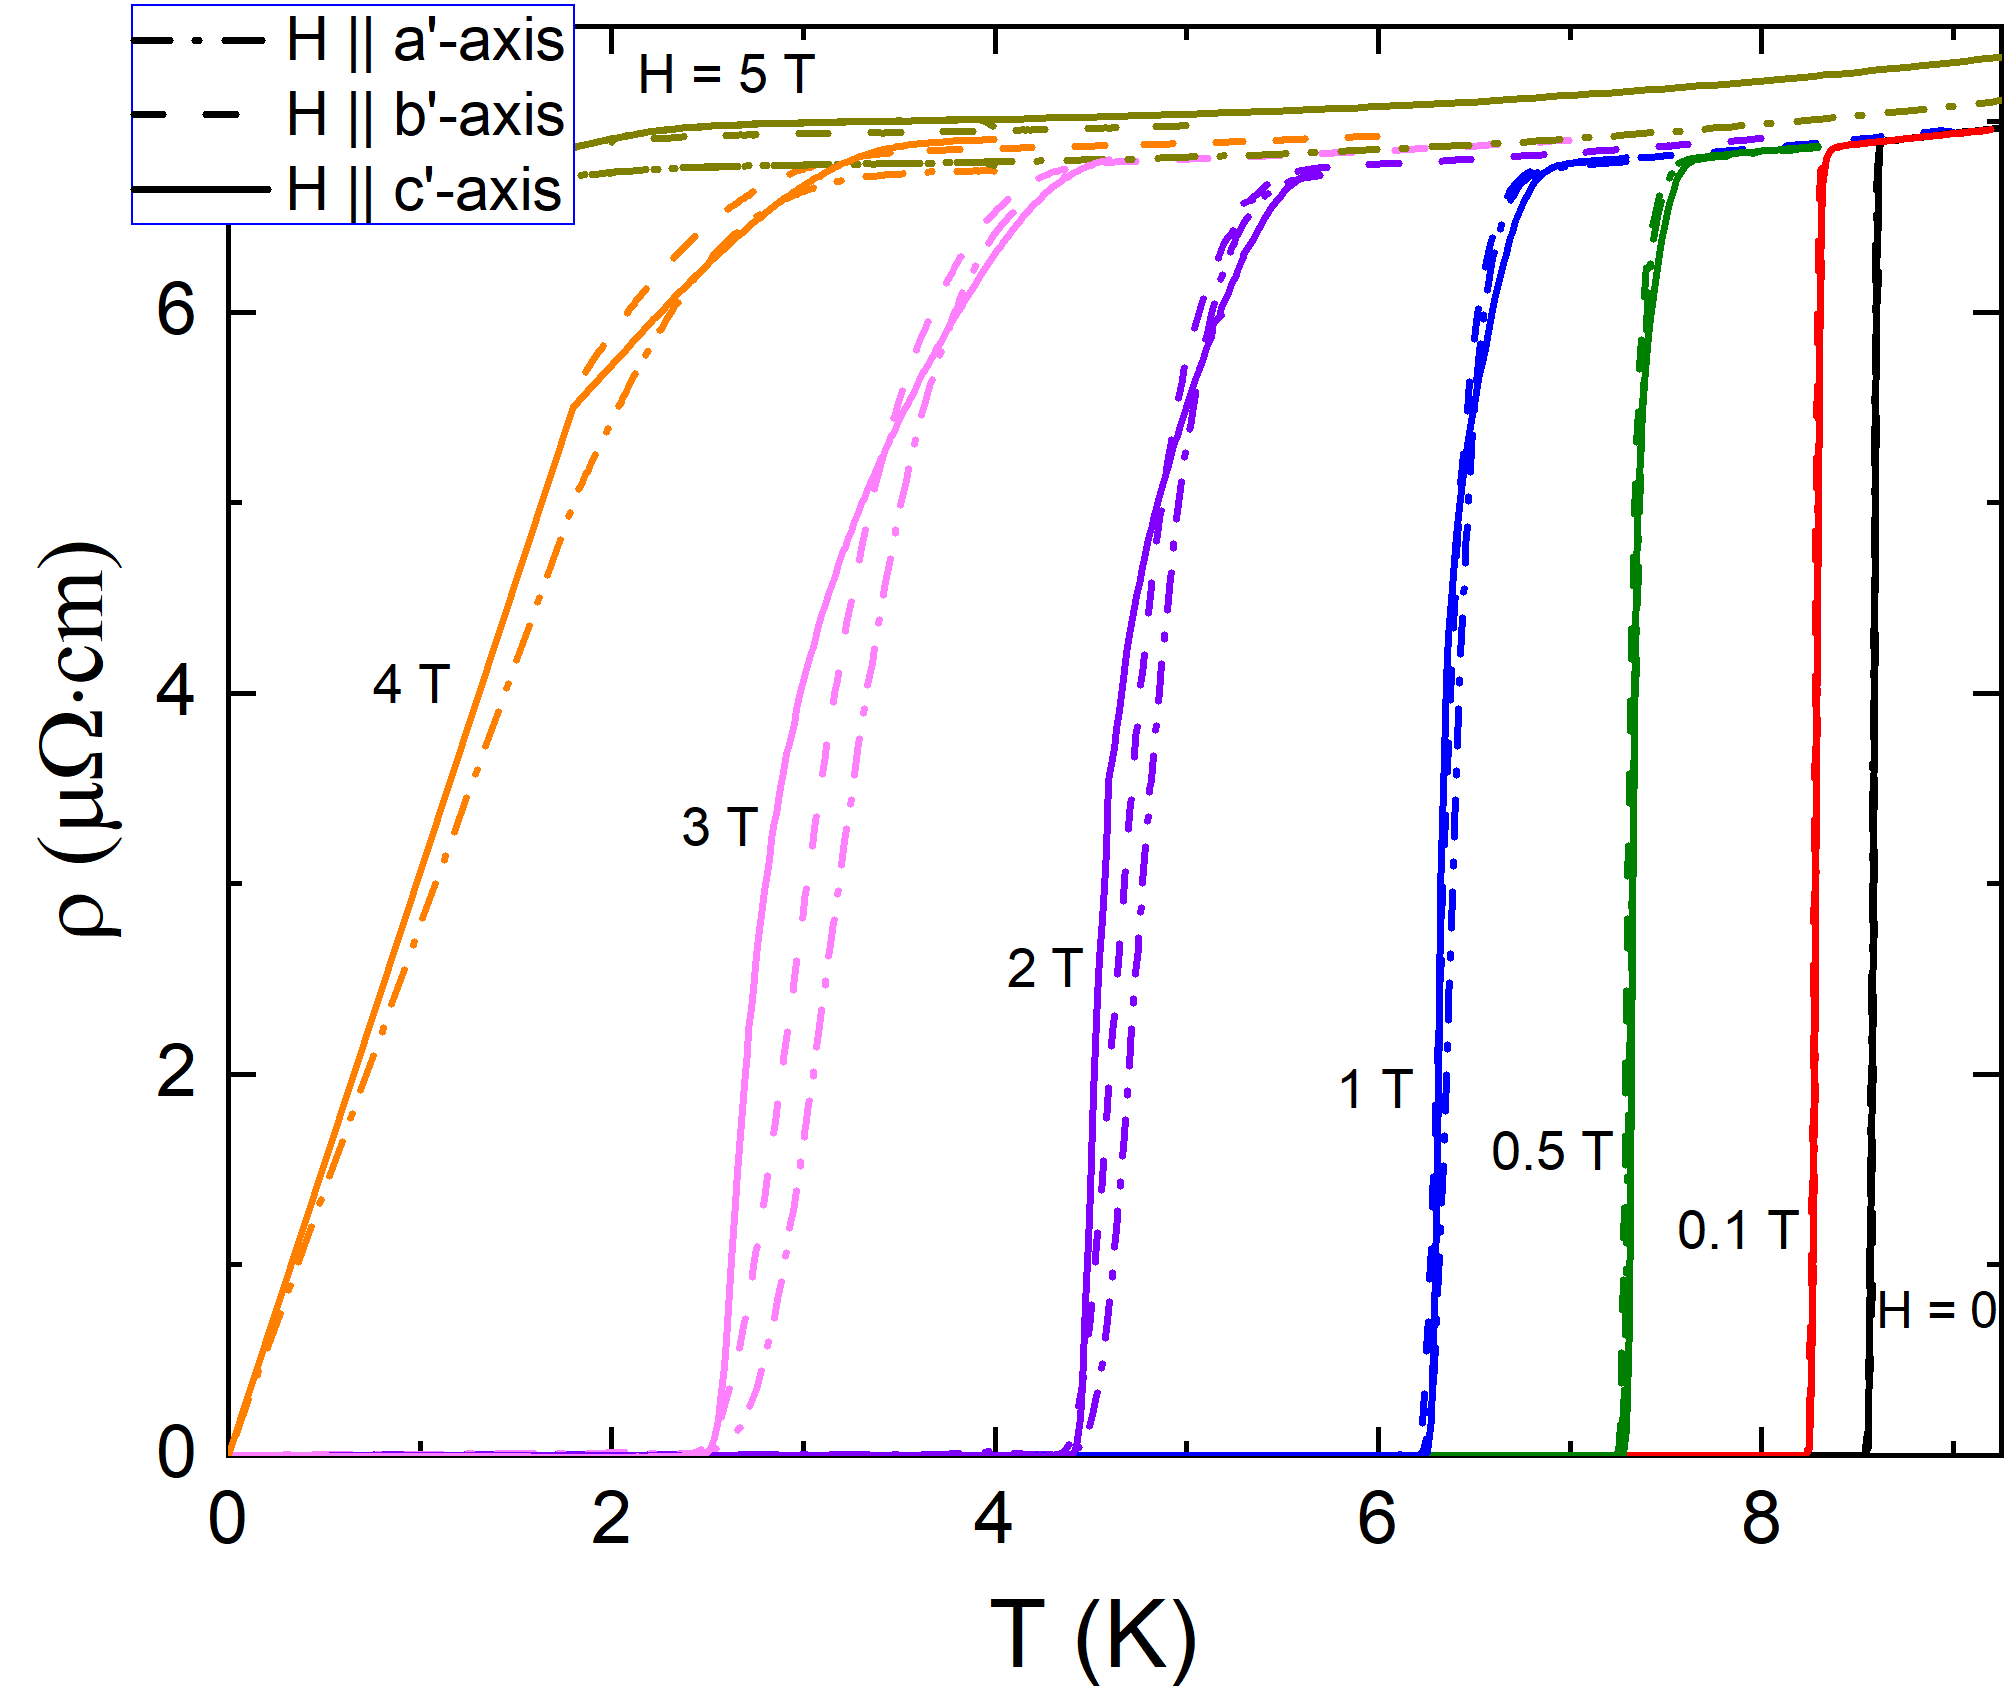
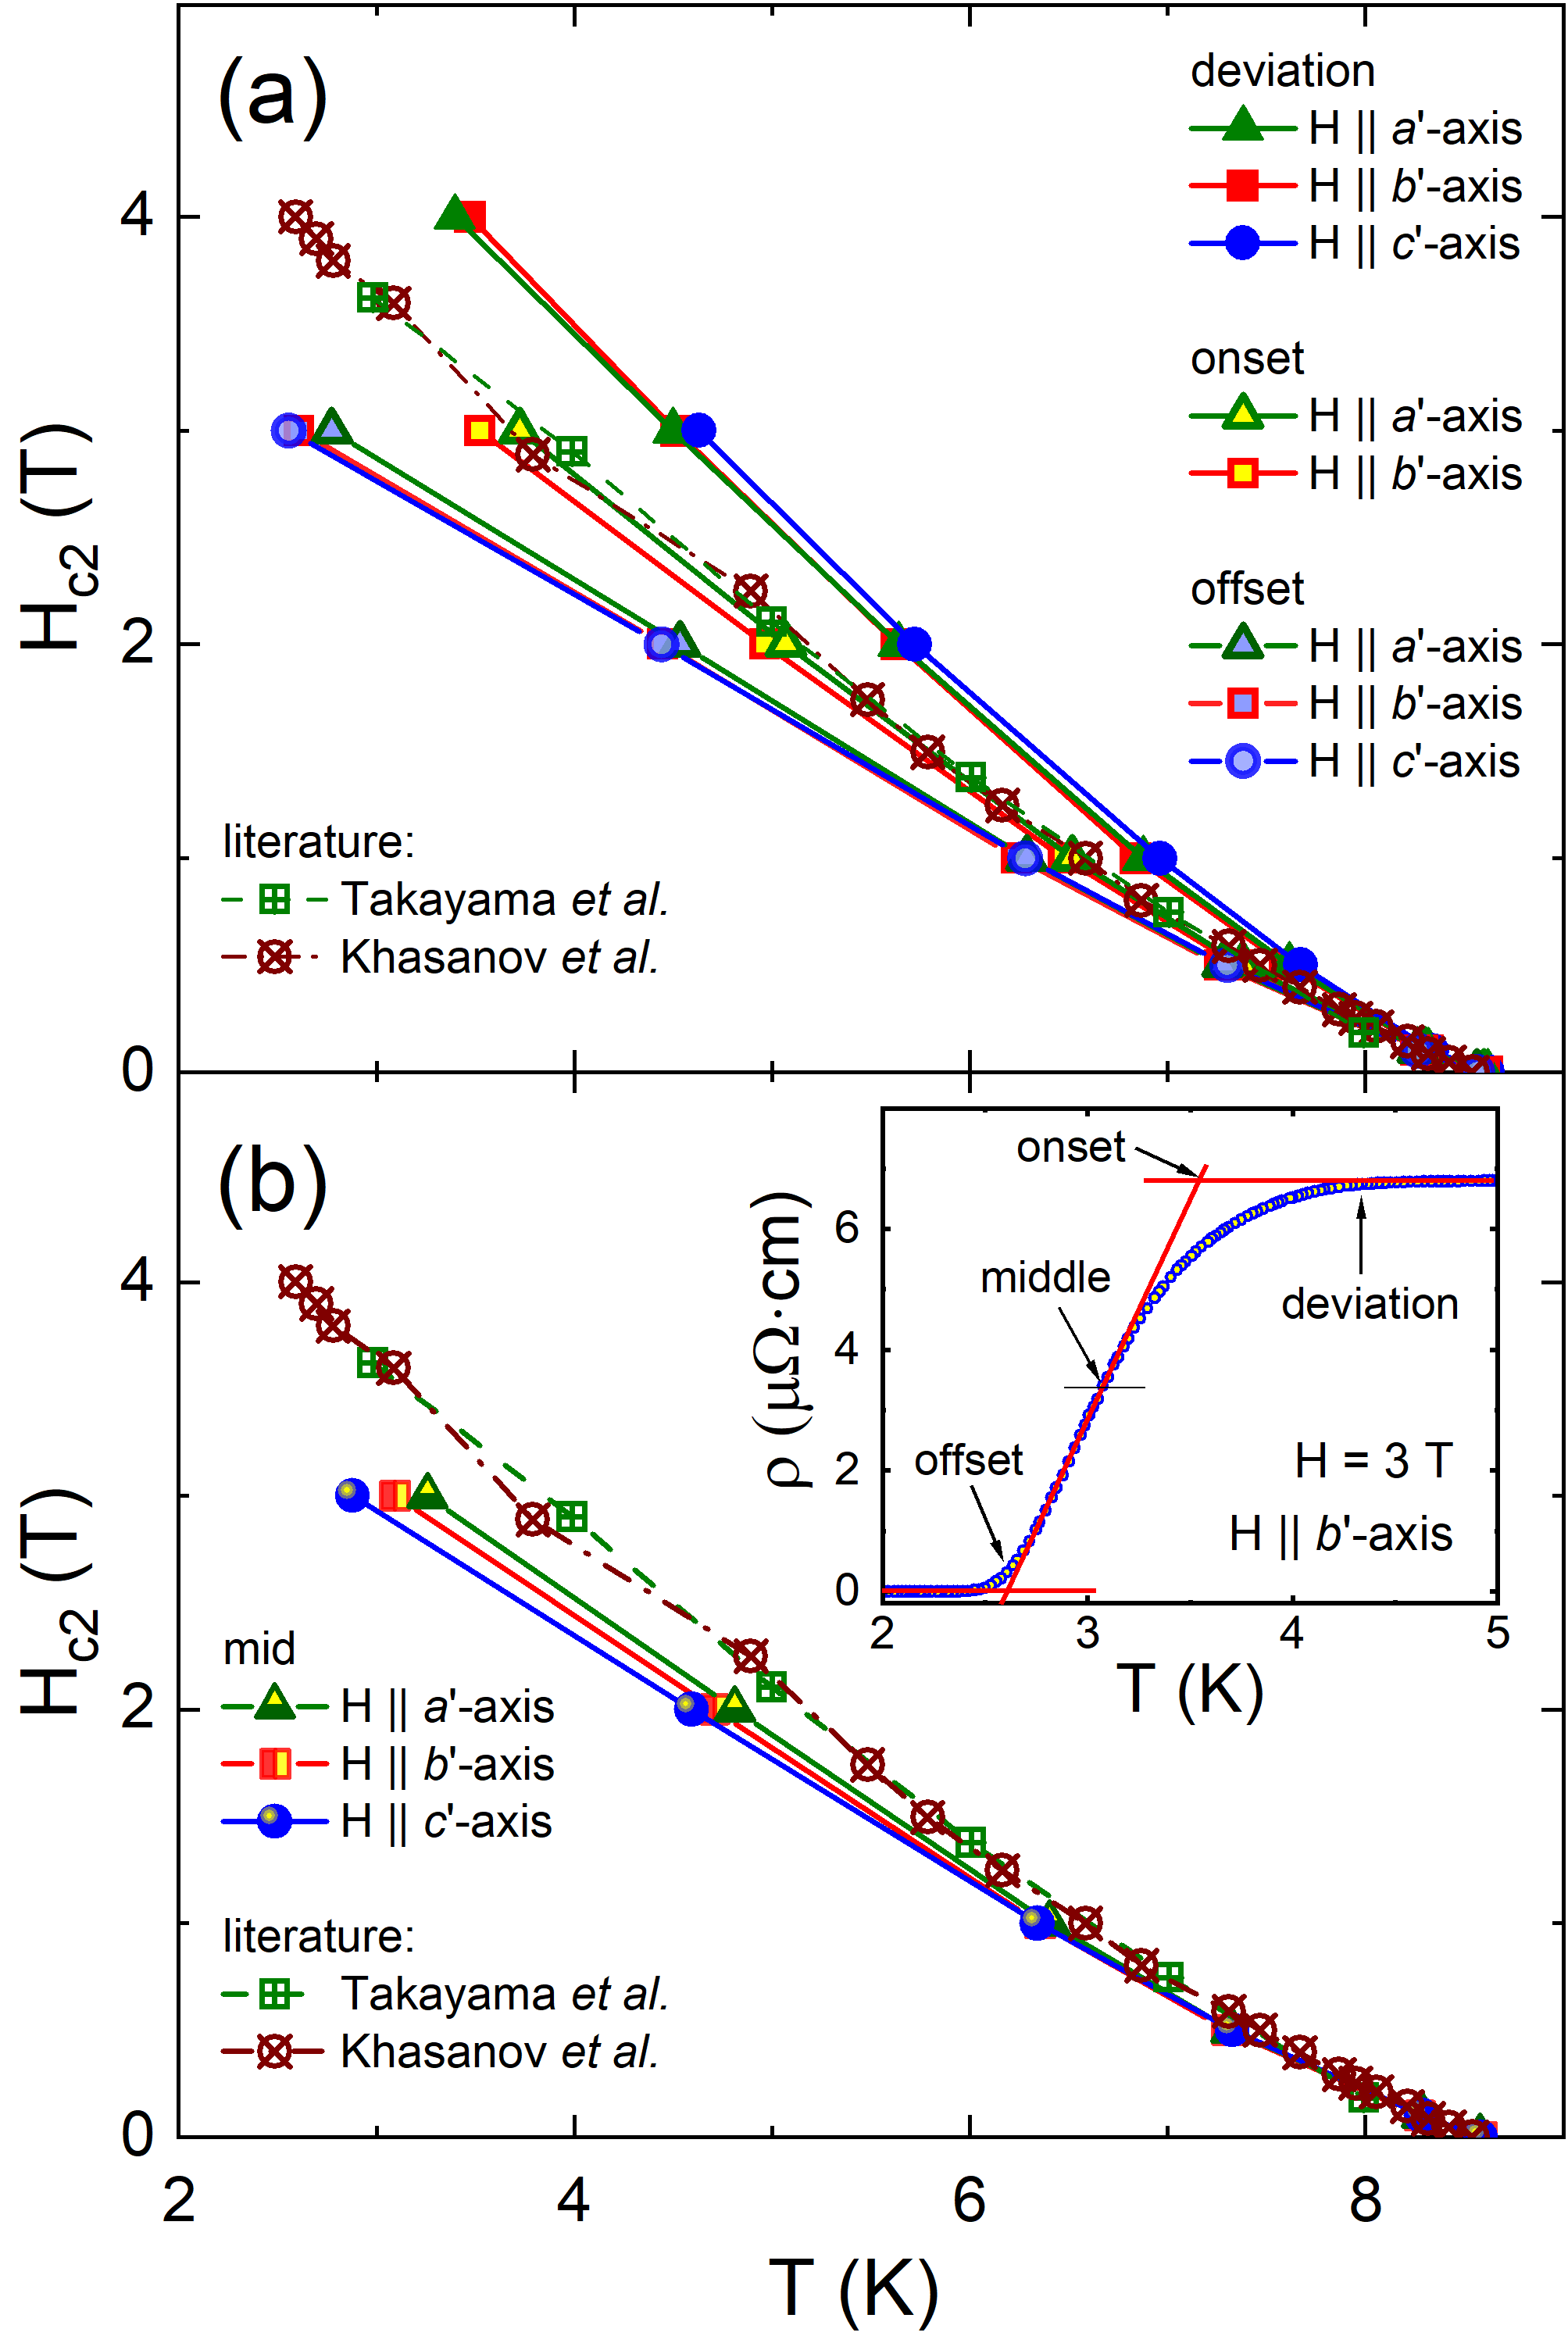
The temperature-dependent resistivities, , measured in the vicinity of the superconducting transition in magnetic fields applied in three different orientations, axes, respectively, are plotted in Fig. 2. A very close to isotropic behavior is self-evident. Perhaps, only axis curves become more rounded than the other two orientations in fields above 2 T. Fig. 3 summarizes the temperature-dependent upper critical field, , estimated using four different criteria as shown in the inset in Fig. 3(b). Top panel, Fig. 3(a), shows defined by the deviation, onset, and offset criteria. Expectedly, the onset criterion produces values close to the literature data on polycrystalline samples [1, 8], shown by open crossed symbols in both panels of Fig. 3. The commonly used mid-point transition data are plotted in Fig. 3(b) by different symbols and the same colors defined in panel (a). We conclude that is very similar between all three orientations regardless of the criterion used.
Returning to , we note that often made assertion that its upward (positive) curvature implies multi-band superconductivity as claimed, for example, in Ref.[8], is not supported by the theory [26, 27, 28]. Similar behavior, especially in the limited temperature interval, may be the result of complications of the Fermi surface topology, anisotropy of the order parameter, or nonmagnetic scattering even in a single-band material [27]. In fact, usually in multi-band superconductors shows “normal” concave behavior and no difference in shape from the single-band result [26]. Similarly, temperature-dependent anisotropy, , does not imply multi-band superconductivity and is commonly found in single-band superconductors in different circumstances [28].
On the other hand, there may be consequences of multi-band character on the response to scattering as discussed below. The important conclusion from the resistivity measurements is that, as expected from the crystal structure, this material is practically isotropic. Of course, the electronic band structure is quite complicated, but for the analysis of transport and thermodynamic properties, we may approximate it by a Fermi sphere, an approach justified by the lack of anisotropy of the upper critical fields.
III.2 London penetration depth
In a tetragonal system, London penetration depth has two components, for fields penetration along the tetragonal plane, , and for field penetration along the tetragonal axis, . When a small magnetic field is applied in the plane, both and components contribute to the measured signal, whereas for the magnetic field along the axis, only the in-plane penetration depth. In tetragonal SrPt3P (), therefore, intrinsically, there are two distinct coherence lengths, , and two values of the London penetration depth, . Since our crystals facets are not oriented properly along the prime crystallographic directions, we use axes for one crystal, and axes for another. However, the resultant measured quantities are the linear combinations of the crystallographic quantities, therefore we have two distinct characteristic lengths of both types, and .
We now examine the temperature variation of the London penetration depth, , which is linked directly to the structure of superconducting gap as it depends sensitively on the thermally excited quasiparticles. High-resolution magnetic susceptibility was measured at zero applied dc field in three different orientations of small excitation field, mOe, along , and axes as discussed in the experimental section above.
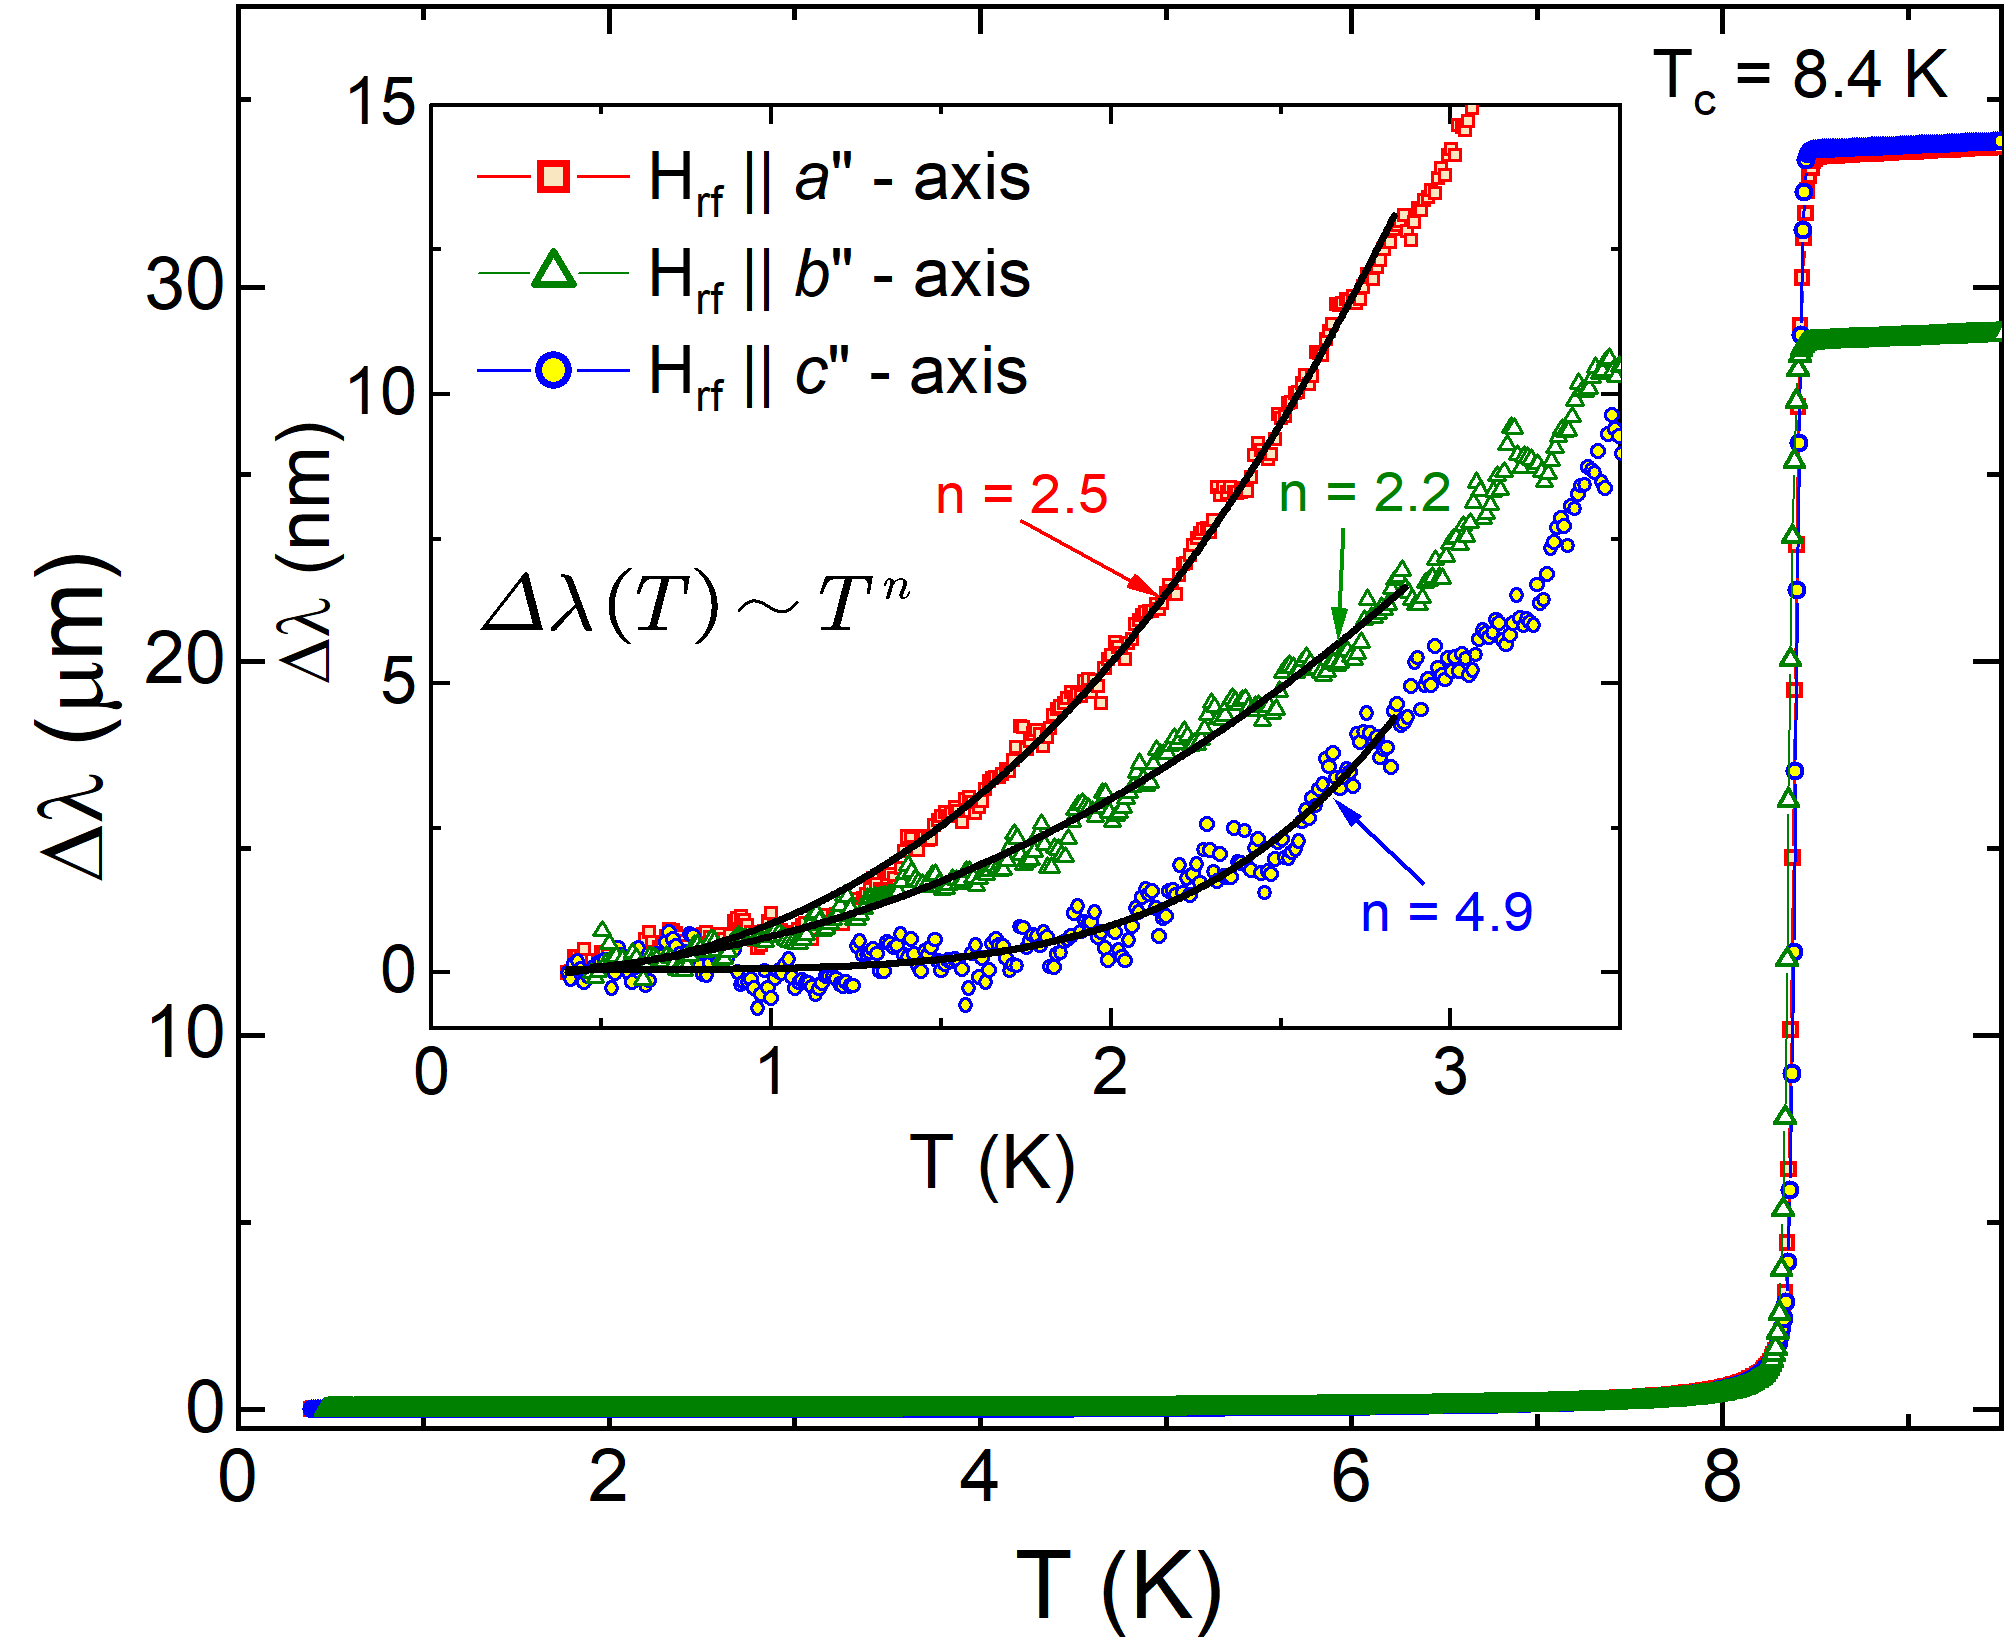
Figure 4 shows the low-temperature variation of the London penetration depth; (red squares), (green triangles), and (blue circles). As clearly shown in the inset, the low-temperature part of the London penetration depth exhibits distinct behavior depending on the magnetic field orientation. London penetration depth depends on the integral of the projection of the Fermi velocity over the whole Fermi surface and having nodes or anisotropy in some parts of the order parameter has an effect on all components of [24, 25]. In addition, scattering may play a significant role and, depending on the order parameter structure, even non-magnetic (potential) scattering can be pair-breaking, which significantly affects the penetration depth and effectively turns exponential into a power-law behavior at low temperatures [24, 25]. Therefore, we use a power-law fitting, , to quantify the degree of creation of quasiparticles with increasing temperature in different directions. The inset in Fig. 4 shows the large exponent, , for . Numerically, the exponents above are indistinguishable from exponential and indicate a fully gapped superconducting order parameter. On the other hand, the lower exponents were obtained for () and (), signifying either line-nodal gap in the dirty limit, the multi-band sign-changing order parameter, such as in the dirty limit, or a point node [24, 25]. However, if the order parameter had a line node or was an type on a three-dimensional Fermi surface, the measurements for all three orientations would show similar low power . Our data seem to suggest a case with the point node.
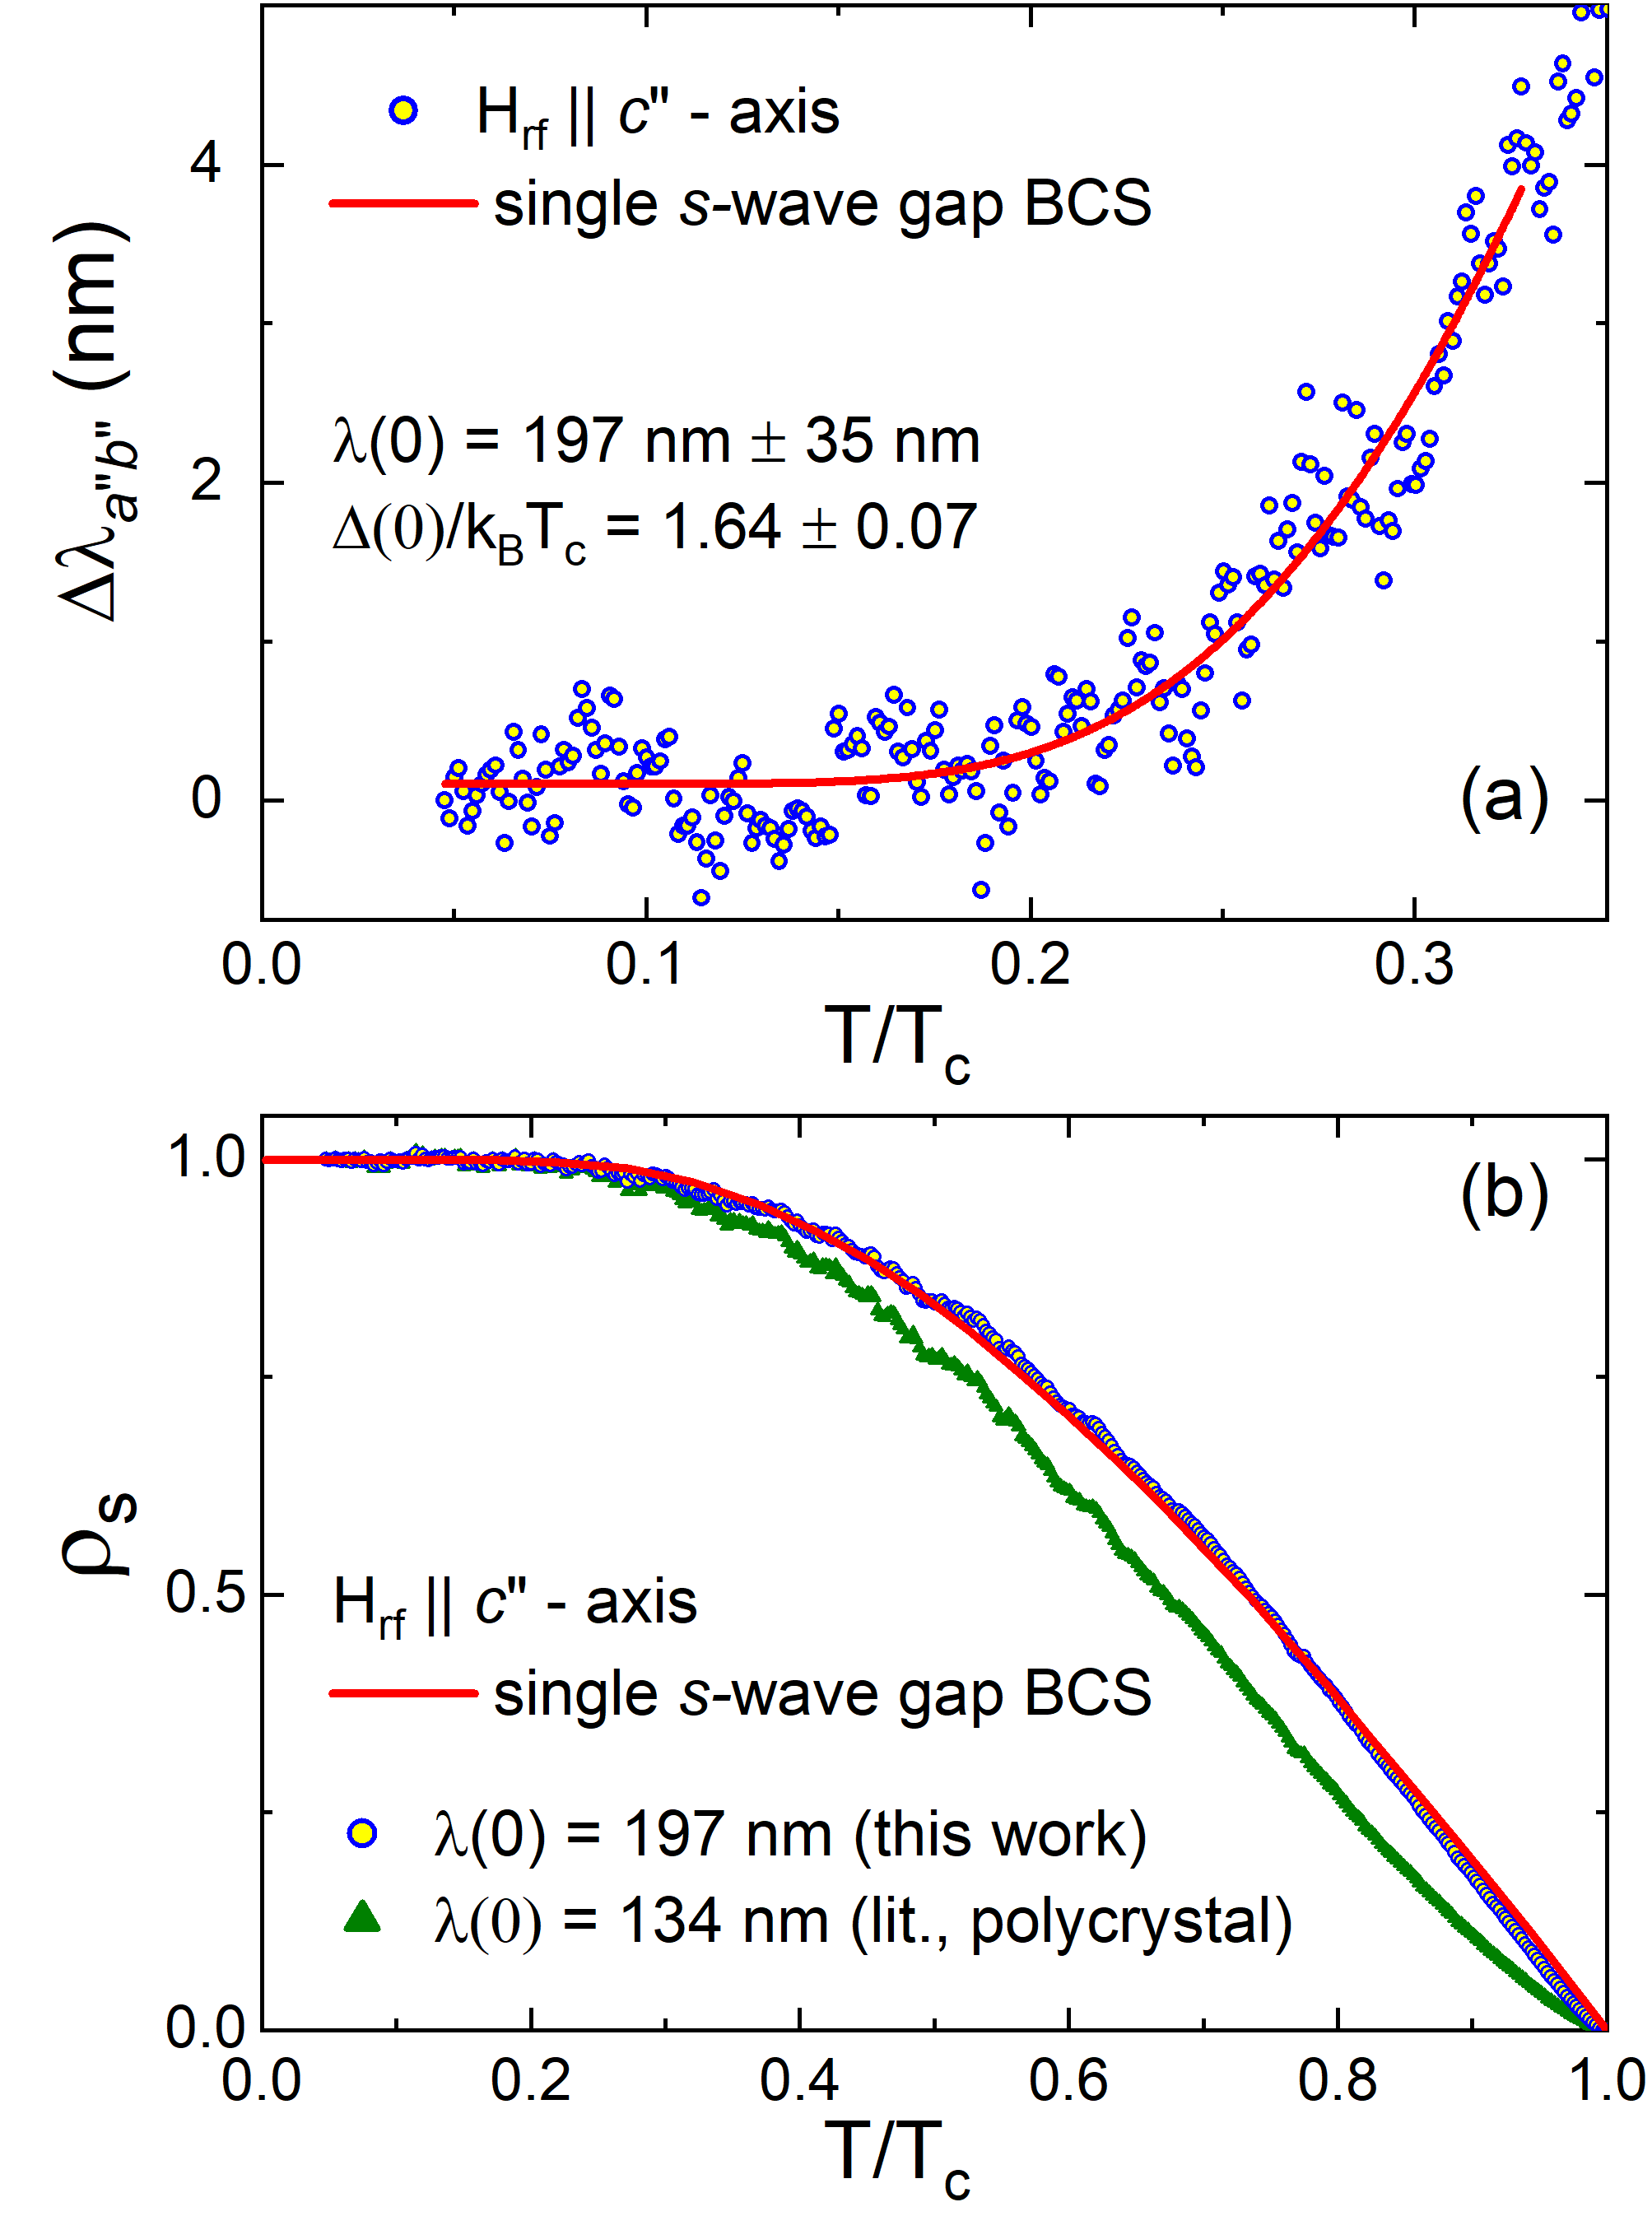
For the data of high exponent = 4.9 (), we attempted a BCS fitting with a standard expression, . The best fitting is shown in Fig 5 (a) with = 197 nm 35 nm. In the panel (b), its superfluid density, , was plotted which is consistent with a single gap BCS case. For comparison, the superfluid density was also plotted with = 134 nm obtained from a polycrystalline sample (ref. 8).
IV Discussion
IV.1 The relations between different anisotropies
In tetragonal crystal with , the anisotropies of the upper critical field, , and of the London penetration depth, , depend on the the anisotropy of the Fermi surface and of the order parameter [26, 29, 28]. Here, is the upper critical field measured with a magnetic field applied along the axis and is the coherence length in the transverse, in-plane direction, is the in-plane upper critical field; is the London penetration depth of the in-plane magnetic field with screening super-currents flowing along the axis, and is for the magnetic field along the axis and screening currents in the plane. In the text we use index with the understanding that it is equivalent to , hence . These anisotropies are generally temperature-dependent and may increase or decrease on warming or cooling, with and often going in the opposite directions [28, 29]. This is easier to see if we assume a commonly used separation of variables ansatz, , with the normalization , where denotes the averaging over the Fermi surface. For example, isotropic wave is described by , whereas a wave order parameter is given by . At , in clean case, we always have , so the anisotropy depends on the symmetry of the order parameter described by [28]. The electrical conductivity is, where is the diffusivity tensor. In these equations, is the relevant component of the Fermi velocity, is the density of states at the Fermi level, and is the transport scattering time of the normal metal. Therefore, the anisotropy of resistivity is, roughly, assuming isotropic . Therefore, for isotropic order parameter, , regardless of the Fermi surface anisotropy, . However, in general, There is one more possibility. In the dirty limit, the anisotropy of the order parameter washes away, and the equality of all three is restored. However, there is no reason to assume that we are at the dirty limit.
Electronic bandstructure calculations predict isotropic electrical resistivity of the normal state [11], and we observed it in our experiments. Combined with the measured nearly isotropic upper critical field at , this would imply isotropic or a dirty limit. However, significantly anisotropic London penetration depth represents a problem for this interpretation. In particular, its nearly exponential attenuation at the low temperature when the excitation magnetic field, , is applied along the axis, but substantially lower exponents along the other two orthogonal directions, not far from , when the power-law fitting, , is performed.
In our view, the only way to understand such behavior within a standard theory of superconductivity without invoking some complicated scenarios is to find an order parameter for which Importantly, it does not imply that is isotropic at the intermediate temperatures. Several order parameters were previously analyzed for their resulting anisotropies [28, 29], and some of them satisfy the requirement.
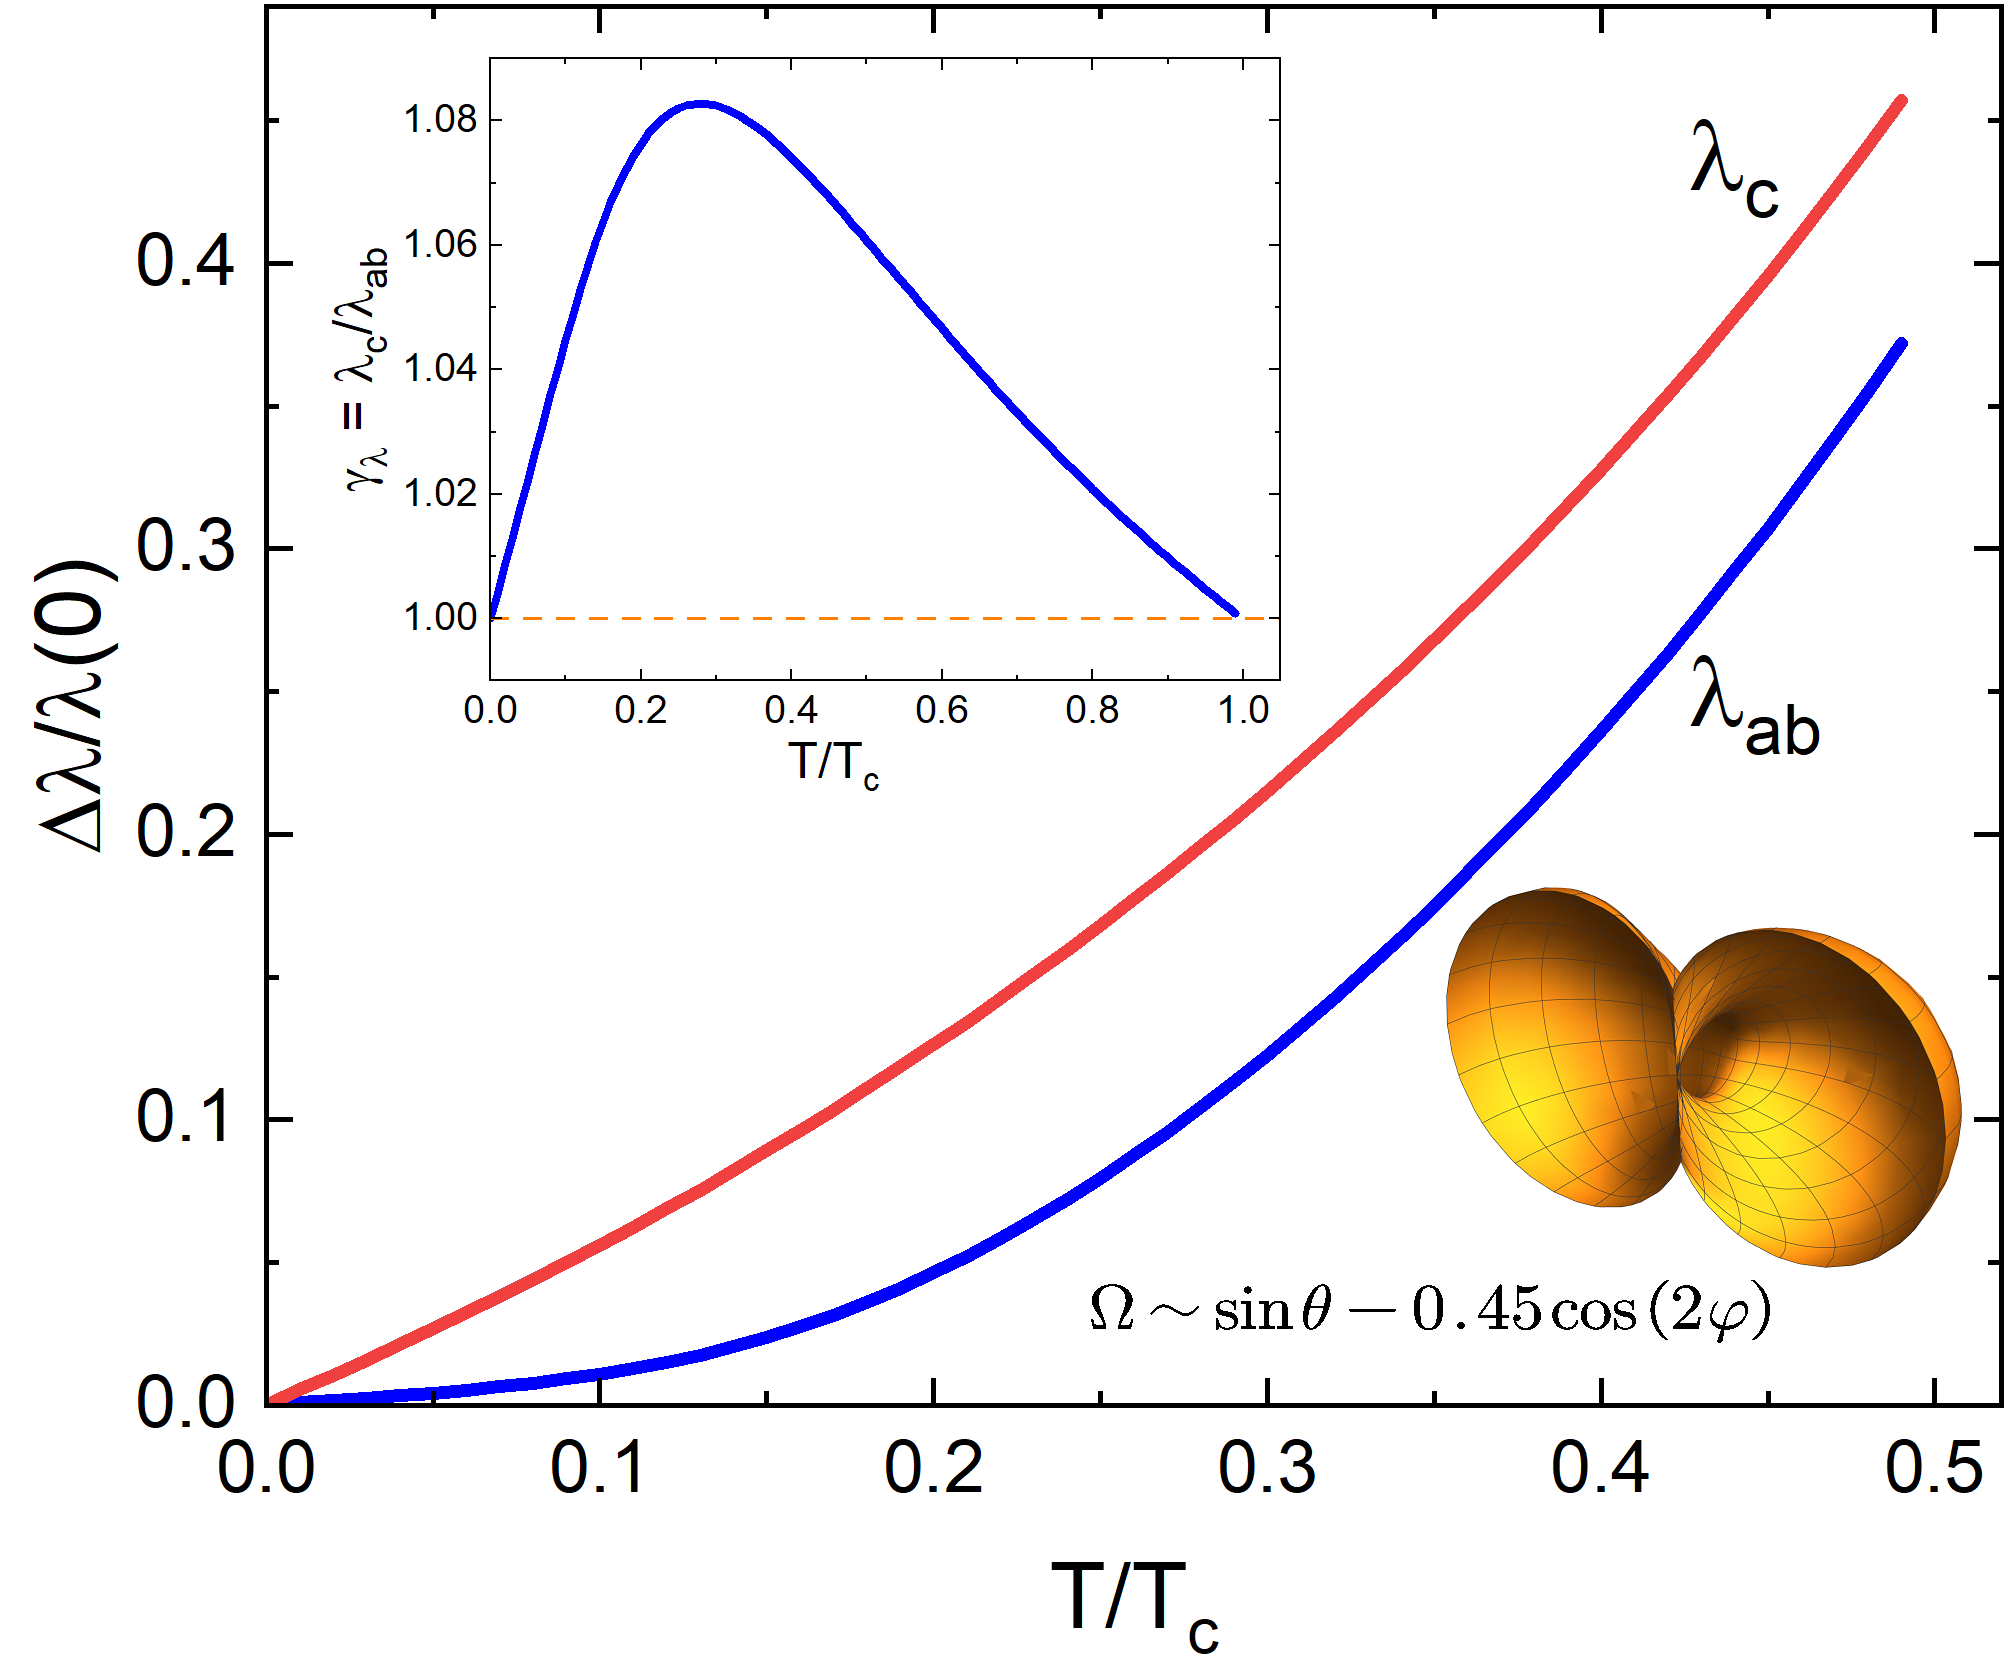
Of course, we do not know the type of the order parameter, and our crystals are not properly oriented, so this is just one plausible order parameter fully compatible with our observations. Specifically we consider a composite order parameter, , which is a combination of a wave - like variation in the plane (azimuthal angle ) and having two point nodes at the poles, at the polar angle, , as shown schematically in Fig.6. Point nodes are known to result in a power-law behavior for out-of-plane penetration depth, whereas showing nearly exponential variation in the plane [30, 29]. The reason that we chose this more complicated form of the order parameter, and not just is that at , it produces a non-monotonic shown in the inset in Fig.6, that starts at , and ends at at the isotropic value of 1. As shown in Fig.6, this order parameter results in a significant difference in between different orientations exhibiting behavior similar to our observations.
Our observations of presumably point-node superconducting gap structure should be contrasted with the chiral topological superconducting state observed in polycrystalline samples of the closely related LaPt3P [31]. The two materials are isostructural but differ by the electron count. In the LaPt3P the temperature-dependent superfluid density is consistent with nodal gap, potentially with horizontal line node and polar point nodes, as determined from SR measurements. Changing electron count moves the system to clearly point-node behavior, with line nodes erased. This observation clearly suggests that Fermi surface topology change plays important role in the superconducting pairing of the compounds. Further investigations may be of great importance.
V Conclusions
Based on the measurements of the upper critical fields, the London penetration depths, and their anisotropies, our results open up a possibility of a nontrivial order parameter in SrPt3P, possibly with point nodes somewhere on the isotropic Fermi surface. Taking into account considerable difficulty of making single crystals of this compound, this conclusion is a step forward compared to the polycrystalline samples where such observation would be impossible. We hope our work will motivate further effort to grow and measure better single crystals of SrPt3P with well-defined orientations of the facets.
Acknowledgements.
We thank Seongyoung Kong and Kirill Kovnir for help with crystallographic orientation, and Linlin Wang for useful discussions of the electronic structure. Work in Ames was supported by the U.S. Department of Energy (DOE), Office of Science, Basic Energy Sciences, Materials Science and Engineering Division. Ames Laboratory is operated for the U.S. DOE by Iowa State University under contract DE-AC02-07CH11358. N.D.Z. acknowledges support from the Laboratory for Solid State Physics ETH Zurich and the Department of Chemistry and Biochemistry of the University of Bern where crystal growth studies were initiated.VI Data Availability
All data that support the findings of this study are included within the article (and any supplementary information files).
References
- Takayama et al. [2012] T. Takayama, K. Kuwano, D. Hirai, Y. Katsura, A. Yamamoto, and H. Takagi, Phys. Rev. B 108, 237001 (2012).
- Subedi et al. [2013] A. Subedi, L. Ortenzi, and L. Boeri, Phys. Rev. B 87, 144504 (2013).
- Aperis et al. [2020] A. Aperis, E. V. Morooka, and P. M. Oppeneer, Annals of Physics 417, 168095 (2020).
- Shiroka et al. [2015] T. Shiroka, M. Pikulski, N. D. Zhigadlo, B. Batlogg, J. Mesot, and H.-R. Ott, Phys. Rev. B 91, 245143 (2015).
- Hu et al. [2016] K. Hu, B. Gao, Q. Ji, Y. Ma, W. Li, X. Xu, H. Zhang, G. Mu, F. Huang, C. Cai, X. Xie, and M. Jiang, Phys. Rev. B 93, 214510 (2016).
- Ichioka et al. [2017] M. Ichioka, V. G. Kogan, and J. Schmalian, Phys. Rev. B 95, 064512 (2017).
- Kogan and Schmalian [2011] V. G. Kogan and J. Schmalian, Phys. Rev. B 83, 054515 (2011).
- Khasanov et al. [2014] R. Khasanov, A. Amato, P. K. Biswas, H. Luetkens, N. D. Zhigadlo, and B. Batlogg, Phys. Rev. B 90, 140507 (2014).
- Chen et al. [2012] H. Chen, X. Xu, C. Cao, and J. Dai, Phys. Rev. B 86, 125116 (2012).
- Nekrasov and V. Sadovskii [2012] I. Nekrasov and M. V. Sadovskii, JETP Letters 96, 243 (2012).
- Kang et al. [2013] C.-J. Kang, K.-H. Ahn, K.-W. Lee, and B. Il Min, Journal of the Physical Society of Japan 82, 053703 (2013).
- Szczecsniak et al. [2014] R. Szczecsniak, A. P. Durajski, and L. Herok, Physica Scripta 89, 125701 (2014).
- Zhang et al. [2016] X.-Q. Zhang, Z.-Y. Zeng, Y. Cheng, and G.-F. Ji, RSC Adv. 6, 27060 (2016).
- Zocco et al. [2015] D. A. Zocco, S. Krannich, R. Heid, K.-P. Bohnen, T. Wolf, T. Forrest, A. Bosak, and F. Weber, Phys. Rev. B 92, 220504 (2015).
- Jawdat et al. [2015] B. I. Jawdat, B. Lv, X. Zhu, Y. Xue, and C.-w. Chu, Phys. Rev. B 91, 094514 (2015).
- Karpinski et al. [2007] J. Karpinski, N. Zhigadlo, S. Katrych, R. Puzniak, K. Rogacki, and R. Gonnelli, Physica C: Superconductivity 456, 3 (2007).
- Zhigadlo [2016] N. D. Zhigadlo, Journal of Crystal Growth 455, 94 (2016).
- Tanatar et al. [2010] M. A. Tanatar, N. Ni, S. L. Bud’ko, P. C. Canfield, and R. Prozorov, Superc. Sci. Technol. 23, 054002 (2010).
- Tanatar et al. [2011] M. Tanatar, R. Prozorov, N. Ni, S. Bud’ko, and P. Canfield, U.S. Patent 8,450,246 , 10pp. (2011).
- Liu et al. [2013] Y. Liu, M. A. Tanatar, V. G. Kogan, H. Kim, T. A. Lograsso, and R. Prozorov, Phys. Rev. B 87, 134513 (2013).
- Van Degrift [1975] C. T. Van Degrift, Review of Scientific Instruments 46, 599 (1975).
- Prozorov et al. [2000a] R. Prozorov, R. W. Giannetta, A. Carrington, and F. M. Araujo-Moreira, Phys. Rev. B 62, 115 (2000a).
- Prozorov et al. [2000b] R. Prozorov, R. W. Giannetta, A. Carrington, P. Fournier, R. L. Greene, P. Guptasarma, D. G. Hinks, and A. R. Banks, Appl. Phys. Lett. 77, 4202 (2000b).
- Prozorov and Giannetta [2006] R. Prozorov and R. W. Giannetta, Superconductor Science and Technology 19, R41 (2006).
- Prozorov and Kogan [2011] R. Prozorov and V. G. Kogan, Reports on Progress in Physics 74, 124505 (2011).
- Kogan and Prozorov [2012] V. G. Kogan and R. Prozorov, Reports on Progress in Physics 75, 114502 (2012).
- Kogan and Prozorov [2013] V. G. Kogan and R. Prozorov, Phys. Rev. B 88, 024503 (2013).
- Kogan et al. [2019] V. G. Kogan, R. Prozorov, and A. E. Koshelev, Phys. Rev. B 100, 014518 (2019).
- Kogan and Prozorov [2021] V. G. Kogan and R. Prozorov, Phys. Rev. B 103, 054502 (2021).
- Einzel et al. [1986] D. Einzel, P. J. Hirschfeld, F. Gross, B. S. Chandrasekhar, K. Andres, H. R. Ott, J. Beuers, Z. Fisk, and J. L. Smith, Physical Review Letters 56, 2513 (1986).
- Biswas et al. [2021] P. K. Biswas, S. K. Ghosh, J. Z. Zhao, D. A. Mayoh, N. D. Zhigadlo, X. Xu, C. Baines, A. D. Hillier, G. Balakrishnan, and M. R. Lees, Nature Communications 12 (2021).