The Role of Atmospheric Exchange in False-Positive Biosignature Detection
Abstract
Saturn’s moon Titan receives volatiles into the top of its atmosphere - including atomic oxygen - sourced from cryovolcanoes on Enceladus. Similar types of atmosphere exchange from one body to another, such as O2 and O3 sourced from TRAPPIST-1 d, could be introduced into the upper atmosphere of TRAPPIST-1 e, and might be interpreted as biosignatures. We simulate this potential false positive for life on TRAPPIST-1 e, by applying an external influx of water and oxygen into the top of the atmosphere using a coupled 1-D photochemical-climate model (Atmos), to predict atmospheric composition. In addition, synthetic spectral observations are produced with the Planetary Spectrum Generator for the James Webb Space Telescope, Origins Space Telescope, Habitable Exoplanet Observatory and Large UV/Optical/IR Surveyor to test the detectability of abiotic-generated O2 and O3 in the presence of abiotic and biotic surface fluxes of CH4. We determine that the incoming flux of material needed to trigger detection of abiotic O2/O3 by any of these observatories is more than two orders of magnitude (1 1012 molecules/cm2/s) above what is physically plausible.
An edited version of this paper was published by AGU. Copyright (2022) American Geophysical Union.
Catholic University of America, Washington, DC Center for Research and Exploration in Space Science and Technology (CRESST) NASA Ames Research Center, Mountain View, CA University of Maryland College Park, College Park, MD NASA Goddard Sellers Exoplanet Environments Collaboration, Greenbelt, MD John Hopkins Applied Physics Laboratory, Laurel, MD NASA Goddard Space Flight Center, Greenbelt, MD Goddard Earth Sciences Technology and Research (GESTAR), Universities Space Research Association (USRA), Columbia, MD American University, Washington DC, USA
Ryan Feltonryan.c.felton@nasa.gov
The transfer of volatiles through atmospheric loss processes as seen in the Titan-Enceladus system may occur amongst close-in exoplanets
We simulate the atmosphere and spectra of TRAPPIST-1 e if it was receiving an external flux of water and oxygen
Our results are important for upcoming and future observatories which must prepare for false-positive biosignatures while searching for life
Plain Language Summary
In the Saturnian system, Enceladus’ icy volcanoes spew liquid and gassy material -including water- into outer space, and some of that material ends up in Titan’s atmosphere. This is a prominent phenomenon within our solar system that has been observed in great detail and shows proof of foreign matter exchange being possible between worlds. The simultaneous presence of detectable amounts of methane and oxygen or ozone in an atmosphere is considered strong evidence for the presence of life because in a methane rich atmosphere, oxygen or ozone will be destroyed to the point of being undetectable unless life is present to replenish it and vice-versa. We explore here whether a similar type of matter exchange, with methane present and occurring in the TRAPPIST-1 system, could increase oxygen and water abundances to the point of creating atmospheric signatures that may be mistaken for signs of life on another planet. To probe this question we use computer models of atmospheres and current and next-generation space telescopes. We conclude that when looking for the simultaneous presence of methane and oxygen/ozone, this matter exchange will not be mistaken for signs of life.
1 Introduction
As we move closer to being able to characterize the atmospheres of terrestrial exoplanets, the ability to identify signs of life and filter out false-positive biosignatures will be of the upmost importance. A biosignature is a detectable property of a planet (or environment) that results from the presence of life on a planet, and whose detection requires the presence of life [Lederberg (\APACyear1965), Lovelock (\APACyear1965), Marais \BBA Walter (\APACyear1999), Des Marais \BOthers. (\APACyear2008), Schwieterman \BOthers. (\APACyear2018), Meadows \BOthers. (\APACyear2018)]. A false-positive biosignature is a means of producing such a detectable property via non-biological processes [Harman \BBA Domagal-Goldman (\APACyear2018)]. Upcoming observatories have the potential to detect and characterize terrestrial planet atmospheres, and farther-off mission concepts plan to look for biosignatures [National Academies of Sciences \BBA Medicine (\APACyear2021)]. \citeAfauchez2020sensitive have shown that for the TRAPPIST-1 planets in the habitable zone it will be challenging to detect water or any biosignature gas with the James Webb Space Telescope (JWST). However, carbon dioxide could be detectable and serve as a proxy to infer the presence of an atmosphere. NASA had four mission concepts evaluated for the Astro2020 Decadal Survey and three of them (Habitable Exoplanet Observatory, Origins Space Telescope and Large Ultra-violet Optical Infrared Surveyor - LUVOIR ) will be able to search for biosignatures on potentially habitable exoplanets [Gaudi \BOthers. (\APACyear2020), Cooray \BOthers. (\APACyear2019), LUVOIR (\APACyear2019)]. The relevant recommendations of the decadal survery were for a 6m inscribed diameter Infrared/Optical/Ultraviolet space telescope with a target launch in the first half of the 2040s and a new Probe-class mission type to focus on a far-IR spectroscopy and imaging strategic mission (i.e. Origins) [National Academies of Sciences \BBA Medicine (\APACyear2021)]. These recommendations, combined with the successful launch of JWST, motivate the continued study of biosignature and false-positive biosignature simulations in preparation for observational exoplanet atmosphere data in the near-term future. Prior work has argued that the presence of oxygen (and/or ozone, which is a photochemical byproduct of O2) in combination with methane in an atmosphere is the most promising biosignature to look for [Hitchcock \BBA Lovelock (\APACyear1967), Lovelock (\APACyear1975), Domagal-Goldman \BOthers. (\APACyear2014), Meadows (\APACyear2017)]. This classical “strong” biosignature pair of CH4 and O2/O3 is considered robust due to their chemical interaction. In an atmosphere where O2 is abundant and H2O is present, the hydroxyl radical, OH, is produced which promotes the destruction of CH4 by O2 [Levy (\APACyear1971)] while a CH4-rich atmosphere would contain reducing sinks for O2 that rapidly remove it from the atmosphere. This mutual destruction makes it difficult to maintain detectable levels of O3 in the context of a CH4-rich atmosphere without biological O2 fluxes. Therefore the simultaneous presence of CH4 and O3 is an indicator of biological production of both CH4 and O2.
Biotic and abiotic sources of atmospheric CH4 and O2 on Earth have been extensively studied and can help constrain plausible flux ranges for this study. For example CH4 can be produced as a metabolic byproduct of microbial life, and this process is evolutionarily ancient; putative evidence for this metabolism extends all the way back to 3.5 billion years ago [Ueno \BOthers. (\APACyear2006)]. And while Earth’s modern biosphere produces a biological CH4 flux of 11011 molecules/cm2/s [Pavlov \BOthers. (\APACyear2001)], estimates for the Archean range from 0.3-2.5 times this present-day value [Kharecha \BOthers. (\APACyear2005)]. CH4 is also produced through geological processes, such as serpentinization, but at lower rates [Berndt \BOthers. (\APACyear1996)]. This means there is a range of potential CH4 surface fluxes depending on whether they are produced abiotically or biotically [Arney \BOthers. (\APACyear2018)] yet both of these forms potentially lead to accumulation of detectable CH4 [Krissansen-Totton \BOthers. (\APACyear2016)]. This would complicate biosignature characterization efforts and require further context about the planet and host star to constrain the magnitude of the flux and understand its source [Krissansen-Totton \BOthers. (\APACyear2016), Arney \BOthers. (\APACyear2018)].
As reviewed in \citeAmeadows2017reflections, O2 has characteristics of a potential biosignature, but also has known, albeit specific and detectable, abiotic production mechanisms. These abiotic processes include slower O2 and O3 destruction on water (H2O)-poor planets [Gao \BOthers. (\APACyear2015)], fast O-production via photolysis on CO2-rich planets around certain star types [Domagal-Goldman \BOthers. (\APACyear2014)], and oxidation of the bulk atmosphere, driven by massive hydrogen escape on planets around pre-main sequence M-dwarfs [Luger \BBA Barnes (\APACyear2015)]. Here we consider an additional potential source of O2/O3: an influx of O from space flowing into the top of the atmosphere (TOA) to form O2 and O3 abiotically.
Titan provides an example of such an inflow, and its impact on atmospheric chemistry. Titan exhibits rich photochemistry, which produces hydrocarbons, nitriles, and a haze of organic material [Brown \BOthers. (\APACyear2009), Niemann \BOthers. (\APACyear2010)]. Titan’s atmosphere is known to contain some oxygen, primarily CO. The origin of oxygen-bearing species in Titan’s atmosphere remained unresolved until the Cassini-Huygens mission. The Cassini Plasma Spectrometer detected a flux of O+ ions into Titan’s atmosphere [Hartle \BOthers. (\APACyear2006)], suggesting an external source for Titan’s oxygen-bearing species. The active, H2O-rich plumes near Enceladus’ south pole [Porco \BOthers. (\APACyear2006)] and its H2O torus [Hartogh \BOthers. (\APACyear2011)] provide a likely source. Dissociated and ionized H2O molecules from the plumes are transported through the Saturn system supplying oxygen-bearing ions to Titan’s upper atmosphere. The precipitating O+ ions participate in Titan’s photochemistry, and are likely responsible for the presence of CO, CO2 [Hörst \BOthers. (\APACyear2008), Krasnopolsky (\APACyear2009)], and perhaps even H2O in Titan’s atmosphere [Hörst \BOthers. (\APACyear2008), Moreno \BOthers. (\APACyear2012)].
Atmosphere loss and exchange processes between worlds could be amplified in planetary systems around very active M stars. In such systems, there is the potential for the host star to strip away one planet’s atmosphere, leaving it inhospitable. The tight packing of systems like TRAPPIST-1 [Gillon \BOthers. (\APACyear2016), Gillon \BOthers. (\APACyear2017)] makes it possible for a larger portion of that lost atmosphere to be picked up by another close-by planet. Titan and Enceladus are approximately 106 km apart, the same order of magnitude as the distance between TRAPPIST-1 d and e. In this work we study a scenario where an abiotic exoplanet receives an influx of water or atomic oxygen at the TOA from an outside source. Combined with an abiotic surface flux of CH4, this creates the potential for both CH4 and either O2 or O3 to be detected. If both are simultaneously detectable for reasonable incoming flux rates, this would represent a false-positive for an biosignature that has previously been considered to be “solid.” To investigate the potential for incoming external fluxes into a terrestrial planet’s atmosphere to trigger a CH4-O2/O3 biosignature false-positive, we model the atmosphere of an abiotic planet exposed to varying exogenous fluxes of O or H2O using the coupled photochemical-climate model, Atmos [Arney \BOthers. (\APACyear2016)]. We then use the Planetary Spectrum Generator (PSG,[Villanueva \BOthers. (\APACyear2018)]) to simulate transit spectra for those atmospheres, and evaluate the detectability of O2, O3, and CH4.
The paper is broken down into the following four sections. Section 2 explains the methods and tools used for the project, Section 3 is a presentation of our main data and most pertinent results, Section 4 is where we discuss our results and explain what they mean in the context of false-positive biosignatures and finally in Section 5 we tie everything together into our conclusions.
2 Methods
2.1 Coupled Photochemical-Climate Modeling - Atmos
We use the coupled 1D photochemical-climate model, Atmos, to simulate the photochemistry and climate of TRAPPIST-1 e. The photochemical model was most recently discussed in \citeAarney2017pale and \citeAbadhan2019stellar. Here we use a version with the updated wavelength grid from \citeAlincowski2018evolved. The model solves the continuity and flux differential equations for the atmospheric species inputted and the solutions correspond to a steady state atmosphere. Boundary conditions of the atmosphere and parameters for the planet and host star are all adjustable by the user. For a given atmospheric species, the lower boundary condition can be set to either a fixed deposition velocity, a constant surface flux, a constant flux distributed throughout the troposphere or a constant surface mixing ratio. For the upper boundary, a species can be assigned a constant TOA flux. In this project, we use the planetary parameters for TRAPPIST-1 e from \citeAagol2021refining and assume an atmosphere with Earth pressure and abiotic surface boundary conditions driven by redox balance [Harman \BOthers. (\APACyear2018), Domagal-Goldman \BOthers. (\APACyear2014)]. The star and planetary parameters are listed in Table 1 and a list of the species with non-zero boundary conditions can be found in Table 2. A complete list of all species and boundary conditions is available in the supplemental material found in the Zenodo data repository link in the acknowledgements section at the end of the paper. These boundary conditions are paired with a photochemical reaction network, originally designed for Archean Earth [Arney \BOthers. (\APACyear2016)] that has been expanded to include more reactions and revised with updated reaction rate data. The applied stellar flux is based on the semi-empirical PHOENIX model spectra of TRAPPIST-1 generated by \citeApeacock2019predicting. We did not generate any appreciable haze since our largest CH4/CO2 ratio was 4 10-3, which is two orders of magnitude smaller than the 0.1 ratio at which haze is expected to form for Archean Earth conditions [Trainer \BOthers. (\APACyear2006), Arney \BOthers. (\APACyear2017)]. Although TRAPPIST-1 e is likely to be tidally locked [Kasting \BOthers. (\APACyear1993), Barnes (\APACyear2017)], we use a 1-D model which does not account for temperature and composition differences between the day and night side. To assess how inhomogeneous build-up of O2 due to tidal locking could affect the accuracy of our predictions, we perform O2 sensitivity scaling tests with our spectral simulator as described in Section 2.2 and Section 4.2.
| Parameter | Value |
|---|---|
| Host star | TRAPPIST-1 |
| Stellar type | M8V |
| Planet radius [R⊕] | 0.92 |
| Surface gravity [m/s2] | 8.01 |
| Surface pressure [bar] | 1.013 |
| Surface temperature [K] | 267 |
| Instellation [F⊕] | 0.646 |
| Note. Planetary parameters were taken from TRAPPIST-1 e [Agol \BOthers. (\APACyear2021)]. We assumed Earth-like surface pressure and the surface temperature is an average obtained from coupled photochemistry-climate simulations. | |
To simulate an abiotic atmosphere we use abiotic boundary conditions from \citeAharman2018abiotic. This approach assumes that in the absence of a biosphere, volcanic outgassing and reactions at the seafloor drive most of the chemical fluxes to/from the bottom of the atmosphere. To this set of boundary conditions, we add a surface CH4 flux as well as TOA fluxes of either O or H2O. We vary the CH4, O, and H2O flux values (Table 3), to see how the detectability of CH4, O2, and O3 change in response to these fluxes. We follow \citeAarney2018organic and institute CH4 fluxes (molecules/cm2/s) that are abiotic (1 109), ambiguously abiotic or biotic (1 1010) and biotic (6 1010). These bins are consistent with probabilistic assessments of abiotic CH4 fluxes from \citeAkrissansen2016detecting.
The incoming O fluxes range from known examples in the Solar System on the low end to values that are on the threshold of what is likely to exist in nature on the high end. The lower limit of 1 106 molecules/cm2/s is based on estimated oxygen flux into Titan’s atmosphere from \citeAsittler2009heavy and the upper limit is taken from an exoplanet habitability study by \citeAgarcia2017magnetic. \citeAgarcia2017magnetic simulated stellar induced ionospheric outflow of O+ from an Earth-twin of Proxima Centauri b, calculating the maximum O+ escape flux to be 1010 molecules/cm2/s. The high end of the range used in our study assumes maximum rates of atmospheric O loss from one terrestrial planet with perfect transfer of all material to a second planet. This type of “perfect transfer” is highly unlikely to occur in nature; so these high flux values represent an extreme end-member, to ensure that we bound all plausible incoming O flux values. For the scenario of an influx of water we follow the same pattern of establishing a lower and upper boundary.
Despite the implausibility of a water molecule surviving the trip from outer space and into an atmosphere wholly intact, we modelled the experiment this way for multiple reasons. First, there is the stoichiometric argument to be made that even if all of the water molecules were dissociated on their way to the top of a planet’s atmosphere, the hydrogen atoms should still be present. Second, using water molecules as a representation for oxygen molecule flux into an atmosphere is common practice by Titan photochemical modelers [Hébrard \BOthers. (\APACyear2012)]. Finally, by modelling a water flux we are able to account for other external oxygen sources to an atmosphere such as water ice (i.e. cryovolcanism on Enceladus). We set our incoming water flux lower bound at 5 106 molecules/cm2/s based off of the work by \citeAhebrard2012neutral. The upper bound water flux is based on estimated water loss on Earth, assuming perfectly efficient transfer of this water to a second planet. Similar to the upper end of our range of O fluxes, this is intentionally beyond the range of what we consider to be likely to occur in nature, as a means of ensuring that we have included all possible incoming H2O flux rates. For both the O and H2O flux there is the potential that neither of these scenarios will trigger a simulated O2/O3 signal. If this occurs we want to be able to quantify the fluxes needed to generate a false-positive. To prepare for this possibility we extend our simulations up to 1 1012 molecules/cm2/s.
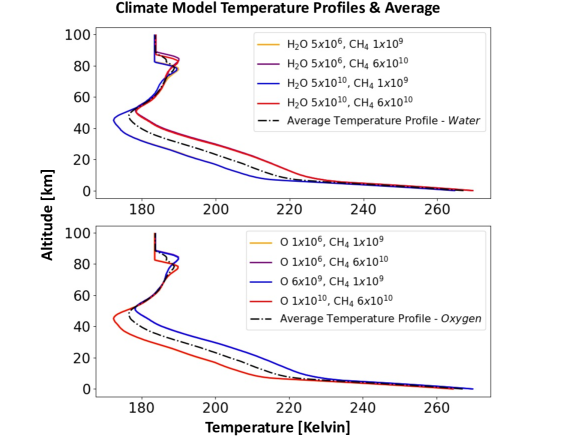
The temperature-pressure profiles we use in this study are obtained by coupling the photochemistry model to the Atmos climate model. Derived from the 1D model created by \citeAkasting1986climatic, the version of the climate code used here has undergone many updates [Kopparapu \BOthers. (\APACyear2013), Arney \BOthers. (\APACyear2016)]. The code uses the two-stream approximation [Toon \BOthers. (\APACyear1989)] and absorption by the spectrally active gases - H2O, O2, O3, CH4 and C2H6 - is calculated based on the correlated- method. The model’s H2O and CO2 -coefficient have recently been recomputed using the HITRAN2016 database [Gordon \BOthers. (\APACyear2017)]. We use the Mega-MUSCLES TRAPPIST-1 spectral energy distribution from \citeAwilson2021mega for the climate model. In coupled mode, the photochemistry model passes the vertical mixing ratio profiles of the spectrally active gases and planetary parameters to the climate model. These are used by the climate model to compute the temperature-pressure profile and tropospheric water abundance which are in turn passed to the photochemistry model. The models iterate back and forth until both individual models are converged and a self-consistent atmospheric solution in radiative convective equilibrium is determined. For this study, we assume the tropospheric relative humidity parameterization by \citeAManabe1967. We run eight coupled photochemistry-climate simulations applying O2, H2O and CH4 fluxes within the physically plausible range (Table 3). Subsequently, averaged temperature pressure profiles are computed and used as input for every photochemical simulation, see Fig. 1. Note that we are unable to arrive at a coupled solution for the boundary condition O flux 1 1010 molecules/cm2/s, CH4 flux 1 109 molecules/cm2/s and instead use the O flux 6 109 molecules/cm2/s.
| Species | Boundary Type | Value |
| O | , downward flux | 1, 1 106 - 1 1010 |
| O2 | 1 10-4 | |
| H2O | , downward flux | 0, 5 106 - 5 1010 |
| H | 1 | |
| OH | 1 | |
| HO2 | 1 | |
| H2O2 | 0.5 | |
| H2 | , upward flux | 6.81 10-6, 1 1010 |
| CO | 1 10-8 | |
| HCO | 1 | |
| H2CO | 0.1 | |
| CH4 | upward flux | 1 109 - 6 1010 |
| CH3 | 1 | |
| C2H6 | 1 10-5 | |
| NO | 3 10-4 | |
| NO2 | 3 10-3 | |
| HNO | 1 | |
| N | downward flux | 1 108 |
| H2S | , upward flux | 0.015, 3 108 |
| HSO | 1 | |
| H2SO4 | 0.2 | |
| SO | 3 10-4 | |
| CO2 | fixed mixing ratio | 0.02 |
| S | 1 | |
| HS | 3 10-3 | |
| SO2 | , upward flux | 1, 3 109 |
| SO4 Aerosol | 1 10-2 | |
| S8 Aerosol | 1 10-2 | |
| C4H2 Aerosol | 1 10-2 | |
| C5H4 Aerosol | 1 10-2 | |
| HNO2 | short-lived | |
| O(1D) | short-lived | |
| CH | short-lived | |
| C | short-lived | |
| SO | short-lived | |
| SO | short-lived | |
| HSO3 | short-lived | |
| OCS2 | short-lived | |
| CS | short-lived | |
| Note. Species with non-zero boundary conditions used in the photochemical model. is the deposition velocity (cm/s) for a species, downward flux (molecules/cm2/s) is relative to the TOA, i.e. material entering the TOA from outer space, and upward flux is relative to the surface, i.e. material outgassing from the surface and moving up into the atmosphere. The multiple flux values for O, H2O, and CH4 correspond to the lower and upper physical limit values we impose. For a full list of boundary conditions, see the input files for our simulations at our Zenodo repository in the Acknowledgements section. | ||
| TOA flux | CH4 flux | |
| 1) Oxygen flux | 1 106 | 1 109 |
| 2) Oxygen flux | 1 106 | 6 1010 |
| 3) Oxygen flux | 1 1010 | 6 1010 |
| 4) Oxygen flux | 6 109 | 1 109 |
| 5) Water flux | 5 106 | 1 109 |
| 6) Water flux | 5 106 | 6 1010 |
| 7) Water flux | 5 1010 | 1 109 |
| 8) Water flux | 5 1010 | 6 1010 |
| Note. Flux input combinations used in the coupled photochemical-climate model runs. | ||
2.2 Synthetic Spectrum Generator - PSG
After all photochemical simulations are complete the vertical mixing ratio profiles of gases known to have an impact on terrestrial planet spectra - N2, H2O, CH4, C2H6, CO2, O2, O3, CO, and H2CO - are sent as inputs to PSG, to produce synthetic transit spectra. PSG is an online radiative transfer tool [Villanueva \BOthers. (\APACyear2018)] that uses a combination of radiative transfer models and spectroscopic databases to produce synthetic atmospheric spectra with either line-by-line calculations, the correlated-k method, or a combination of the two. For this project all spectroscopic data uses a combination of these two methods. Numerous types of planetary bodies (i.e. planets, exoplanets and comets) can be studied with PSG and we use it to simulate the transmission spectrum of our simulated planets as observed by four unique space-based observatories: JWST, Origins, HabEx and LUVOIR.
Clouds are prescribed in PSG based on TRAPPIST-1 e Archean Earth-like global climate model (GCM) simulations [Fauchez \BOthers. (\APACyear2019)] using LMD-G GCM \citeAwordsworth2011gliese. Water and ice clouds are distributed between the surface and 19 km in the atmosphere profile. Water clouds, with a mass mixing ratio [kg/kg] of water droplets of 2 10-6, range from the surface to 12 km and then ice clouds (mass mixing ratio [kg/kg] of ice droplets: 2 10-7) are between 13 and 19 km. For every simulation with clouds, a clear sky case is also simulated.
From the photochemical-climate simulations we use the flux combinations 1, 3, 4, 5, 7 and 8 in Table 3. #1 and 5 are used to look for simulated detections of CH4 at the lowest abundances, 3 and 8 probe for CH4 and O2/O3 at the highest plausible ranges and 4 and 7 are used for O2 sensitivity scaling tests. Since our simulations do not account for tidal locking and 3D GCM considerations (i.e. day-night side modeling), sensitivity tests on O2 accumulation are performed with PSG. This consists of scaling the O2 mixing ratio by a factor of 0.5, 2 and 10 and then analyzing the resulting spectra for O2 features across every observatory. The scaling is performed uniformly throughout the atmosphere on O2’s mixing ratio; N2’s mixing ratio is set to maintain a total atmospheric pressure of 1 bar. To determine whether or not a signature is present and detectable by any of the four observatories a signal-to-noise ratio (S/N) has to be determined. This is dependent on tuning the resolving power of the instrument, for a specific signal (i.e. CH4 at 7.72 m), so that the resulting signal amplitude, continuum height, synthetic noise error bars and transmittance spectra provide the highest S/N. Note that due to the successful launch of JWST, the amount of fuel present has been estimated to allow a 20 year lifetime. This is in contrast to the original 5.5 nominal lifetime pre-launch. We round this down to 5 years, and use the Contamination & Visibility Calculator tool (https://exoctk.stsci.edu/contam_visibility) to determine TRAPPIST-1 e will only be in the observing zone approximately a third of the time and so the system will be observable for 85 transits. We begin with 85 transits to compute the S/N for all telescope simulations and then an additional 1/ scaling, where is the number of photons, is applied to calculate 10 and 20 year lifetimes (170 and 340 transits respectively). An atmosphere profile and observatory are selected and given a resolving power (R) to start with, typically R=100. PSG is run and the resulting spectra are checked for CH4, O2 or O3 signals. Non-overlapping features are identified and the best one is chosen based on the S/N. The S/N of the feature is calculated by subtracting the continuum from the features amplitude and then dividing that by the features synthetic noise. This provides an S/N value and then the resolving power is lowered from 100 in increments of 10 until the largest S/N is found. For all observatories, except JWST, we do not include their estimated noise floors and instead follow the procedure of \citeAfauchez2019impact and \citeAPidhorodetska2020 by assuming a photon limited scenario where the noise is perfect and decreases with 1/, with being the number of transits. When JWST simulations are performed a noise floor of 10ppm is assumed. The observatory specific instruments and parameters are listed below. Note that although Origins, HabEx and LUVOIR have direct imaging capabilities we only simulate the instruments specific to observing exoplanets in transit.
-
1.
Simulated JWST observations use two instruments: the Mid-Infrared instrument (MIRI) with the Low Resolution Spectroscopy (LRS) and the Near-Infrared Spectrograph (NIRSpec) with the Prism mode. MIRI-LRS observes in the 5-12 m range and NIRSpec Prism is in 0.7-5 m range. The MIRI-LRS configuration uses a resolving power of R=50 while NIRSpec Prism is set to 30 resolving power. MIRI-LRS has its S/N optimized by adjusting the resolving power, just as all of the other instruments do; R=50 gives the best results. We find this combination of instrument and transits to give the best resolution of our TRAPPIST-1 e hybrid while other scientists studying TRAPPIST-1 e with PSG [Fauchez \BOthers. (\APACyear2019), Pidhorodetska \BOthers. (\APACyear2020)] have also used MIRI-LRS and NIRSpec Prism for simulating TRAPPIST-1 e transit observations.
-
2.
For the Origins simulations we use the Transit Spectrometer of the Mid-Infrared Imager/Spectrograph/Coronagraph (MISC) Instrument in the 2.8-11 m range with a resolving power of 30 [Cooray \BOthers. (\APACyear2019)].
-
3.
The HabEx simulations use the HabEx Work Horse Camera (HWC) with 30 resolving power in the 0.37-1.8 m range [Gaudi \BOthers. (\APACyear2020)].
-
4.
The LUVOIR simulations are performed with the High Definition Imager (HDI) instrument, the block A mirror size (15 m) and a resolving power of 30 in the 0.2-2.5 m range [LUVOIR (\APACyear2019)]. The Astro2020 Decadal Survey recommended a space observatory with a mirror that has a 6m inscribed diameter, that would be a combination of the ideas and concepts laid out for LUVOIR and HabEx [National Academies of Sciences \BBA Medicine (\APACyear2021)]. However, since our larger LUVOIR-A simulations do not produce a simultaneous CH4 and O2/O3 detection it is unnecessary to also perform LUVOIR-B, or any architectures with smaller apertures, simulations.
3 Results
3.1 Atmos Results
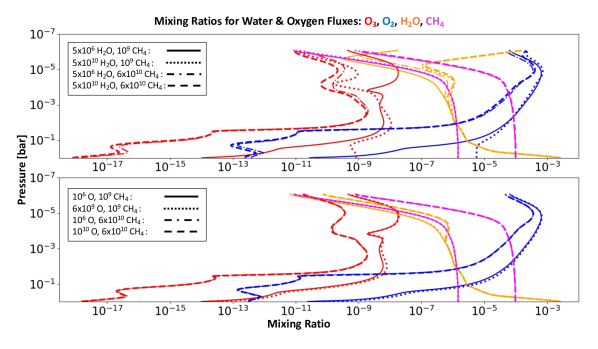
Our coupled photochemical-climate model results appear in Fig. 2, 3, and 4. In Fig. 2 we display our mixing ratios for O3, O2, H2O and CH4. H2O fluxes (top panel) have a more dramatic effect on the abundances of O3, O2, H2O and CH4, than the O fluxes (bottom panel). In the top panel a build up of H2O in the upper layers of the atmosphere occurs, which is directly tied to the incoming TOA H2O flux rising. Despite the large amount of incoming H2O there was no super saturation in the top region of the atmosphere. When the CH4 flux is low, increasing the water flux results in a higher percentage of O3 and O2 near the surface of the planet; when the CH4 is high, varying the H2O flux has little effect on the mixing ratios. This divergence between O2 and O3 surface mixing ratios, when water flux increases, is due to catalytic cycles between OH, HO2 and H2O2 and increasing escape of H and H2 from the atmosphere. The escaping H and H2 diminish both the reducing power of the atmosphere and the strength of the catalytic cycle, thus removing O2 sinks. As the water flux increases and the atmosphere is unable to maintain the catalytic cycle, O2 builds up in the lower half of the atmosphere. This will only occur when the atmosphere crosses a redox threshold where it is becoming oxidized with time, which in the case of our simulations occurs when the water or oxygen TOA flux is greater than 1 1010 molecules/cm2/s, which is why the behavior is not seen in the bottom panel of Fig. 2. In the bottom panel the only noticeable changes occur when the CH4 flux is varied, while the differences between low and high O flux are insignificant.
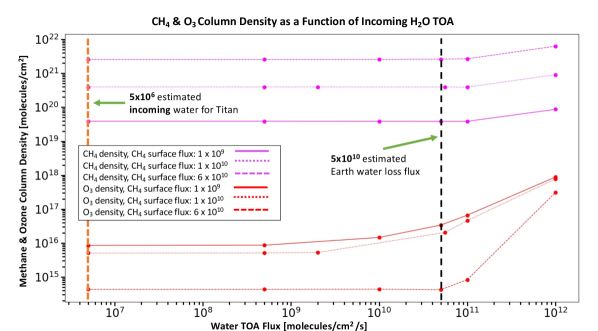
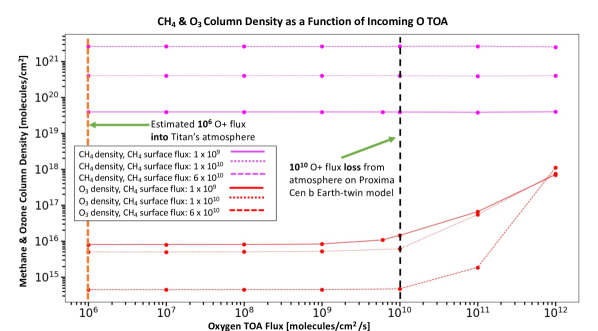
To show the effects of H2O and O fluxes on the whole atmosphere, we present CH4 and O3 column densities as a function of H2O flux (Fig. 3) and O flux (Fig. 4). As the incoming water and oxygen approaches the upper limit, the simulations show a gradual rise in O3 densities while CH4 densities remain completely static; the densities are not reacting strongly to the rising fluxes. The region on the far right of Fig. 3, and 4 shows the results when the physically plausible limits for water and oxygen fluxes are exceeded. It is important to note that these points past the limits are not included in the mixing ratio plots of Fig. 2. Only when this limit is breached do the simulated atmospheres begin to respond more sharply to the incoming oxygen and water. This is evident in the 1 to 3 order of magnitude changes in O3 column densities for both water and oxygen fluxes. Conversely, the CH4 is still responding slowly to the increasing fluxes (Fig. 3) or remaining unperturbed (Fig. 4).
Since our simulated atmospheres are receiving additional amounts of reducing and oxidizing material it is important to track the global ocean-atmosphere redox imbalance budgets to confirm redox is being conserved (Table 4 and Table 5). The redox imbalance represents the net reductant flux going into the atmosphere (+) or going into the ocean (-). We follow the methodology described in \citeAharman2018abiotic and our results show the global ocean-atmosphere redox for the boundaries of our parameter space and the flux combinations that are used in PSG. Our photochemical model is able to simulate modern day Earth conditions, an atmosphere with large biological methane and oxygen fluxes. We compare these modern day Earth ocean-atmosphere redox results to our influx simulations as a check for consistency.
| H2O flux | CH4 flux | Ocean-Atmosphere Redox Imbalance |
|---|---|---|
| 5 106 | 1 109 | -9.48 109 |
| 5 1010 | 1 109 | 7.66 109 |
| 5 106 | 6 1010 | 4.61 109 |
| 5 1010 | 6 1010 | 2.24 1010 |
| Modern Earth | 1 1011 | -2.95 108 |
| Note. Global ocean-atmosphere redox values for the photochemical simulations that are coupled [Harman \BOthers. (\APACyear2018)]. The global ocean-atmosphere redox imbalance for the Modern Earth run with our photochemical model is also included as a reference for a world with large biological methane and oxygen fluxes. | ||
| O flux | CH4 flux | Ocean-Atmosphere Redox Imbalance |
|---|---|---|
| 1 106 | 1 109 | -9.47 109 |
| 6 109 | 1 109 | -3.56 109 |
| 1 106 | 6 1010 | 4.63 109 |
| 1 1010 | 6 1010 | 1.463 1010 |
| Modern Earth | 1 1011 | -2.95 108 |
| Note. Coupled global ocean-atmosphere redox values when an oxygen flux into the TOA is present. | ||
3.2 Synthetic Spectra Features - CH4, O3, O2
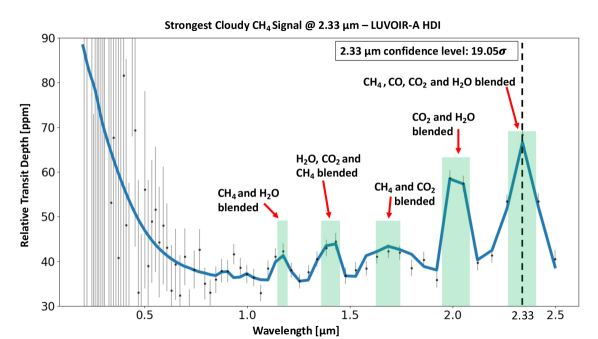
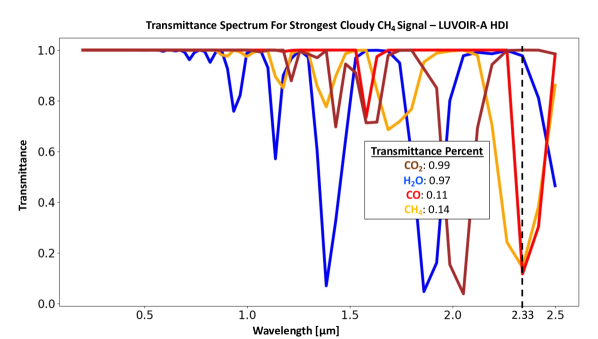
The first PSG-calculated molecule-detection signal/noise results appear in Table 6. This shows the S/N for all four observatories and their instruments under both, clear sky and cloudy conditions. We use the S/N as a metric to estimate the detectability of a given feature with a S/N of 5 being considered as reliable. And S/N is shown for 5, 10 and 20 year mission lifetimes. Due to the speculative nature of mission lifetimes beyond 5 years we only highlight the 5 year results here within the text as the baseline. The largest S/N for an atmosphere with clouds is produced for a LUVOIR-A HDI synthetic observation (19.05) and the relative transit depth (contrast) and transmittance spectra for this signal are shown in Fig. 5. This is a CH4 feature at 2.33 m where the cloud opacity is weak in the transmittance and a TOA oxygen flux is present. Under clear sky conditions (Table 6), we predict that the following telescopes would detect a CH4 feature due to a S/N 5: Origins at 3.29 m, JWST NIRSpec PRISM at 3.37 m and LUVOIR at 2.33 m. Under cloudy conditions only LUVOIR would detect a simulated CH4 feature (2.33 m) due to a confidence level of at least 5. There were no instances of a simulated O3 or O2 feature detectable simultaneously with CH4 within the physical limit bounds we established. Our O2 sensitivity scaling test also returned null results for O2 or O3 S/N. The only observatory that showed a simulated feature was LUVOIR at 0.25 m but the noise was extremely high (500 ppm) resulting in a S/N less than 1. The extended mission lifetime scaling resulted in additional simulated CH4 features with a S/N 5 but did not produce any reliable O2 or O3 features (Table. 6).
| Cloudy | Clear Sky | |||
| Observatory | O flux | CH4 flux | CH4 S/N | CH4 S/N |
| Potential Lifetimes [years] | 5, 10, 20 | 5, 10, 20 | ||
| JWST MIRI-LRS | 1 1010 | 6 1010 | 2.19, 3.09, 3.20 | 3.93, 5.55, 5.75 |
| JWST NIRSpec PRISM | 1 1010 | 6 1010 | 2.34* | 5.02* |
| ORIGINS MISC-T | 1 1010 | 6 1010 | 4.36, 6.17, 8.73 | 8.80, 12.45, 17.61 |
| HabEx HWC | 1 1010 | 6 1010 | 1.47, 2.08, 2.95 | 4.93, 6.97, 9.86 |
| LUVOIR-A HDI | 1 1010 | 6 1010 | 19.05, 26.94, 38.11 | 34.79, 49.21, 69.59 |
| Observatory | H2O flux | CH4 flux | CH4 S/N | CH4 S/N |
| JWST MIRI-LRS | 5 1010 | 6 1010 | 2.18, 3.09, 3.20 | 3.87, 5.47, 5.67 |
| JWST NIRSpec PRISM | 5 1010 | 6 1010 | 2.35* | 5.03* |
| ORIGINS MISC-T | 5 1010 | 6 1010 | 4.38, 6.20, 8.77 | 8.83, 12.48, 17.66 |
| HabEx HWC | 5 1010 | 6 1010 | 1.50, 2.13, 3.01 | 4.95, 7.00, 9.91 |
| LUVOIR-A HDI | 5 1010 | 6 1010 | 18.01, 25.47, 36.02 | 33.75, 47.73, 67.50 |
| O flux | CH4 flux | O2, O3 S/N | O2, O3 S/N | |
| All Observatories | 6 109 | 1 109 | - | - |
| H2O flux | CH4 flux | O2, O3 S/N | O2, O3 S/N | |
| All Observatories | 5 1010 | 1 109 | - | - |
| Note. S/N results for all observatories studied. The S/N is computed for the in transit time only, without considering the out of transit observation and the values are for 85, 170 and 340 transits. The bolded values represent simulated detections with confidence levels of 5 or higher. All O3 and O2 features are predicted to be non-existent , blended too heavily with other gases or completely enveloped by the synthetic noise. Flux is in units of molecules/cm2/s. *Asterisk’s denote JWST S/N values that triggered the estimated 10ppm noise floor in the first 5 years and thus are unable to improve their S/N with longer mission lifetimes (more transits). | ||||
3.3 Synthetic Spectra - Incoming Oxygen Water Past the Limits
Even though no O3 or O2 synthetic signal is produced within the bounds set in the column density plots from Fig. 3 and 4, we estimate how much O or H2O flux is required to cause a potentially detectable O3/O2 signal. When the physical flux bounds were surpassed, simulated features appear within the wavelength range of JWST MIRI-LRS and LUVOIR-A but their transit depths and S/N are below the level of a reliable detection (Table 7). For JWST MIRI-LRS there is a simulated O3 feature at 9.6 m but the S/N is smaller than 5. Additionally, there is a 0.25 m feature in LUVOIR-A’s wavelength range; however, due to extreme noise in the UV the resulting S/N for this feature is less then 1. When the extended mission lifetimes are taken into account and the physically plausible flux ranges are breached, Origins MISC-T is able to simulate an O3 feature at 9.73 m with an S/N 5 after 10 years (170 transits).
| Cloudy | Clear Sky | |||
| Observatory | O flux | CH4 flux | O3 S/N | O3 S/N |
| Potential Lifetimes [years] | 5, 10, 20 | 5, 10, 20 | ||
| JWST MIRI-LRS | 1 1012 | 1 109 | 0.65, 0.92, 1.24 | 1.90, 2.69, 3.62 |
| JWST NIRSpec PRISM | 1 1012 | 1 109 | - | - |
| ORIGINS MISC-T | 1 1012 | 1 109 | 1.00, 1.42, 2.01 | 3.03, 4.29, 6.07 |
| HabEx HWC | 1 1012 | 1 109 | - | - |
| LUVOIR-A HDI | 1 1012 | 1 109 | 0.09, 0.14, 0.19 | 0.14, 0.20, 0.29 |
| Observatory | H2O flux | CH4 flux | O3 S/N | O3 S/N |
| JWST MIRI-LRS | 1 1012 | 1 109 | 0.84, 1.19, 1.61 | 2.08, 2.94, 3.95 |
| JWST NIRSpec PRISM | 1 1012 | 1 109 | - | - |
| ORIGINS MISC-T | 1 1012 | 1 109 | 1.35, 1.91, 2.71 | 3.46, 4.90, 6.93 |
| HabEx HWC | 1 1012 | 1 109 | - | - |
| LUVOIR-A HDI | 1 1012 | 1 109 | 0.09, 0.13, 0.19 | 0.14, 0.20, 0.28 |
| Note. Synthetic simulations in the physically implausible parameter space from Fig 3 and 4. The CH4 flux uses the abiotic value of 1 109 molecules/cm2/s. Under these conditions, If the physically plausible flux ranges are breached and a mission lifetime extends past 10 years, then Origins MISC-T produces a synthetic O3 observation, under clear sky conditions, with an S/N 5. | ||||
3.4 Synthetic Spectra - Abiotic CH4 Detections
At the abiotic CH4 flux level (1 109) we consider in our work, CH4 features are present but all of them are at a S/N lower than 5 and/or heavily blended with other gases such as H2O and CO except when simulating ORIGINS MISC-T extended lifetime observations (Table 8). Under clear sky conditions we simulate ORIGINS detecting a 3.29 m CH4 with a S/N larger than 5. We also predict a simulated CH4 feature in clear sky conditions for LUVOIR-A at 2.33 m with a S/N over 21; however, the transmittance spectrum shows that this feature is predominately CO at 70. No potentially reliable simulated feature was detected under cloudy conditions.
| Cloudy | Clear Sky | |||
| O flux | CH4 flux | CH4 S/N | CH4 S/N | |
| Potential Lifetimes [years] | 5, 10, 20 | 5, 10, 20 | ||
| ORIGINS MISC-T | 1 106 | 1 109 | - | 4.16, 5.88, 8.32 |
| H2O flux | CH4 flux | CH4 S/N | CH4 S/N | |
| ORIGINS MISC-T | 5 106 | 1 109 | - | 4.16, 5.88, 8.32 |
| Note. S/N CH4 results when the CH4 surface flux was 1 109 molecules/cm2/s which is considered an abiotic flux. Using these fluxes, we predict that CH4 is detectable under clear sky conditions in the extended lifetime scenario for ORIGINS MISC-T for both incoming flux types. Bolded values represent simulated detections with confidence levels of 5 or higher. | ||||
4 Discussion
To avoid misidentifying biosignatures it is important to be aware of the many false-positives that can arise given the complexity of terrestrial exoplanets that we expect to encounter. We explored here whether the mechanism of volatiles flowing into a terrestrial planet’s atmosphere could produce a false positive by raising the levels of oxygen and ozone to abundances that would be misinterpreted as originating from biology. Our results indicate that this mechanism would not produce a detectable false-positive biosignature when observed by JWST or a next-generation observatory.
To simulate the incoming material flow of volatiles we needed to simulate a range of fluxes to the TOA. When doing so, we sought to set an aggressive value for the upper end of our flux range, to ensure our range of fluxes included all possible abiotic fluxes. We envisioned a scenario where a planet, such as TRAPPIST-1 d, orbiting an M dwarf was losing its atmosphere and that the next closet planet in the direction of the outflow was gaining it into their atmosphere, which in this case would be TRAPPIST-1 e. An M-dwarf system was chosen due to the ubiquitousness of M-dwarfs in the galaxy, the close-in region of the habitable zone around M-dwarfs and the tendency for increased stellar activity compared to G-stars which would lead to a higher chance of planets losing their atmospheres. Active M-dwarfs with their extreme ultraviolet output and flares are likely to increase atmospheric escape on any of their close-in planets causing the planets to lose their atmosphere. Even under such extreme assumptions, where every molecule outgassed from one planet ends up entering the second, we did not predict a detectable O2/O3 signal.
4.1 Oxygen & Water’s Role in Detectability
The results allow for a strong conclusion: fluxes of O into a planetary atmosphere will not lead to a detectable O3 signal in an atmosphere that also has appreciable CH4. The current understanding of O3 detectability is that in atmospheres with detectable CH4, O3 will not be detectable for abiotic O2 fluxes, which are significantly smaller than the O2 flux from modern day biology 4 1013 molecules/cm2/s [Walker (\APACyear1974)]. By considering that prior work and our results here, there is a consistent conclusion. Whether O is flowing into the atmosphere at the bottom or the top, the rates required to have O3 accumulate to detectable levels in a CH4-rich atmosphere are orders of magnitude higher than can be achieved through abiotic processes. Thus, gas fluxes - if they can be constrained - remain a very strong biosignature. Similarly, we predict water influxes will not generate detectable O3 concentrations. The incoming water flux does produce potentially detectable O3 when extended mission lifetimes are considered but only at implausibly high fluxes. Thus, we can confidently say that an incoming water flux will not lead to a false-positive for the CH4-O2/O3 biosignature pair.
4.2 Methane Detectability, Sensitivity Scaling of O2 Next Steps, JWST Scaling
Although this was not the main motivation for this study, we were also able to consider the impact of TOA H2O and O fluxes on the detectability of CH4. As Table 8 shows, we were able to predict the detection of a potentially reliable synthetic abiotic CH4 feature when extended mission lifetimes were considered. Assuming an ORIGINS-like Probe-class mission is developed and launched, as the decadal survey recommends, then we can expect it to be able to detect abiotic amounts of CH4 in a dry abiotic terrestrial atmosphere. Though LUVOIR-A saw a signal at 2.33 m under clear sky conditions and the S/N was larger than 5, the issue becomes separating the signal into the CH4 and CO components which already heavily favor the CO based on the transmittance results. If a desiccated (i.e. clear sky conditions) Earth-sized world was being observed and CO could be constrained then a next-generation observatory on the scale of LUVOIR-A may also be able to detect abiotic amounts of CH4. This leads to the conclusion that neither JWST or any of the potential next-generation observatories could reliably detect abiotic CH4 in a wet abiotic terrestrial atmosphere. Nevertheless, we urge caution in ascribing a biological source of CH4 unless the CH4 itself can be constrained to be at levels only consistent with a global biosphere.
Even though TRAPPIST-1 e is likely to be a synchronous rotator, by using a 1D model we negated the potential day and night side atmosphere discrepancies that could arise on such a body. However, our sensitivity scaling test on the accumulation of O2 showed no effect on the detectability of this species. In addition, \citeAchen2018biosignature, chen2019habitability have shown that major atmospheric species of interest to our work (CH4 and O3) do not experience order of magnitude mixing ratio differences between the day and night side of tidally locked worlds orbiting active or quiescent M dwarfs.
While this study focused on the ability of TOA fluxes to create a “false positive” for life, additional studies may be performed to see how observations could detect and constrain the TOA fluxes. Such studies should make predictions of the observable impacts of this planetary process. This would allow future observatories to put these processes, observed on Titan, into a comparative planetology framework. The temperature profiles of our simulations could also be further improved with the coupling of a GCM. The inclusion of 1D climate coupling was a critical first step to simulating reasonable temperature profiles but the lack of cloud feedbacks on the temperature and atmosphere mean both the photochemical and spectral simulations can be further refined. Finally, we focused exclusively on space based observatories but next-generation ground based telescopes such as the European-Extremely Large Telescope (E-ELT) [Gilmozzi \BBA Spyromilio (\APACyear2007)], Giant Magellan Telescope (GMT) [Johns (\APACyear2006)] and the Thirty Meter Telescope (TMT) [Skidmore \BOthers. (\APACyear2015)] may also have a role to play in Earth-sized exoplanet characterization endeavors. This is highly dependent on the outcome of technological breakthroughs that are being tested at this time. For example, the E-ELT was recently upgraded as part of the New Earths in the Alpha Centauri Region (NEAR) campaign through the Breakthrough Initiatives. This upgrade consisted of experimental starlight suppression techniques while observing in the mid-infrared and the results currently stand at a potential minimum detection range of 3 Earth-radii [Carlomagno \BOthers. (\APACyear2020), Wagner \BOthers. (\APACyear2021)]. If this technology trend continues and the upcoming class of extremely large ground telescopes can reach smaller radii capabilities, then simulated false-positive biosignature detection comparisons between ground and space-based observatories would be an appropriate next step.
5 Conclusions
Our study shows that for transmission spectroscopy observations of terrestrial exoplanets orbiting M-dwarfs, the transfer of water or oxygen from one planet to another will not trigger a detectable false-positive for the biosignature consisting of the simultaneous presence of CH4 and O2/O3 in a planetary atmosphere. The fluxes (1 1012 molecules/cm2/s) required to do so would need to be more than two orders of magnitude larger than what abiotic processes would allow.
Acknowledgements.
DATA AVAILABILITY: All photochemical model runs, input files, and PSG configuration files are accessible at the public repository: \citeAfeltonzenodowater2021. Goddard affiliates acknowledge support from the GSFC Sellers Exoplanet Environments Collaboration (SEEC), which is funded in part by the NASA Planetary Science Division’s Internal Scientist Funding Model. This work was performed as part of NASA’s Virtual Planetary Laboratory, supported by the National Aeronautics and Space Administration through the NASA Astrobiology Institute under solicitation NNH12ZDA002C and Cooperative Agreement Number NNA13AA93A, and by the NASA Astrobiology Program under grant 80NSSC18K0829 as part of the Nexus for Exoplanet System Science (NExSS) research coordination network. RCF and STB acknowledge support by NASA under award number 80GSFC21M0002. KEM and ALK acknowledge support from NASA NFDAP 80NSSC18K1233. RCF performed all photochemical and PSG model runs, led analysis of the results and drafted the manuscript. SDDG helped conceptualize the project, and with STB provided guidance on the photochemical simulations and interpretations thereof, and provided feedback on the exoplanet and observatory implications of the work. STB also performed all coupled photochemistry-climate simulations. KEM and ALK provided insights into the transport of oxygen and water molecules in the Saturn system as well as guidance on determining reasonable upper limits for escape of heavy molecules from atmospheres. TJF provided inputs on the simulation of the transmission spectra and on the detectability of molecular signatures as well as on the observatories. Everyone contributed to the edits and comments of the entire manuscript. We would like to thank Jaime Crouse for the photolysis cross-section updates she made to the photochemical-climate model. We would also like to acknowledge the following individuals for their insights and guidance: Giada Arney, Chester “Sonny” Harman, Marc Neveu, Daria Pidhorodetska, Sean Terry and Geronimo Villanueva.References
- Agol \BOthers. (\APACyear2021) \APACinsertmetastaragol2021refining{APACrefauthors}Agol, E., Dorn, C., Grimm, S\BPBIL., Turbet, M., Ducrot, E., Delrez, L.\BDBLothers \APACrefYearMonthDay2021. \BBOQ\APACrefatitleRefining the transit-timing and photometric analysis of TRAPPIST-1: masses, radii, densities, dynamics, and ephemerides Refining the transit-timing and photometric analysis of TRAPPIST-1: masses, radii, densities, dynamics, and ephemerides.\BBCQ \APACjournalVolNumPagesThe planetary science journal211. \PrintBackRefs\CurrentBib
- Arney \BOthers. (\APACyear2018) \APACinsertmetastararney2018organic{APACrefauthors}Arney, G., Domagal-Goldman, S\BPBID.\BCBL \BBA Meadows, V\BPBIS. \APACrefYearMonthDay2018. \BBOQ\APACrefatitleOrganic haze as a biosignature in anoxic Earth-like atmospheres Organic haze as a biosignature in anoxic Earth-like atmospheres.\BBCQ \APACjournalVolNumPagesAstrobiology183311–329. \PrintBackRefs\CurrentBib
- Arney \BOthers. (\APACyear2016) \APACinsertmetastararney2016pale{APACrefauthors}Arney, G., Domagal-Goldman, S\BPBID., Meadows, V\BPBIS., Wolf, E\BPBIT., Schwieterman, E., Charnay, B.\BDBLTrainer, M\BPBIG. \APACrefYearMonthDay2016. \BBOQ\APACrefatitleThe pale orange dot: the spectrum and habitability of hazy Archean Earth The pale orange dot: the spectrum and habitability of hazy archean earth.\BBCQ \APACjournalVolNumPagesAstrobiology1611873–899. \PrintBackRefs\CurrentBib
- Arney \BOthers. (\APACyear2017) \APACinsertmetastararney2017pale{APACrefauthors}Arney, G., Meadows, V\BPBIS., Domagal-Goldman, S\BPBID., Deming, D., Robinson, T\BPBID., Tovar, G.\BDBLSchwieterman, E. \APACrefYearMonthDay2017. \BBOQ\APACrefatitlePale orange dots: the impact of organic haze on the habitability and detectability of earthlike exoplanets Pale orange dots: the impact of organic haze on the habitability and detectability of earthlike exoplanets.\BBCQ \APACjournalVolNumPagesApJ836149. \PrintBackRefs\CurrentBib
- Badhan \BOthers. (\APACyear2019) \APACinsertmetastarbadhan2019stellar{APACrefauthors}Badhan, M\BPBIA., Wolf, E\BPBIT., Kopparapu, R\BPBIK., Arney, G., Kempton, E\BPBIM\BHBIR., Deming, D.\BCBL \BBA Domagal-Goldman, S\BPBID. \APACrefYearMonthDay2019. \BBOQ\APACrefatitleStellar Activity Effects on Moist Habitable Terrestrial Atmospheres around M Dwarfs Stellar activity effects on moist habitable terrestrial atmospheres around m dwarfs.\BBCQ \APACjournalVolNumPagesThe Astrophysical Journal887134. \PrintBackRefs\CurrentBib
- Barnes (\APACyear2017) \APACinsertmetastarbarnes2017tidal{APACrefauthors}Barnes, R. \APACrefYearMonthDay2017. \BBOQ\APACrefatitleTidal locking of habitable exoplanets Tidal locking of habitable exoplanets.\BBCQ \APACjournalVolNumPagesCelestial mechanics and dynamical astronomy1294509–536. \PrintBackRefs\CurrentBib
- Berndt \BOthers. (\APACyear1996) \APACinsertmetastarberndt1996reduction{APACrefauthors}Berndt, M\BPBIE., Allen, D\BPBIE.\BCBL \BBA Seyfried Jr, W\BPBIE. \APACrefYearMonthDay1996. \BBOQ\APACrefatitleReduction of CO2 during serpentinization of olivine at 300 C and 500 bar Reduction of co2 during serpentinization of olivine at 300 c and 500 bar.\BBCQ \APACjournalVolNumPagesGeology244351–354. \PrintBackRefs\CurrentBib
- Brown \BOthers. (\APACyear2009) \APACinsertmetastarbrown2009titan{APACrefauthors}Brown, R., Lebreton, J\BPBIP.\BCBL \BBA Waite, H. \APACrefYear2009. \APACrefbtitleTitan from Cassini-Huygens Titan from cassini-huygens. \APACaddressPublisherSpringer Science & Business Media. \PrintBackRefs\CurrentBib
- Carlomagno \BOthers. (\APACyear2020) \APACinsertmetastarcarlomagno2020metis{APACrefauthors}Carlomagno, B., Delacroix, C., Absil, O., Cantalloube, F., de Xivry, G\BPBIO., Pathak, P.\BDBLothers \APACrefYearMonthDay2020. \BBOQ\APACrefatitleMETIS high-contrast imaging: design and expected performance Metis high-contrast imaging: design and expected performance.\BBCQ \APACjournalVolNumPagesJournal of Astronomical Telescopes, Instruments, and Systems63035005. \PrintBackRefs\CurrentBib
- Chen \BOthers. (\APACyear2018) \APACinsertmetastarchen2018biosignature{APACrefauthors}Chen, H., Wolf, E\BPBIT., Kopparapu, R., Domagal-Goldman, S.\BCBL \BBA Horton, D\BPBIE. \APACrefYearMonthDay2018. \BBOQ\APACrefatitleBiosignature anisotropy modeled on temperate tidally locked m-dwarf planets Biosignature anisotropy modeled on temperate tidally locked m-dwarf planets.\BBCQ \APACjournalVolNumPagesThe Astrophysical Journal Letters8681L6. \PrintBackRefs\CurrentBib
- Chen \BOthers. (\APACyear2019) \APACinsertmetastarchen2019habitability{APACrefauthors}Chen, H., Wolf, E\BPBIT., Zhan, Z.\BCBL \BBA Horton, D\BPBIE. \APACrefYearMonthDay2019. \BBOQ\APACrefatitleHabitability and spectroscopic observability of warm M-dwarf exoplanets evaluated with a 3D chemistry-climate model Habitability and spectroscopic observability of warm m-dwarf exoplanets evaluated with a 3d chemistry-climate model.\BBCQ \APACjournalVolNumPagesThe Astrophysical Journal886116. \PrintBackRefs\CurrentBib
- Cooray \BOthers. (\APACyear2019) \APACinsertmetastarcooray2019origins{APACrefauthors}Cooray, A., Meixner, M., Leisawitz, D., Staguhn, J., Armus, L., Battersby, C.\BDBLothers \APACrefYearMonthDay2019. \BBOQ\APACrefatitleOrigins Space Telescope Mission Concept Study Report Origins Space Telescope Mission Concept Study Report.\BBCQ \APACjournalVolNumPagesarXiv preprint arXiv:1912.06213. \PrintBackRefs\CurrentBib
- Des Marais \BOthers. (\APACyear2008) \APACinsertmetastardes2008nasa{APACrefauthors}Des Marais, D\BPBIJ., Nuth III, J\BPBIA., Allamandola, L\BPBIJ., Boss, A\BPBIP., Farmer, J\BPBID., Hoehler, T\BPBIM.\BDBLothers \APACrefYearMonthDay2008. \BBOQ\APACrefatitleThe NASA astrobiology roadmap The nasa astrobiology roadmap.\BBCQ \APACjournalVolNumPagesAstrobiology84715–730. \PrintBackRefs\CurrentBib
- Domagal-Goldman \BOthers. (\APACyear2014) \APACinsertmetastardomagal2014abiotic{APACrefauthors}Domagal-Goldman, S\BPBID., Segura, A., Claire, M\BPBIW., Robinson, T\BPBID.\BCBL \BBA Meadows, V\BPBIS. \APACrefYearMonthDay2014. \BBOQ\APACrefatitleAbiotic ozone and oxygen in atmospheres similar to prebiotic Earth Abiotic ozone and oxygen in atmospheres similar to prebiotic Earth.\BBCQ \APACjournalVolNumPagesThe Astrophysical Journal792290. \PrintBackRefs\CurrentBib
- Fauchez \BOthers. (\APACyear2019) \APACinsertmetastarfauchez2019impact{APACrefauthors}Fauchez, T\BPBIJ., Turbet, M., Villanueva, G\BPBIL., Wolf, E\BPBIT., Arney, G., Kopparapu, R\BPBIK.\BDBLothers \APACrefYearMonthDay2019. \BBOQ\APACrefatitleImpact of clouds and hazes on the simulated JWST transmission spectra of habitable zone planets in the TRAPPIST-1 system Impact of clouds and hazes on the simulated JWST transmission spectra of habitable zone planets in the TRAPPIST-1 system.\BBCQ \APACjournalVolNumPagesThe Astrophysical Journal8872194. \PrintBackRefs\CurrentBib
- Fauchez \BOthers. (\APACyear2020) \APACinsertmetastarfauchez2020sensitive{APACrefauthors}Fauchez, T\BPBIJ., Villanueva, G\BPBIL., Schwieterman, E\BPBIW., Turbet, M., Arney, G., Pidhorodetska, D.\BDBLDomagal-Goldman, S\BPBID. \APACrefYearMonthDay2020. \BBOQ\APACrefatitleSensitive probing of exoplanetary oxygen via mid-infrared collisional absorption Sensitive probing of exoplanetary oxygen via mid-infrared collisional absorption.\BBCQ \APACjournalVolNumPagesNature Astronomy1–5. \PrintBackRefs\CurrentBib
- Felton (\APACyear2021) \APACinsertmetastarfeltonzenodowater2021{APACrefauthors}Felton, R. \APACrefYearMonthDay2021. \BBOQ\APACrefatitleSupplemental material: The Role of Atmospheric Exchange in False-Positive Biosignature Detection. Zenodo. https://doi.org/10.5281/zenodo.5591912 Supplemental material: The role of atmospheric exchange in false-positive biosignature detection. zenodo. https://doi.org/10.5281/zenodo.5591912.\BBCQ \PrintBackRefs\CurrentBib
- Gao \BOthers. (\APACyear2015) \APACinsertmetastargao2015stabilization{APACrefauthors}Gao, P., Hu, R., Robinson, T\BPBID., Li, C.\BCBL \BBA Yung, Y\BPBIL. \APACrefYearMonthDay2015. \BBOQ\APACrefatitleStabilization of CO2 atmospheres on exoplanets around M dwarf stars Stabilization of CO2 atmospheres on exoplanets around M dwarf stars.\BBCQ \APACjournalVolNumPagesAstrophys J806249–261. \PrintBackRefs\CurrentBib
- Garcia-Sage \BOthers. (\APACyear2017) \APACinsertmetastargarcia2017magnetic{APACrefauthors}Garcia-Sage, K., Glocer, A., Drake, J., Gronoff, G.\BCBL \BBA Cohen, O. \APACrefYearMonthDay2017. \BBOQ\APACrefatitleOn the magnetic protection of the atmosphere of Proxima Centauri b On the magnetic protection of the atmosphere of Proxima Centauri b.\BBCQ \APACjournalVolNumPagesThe Astrophysical Journal Letters8441L13. \PrintBackRefs\CurrentBib
- Gaudi \BOthers. (\APACyear2020) \APACinsertmetastargaudi2020habitable{APACrefauthors}Gaudi, B\BPBIS., Seager, S., Mennesson, B., Kiessling, A., Warfield, K., Cahoy, K.\BDBLothers \APACrefYearMonthDay2020. \BBOQ\APACrefatitleThe Habitable Exoplanet Observatory (HabEx) Mission Concept Study Final Report The Habitable Exoplanet Observatory (HabEx) Mission Concept Study Final Report.\BBCQ \APACjournalVolNumPagesarXiv preprint arXiv:2001.06683. \PrintBackRefs\CurrentBib
- Gillon \BOthers. (\APACyear2016) \APACinsertmetastargillon2016temperate{APACrefauthors}Gillon, M., Jehin, E., Lederer, S\BPBIM., Delrez, L., de Wit, J., Burdanov, A.\BDBLothers \APACrefYearMonthDay2016. \BBOQ\APACrefatitleTemperate Earth-sized planets transiting a nearby ultracool dwarf star Temperate earth-sized planets transiting a nearby ultracool dwarf star.\BBCQ \APACjournalVolNumPagesNature5337602221–224. \PrintBackRefs\CurrentBib
- Gillon \BOthers. (\APACyear2017) \APACinsertmetastargillon2017seven{APACrefauthors}Gillon, M., Triaud, A\BPBIH., Demory, B\BHBIO., Jehin, E., Agol, E., Deck, K\BPBIM.\BDBLothers \APACrefYearMonthDay2017. \BBOQ\APACrefatitleSeven temperate terrestrial planets around the nearby ultracool dwarf star TRAPPIST-1 Seven temperate terrestrial planets around the nearby ultracool dwarf star trappist-1.\BBCQ \APACjournalVolNumPagesNature5427642456–460. \PrintBackRefs\CurrentBib
- Gilmozzi \BBA Spyromilio (\APACyear2007) \APACinsertmetastargilmozzi2007european{APACrefauthors}Gilmozzi, R.\BCBT \BBA Spyromilio, J. \APACrefYearMonthDay2007. \BBOQ\APACrefatitleThe European extremely large telescope (E-ELT) The european extremely large telescope (e-elt).\BBCQ \APACjournalVolNumPagesThe Messenger127113. \PrintBackRefs\CurrentBib
- Gordon \BOthers. (\APACyear2017) \APACinsertmetastarGORDON2015{APACrefauthors}Gordon, I\BPBIE., Rothman, L\BPBIS., Hill, C., Kochanov, R\BPBIV., Tan, Y., Bernath, P\BPBIF.\BDBLZak, E\BPBIJ. \APACrefYearMonthDay2017\APACmonth12. \BBOQ\APACrefatitleThe HITRAN2016 molecular spectroscopic database The hitran2016 molecular spectroscopic database.\BBCQ \APACjournalVolNumPagesJQSRT2033-69. {APACrefDOI} 10.1016/j.jqsrt.2017.06.038 \PrintBackRefs\CurrentBib
- Harman \BBA Domagal-Goldman (\APACyear2018) \APACinsertmetastarharman2018biosignature{APACrefauthors}Harman, C\BPBIE.\BCBT \BBA Domagal-Goldman, S. \APACrefYearMonthDay2018. \BBOQ\APACrefatitleBiosignature False Positives Biosignature false positives.\BBCQ \APACjournalVolNumPagesHandbook of Exoplanets; Springer International Publishing AG, part of Springer Nature: New York, NY, USA71. \PrintBackRefs\CurrentBib
- Harman \BOthers. (\APACyear2018) \APACinsertmetastarharman2018abiotic{APACrefauthors}Harman, C\BPBIE., Felton, R., Hu, R., Domagal-Goldman, S\BPBID., Segura, A., Tian, F.\BCBL \BBA Kasting, J. \APACrefYearMonthDay2018. \BBOQ\APACrefatitleAbiotic O2 levels on planets around F, G, K, and M stars: effects of lightning-produced catalysts in eliminating oxygen false positives Abiotic O2 levels on planets around F, G, K, and M stars: effects of lightning-produced catalysts in eliminating oxygen false positives.\BBCQ \APACjournalVolNumPagesThe Astrophysical Journal866156. \PrintBackRefs\CurrentBib
- Hartle \BOthers. (\APACyear2006) \APACinsertmetastarhartle2006initial{APACrefauthors}Hartle, R., Sittler, E., Neubauer, F., Johnson, R., Smith, H., Crary, F.\BDBLothers \APACrefYearMonthDay2006. \BBOQ\APACrefatitleInitial interpretation of Titan plasma interaction as observed by the Cassini plasma spectrometer: Comparisons with Voyager 1 Initial interpretation of Titan plasma interaction as observed by the Cassini plasma spectrometer: Comparisons with Voyager 1.\BBCQ \APACjournalVolNumPagesPlanetary and Space Science54121211–1224. \PrintBackRefs\CurrentBib
- Hartogh \BOthers. (\APACyear2011) \APACinsertmetastarhartogh2011direct{APACrefauthors}Hartogh, P., Lellouch, E., Moreno, R., Bockelée-Morvan, D., Biver, N., Cassidy, T.\BDBLothers \APACrefYearMonthDay2011. \BBOQ\APACrefatitleDirect detection of the Enceladus water torus with Herschel Direct detection of the Enceladus water torus with Herschel.\BBCQ \APACjournalVolNumPagesAstronomy & Astrophysics532L2. \PrintBackRefs\CurrentBib
- Hébrard \BOthers. (\APACyear2012) \APACinsertmetastarhebrard2012neutral{APACrefauthors}Hébrard, E., Dobrijevic, M., Loison, J\BHBIC., Bergeat, A.\BCBL \BBA Hickson, K. \APACrefYearMonthDay2012. \BBOQ\APACrefatitleNeutral production of hydrogen isocyanide (HNC) and hydrogen cyanide (HCN) in Titan’s upper atmosphere Neutral production of hydrogen isocyanide (hnc) and hydrogen cyanide (hcn) in titan’s upper atmosphere.\BBCQ \APACjournalVolNumPagesAstronomy & Astrophysics541A21. \PrintBackRefs\CurrentBib
- Hitchcock \BBA Lovelock (\APACyear1967) \APACinsertmetastarhitchcock1967life{APACrefauthors}Hitchcock, D\BPBIR.\BCBT \BBA Lovelock, J\BPBIE. \APACrefYearMonthDay1967. \BBOQ\APACrefatitleLife detection by atmospheric analysis Life detection by atmospheric analysis.\BBCQ \APACjournalVolNumPagesIcarus71-3149–159. \PrintBackRefs\CurrentBib
- Hörst \BOthers. (\APACyear2008) \APACinsertmetastarhorst2008origin{APACrefauthors}Hörst, S\BPBIM., Vuitton, V.\BCBL \BBA Yelle, R\BPBIV. \APACrefYearMonthDay2008. \BBOQ\APACrefatitleOrigin of oxygen species in Titan’s atmosphere Origin of oxygen species in titan’s atmosphere.\BBCQ \APACjournalVolNumPagesJournal of Geophysical Research: Planets113E10. \PrintBackRefs\CurrentBib
- Johns (\APACyear2006) \APACinsertmetastarjohns2006giant{APACrefauthors}Johns, M. \APACrefYearMonthDay2006. \BBOQ\APACrefatitleThe giant Magellan telescope (GMT) The giant magellan telescope (gmt).\BBCQ \BIn \APACrefbtitleGround-based and Airborne Telescopes Ground-based and airborne telescopes (\BVOL 6267, \BPG 626729). \PrintBackRefs\CurrentBib
- Kasting \BBA Ackerman (\APACyear1986) \APACinsertmetastarkasting1986climatic{APACrefauthors}Kasting, J\BPBIF.\BCBT \BBA Ackerman, T\BPBIP. \APACrefYearMonthDay1986. \BBOQ\APACrefatitleClimatic consequences of very high carbon dioxide levels in the Earth’s early atmosphere Climatic consequences of very high carbon dioxide levels in the earth’s early atmosphere.\BBCQ \APACjournalVolNumPagesScience23447821383–1385. \PrintBackRefs\CurrentBib
- Kasting \BOthers. (\APACyear1993) \APACinsertmetastarkasting1993habitable{APACrefauthors}Kasting, J\BPBIF., Whitmire, D\BPBIP.\BCBL \BBA Reynolds, R\BPBIT. \APACrefYearMonthDay1993. \BBOQ\APACrefatitleHabitable zones around main sequence stars Habitable zones around main sequence stars.\BBCQ \APACjournalVolNumPagesIcarus1011108–128. \PrintBackRefs\CurrentBib
- Kharecha \BOthers. (\APACyear2005) \APACinsertmetastarKharecha2005{APACrefauthors}Kharecha, P., Kasting, J.\BCBL \BBA Siefert, J. \APACrefYearMonthDay2005. \BBOQ\APACrefatitleA coupled atmosphere–ecosystem model of the early Archean Earth A coupled atmosphere–ecosystem model of the early archean earth.\BBCQ \APACjournalVolNumPagesGeobiology3253-76. {APACrefURL} https://onlinelibrary.wiley.com/doi/abs/10.1111/j.1472-4669.2005.00049.x {APACrefDOI} 10.1111/j.1472-4669.2005.00049.x \PrintBackRefs\CurrentBib
- Kopparapu \BOthers. (\APACyear2013) \APACinsertmetastarKopparapu2013{APACrefauthors}Kopparapu, R\BPBIK., Ramirez, R., Kasting, J\BPBIF., Eymet, V., Robinson, T\BPBID., Mahadevan, S.\BDBLDeshpande, R. \APACrefYearMonthDay2013\APACmonth03. \BBOQ\APACrefatitleHabitable Zones around Main-sequence Stars: New Estimates Habitable zones around main-sequence stars: New estimates.\BBCQ \APACjournalVolNumPagesThe Astrophysical Journal765131. {APACrefDOI} 10.1088/0004-637X/765/2/131 \PrintBackRefs\CurrentBib
- Krasnopolsky (\APACyear2009) \APACinsertmetastarkrasnopolsky2009photochemical{APACrefauthors}Krasnopolsky, V\BPBIA. \APACrefYearMonthDay2009. \BBOQ\APACrefatitleA photochemical model of Titan’s atmosphere and ionosphere A photochemical model of Titan’s atmosphere and ionosphere.\BBCQ \APACjournalVolNumPagesIcarus2011226–256. \PrintBackRefs\CurrentBib
- Krissansen-Totton \BOthers. (\APACyear2016) \APACinsertmetastarkrissansen2016detecting{APACrefauthors}Krissansen-Totton, J., Bergsman, D\BPBIS.\BCBL \BBA Catling, D\BPBIC. \APACrefYearMonthDay2016. \BBOQ\APACrefatitleOn detecting biospheres from chemical thermodynamic disequilibrium in planetary atmospheres On detecting biospheres from chemical thermodynamic disequilibrium in planetary atmospheres.\BBCQ \APACjournalVolNumPagesAstrobiology16139–67. \PrintBackRefs\CurrentBib
- Lederberg (\APACyear1965) \APACinsertmetastarlederberg1965signs{APACrefauthors}Lederberg, J. \APACrefYearMonthDay1965. \BBOQ\APACrefatitleSigns of life: criterion-system of exobiology Signs of life: criterion-system of exobiology.\BBCQ \APACjournalVolNumPagesNature20749929–13. \PrintBackRefs\CurrentBib
- Levy (\APACyear1971) \APACinsertmetastarlevy1971normal{APACrefauthors}Levy, H. \APACrefYearMonthDay1971. \BBOQ\APACrefatitleNormal atmosphere: Large radical and formaldehyde concentrations predicted Normal atmosphere: Large radical and formaldehyde concentrations predicted.\BBCQ \APACjournalVolNumPagesScience1733992141–143. \PrintBackRefs\CurrentBib
- Lincowski \BOthers. (\APACyear2018) \APACinsertmetastarlincowski2018evolved{APACrefauthors}Lincowski, A\BPBIP., Meadows, V\BPBIS., Crisp, D., Robinson, T\BPBID., Luger, R., Lustig-Yaeger, J.\BCBL \BBA Arney, G\BPBIN. \APACrefYearMonthDay2018. \BBOQ\APACrefatitleEvolved climates and observational discriminants for the TRAPPIST-1 planetary system Evolved climates and observational discriminants for the trappist-1 planetary system.\BBCQ \APACjournalVolNumPagesThe Astrophysical Journal867176. \PrintBackRefs\CurrentBib
- Lovelock (\APACyear1965) \APACinsertmetastarlovelock1965physical{APACrefauthors}Lovelock, J\BPBIE. \APACrefYearMonthDay1965. \BBOQ\APACrefatitleA physical basis for life detection experiments A physical basis for life detection experiments.\BBCQ \APACjournalVolNumPagesNature2074997568–570. \PrintBackRefs\CurrentBib
- Lovelock (\APACyear1975) \APACinsertmetastarlovelock1975thermodynamics{APACrefauthors}Lovelock, J\BPBIE. \APACrefYearMonthDay1975. \BBOQ\APACrefatitleThermodynamics and the recognition of alien biospheres Thermodynamics and the recognition of alien biospheres.\BBCQ \APACjournalVolNumPagesProceedings of the Royal Society of London. Series B. Biological Sciences1891095167–181. \PrintBackRefs\CurrentBib
- Luger \BBA Barnes (\APACyear2015) \APACinsertmetastarluger2015extreme{APACrefauthors}Luger, R.\BCBT \BBA Barnes, R. \APACrefYearMonthDay2015. \BBOQ\APACrefatitleExtreme water loss and abiotic O2 buildup on planets throughout the habitable zones of M dwarfs Extreme water loss and abiotic O2 buildup on planets throughout the habitable zones of M dwarfs.\BBCQ \APACjournalVolNumPagesAstrobiology152119–143. \PrintBackRefs\CurrentBib
- LUVOIR (\APACyear2019) \APACinsertmetastarluvoir2019luvoir{APACrefauthors}LUVOIR. \APACrefYearMonthDay2019. \BBOQ\APACrefatitleThe LUVOIR Mission Concept Study Final Report The LUVOIR Mission Concept Study Final Report.\BBCQ \APACjournalVolNumPagesarXiv preprint arXiv:1912.06219. \PrintBackRefs\CurrentBib
- Manabe \BBA Wetherald (\APACyear1967) \APACinsertmetastarManabe1967{APACrefauthors}Manabe, S.\BCBT \BBA Wetherald, R\BPBIT. \APACrefYearMonthDay1967\APACmonth05. \BBOQ\APACrefatitleThermal Equilibrium of the Atmosphere with a Given Distribution of Relative Humidity. Thermal Equilibrium of the Atmosphere with a Given Distribution of Relative Humidity.\BBCQ \APACjournalVolNumPagesJournal of Atmospheric Sciences243241-259. {APACrefDOI} 10.1175/1520-0469(1967)024¡0241:TEOTAW¿2.0.CO;2 \PrintBackRefs\CurrentBib
- Marais \BBA Walter (\APACyear1999) \APACinsertmetastarmarais1999astrobiology{APACrefauthors}Marais, D\BPBID.\BCBT \BBA Walter, M. \APACrefYearMonthDay1999. \BBOQ\APACrefatitleAstrobiology: exploring the origins, evolution, and distribution of life in the universe Astrobiology: exploring the origins, evolution, and distribution of life in the universe.\BBCQ \APACjournalVolNumPagesAnnual review of ecology and systematics301397–420. \PrintBackRefs\CurrentBib
- Meadows (\APACyear2017) \APACinsertmetastarmeadows2017reflections{APACrefauthors}Meadows, V\BPBIS. \APACrefYearMonthDay2017. \BBOQ\APACrefatitleReflections on O2 as a biosignature in exoplanetary atmospheres Reflections on O2 as a biosignature in exoplanetary atmospheres.\BBCQ \APACjournalVolNumPagesAstrobiology17101022–1052. \PrintBackRefs\CurrentBib
- Meadows \BOthers. (\APACyear2018) \APACinsertmetastarmeadows2018habitability{APACrefauthors}Meadows, V\BPBIS., Arney, G\BPBIN., Schwieterman, E\BPBIW., Lustig-Yaeger, J., Lincowski, A\BPBIP., Robinson, T.\BDBLothers \APACrefYearMonthDay2018. \BBOQ\APACrefatitleThe habitability of Proxima Centauri b: environmental states and observational discriminants The habitability of proxima centauri b: environmental states and observational discriminants.\BBCQ \APACjournalVolNumPagesAstrobiology182133–189. \PrintBackRefs\CurrentBib
- Moreno \BOthers. (\APACyear2012) \APACinsertmetastarmoreno2012abundance{APACrefauthors}Moreno, R., Lellouch, E., Lara, L\BPBIM., Feuchtgruber, H., Rengel, M., Hartogh, P.\BCBL \BBA Courtin, R. \APACrefYearMonthDay2012. \BBOQ\APACrefatitleThe abundance, vertical distribution and origin of H2O in Titan’s atmosphere: Herschel observations and photochemical modelling The abundance, vertical distribution and origin of H2O in Titan’s atmosphere: Herschel observations and photochemical modelling.\BBCQ \APACjournalVolNumPagesIcarus2212753–767. \PrintBackRefs\CurrentBib
- National Academies of Sciences \BBA Medicine (\APACyear2021) \APACinsertmetastarnational2021pathways{APACrefauthors}National Academies of Sciences, E.\BCBT \BBA Medicine. \APACrefYearMonthDay2021. \BBOQ\APACrefatitlePathways to Discovery in Astronomy and Astrophysics for the 2020s Pathways to discovery in astronomy and astrophysics for the 2020s.\BBCQ \APACjournalVolNumPagesWashington DC: The National Academies Press. https://doi.org/10.17226/26141. \PrintBackRefs\CurrentBib
- Niemann \BOthers. (\APACyear2010) \APACinsertmetastarniemann2010composition{APACrefauthors}Niemann, H., Atreya, S., Demick, J., Gautier, D., Haberman, J., Harpold, D.\BDBLRaulin, F. \APACrefYearMonthDay2010. \BBOQ\APACrefatitleComposition of Titan’s lower atmosphere and simple surface volatiles as measured by the Cassini-Huygens probe gas chromatograph mass spectrometer experiment Composition of titan’s lower atmosphere and simple surface volatiles as measured by the cassini-huygens probe gas chromatograph mass spectrometer experiment.\BBCQ \APACjournalVolNumPagesJournal of Geophysical Research: Planets115E12. \PrintBackRefs\CurrentBib
- Pavlov \BOthers. (\APACyear2001) \APACinsertmetastarPavlov2001a{APACrefauthors}Pavlov, A\BPBIA., Brown, L\BPBIL.\BCBL \BBA Kasting, J\BPBIF. \APACrefYearMonthDay2001. \BBOQ\APACrefatitleUV shielding of NH and O by organic hazes in the Archean atmosphere UV shielding of NH and O by organic hazes in the Archean atmosphere.\BBCQ \APACjournalVolNumPagesJournal of Geophysical Research: Planets106E1023267-23287. {APACrefURL} https://agupubs.onlinelibrary.wiley.com/doi/abs/10.1029/2000JE001448 {APACrefDOI} 10.1029/2000JE001448 \PrintBackRefs\CurrentBib
- Peacock \BOthers. (\APACyear2019) \APACinsertmetastarpeacock2019predicting{APACrefauthors}Peacock, S., Barman, T., Shkolnik, E\BPBIL., Hauschildt, P\BPBIH.\BCBL \BBA Baron, E. \APACrefYearMonthDay2019. \BBOQ\APACrefatitlePredicting the extreme ultraviolet radiation environment of exoplanets around Low-mass stars: the TRAPPIST-1 system Predicting the extreme ultraviolet radiation environment of exoplanets around low-mass stars: the trappist-1 system.\BBCQ \APACjournalVolNumPagesThe Astrophysical Journal8712235. \PrintBackRefs\CurrentBib
- Pidhorodetska \BOthers. (\APACyear2020) \APACinsertmetastarPidhorodetska2020{APACrefauthors}Pidhorodetska, D., Fauchez, T\BPBIJ., Villanueva, G\BPBIL., Domagal-Goldman, S\BPBID.\BCBL \BBA Kopparapu, R\BPBIK. \APACrefYearMonthDay2020\APACmonth08. \BBOQ\APACrefatitleDetectability of Molecular Signatures on TRAPPIST-1e through Transmission Spectroscopy Simulated for Future Space-based Observatories Detectability of Molecular Signatures on TRAPPIST-1e through Transmission Spectroscopy Simulated for Future Space-based Observatories.\BBCQ \APACjournalVolNumPagesThe Astrophysical Journal Letters8982L33. {APACrefDOI} 10.3847/2041-8213/aba4a1 \PrintBackRefs\CurrentBib
- Porco \BOthers. (\APACyear2006) \APACinsertmetastarporco2006cassini{APACrefauthors}Porco, C\BPBIC., Helfenstein, P., Thomas, P., Ingersoll, A., Wisdom, J., West, R.\BDBLothers \APACrefYearMonthDay2006. \BBOQ\APACrefatitleCassini observes the active south pole of Enceladus Cassini observes the active south pole of Enceladus.\BBCQ \APACjournalVolNumPagesscience31157661393–1401. \PrintBackRefs\CurrentBib
- Schwieterman \BOthers. (\APACyear2018) \APACinsertmetastarschwieterman2018exoplanet{APACrefauthors}Schwieterman, E\BPBIW., Kiang, N\BPBIY., Parenteau, M\BPBIN., Harman, C\BPBIE., DasSarma, S., Fisher, T\BPBIM.\BDBLothers \APACrefYearMonthDay2018. \BBOQ\APACrefatitleExoplanet biosignatures: a review of remotely detectable signs of life Exoplanet biosignatures: a review of remotely detectable signs of life.\BBCQ \APACjournalVolNumPagesAstrobiology186663–708. \PrintBackRefs\CurrentBib
- Sittler \BOthers. (\APACyear2009) \APACinsertmetastarsittler2009heavy{APACrefauthors}Sittler, E., Ali, A., Cooper, J., Hartle, R., Johnson, R., Coates, A.\BCBL \BBA Young, D. \APACrefYearMonthDay2009. \BBOQ\APACrefatitleHeavy ion formation in Titan’s ionosphere: Magnetospheric introduction of free oxygen and a source of Titan’s aerosols? Heavy ion formation in titan’s ionosphere: Magnetospheric introduction of free oxygen and a source of titan’s aerosols?\BBCQ \APACjournalVolNumPagesPlanetary and Space Science57131547–1557. \PrintBackRefs\CurrentBib
- Skidmore \BOthers. (\APACyear2015) \APACinsertmetastarskidmore2015thirty{APACrefauthors}Skidmore, W.\BCBT \BOthersPeriod. \APACrefYearMonthDay2015. \BBOQ\APACrefatitleThirty meter telescope detailed science case: 2015 Thirty meter telescope detailed science case: 2015.\BBCQ \APACjournalVolNumPagesResearch in Astronomy and Astrophysics15121945. \PrintBackRefs\CurrentBib
- Toon \BOthers. (\APACyear1989) \APACinsertmetastarToon1989{APACrefauthors}Toon, O\BPBIB., McKay, C\BPBIP., Ackerman, T\BPBIP.\BCBL \BBA Santhanam, K. \APACrefYearMonthDay1989\APACmonth11. \BBOQ\APACrefatitleRapid calculation of radiative heating rates and photodissociation rates in inhomogeneous multiple scattering atmospheres Rapid calculation of radiative heating rates and photodissociation rates in inhomogeneous multiple scattering atmospheres.\BBCQ \APACjournalVolNumPagesJournal of Geophysical Research9416287-16301. {APACrefDOI} 10.1029/JD094iD13p16287 \PrintBackRefs\CurrentBib
- Trainer \BOthers. (\APACyear2006) \APACinsertmetastartrainer2006organic{APACrefauthors}Trainer, M\BPBIG., Pavlov, A\BPBIA., DeWitt, H\BPBIL., Jimenez, J\BPBIL., McKay, C\BPBIP., Toon, O\BPBIB.\BCBL \BBA Tolbert, M\BPBIA. \APACrefYearMonthDay2006. \BBOQ\APACrefatitleOrganic haze on Titan and the early Earth Organic haze on titan and the early earth.\BBCQ \APACjournalVolNumPagesProceedings of the National Academy of Sciences1034818035–18042. \PrintBackRefs\CurrentBib
- Ueno \BOthers. (\APACyear2006) \APACinsertmetastarueno2006evidence{APACrefauthors}Ueno, Y., Yamada, K., Yoshida, N., Maruyama, S.\BCBL \BBA Isozaki, Y. \APACrefYearMonthDay2006. \BBOQ\APACrefatitleEvidence from fluid inclusions for microbial methanogenesis in the early Archaean era Evidence from fluid inclusions for microbial methanogenesis in the early archaean era.\BBCQ \APACjournalVolNumPagesNature4407083516–519. \PrintBackRefs\CurrentBib
- Villanueva \BOthers. (\APACyear2018) \APACinsertmetastarvillanueva2018planetary{APACrefauthors}Villanueva, G\BPBIL., Smith, M\BPBID., Protopapa, S., Faggi, S.\BCBL \BBA Mandell, A\BPBIM. \APACrefYearMonthDay2018. \BBOQ\APACrefatitlePlanetary Spectrum Generator: An accurate online radiative transfer suite for atmospheres, comets, small bodies and exoplanets Planetary spectrum generator: An accurate online radiative transfer suite for atmospheres, comets, small bodies and exoplanets.\BBCQ \APACjournalVolNumPagesJournal of Quantitative Spectroscopy and Radiative Transfer21786–104. \PrintBackRefs\CurrentBib
- Wagner \BOthers. (\APACyear2021) \APACinsertmetastarwagner2021imaging{APACrefauthors}Wagner, K., Boehle, A., Pathak, P., Kasper, M., Arsenault, R., Jakob, G.\BDBLothers \APACrefYearMonthDay2021. \BBOQ\APACrefatitleImaging low-mass planets within the habitable zone of Centauri Imaging low-mass planets within the habitable zone of centauri.\BBCQ \APACjournalVolNumPagesNature communications1211–7. \PrintBackRefs\CurrentBib
- Walker (\APACyear1974) \APACinsertmetastarwalker1974stability{APACrefauthors}Walker, J\BPBIC. \APACrefYearMonthDay1974. \BBOQ\APACrefatitleStability of atmospheric oxygen Stability of atmospheric oxygen.\BBCQ \APACjournalVolNumPagesAmerican Journal of Science2743193–214. \PrintBackRefs\CurrentBib
- Wilson \BOthers. (\APACyear2021) \APACinsertmetastarwilson2021mega{APACrefauthors}Wilson, D\BPBIJ., Froning, C\BPBIS., Duvvuri, G\BPBIM., France, K., Youngblood, A., Schneider, P\BPBIC.\BDBLothers \APACrefYearMonthDay2021. \BBOQ\APACrefatitleThe Mega-MUSCLES Spectral Energy Distribution of TRAPPIST-1 The mega-muscles spectral energy distribution of trappist-1.\BBCQ \APACjournalVolNumPagesThe Astrophysical Journal911118. \PrintBackRefs\CurrentBib
- Wordsworth \BOthers. (\APACyear2011) \APACinsertmetastarwordsworth2011gliese{APACrefauthors}Wordsworth, R\BPBID., Forget, F., Selsis, F., Millour, E., Charnay, B.\BCBL \BBA Madeleine, J\BHBIB. \APACrefYearMonthDay2011. \BBOQ\APACrefatitleGliese 581d is the first discovered terrestrial-mass exoplanet in the habitable zone Gliese 581d is the first discovered terrestrial-mass exoplanet in the habitable zone.\BBCQ \APACjournalVolNumPagesThe Astrophysical Journal Letters7332L48. \PrintBackRefs\CurrentBib