Improved measurement of solar neutrinos from the Carbon-Nitrogen-Oxygen cycle by Borexino and its implications for the Standard Solar Model
Abstract
We present an improved measurement of the CNO solar neutrino interaction rate at Earth obtained with the complete Borexino Phase-III dataset. The measured rate RCNO = counts/(day 100 tonnes), allows us to exclude the absence of the CNO signal with about 7 C.L. The correspondent CNO neutrino flux is cm-2 s-1, taking into account the neutrino flavor conversion. We use the new CNO measurement to evaluate the C and N abundances in the Sun with respect to the H abundance for the first time with solar neutrinos. Our result of = displays a 2 tension with the “low metallicity” spectroscopic photospheric measurements. On the other hand, our result used together with the 7Be and 8B solar neutrino fluxes, also measured by Borexino, permits to disfavour at 3.1 C.L. the “low metallicity” SSM B16-AGSS09met as an alternative to the “high metallicity” SSM B16-GS98.
left=0.52in, top=0.52in, right=0.52in, bottom=1in
Introduction — The Sun is powered in its core by nuclear reactions converting hydrogen into helium. This fusion proceeds via two sequences, the proton-proton () chain producing about 99% of energy and the subdominant CNO cycle. Neutrinos (’s), emitted in both sequences, escape the solar matter almost unperturbed, delivering to us a real-time picture of the solar core. Over the last 50 years, the experimental effort has succeeded to map all the reactions producing solar ’s in the chain (, , 7Be, and 8B ’s, with the exception of the extremely small expected flux of ’s) [1, 2, 3, 4, 5, 6, 7, 8] and recently to provide the first direct evidence of CNO ’s [9]. These results have been crucial for solar physics, providing a precise test of the Standard Solar Model (SSM, latest available SSM B16 [10]), as well as for particle physics, contributing to the discovery of the neutrino flavour conversion [6, 7] and measurement of the oscillation parameters [11]. Furthermore, since the CNO cycle is predicted to be the dominant stellar hydrogen burning mechanism in the universe [12], its detection sets a milestone for experimental astrophysics.
The CNO cycle consists of two sub-cycles, called CN and NO: at the relatively low temperature of the solar core, sub-cycle CN is largely dominant at 99% level and produces neutrinos from the -decays of 15O and 13N. In the CNO cycle, the fusion is catalyzed by carbon (C), nitrogen (N), and oxygen (O) and thus provides direct information on the metallicity of the Sun’s core, i.e., its abundance of elements heavier than helium.
Metallicity is a key input of the SSMs and is determined experimentally by the spectral analysis of the photosphere, sometimes complemented by studies of meteorites: while measurements from the past two decades (AGSS09met [13, 14], C11 [15], AAG21 [16]) have been suggesting a lower content of heavy elements with respect to the earlier ones (GS98 [17]), the most recent MB22 [18] results point to a higher value. Noticeably, SSMs implementing the class of “low-metallicity” compositions fail to reproduce helioseismological measurements, while “high-metallicity” ones are in better agreement with them [10, 18].
Metallicity impacts the SSM predictions of 8B, 7Be, and CNO fluxes significantly, but in an indirect way. The metal content affects the solar opacity, which in turn impacts the Sun’s temperature profile, which ultimately controls the rate of nuclear reactions and thus emission. Thus deriving information on metallicity from the measurements of solar ’s presents a certain degree of ambiguity. However, in this respect, the CN cycle which is catalyzed by the C and N, is special: its flux has an additional, almost linear dependence on the abundances of these metals in the solar core, providing a unique handle for their non-ambiguous determination.
In this letter we present an improved measurement of the CNO interaction rate, obtained with the complete Borexino Phase-III dataset and a significantly increased precision, when compared to [9]. We include this new result in the global analysis of all solar neutrino and KamLAND reactor antineutrino data. We compare the resulting solar neutrino fluxes to the predictions of SSM B16, using either GS98 or AGSS09met metallicity [10] as an input. Finally, we combine the CNO measurement with the 8B flux obtained from the global analysis to determine the C and N abundance directly. As discussed below, this procedure has an advantage of exploiting the precise measurement of 8B neutrino flux as a solar thermometer, minimizing the uncertainties due to the metallicity/opacity degeneracy, and provides an estimation of metallicity which is independent from the spectroscopic data for the first time.
Borexino and Phase-III dataset — Borexino is a large volume liquid scintillator experiment, located at Laboratori Nazionali del Gran Sasso in Italy and has operated from May 2007 until October 2021. The core of the detector [20] consists of 280 tonnes of liquid scintillator contained in a 4.25 m radius, 125 m thick nylon vessel. The concentric detector geometry is designed to shield the innermost scintillator from radioactivity originated from external materials. The scintillation light is detected by nominally 2212 photomultiplier tubes (PMTs) mounted on a 7 m radius stainless steel sphere (SSS). Since the solar neutrino signal is rare and indistinguishable from natural radioactivity, radiopurity and background control are the pivotal key to success. The underground location reduces the cosmic muon flux by a factor of 106, while a water Cherenkov veto surrounding the SSS tags residual muons. During the initial filling, the scintillator was purified [21] to unprecedented levels of radiopurity [22], further improved [23] by operations performed in 2010-2011.
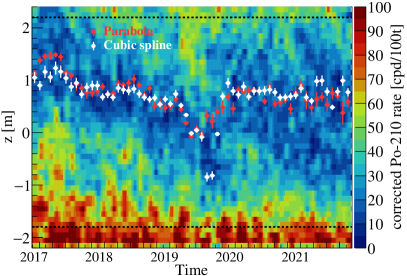
As discussed in [9, 19], constraining the decay rate of 210Bi, a daughter of 210Pb contaminating the scintillator, is a key requirement for the CNO analysis and is achieved by measuring the decay rate of the 210Bi daughter, 210Po [24]. This procedure is severely limited by out-of-equilibrium 210Po in the analysis volume, originating from the vessel surface and carried over by temperature-driven seasonal convective currents. Between 2015 - 2019, the Borexino detector was thermally stabilized to suppress this effect. This made possible the first evidence of CNO ’s [9] using data collected from July 2016 until February 2020. This paper is based on data taken when the radiopurity and thermal stability of the detector was maximal, , between January 2017 and October 2021 (final Phase-III). The last part of the dataset features an unprecedented thermal stability and an enlarged volume of strongly reduced 210Po contamination (see Fig. 1), and therefore provides an improved 210Bi constraint. Furthermore, we now exclude the second half of 2016 used in [9], as it was still affected by an evident amount of out-of-equilibrium 210Po. The overall exposure of the analysis presented in this paper is 1431.6 days 71.3 tonnes, 33.5% more than in [9].
Analysis strategy and results — In Borexino, solar neutrinos are detected via their elastic scattering off electrons. Thus, the detected signal is induced by the electrons characterized by a continuous energy distribution even for mono-energetic neutrinos as 7Be or . For CNO ’s, produced in an energy interval extending up to 1740 keV, the electron spectrum is rather featureless with an end-point at 1517 keV and with a low expected interaction rate of few counts per day (cpd) in 100 tonnes of scintillator. In order to disentangle the CNO- signal from other solar ’s and backgrounds, we follow the same procedure applied in [9]. The multivariate fit is performed on two energy spectra from 320 keV to 2640 keV and the radial distribution of selected events. The two energy spectra are obtained by dividing the selected events into two complementary datasets, with and without cosmogenic 11C, using the Three-Fold Coincidence procedure [25]. All events must be reconstructed in a wall-less, centrally located 71.3 tonnes fiducial volume. The shapes of all signal and background components are obtained with a full Geant4 based Monte Carlo simulation [26], with an improved treatment of the time evolution of PMT’s effective quantum efficiencies based on the low-energy 14C data. We note that Borexino is not sensitive to the small dependence of the shape of solar neutrino components on neither the oscillation parameters nor the relative ratio of the individual CNO components. Thus, in the Monte Carlo production, we assume the standard 3-flavour neutrino oscillations and the 13N, 15O, and 17F relative contributions to the CNO flux according to SSM B16 [10].
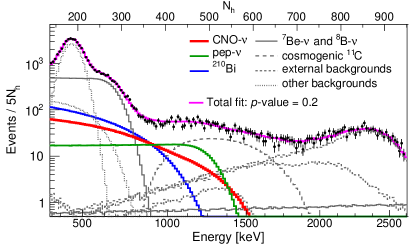
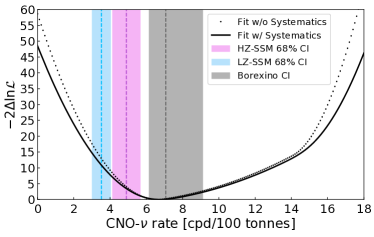
The main part of the sensitivity to CNO [19] comes from the 11C-depleted spectrum shown in Fig. 2, in which the CNO end-point is “unveiled” by the removal of about 90% of 11C, while preserving more than 60% of the exposure. Further complications arise from the degeneracy of the CNO energy spectrum with those of solar ’s and 210Bi. The rate is constrained in the fit to the value (2.74 0.04) cpd/100 tonnes as in [9]. A constraint on 210Bi is evaluated from the minimum rate of its daughter 210Po. Since we cannot exclude small levels of out-of-equilibrium 210Po from residual convection, we consider this minimum as an upper limit on 210Bi and implement it as a half-Gaussian penalty term in the likelihood. The decays of 210Po are identified on an event-by-event basis using the pulse shape discrimination neural network method [27, 9]. A Low Polonium Field (LPoF) volume is identified as the region of the detector with the lowest 210Po contamination, quantified via a fit with a 2D paraboloid equation (with and without a cubic spline function along the -axis to account for more complexity in this direction) as in [9]. Since the position of the LPoF is slightly changing in time due to residual convective motions, especially before 2020, we first performed the fits on the monthly LPoF data in an enlarged volume of 70 tonnes, in order to obtain its positions shown in Fig. 1. These are then used to blindly align monthly datasets using the previous month’s position. It should be noted that the LPoF has been extremely stable from August 2020 until the end of data-taking, and has significantly increased in size. The final LPoF fit is then performed on the aligned dataset in 20-25 tonnes, depending on the method, on approximately 6,000-9,000 210Po events. The final 210Bi upper limit including all systematic uncertainties is (10.8 1.0) cpd/100 tonnes. This value is lower, yet compatible with the previous limit of (11.5 1.3) cpd/100 tonnes [9], thanks to the removal of the 2016 data with high 210Po rate, and more precise due to the inclusion of the new stable period after February 2020. The major systematic contribution of 0.68 cpd/100 tonnes is associated with the 210Bi spatial uniformity in the fiducial volume, a necessary pre-requisite in order to apply the 210Bi constraint in a volume 3 times larger than the LPoF. This error has been estimated independently by studying -like events in the energy region with maximum relative contribution of 210Bi, in the the entire fiducial volume, and split into radial and angular components, as in [9]. The final fit with the and 210Bi rates constrained is shown in Fig. 2 on the 11C-subtracted energy spectrum. The rates of additional backgrounds, i.e., the external ’s from 40K, 208Tl, and 214Bi, 85Kr and 210Po in the scintillator, cosmogenic 11C, as well as 7Be solar ’s are kept as free fit parameters. The model fits to the data with a -value of 0.2 and yields the CNO- interaction rate with zero threshold of cpd/100 tonnes. The corresponding negative log-likelihood profile for the CNO- rate, shown in dashed-line in Fig. 2, is asymmetric since the upper limit 210Bi constraint impacts only the left part of the CNO profile. The right part of the CNO profile is unconstrained by the penalty and exploits the small difference between the CNO and 210Bi spectral shapes. The solid line in Fig. 2 shows the CNO profile including the total systematic uncertainty of cpd/100 tonnes, evaluated with the same toy-Monte-Carlo-based method as in [9]. The extent of individual parameters left to vary in this procedure has been updated for the current analyzed period, using improved Monte Carlo simulations and 2.2 MeV ’s from the cosmogenic neutron capture on scintillator hydrogen (instead of -decays from non-homogeneously distributed 210Po used in [9]) as a standard candle for the detector stability and uniformity. The final result on the CNO- interaction rate with zero-threshold is cpd/100 tonnes, obtained from the 68% quantile of the likelihood profile including the systematic uncertainty. This result excludes the no-CNO-signal hypothesis at about 7 C.L. Taking into account the density of electrons in the scintillator of (3.307 0.015) /100 tonnes and assuming Mikheyev-Smirnov-Wolfenstein flavour conversion in matter [28, 29, 30] and the neutrino oscillation parameters from [11], the measured rate including systematic uncertainty is converted into a flux of cm-2 s-1 CNO solar ’s on Earth.
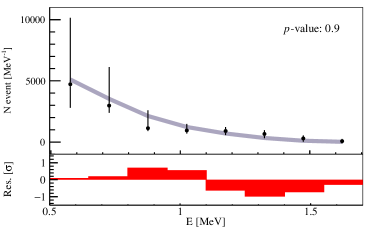
We have tested whether the events in excess to all known backgrounds, determined excluding the CNO energy range, are compatible with the expected CNO energy spectrum. The rate of the external background and cosmogenic 11C is obtained by the multivariate fit of events’ energy and radial distributions above the CNO end-point. The 85Kr background is evaluated using the fast coincidence tagging method [22], not used in the main analysis. The rate of 7Be solar ’s is taken from the Borexino Phase-II results [8]. The 210Po rate is obtained by fitting -like events selected by discrimination methods. The rate of ’s is set to the value of the constraint used in the main analysis. For the 210Bi we subtract the asymmetric value of cpd/100 tonnes motivated by our upper limit constraint. The energy distribution of events after subtracting all the background contributions, shown in Fig. 3, is found compatible with the CNO expected shape (-value of 0.9).
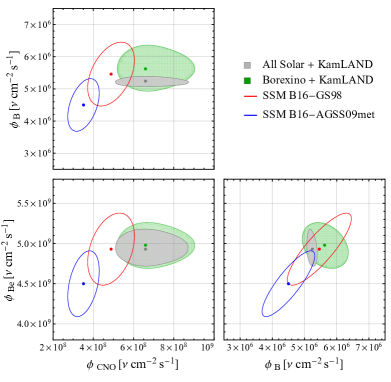
Implications for solar physics — We perform a global analysis of all solar data to test their compatibility with the SSM B16 predictions on solar neutrino fluxes [10]. We follow the procedure discussed in [22, 8] and include, together with the new CNO rate measurement, also the data from radiochemical experiments [1, 2, 3], 8B- data from SNO [6, 7] and Super-Kamiokande [4, 5], and Borexino Phase II [8] results on 7Be and 8B ’s, as well as the KamLAND reactor data [31] to better constrain . The fluxes of \ce^8B, \ce^7Be, and \ceCNO ’s, as well as and are left free in the fit, while , having a negligible impact in the analysis, has been fixed according to [11]. The results are shown in Fig. 4, where the grey areas are the 1 allowed regions in the -, -, and - planes. We also display the output of the fit when only results from Borexino and KamLAND are included (green areas). The predictions of the SSM B16 are represented by the elliptical contours, when the high-metallicity GS98 (red) and low-metallicity AGSS09met (blue) inputs are used. It is clear that both results exhibit a small tension with SSM B16-AGSS09met prediction, that is driven by the CNO ’s. We quantify the tension using the test-statistics introduced in [32]. We find that the -value of the comparison between the low-metallicity SSM B16-AGSS09met predictions and the global analysis results worsens from 0.327 to 0.028, when including the CNO measurement. The same happens in the comparison with Borexino-only data, where the -value lowers from 0.196 to 0.018 when including CNO. On the other hand, the high-metallicity SSM B16-GS98 is fully compatible with both the global analysis and the Borexino-only results in all cases (-value = 0.462 and 0.554 including CNO, respectively). Following the procedure described in [8], we also performed a frequentist hypothesis test based on a likelihood-ratio test statistics including only Borexino results on 7Be, 8B, and CNO ’s. Assuming SSM B16-GS98, our data disfavors SSM B16-AGSS09met at 3.1 (- = 9.1 10-4).
The interpretation of the observed tension between data and SSM B16-AGSS09met predictions is non univocal due to the degeneracy between metallicity, opacity, and other inputs of the SSM. More information on metallicity can be gathered by exploiting the direct dependence of the CNO cycle from the C and N abundances in the core of the Sun, in combination with the precise measurement of the 8B- flux, as suggested in [33, 34] and discussed specifically for Borexino in [19]. The general idea of this method is the following: solar neutrino fluxes (both those produced in the chain and in the CNO cycle) depend on the so-called environmental parameters (abundances of heavy elements, solar age, luminosity, opacity, diffusion) only indirectly, through the core temperature , which is an implicit function of them. Therefore, the uncertainties affecting these parameters collapse into the overall uncertainty of the temperature profile. The dependence of the neutrino flux on can be approximated by a power-law, with power index specific to the flux under consideration. The flux of \ce^8B ’s is the most sensitive to variations of , featuring a power index [35],
| (1) |
with “SSM” indicating the SSM predicted value. The same relationship holds for reactions belonging to the CNO cycle, like for example 15O, but with a different exponent [35]. In addition, CNO reactions’ rate feature a direct dependence on the abundance of \ceC and \ceN (relative to hydrogen) in the solar core ):
| (2) |
It is then possible to construct a weighted ratio between the \ce^15O and \ce^8B fluxes of the form:
| (3) |
with chosen to minimize the impact of (and therefore of its uncertainties) on the ratio, thus isolating the effect of . Substituting Eq. (1) and Eq. (2) in Eq. (3), we obtain
| (4) |
and the appropriate value of would therefore be = 0.83. The above equation is, however, oversimplified since both \ce^8B and \ce^15O ’s are produced in a relatively small region of the solar core, where the temperature and the chemical composition vary. In addition, both the temperature and the composition profile are non-trivial functions of the SSM input parameters.
To overcome this hurdle, we must explicit the dependence of the 8B and 15O fluxes on each SSM input parameter, making use of the corresponding partial logarithmic derivatives, following [36, 33, 34]. Taking the SSM B16-GS98 model as a reference, we obtain that = 0.769 minimizes the impact of the environmental parameters on the fluxes ratio in Eq. 3 (more details in Supplemental Material). With this optimized value of , we find:
| (5) |
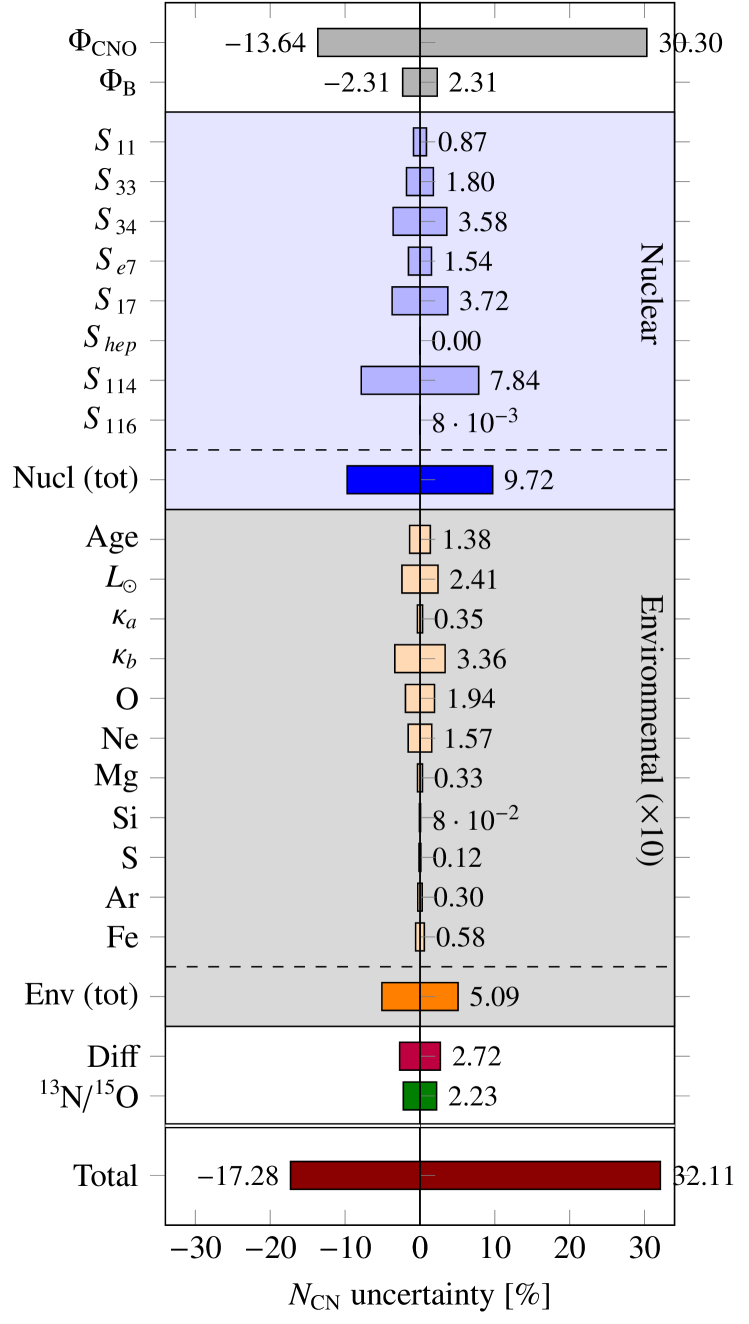
The terms in square brackets quantify the contributions of the nuclear, environmental, and diffusion uncertainties to the error budget to be summed in quadrature. Note that, the symbol represents the C + N abundance in the photosphere and not in the solar core. Indeed, the partial derivatives used in this procedure [37] are evaluated with respect to the composition of the photosphere, where spectroscopic data provide observational constraints.
Inserting in Eq. 5 the flux of \ce^8B ’s obtained from the global analysis ( = 0.96 0.03) and extracted from our CNO measurement, assuming the SSM ratio between \ce^13N and \ce^15O fluxes, we obtain:
| (6) |
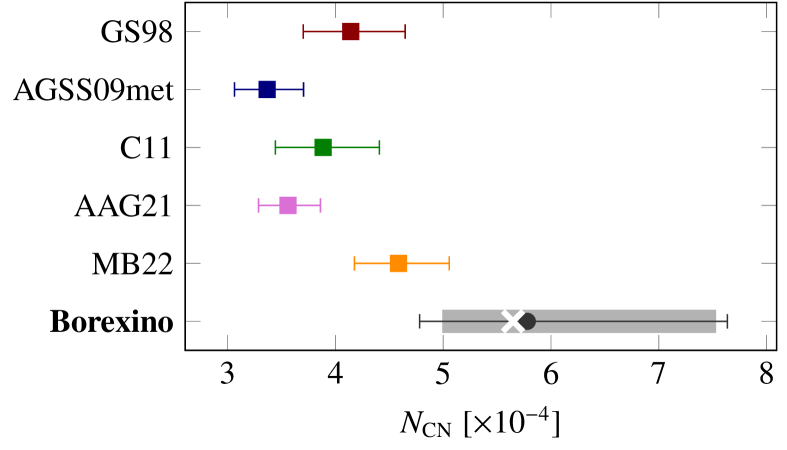
By construction, the contribution to the error budget from environmental variables is negligible, while the precision of the measurement is dominant. The leading residual uncertainty of comes from the astrophysical -factors, driven by () and (). The error on the extrapolation of the C + N abundance from the core to the photosphere due to diffusion is 2.7%. Finally, the C + N abundance with respect to the H in the photospehere is . This represents the first determination of the abundance of C + N in the Sun using neutrinos. Our result is compared to the measurements based on spectroscopy of the photosphere in Fig. 5. It is in good agreement with the recent MB22 [18] and the outdated GS98 [17] compilations, while it shows a moderate 2 tension with the values of AGSS09met [13, 14] and its recent update AAG21 [16]. The stability of our result with respect to the input metallicity is demonstrated by repeating the analysis changing our reference to SSM B16-AGSS09met and obtaining fully compatible value (white cross in Fig. 5).
Outlook — In this letter, we have presented the latest Borexino measurement of the CNO solar ’s with an improved uncertainty of on its rate. This result reinforces the one previously published by Borexino in 2020 [9], now further increasing the detection significance to about 7 C.L. against the null hypothesis. We included this new result in the global analysis of all solar and KamLAND reactor data. We found the resulting solar fluxes to be in agreement with the “high metallicity” SSM B16-GS98 [10], while a moderate tension is observed when “low metallicity” AGSS09met is used for the SSM prediction. A frequentist hypothesis test using only Borexino CNO, 7Be, and 8B ’s fluxes, disfavors the SSM B16-AGSS09met at 3.1 C.L. as an alternative to SSM B16-GS98. In addition, we have used the CNO measurement together with the 8B flux from the global analysis to determine the C + N abundance in the Sun, breaking the ambiguity due to the opacity/metallicity degeneracy. The C + N abundance determined with this method, was compared with the independent spectroscopic measurements of the solar photosphere. Even though affected by a large error of (dominated by the error on the measured CNO rate) our measurement agrees very well with the so-called high-metallicity compilations (MB22 [18], GS98 [17]), while featuring a moderate 2 tension with the low-metallicity ones (AGSS09met [13, 14], C11 [15], AAG21 [16]). A more precise measurement of the CNO flux, performed by future experiments could provide an important element to definitively assess the long standing metallicity controversy and to constrain the range of possible non-standard solar models [14, 38].
Acknowledgments: We acknowledge the generous hospitality and support of the Laboratori Nazionali del Gran Sasso (Italy). The Borexino program is made possible by funding from Istituto Nazionale di Fisica Nucleare (INFN) (Italy), National Science Foundation (NSF) (USA), Deutsche Forschungsgemeinschaft (DFG), Cluster of Excellence PRISMA+ (Project ID 39083149), and recruitment initiative of Helmholtz-Gemeinschaft (HGF) (Germany), Russian Foundation for Basic Research (RFBR) (Grants No. 19-02-00097A) and Russian Science Foundation (RSF) (Grant No. 21-12-00063) (Russia), and Narodowe Centrum Nauki (NCN) (Grant No. UMO 2017/26/M/ST2/00915) (Poland). We gratefully acknowledge the computing services of Bologna INFN-CNAF data centre and U-Lite Computing Center and Network Service at LNGS (Italy). FLV acknowledges support by “Neutrino and Astroparticle Theory Network” under the programme PRIN 2017 funded by the Italian Ministry of Education, University and Research (MIUR) and INFN Iniziativa Specifica TAsP.
References
- Cleveland et al. [1998] B. T. Cleveland et al. (Homestake), Astrophys. J. 496, 505 (1998).
- Abdurashitov et al. [2009] J. N. Abdurashitov et al. (SAGE), Phys. Rev. C 80, 015807 (2009), arXiv:0901.2200 [nucl-ex] .
- Kaether et al. [2010] F. Kaether, W. Hampel, G. Heusser, J. Kiko, and T. Kirsten, Phys. Lett. B 685, 47 (2010), arXiv:1001.2731 [hep-ex] .
- Hosaka et al. [2006] J. Hosaka et al. (Super-Kamiokande), Phys. Rev. D 73, 112001 (2006), arXiv:hep-ex/0508053 .
- Abe et al. [2016] K. Abe et al. (Super-Kamiokande), Phys. Rev. D 94, 052010 (2016), arXiv:1606.07538 [hep-ex] .
- Aharmim et al. [2008] B. Aharmim et al. (SNO), Phys. Rev. Lett. 101, 111301 (2008), arXiv:0806.0989 [nucl-ex] .
- Aharmim et al. [2013] B. Aharmim et al. (SNO), Phys. Rev. C 88, 025501 (2013), arXiv:1109.0763 [nucl-ex] .
- Agostini et al. [2018a] M. Agostini et al. (BOREXINO), Nature 562, 505 (2018a).
- Agostini et al. [2020a] M. Agostini et al. (BOREXINO), Nature 587, 577 (2020a), arXiv:2006.15115 [hep-ex] .
- Vinyoles et al. [2017] N. Vinyoles, A. M. Serenelli, F. L. Villante, S. Basu, J. Bergström, M. Gonzalez-Garcia, M. Maltoni, C. Peña-Garay, and N. Song, Astrophys. J. 835, 202 (2017), arXiv:1611.09867 [astro-ph.SR] .
- Esteban et al. [2020] I. Esteban, M. C. Gonzalez-Garcia, M. Maltoni, T. Schwetz, and A. Zhou, JHEP 09, 178 (2020), arXiv:2007.14792 [hep-ph] .
- Salaris and Cassisi [2005] M. Salaris and S. Cassisi, Evolution of Stars and Stellar Populations (John Wiley and Sons, 2005).
- Asplund et al. [2009] M. Asplund, N. Grevesse, A. Sauval, and P. Scott, Annu. Rev. Astron. Astrophys. 47 (2009), 10.1146/annurev.astro.46.060407.145222.
- Serenelli et al. [2011] A. M. Serenelli, W. Haxton, and C. Pena-Garay, Astrophys. J. 743, 24 (2011), arXiv:1104.1639 [astro-ph.SR] .
- Caffau et al. [2011] E. Caffau et al., Sol. Phys. 268 (2011), 10.1007/s11207-010-9541-4.
- Asplund, M. et al. [2021] Asplund, M., Amarsi, A.M., and Grevesse, N., A&A 653 (2021), 10.1051/0004-6361/202140445, arXiv:2105.01661 [astro-ph] .
- Grevesse and Sauval [1998] N. Grevesse and A. Sauval, Space Sci. Rev. 85 (1998).
- Magg et al. [2022] E. Magg, M. Bergemann, A. Serenelli, M. Bautista, B. Plez, U. Heiter, J. Gerber, H.-G. Ludwig, S. Basu, J. Ferguson, H. Carvajal Gallego, S. Gamrath, P. Palmeri, and P. Quinet, A&A 661, A140 (2022), arXiv:2203.02255 [astro-ph.SR] .
- Agostini et al. [2020b] M. Agostini et al. (BOREXINO), Eur. Phys. J. C 80, 1091 (2020b), arXiv:2005.12829 [hep-ex] .
- Alimonti et al. [2002] G. Alimonti et al. (Borexino Collaboration), Astropart. Phys. 16, 205 (2002).
- Alimonti et al. [2009] G. Alimonti et al. (Borexino), Nucl. Instrum. Meth. A 609, 58 (2009).
- Bellini et al. [2014] G. Bellini et al. (Borexino), Phys. Rev. D 89, 112007 (2014), arXiv:1308.0443 [hep-ex] .
- Agostini et al. [2019] M. Agostini et al. (Borexino), Phys. Rev. D 100, 082004 (2019).
- Villante et al. [2011] F. Villante et al., Phys. Lett. B 701, 336 (2011).
- Agostini et al. [2021] M. Agostini et al. (Borexino), Eur. Phys. J. C 81, 1075 (2021), arXiv:2106.10973 [physics.ins-det] .
- Agostini et al. [2018b] M. Agostini et al., Astropart. Phys. 97, 136 (2018b), arXiv:1704.02291 [physics.ins-det] .
- Hocker et al. [2007] A. Hocker et al., (2007), arXiv:physics/0703039 .
- Wolfenstein [1978] L. Wolfenstein, Phys. Rev. D 17, 2369 (1978).
- Mikheyev and Smirnov [1985] S. P. Mikheyev and A. Y. Smirnov, Sov. J. Nucl. Phys. 42, 913 (1985).
- de Holanda et al. [2004] P. de Holanda, W. Liao, and A. Smirnov, Nuclear Physics B 702, 307 (2004).
- Gando et al. [2011] A. Gando et al. (KamLAND), Phys. Rev. D 83, 052002 (2011), arXiv:1009.4771 [hep-ex] .
- Maltoni and Schwetz [2003] M. Maltoni and T. Schwetz, Phys. Rev. D 68, 033020 (2003), arXiv:hep-ph/0304176 .
- Haxton and Serenelli [2008] W. C. Haxton and A. M. Serenelli, Astrophys. J. 687, 678 (2008), arXiv:0805.2013 [astro-ph] .
- Serenelli et al. [2013] A. Serenelli, C. Peña-Garay, and W. Haxton, Phys. Rev. D 87 (2013).
- Villante and Serenelli [2021] F. Villante and A. Serenelli, Frontiers in Astronomy and Space Sciences 7 (2021), 10.3389/fspas.2020.618356, arXiv:2101.03077 [astro-ph.SR] .
- Bahcall [1989] J. N. Bahcall, Neutrino Astrophysics (Cambridge University Press, 1989).
- Vinyoles et al. [2016] N. Vinyoles, A. Serenelli, F. Villante, S. Basu, J. Bergström, M. Gonzalez-Garcia, M. Maltoni, C. Peña-Garay, and N. Song, “Solar data & plots,” (2016).
- Zhang et al. [2019] Q.-S. Zhang, Y. Li, and J. Christensen-Dalsgaard, Astrophys. J. 881, 103 (2019).
Supplemental Material
In this appendix we provide further details about the method used to obtain the abundance of carbon and nitrogen from the new CNO neutrino flux measurement presented in this letter.
The concept of this procedure, first proposed in [33, 34], is to use the 8B neutrino flux measurement as a “thermometer” to constrain the temperature of the solar core. In this way, the temperature dependence of the CNO neutrino flux can be removed, making it possible to exploit the direct connection between the power produced by the CNO cycle and the abundance of carbon and nitrogen in the core to determine the latter from a measurement of the CNO neutrino flux. In practice, we can achieve this result by constructing a weighted ratio between one of the neutrino fluxes generated in the CNO cycle (such as the one of \ce^15O, ) and the flux of \ce^8B neutrinos (the most sensitive probe of temperature deviations in the solar core), with a proper weighting factor which is chosen to minimize variations due to temperature.
Approximating the relationship between solar neutrino fluxes and variations in the solar core temperature with a power-law [35], we write
| (7) |
where , denotes the abundance of carbon and nitrogen relative to hydrogen in the solar core, and the label “SSM” indicates the SSM predicted value.
As discussed in the main text, Eq. (7) cannot be used directly to access . First, neutrinos from \ce^8B and \ce^15O are produced in an extended region of the solar core where both the temperature and chemical composition profiles vary; second, the temperature and the C+N abundance profiles are not direct inputs of the SSM. The core temperature profile, which in this approximated picture reduces to a single value , is indeed a function of a subset of the SSM parameters, the so-called environmental parameters. These parameters include the astrophysical properties of the Sun (i.e., solar age, luminosity ), the description of the solar opacity999 The radiative opacity is represented by two parameters, namely and , which describes the variation of the solar opacity profile as discussed in [10]. (), the diffusion parameter and the abundances of heavy elements relative to hydrogen (\ceC, \ceN, \ceO, \ceF, \ceNe, \ceMg, \ceSi, \ceS, \ceAr and \ceFe), which are calibrated according to spectral analyses of the photosphere (often combined with meteoritic abundances).
To properly account for the contribution of the SSM parameters in the weighted ratio of neutrino fluxes in Eq. (7) we follow the conventional expansion of the SSM flux predictions [36, 33, 34], which makes explicit the dependence of a given neutrino flux from the input in the form of a power-law
| (8) |
where denotes the SSM parameters normalized for their nominal values and the coefficients are the logarithmic derivatives [10] of the neutrino flux with respect to the SSM parameter
| (9) |
which are calculated numerically and given in [37]. We notice that the logarithmic derivatives for the composition parameters are evaluated by studying the effect of modification of the surface composition on the flux within the range allowed by the observational constraints.
In Eq. (8) the SSM inputs are conveniently grouped into four categories: along with the nuclear reaction cross section, we have separated the abundances of carbon and nitrogen that are the target of our study. The diffusion parameter is also stripped from the environmental parameters account because it features a twofold effect: on one hand, a change in the diffusion will affect the temperature stratification in the Sun; on the other hand, it will also affect the chemical composition profile.
Using Eq. (8) it is then possible to express the weighted ratio on the left-hand side of Eq. (7) as a function of the SSM input parameters
| (10) |
The optimal value of is chosen to minimize the contribution of the environmental parameters to the total uncertainty budget in the flux ratio in Eq. (10), thus making it stable against large variations in the description of the solar temperature profile caused by deviations from the assumed chemical composition and/or unconsidered effects in the computation of the radiative opacity. The contribution of uncertainties in the environmental parameters to the variance is
| (11) |
where indicates the fractional uncertainty of the -th environmental parameter. We assumed for the model inputs the same uncertainties adopted in the SSM B16 [10]. For what concerns the chemical abundances, which are among the most controversial ingredients of the SSM, we have added to the uncertainty an additional contribution to account for the difference between the GS98 and AGSS09 values (see [34]). We choose to use SSM B16-GS98 as reference, although by construction Eqs. (10) stands for any SSM.
Minimizing the variance term in Eq. (11), we find the optimal value for to be 0.769, not too far from the value calculated in the simplified picture discussed in the letter. Substituting = 0.769 in Eq. (10) and using the tabulated values of the coefficients we obtain
| (12) |
where the first line indicates the contribution of the carbon and nitrogen abundances along with the diffusion parameter, the second line highlights the different impact of nuclear cross sections, while finally the third and fourth line show the remaining effect of the parameters acting on the temperature profile.
We note that indeed the above relationship features a linear dependence upon the abundance of carbon and nitrogen, as it was assumed in the simplified description in the main text on the basis of an intuitive argument: as discussed in [34, 19], when the power indices of and sum up to one () one can replace with the ratio between the \ceC + \ceN abundance and its nominal value .
It should be noticed that in the original works [33, 34], this procedure has been proposed to probe the primordial C + N abundance. This quantity is however proportional to the surface C + N abundance apart from modification of the efficiency of elemental diffusion, which are considered in the overall error budget. As a consequence, we can consider as referred to the photosphere and use this approach to test the surface abundance of C + N, which allow us to make a direct comparison between our result and the ones of spectroscopic analysis of the photosphere.
Using the uncertainties of the SSM inputs discussed above, we can then estimate the error budget in Eq. 12, which results in
| (13) |
It is then natural to use the experimental determination of the \ce^8B and \ce^15O neutrino fluxes to invert the above equation and estimate the carbon nitrogen abundance. As discussed in the main text, we use as obtained from a global analysis of solar neutrino data (), and we extract from our measurement of the CNO neutrinos interaction rate () assuming the ratio between the \ce^13N and \ce^15O neutrinos predicted by the SSM and propagating the uncertainty to the final result, which yields
| (14) |
The full breakdown of the error budget is shown in Fig. 6. We notice that the precision of our estimate is limited primarily by the determination accuracy, which is worse than the one of (contributing for ). The second contribution by relevance is the one due to the limited precision of the nuclear cross section, which account for a uncertainty. The main term of nuclear error budget comes from (, which is the slowest reaction of the CNO-cyle and therefore the one determining its pace. The cross section for \ce^8B production also gives a non-negligible contribution of . As expected, the uncertainty of environmental parameters does not affect our result, accounting for a marginal 0.5%, while the uncertainty in the ratio between \ce^13N and \ce^15O events gives a 2.2% contribution. Finally, the uncertainty in the diffusion parameter accounts for a uncertainty in the total error budget.