Standardizing reverberation-measured C iv time-lag quasars, and using them with standardized Mg ii quasars to constrain cosmological parameters
Abstract
We use 38 C iv quasar (QSO) reverberation-mapped (RM) observations, which span eight orders of magnitude in luminosity and the redshift range , to simultaneously constrain cosmological-model and QSO radius-luminosity () relation parameters in six cosmological models, using an improved technique that more correctly accounts for the asymmetric errors bars of the time-lag measurements. We find that relation parameters are independent of the cosmological models used in the analysis and so the relation can be used to standardize the C iv QSOs. The C iv QSO cosmological constraints are consistent with those from Mg ii QSOs, allowing us to derive joint C iv + Mg ii QSO cosmological constraints which are consistent with currently accelerated cosmological expansion, as well as consistent with cosmological constraints derived using better-established baryon acoustic oscillation (BAO) and Hubble parameter [] measurements. When jointly analyzed with + BAO data, current C iv + Mg ii QSO data mildly tighten current + BAO data cosmological constraints.
keywords:
cosmological parameters – dark energy – cosmology: observations – quasars: emission lines1 Introduction
The well-established observed currently accelerated expansion of the Universe has motivated many theoretical cosmological models. In the standard general-relativistic spatially-flat CDM cosmological model (Peebles, 1984) dark energy in the form of a time-independent cosmological constant powers the currently accelerated cosmological expansion and contributes of the current cosmological energy budget, with non-relativistic cold dark matter (CDM) and baryonic matter contributing and , respectively. Although the flat CDM model makes predictions consistent with most observations (see, e.g. Scolnic et al., 2018; Yu et al., 2018; Planck Collaboration, 2020; eBOSS Collaboration, 2021), it has some potential observational discrepancies (Di Valentino et al., 2021b; Perivolaropoulos & Skara, 2022; Abdalla et al., 2022) that motivate us to also study dynamical dark energy models as well as models with non-zero spatial curvature.
There are better-established cosmological probes, such as baryon acoustic oscillation (BAO), type Ia supernova apparent magnitude, and Hubble parameter [] measurements that, when jointly analyzed, provide fairly restrictive cosmological parameter constraints (see, e.g. Cao & Ratra, 2022). Cosmological probes that are now under active development can tighten these constraints. Amongst these developing probes are H ii starburst galaxy apparent magnitude data that reach to redshift (Mania & Ratra, 2012; Chávez et al., 2014; González-Morán et al., 2021; Cao et al., 2020, 2021b; Johnson et al., 2022; Mehrabi et al., 2022), quasar (QSO) angular size measurements that reach to (Cao et al., 2017; Ryan et al., 2019; Zheng et al., 2021; Lian et al., 2021; Cao et al., 2022b), QSO flux observations that reach to (Risaliti & Lusso, 2015, 2019; Khadka & Ratra, 2020a, b, 2021, 2022; Lusso et al., 2020; Zhao & Xia, 2021; Rezaei et al., 2022; Luongo et al., 2022; Leizerovich et al., 2022; Colgáin et al., 2022; Dainotti et al., 2022b),111Note however that the Lusso et al. (2020) QSO flux compilation assumes a model for the QSO UV–X-ray correlation that is invalid above redshifts so this is the limit to which the Lusso et al. (2020) QSOs can be used to determine cosmological constraints (Khadka & Ratra, 2021, 2022). gamma-ray burst data that reach to (Wang et al., 2016, 2022; Fana Dirirsa et al., 2019; Demianski et al., 2021; Khadka & Ratra, 2020c; Hu et al., 2021; Khadka et al., 2021b; Luongo & Muccino, 2021; Cao et al., 2021a, 2022a, 2022c, 2022d; Dainotti et al., 2022a; Liu et al., 2022), and — the main subject of our paper — reverberation-mapped (RM) QSO data that reach to (Czerny et al., 2021; Zajaček et al., 2021; Khadka et al., 2021a; Khadka et al., 2022b; Khadka et al., 2022a, and this paper).
Khadka et al. (2021a); Khadka et al. (2022b); Khadka et al. (2022a) derived cosmological constraints from RM H and Mg ii QSO data. In this paper, we show that RM C iv QSO data, that extend to higher , are standardizable and derive the first cosmological constraints from C iv data.
With its ionization potential energy of eV, C iv (1549) belongs to the high-ionization line (HIL) component of the QSO broad-line region (BLR; Collin-Souffrin et al., 1988; Baskin & Laor, 2005; Karas et al., 2021), which can partially form an outflow that is manifested by the blueshifted centroid of the line (see e.g. Britzen et al., 2021) as well as by the frequent blueward line-emission asymmetry (Baskin & Laor, 2005). It is therefore not yet established whether all of the C iv material is virialized and if the standard reverberation mapping (hereafter RM222Depending on the context, we use the abbreviation RM for both reverberation mapping as a method and for reverberation-mapped quasars interchangeably.) of HILs can lead to the reliable measurements of the SMBH masses, as was previously done using the low-ionization lines (LILs) for several hundreds of objects (mainly using the Balmer line H and the resonance Mg ii line).
However, the BLR radius-luminosity () relationship for the C iv line, in the flat CDM model, appears to now be well established with a significant positive correlation and a relatively small dispersion (Kaspi et al., 2007; Lira et al., 2018; Grier et al., 2019; Kaspi et al., 2021), which allows for the possibility of using this relation for constraining cosmological parameters as we previously did for H and Mg ii lines (Martínez-Aldama et al., 2019; Panda et al., 2019a; Zajaček et al., 2021; Czerny et al., 2021; Khadka et al., 2021a; Khadka et al., 2022b; Khadka et al., 2022a).
In this paper, we use 38 high-quality C iv QSO measurements, which span eight orders of magnitude in luminosity erg s-1 and the redshift range , to constrain, for the first time, cosmological-model and relation parameters, in six general relativistic dark energy cosmological models, using a more correct technique to account for the asymmetric errors of the time-lag measurements. We find that the C iv relation parameters are independent of cosmological model, so C iv QSO data are standardizable through the C iv relation. Mg ii QSO data were also found to be standardizable through the Mg ii relation (Khadka et al., 2021a; Khadka et al., 2022b). We find that cosmological constraints from C iv and Mg ii QSO data are mutually consistent and are also consistent with those from + BAO data. Although the cosmological constraints from the joint analysis of C iv + Mg ii QSO data are weak, jointly analyzing C iv + Mg ii data with + BAO data results in a mild () tightening of the + BAO cosmological constraints.
This paper is organized as follows. We briefly introduce the cosmological models/parametrizations we study in Section 2. In Sections 3 and 4, we outline the data sets and the analysis methods we use, respectively. Our constrained cosmological parameter and relation parameter results are presented and discussed in Sections 5 and 6. We summarize our conclusions in Section 7.
2 Cosmological models
We use various combinations of data to simultaneously constrain cosmological model parameters and C iv and Mg ii QSO relation parameters in six spatially-flat and non-flat dark energy cosmological models.333For discussions of spatial curvature observational constraints see Chen et al. (2016), Rana et al. (2017), Ooba et al. (2018a, c), Park & Ratra (2019c, a), DES Collaboration (2019), Li et al. (2020), Handley (2019), Efstathiou & Gratton (2020), Di Valentino et al. (2021a), Vagnozzi et al. (2021a); Vagnozzi et al. (2021b), KiDS Collaboration (2021), Arjona & Nesseris (2021), Dhawan et al. (2021), Renzi et al. (2022), Geng et al. (2022), Wei & Melia (2022), Mukherjee & Banerjee (2022), Glanville et al. (2022), and references therein. The Hubble parameter , discussed below, is used to make theoretical predictions in these cosmological models.
In the cosmological models here, we assume one massive and two massless neutrino species with the non-relativistic neutrino physical energy density parameter , where is the Hubble constant in units of 100 . The non-relativistic matter density parameter , where and are the current values of the observationally-constrained baryonic and cold dark matter physical energy density parameters, respectively.444In the C iv QSO and Mg ii QSO alone cases, the current value of the baryonic matter energy density parameter and the Hubble constant are set to and , respectively, because these data alone are unable to constrain and . Including neutrino species is more accurate even though it only has a mild effect on the constraints from Mg ii and C iv data.
In the CDM models the Hubble parameter
| (1) |
where the cosmological parameters with being the spatial curvature energy density parameter and the cosmological constant dark energy density parameter . In the flat CDM model the constrained cosmological parameters are , , and (only is constrained in the C iv QSO and Mg ii QSO alone cases), whereas in the non-flat CDM model one additional cosmological parameter, , is constrained.
In the XCDM parametrizations
| (2) |
where the cosmological parameters with being the X-fluid equation of state parameter ( correspond to CDM models). The current value of the dynamical dark energy density parameter of the X-fluid . In the flat XCDM parameterization the constrained cosmological parameters are , , , and (only and are constrained in the C iv QSO and Mg ii QSO alone cases), whereas in the non-flat XCDM parametrization is constrained as well.
In the CDM models (Peebles & Ratra, 1988; Ratra & Peebles, 1988; Pavlov et al., 2013)555For discussions of CDM observational constraints see Zhai et al. (2017), Ooba et al. (2018b, 2019), Park & Ratra (2018, 2019b, 2020), Solà Peracaula et al. (2019), Singh et al. (2019), Ureña-López & Roy (2020), Sinha & Banerjee (2021), Xu et al. (2022), de Cruz Perez et al. (2021), Jesus et al. (2021), and references therein.
| (3) |
where the cosmological parameters and the scalar field, , dynamical dark energy density parameter,
| (4) |
is determined by numerically solving the Friedmann equation (3) and the equation of motion of the scalar field
| (5) |
Here we assume an inverse power-law scalar field potential energy density
| (6) |
In these equations, an overdot and a prime denote a derivative with respect to time and , respectively, is the Planck mass, is a positive constant ( correspond to CDM models), and is a constant that is determined by the shooting method implemented in the Cosmic Linear Anisotropy Solving System (class) code (Blas et al., 2011). In the flat CDM model the constrained cosmological parameters are , , , and (only and are constrained in the C iv QSO and Mg ii QSO alone cases), whereas in the non-flat CDM model is also constrained.
3 Data
In this work, we use C iv QSO, Mg ii QSO, and + BAO data, as well as combinations of these data sets, to constrain cosmological-model and QSO relation parameters. These data sets are summarized next, with the emphasis on the C iv QSO sample.
-
C iv QSO data. Here we describe the sample of high-quality 38 C iv RM QSOs. The first time-lag measurements of the broad C iv line were inferred by Peterson et al. (2005, 2006) for 4 sources. The source NGC4151 was monitored by Metzroth et al. (2006). The C iv time-lag for the intensively monitored NGC5548 was determined by De Rosa et al. (2015). Lira et al. (2018) performed RM for 17 high-luminosity QSOs for over 10 years, out of which 8 QSOs were reported to have statistically significant () C iv time-lag measurements. Hoormann et al. (2019) report 2 C iv detections for quasars at and from the photometric Dark Energy Survey Supernova Program (DES-SN) and the spectroscopic Australian Dark Energy Survey (Oz-DES). Within the Sloan Digital Sky Survey Reverberation Mapping project (SDSS-RM), Grier et al. (2019) determined C iv time-lag measurements for 48 QSOs with an average false-positive rate of . Of these, 16 QSOs pass the highest-quality criteria, in the redshift range of and the monochromatic luminosity range . Shen et al. (2019) showed that adding more photometric data points and spectroscopic data ( years of photometric and spectroscopic measurements, respectively, in comparison to years of spectroscopic and photometric monitoring performed by Grier et al., 2019) results in the significant detection of 3 more C iv time-lag measurements. Using 20 years of photometric and spectrophotometric data, Kaspi et al. (2021) report significant C iv time-delays for 3 QSOs at redshifts , , and .
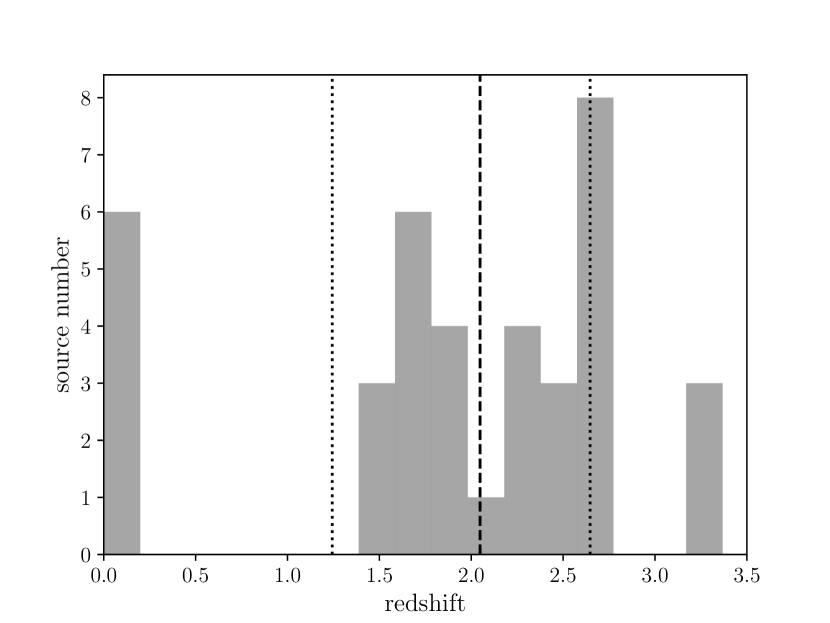
Figure 1: The redshift distribution for the “golden” sample of 38 C iv QSOs from Kaspi et al. (2021). The dashed line stands for the redshift median at , while the dotted lines represent 16% and 84% percentiles at and , respectively. The histogram bin size is . Kaspi et al. (2021) compiled (with a few corrections) available C iv RM sources, finding 38 QSOs with significantly measured C iv time-delays, including their 3 QSOs. The time-delays were determined by using either the interpolated cross-correlation function (ICCF) or the -transformed dicrete correlation function (zDCF) or a combination of both, which ensures a relative homogeneity of the sample in terms of the time-delay methodology in comparison with, e.g., the H sample where several different methods are applied and combined, see e.g. Zajaček et al. (2019) or Rakshit (2020) for overviews. We refer to this sample of 38 C iv QSOs as “golden” and it covers the redshift range , with the median redshift of and 16-% and 84-% percentile redshifts of and , respectively. The redshift distribution is shown in Fig. 1. The sources belonging to the golden sample are listed in Table LABEL:tab:civdata, including their redshift, flux density at 1350 Å , monochromatic luminosity at 1350 Å (computed assuming a flat CDM model with , , and ), and the rest-frame C iv time-lag (typically with asymmetrical error bars).
The correlation between the rest-frame C iv time-delay and the UV monochromatic luminosity at Å is significant, with the Pearson correlation coefficient () and the Spearman rank-order correlation coefficient (). Given the large correlation coefficient, we fit the golden dataset with the power-law relation , where , and find the best-fit intercept and the best-fit slope , for which the individual time-delay errors were neglected in the Levenberg-Marquardt algorithm. This results in an intrinsic scatter of dex and (36 degrees of freedom). When we consider individual symmetrized time-delay errors (see the discussion in the paragraph below eq. (18)), we obtain and with dex and . See Fig. 2 for the best-fitting relations, which were inferred using the curve_fit function from the scipy library. To add information about the accretion state of each QSO from our sample in the relation, we estimate the Eddington ratio , where is the bolometric luminosity calculated using the luminosity-dependent bolometric factor according to Netzer (2019), and is the Eddington luminosity (Zajaček et al., 2014; Eckart et al., 2017; Zajaček et al., 2020b). To obtain , the supermassive black hole (SMBH) mass was calculated using the virial relation , where the virial factor was estimated using the fitted formula that inversely scales with the full width at half maximum, FWHM, see Mejía-Restrepo et al. (2018). The FWHM and values were adopted from the compilation of Kaspi et al. (2021). In Fig. 2 each source is coloured by the corresponding value of .
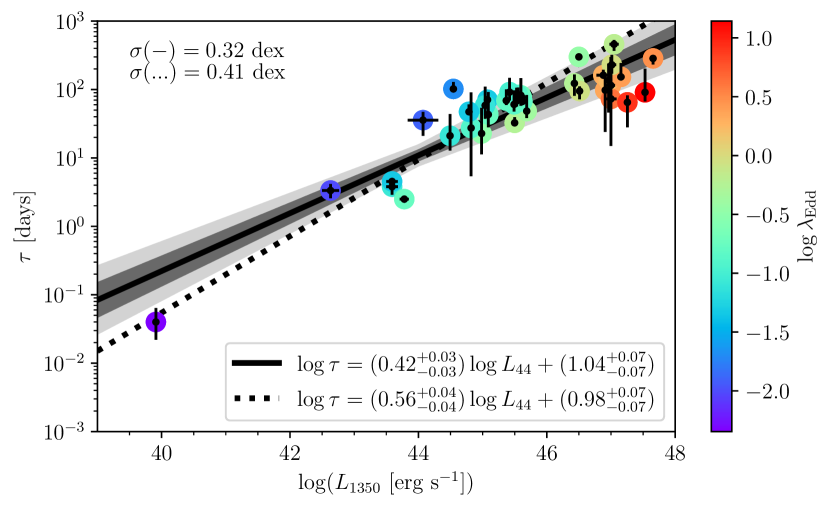
Figure 2: Radius-luminosity relationship for the “golden” sample of 38 C iv QSOs (see also Kaspi et al., 2021). The luminosity at 1350 Å is based on the flat CDM model (with , , and ). The points are colour-coded with respect to the calculated Eddington ratio of the source. When we neglect individual time-delay errors, the best-fit relation (black solid line) determined by the Levenberg-Marquardt algorithm has a slope of and a scatter of dex. The dark and light gray areas around the best-fit solid line are one and two sigma confidence regions. Considering individual time-delay errors yields the best-fit relation (dotted line) with a larger slope of and the scatter of data around this relation is dex. Apart from the “golden” C iv AGN sample reported by Kaspi et al. (2021), there are additional lower-quality C iv time-lag detections reported in literature. Grier et al. (2019) report additional 32 C iv detections with a lower quality rating of 1, 2, and 3.666Grier et al. (2019) assign the quality flag of 1 to the lowest-quality time-lag detections, while 5 is the highest quality rating. There are different factors considered in the rating scheme, such as the clear correlation between the continuum and C iv emission-line light curves, overall consistency between JAVELIN, CREAM, and ICCF time-lag detections, and the presence of multiple significant time-lag peaks. As a follow-up of the Oz-DES RM project, Penton et al. (2022) designed a quality-cut methodology and out of 6 test sources, 2 at redshifts and pass all the quality criteria. These additional 34 sources will be considered in a future study.
-
Mg ii QSO data. As listed in table A1 of Khadka et al. (2021a), the Mg ii QSO sample consists of 78 QSOs and spans the redshift range . Detailed descriptions of Mg ii QSO data can be found in Khadka et al. (2021a) and Martínez-Aldama et al. (2020b), where it was shown that they obey the relation, with measured quantities being time-delay and QSO flux measured at 3000 Å; see also Prince et al. (2022) for an updated Mg ii QSO relation in the fixed flat CDM cosmology. We note that the Mg ii QSO sample is relatively homogeneous since 57 significant time-delay detections (hence 73% of Mg ii QSO sources) were determined by Homayouni et al. (2020), who applied a consistent time-delay method to all the sources based on JAVELIN (Zu et al., 2011), which was compared with the CREAM results that were generally consistent (Starkey et al., 2016). However, the time-delay uncertainties for this sample are not completely homogeneous and a consistent treatment of the continuum and the line-emission light-curve correlation and the time-delay inference is needed to homogenize the sample of the best Mg ii QSO time delays and their uncertainties.
-
. There are 32 and 12 BAO measurements listed in Tables 1 and 2 of Cao & Ratra (2022), spanning the redshift ranges and , respectively.
4 Data Analysis Methodology
We utilize the relation parametrization according to Bentz et al. (2013), where we replace the monochromatic luminosity and rest-frame time-delay taking into account the C iv-region emission properties
| (7) |
where , , and are the C iv time-lag, the intercept parameter, and the slope parameter, respectively, and the monochromatic luminosity at 1350 Å
| (8) |
with measured quasar flux at 1350 Å in units of . The luminosity distance is a function of redshift and the cosmological parameters,
|
|
(9) |
where the comoving distance is
| (10) |
with being the speed of light.
The Mg ii QSO relation is
| (11) |
where , , and are the Mg ii time-lag, the intercept parameter, and the slope parameter, respectively, and the monochromatic luminosity at 3000 Å
| (12) |
with measured quasar flux at 3000 Å in units of .
The natural log of the C iv likelihood function (D’Agostini, 2005) is
| (13) |
where
| (14) |
with total uncertainty
| (15) |
where is the C iv QSO intrinsic scatter parameter which also contains the unknown systematic uncertainty, and is the number of data points.
The natural log of the Mg ii likelihood function is
| (16) |
where
| (17) |
with total uncertainty
| (18) |
where is the Mg ii QSO intrinsic scatter parameter which also contains the unknown systematic uncertainty.
The error bars are typically asymmetric. As used for Mg ii QSOs in Khadka et al. (2021a) and Cao & Ratra (2022), in what follows, symmetrized errors mean that we are using symmetrized ’s defined as , where and are the upper and lower errors of , respectively. On the other hand, asymmetric errors mean that we directly use asymmetric and as follows: when the theoretical prediction for is larger (smaller) than the observed value, ().
The detailed descriptions for the likelihood functions of and BAO data can be found in Cao et al. (2020).
| Parameter | Prior | |
| Cosmological-Model Parameters | ||
| a | [None, None] | |
| b | [0, 1] | |
| c | [0, 1] | |
| [-2, 2] | ||
| [0, 10] | ||
| [-5, 0.33] | ||
| Relation Parameters | ||
| [0, 5] | ||
| [0, 10] | ||
| [0, 5] |
-
a
. In the C iv QSO and Mg ii QSO alone cases, is set to be 70 , while in other cases, the prior range is irrelevant (unbounded).
-
b
In the C iv QSO and Mg ii QSO alone cases, is set to be 0.0245, i.e. .
-
c
In the C iv QSO and Mg ii QSO alone cases, is ensured.
We list the flat priors of the free cosmological-model and relation parameters in Table 1. By maximizing the likelihood functions, we obtain the unmarginalized best-fitting values and posterior distributions of all free cosmological-model and relation parameters. The Markov chain Monte Carlo (MCMC) code MontePython (Audren et al., 2013; Brinckmann & Lesgourgues, 2019), the class code, and the python package getdist (Lewis, 2019) are used to perform our analyses.
One can find the definitions of the Akaike Information Criterion (AIC), the Bayesian Information Criterion (BIC), and the Deviance Information Criterion (DIC) in our previous paper (see, e.g. Cao et al., 2022d). , , and are computed as the differences between the AIC, BIC, and DIC values of the other five cosmological dark energy models and those of the flat CDM reference model. Positive (negative) values of these s show that the model under investigation fits the data worse (better) than does the flat CDM reference model. In comparison with the model with the minimum IC, indicates weak evidence against the model under investigation, indicates positive evidence against the model under investigation, indicates strong evidence against the model under investigation, and indicates very strong evidence against the model under investigation.
5 Results
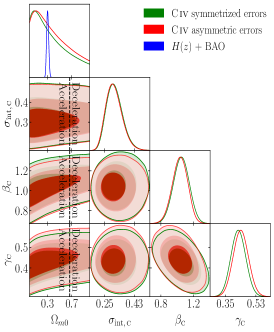
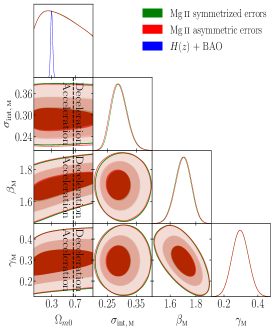
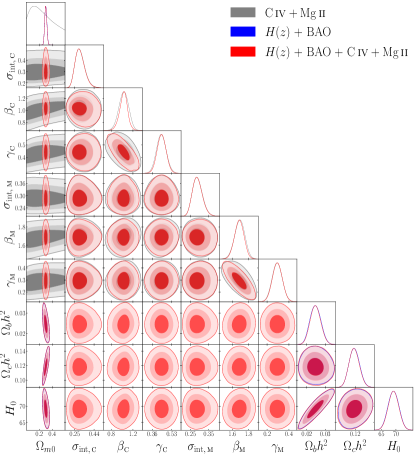
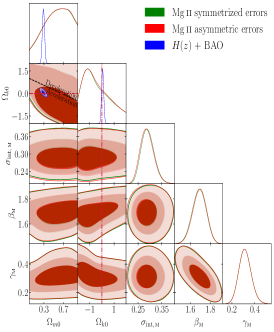
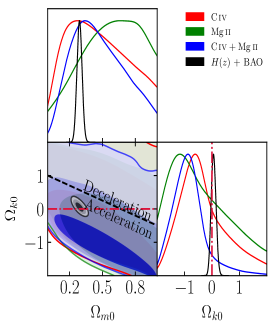
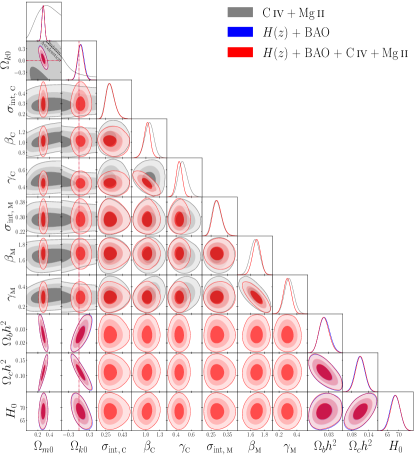
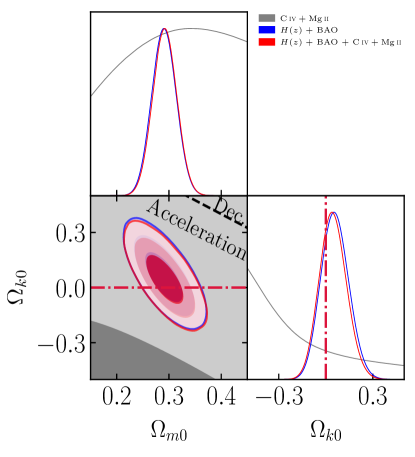
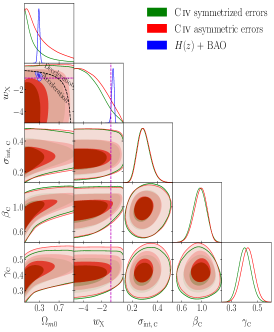
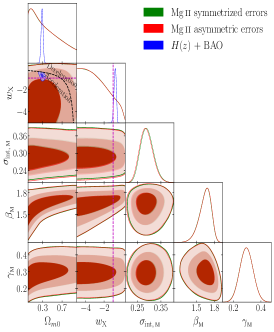
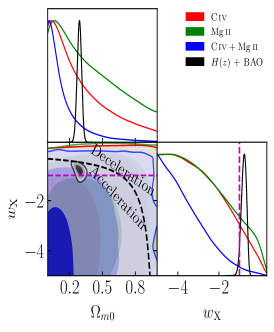
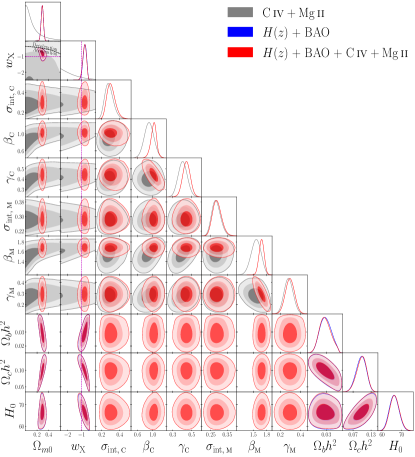
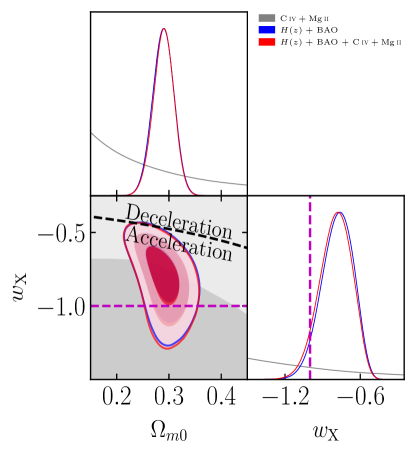
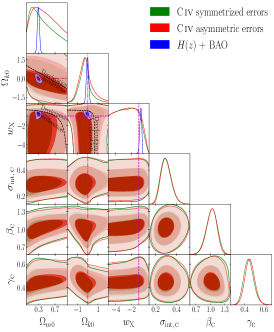
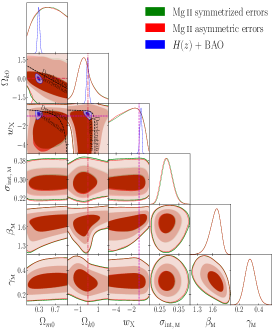
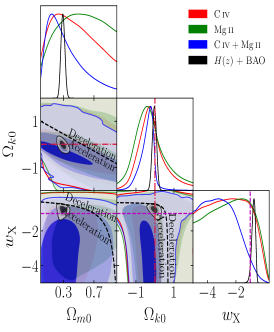
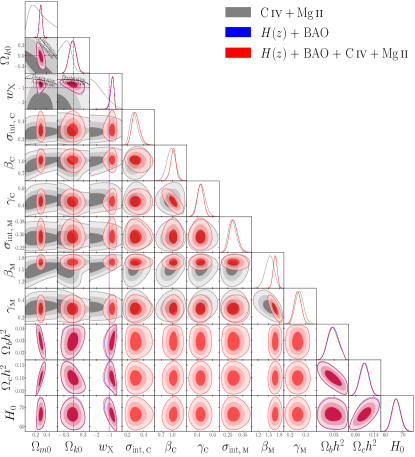
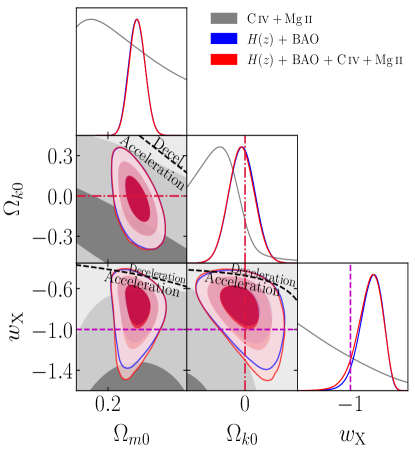
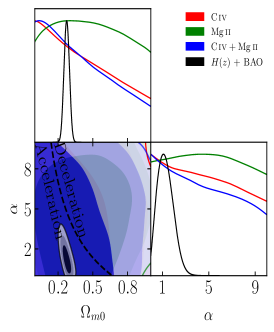
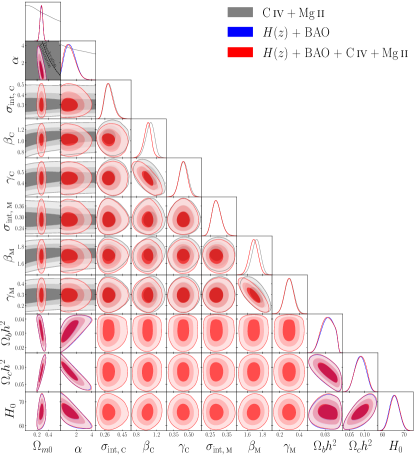
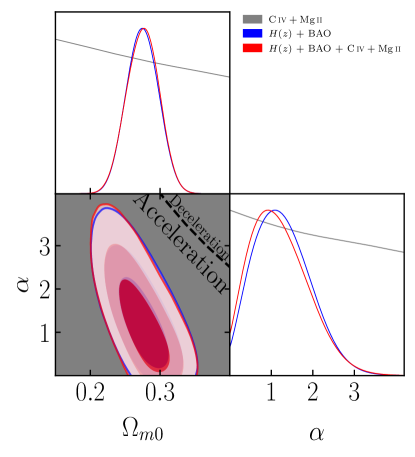
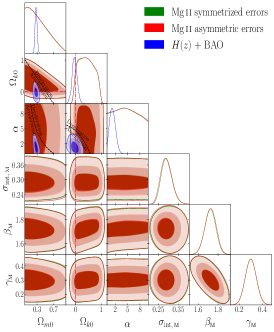
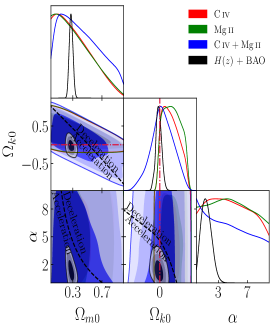
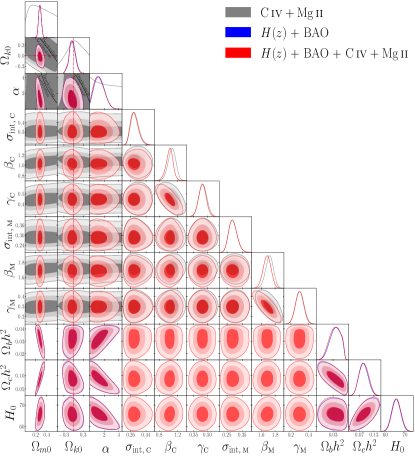
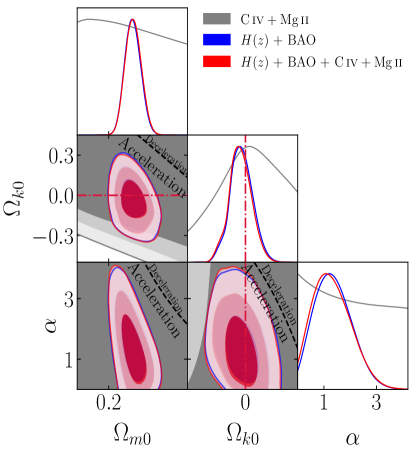
The posterior one-dimensional probability distributions and two-dimensional confidence regions of cosmological-model and relation parameters for the six cosmological models are shown in Figs. 3–8, where in panel (a) of each figure results of the C iv data analyses with symmetrized errors and asymmetric errors are shown in green and red, respectively; in panel (b) of each figure results of the Mg ii data analyses with symmetrized errors and asymmetric errors are shown in green and red, respectively; in panel (c) of each figure the results of the C iv, Mg ii, and joint C iv + Mg ii data analyses with asymmetric errors, and the + BAO data analysis are shown in red, green, blue, and black, respectively; and in panels (d) and (e) of each figure the results of the joint (asymmetric errors) C iv + Mg ii, + BAO, and + BAO + C iv + Mg ii data analyses are shown in grey, blue, and red, respectively. The unmarginalized best-fitting parameter values, as well as the values of maximum likelihood , AIC, BIC, DIC, , , and , for all models and data sets, are listed in Table 2. The marginalized posterior mean parameter values and uncertainties ( error bars and 1 or 2 limits), for all models and data sets, are listed in Table 3.
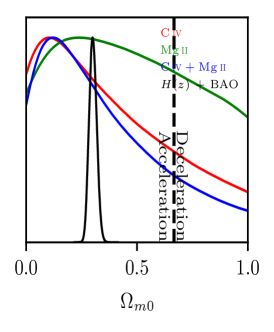
In all six cosmological models, all data combinations more favour currently accelerating cosmological expansion. This is also the case with Mg ii QSO data (Khadka et al., 2021a; Khadka et al., 2022b), but differs from what happens with H QSO data, which more favour currently decelerated cosmological expansion (Khadka et al., 2022a).
5.1 Constraints from C iv, Mg ii, and C iv + Mg ii QSO data
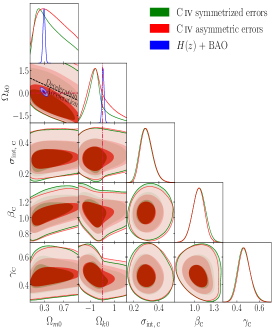
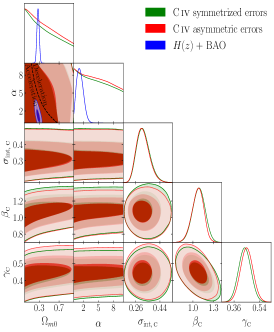
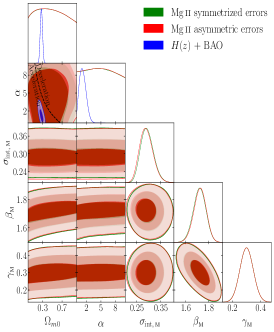
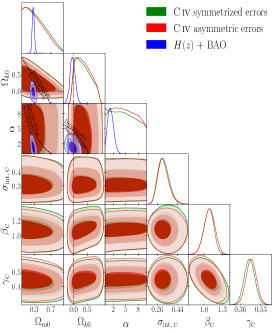
As shown in panels (a) and (b) of Figs. 3–8 and Table 3, we find that results from C iv QSO and Mg ii QSO symmetrized errors data analyses are only mildly different (less than 1) from those of C iv QSO and Mg ii QSO asymmetric errors data analyses. Since the analyses with asymmetric errors are the more correct ones, we summarize the asymmetric errors C iv results in what follows. The symmetric errors Mg ii results are discussed in Khadka et al. (2021a).
The constraints from C iv data range from a low of (2, flat XCDM) to a high of (1, non-flat CDM).
The constraints from C iv data are , , and for non-flat CDM, XCDM, and CDM, respectively. Although C iv data favour closed hypersurfaces in non-flat CDM and non-flat XCDM, and favour open hypersurfaces in non-flat CDM, flat hypersurfaces are well within 1. C iv data only provide very weak constraints of and .
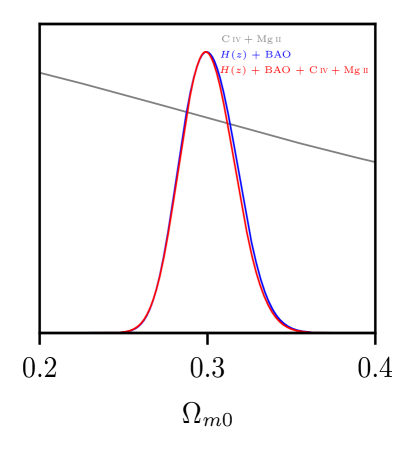
From panels (c) of Figs. 3–8, we see that the cosmological-model parameter constraints from C iv QSO data and from Mg ii QSO data are mutually consistent, as are the cosmological constraints from C iv QSO and + BAO data and from Mg ii QSO and + BAO data.777Khadka et al. (2021a); Khadka et al. (2022b) had earlier shown that the symmetric errors Mg ii cosmological constraints are mutually consistent with those from + BAO data. This differs from the H QSOs cosmological constraints, which are inconsistent with those from + BAO data (Khadka et al., 2022a). It is therefore reasonable to perform joint analyses of C iv QSO and Mg ii QSO data. As shown in panels (d) and (e) of Figs. 3–8, the cosmological-model parameter constraints from C iv + Mg ii QSO data and from + BAO data are mutually consistent at ,888I.e., in the two-dimensional contour plots all or most of the 1 + BAO data contour always lie inside the 2 C iv + Mg ii QSO data contour. so these data sets can be jointly analyzed.
The constraints on the C iv relation parameters in the six different cosmological models are mutually consistent, so the relation C iv data set is standardizable. The constraints on the intrinsic scatter parameter of the C iv relation, , range from a low of (flat XCDM) to a high of (flat CDM), with a difference of , which are larger than those of Mg ii (). The constraints on the slope parameter of the C iv relation, , range from a low of (flat XCDM) to a high of (non-flat CDM), with a difference of . The constraints on the intercept parameter of the C iv relation, , range from a low of (flat XCDM) to a high of (non-flat CDM), with a difference of .
A summary value of the measured C iv relation slope, , indicates that it is about lower than and consistent with the prediction of simple photoionization theory (, Karas et al., 2021; Panda, 2022), on the other hand a summary value of the measured Mg ii relation slope, (also see Khadka et al., 2021a; Khadka et al., 2022b), indicates that it is about lower than .
The constraints from (asymmetric errors) C iv + Mg ii data range from a low of (2, flat XCDM) to a high of (1, flat CDM).
The constraints from C iv + Mg ii data are (, 2), (, 2), and (, 2) for non-flat CDM, XCDM, and CDM, respectively. C iv + Mg ii data favour closed hypersurfaces in non-flat CDM and non-flat XCDM, being (but ) and away from flat hypersurfaces, respectively, and favour open hypersurfaces in non-flat CDM, with flat hypersurfaces being within 1. C iv + Mg ii data still provide weak constraints on and , but constraints are more than 2 away from (CDM).
C iv + Mg ii data provide consistent (within ) constraints on the intrinsic scatter, slope, and intercept parameters of both C iv and Mg ii relations, which confirms that C iv and Mg ii QSOs are standardizable through different relations.
5.2 Constraints from + BAO + C iv + Mg ii data
The mutually consistent cosmological-model parameter constraints allow us to jointly analyze + BAO and C iv + Mg ii data. In what follows we summarize the cosmological-model parameter constraints from + BAO + C iv + Mg ii data and contrast them with those from + BAO data.
The + BAO + C iv + Mg ii data provide constraints ranging from a low of (flat CDM) to a high of (flat CDM), with a difference of , which only slightly differ from those determined using only + BAO data.
The constraints from + BAO + C iv + Mg ii data range from a low of (flat CDM) to a high of (flat CDM), with a difference of , which are (flat CDM) lower than and (flat CDM) higher than the median statistics estimate of (Chen & Ratra, 2011), and (flat CDM) and (flat CDM) lower than the local Hubble constant measurement of (Riess et al., 2021). The + BAO + C iv + Mg ii data provide constraints that are slightly higher ( at most) and mostly more restrictive ( at most) than those from + BAO data.
The constraints from + BAO + C iv + Mg ii data are , , and for non-flat CDM, XCDM, and CDM, respectively, which are slightly lower ( at most) than those from + BAO data. Similar to the + BAO data results, non-flat CDM mildly favours open hypersurfaces, whereas non-flat XCDM and non-flat CDM mildly favour closed hypersurfaces. However, flat hypersurfaces are well within 1.
Dark energy dynamics is favoured. For flat (non-flat) XCDM, (), with central values being () higher than ; and for flat (non-flat) CDM, (), with central values being () away from . The addition of C iv + Mg ii data to + BAO data bring and values lower, and closer to CDM model values.
As expected, the constraints on the C iv and Mg ii relation parameters are consistent with those from the individual data sets and the C iv + Mg ii data.
5.3 Model Comparison
From the AIC, BIC, and DIC values listed in Table 2, we find the following results (from the more correct C iv and Mg ii asymmetric errors analyses):
-
1)
AIC. + BAO and + BAO + C iv + Mg ii data favour flat CDM the most, and the evidence against the rest of the models/parametrizations is either only weak or positive.
C iv, Mg ii, and C iv + Mg ii data favour non-flat XCDM the most, however, in the C iv case, the evidence against non-flat CDM and flat XCDM is only weak, the evidence against flat CDM is positive, and the evidence against flat and non-flat CDM is strong; in the Mg ii case, the evidence against non-flat CDM and flat XCDM is positive, the evidence against flat CDM and flat CDM is strong, and the evidence against non-flat CDM is very strong; and in the C iv + Mg ii case, the evidence against flat XCDM is positive, the evidence against non-flat CDM is strong, and other models are very strongly disfavoured.
-
2)
BIC. + BAO and + BAO + C iv + Mg ii data favour flat CDM the most, and in the former case, the evidence against the rest of the models/parametrizations is either only weak or positive, while in the latter case, the evidence against the rest of the models/parametrizations is either positive or strong (non-flat XCDM and non-flat CDM).
C iv data favour non-flat CDM the most, and the evidence against flat and non-flat XCDM is only weak, the evidence against flat CDM is positive, and the evidence against flat and non-flat CDM is strong.
Mg ii and C iv + Mg ii data favour non-flat XCDM the most, however, in the Mg ii case, the evidence against non-flat CDM, flat XCDM, and non-flat XCDM is only weak, the evidence against flat CDM is strong, and the evidence against non-flat CDM is very strong; and in the C iv + Mg ii case, the evidence against non-flat CDM and flat XCDM is positive, the evidence against flat CDM is strong, and non-flat XCDM and non-flat CDM are very strongly disfavoured.
-
3)
DIC. + BAO and + BAO + C iv + Mg ii data favour flat CDM the most, and the evidence against the rest of the models/parametrizations is either only weak or positive.
C iv and Mg ii data favour flat CDM the most, however, in the former case, the evidence against the rest of the models/parametrizations is either only weak or positive, whereas in the latter case, the evidence against flat and non-flat CDM is only weak, the evidence against non-flat CDM and flat XCDM is positive, and the evidence against non-flat XCDM is strong.
C iv + Mg ii data favour non-flat XCDM the most, and the evidence against the rest of the models/parametrizations is either only weak or positive.
6 Discussion
We have shown that QSOs with measured C iv time-delays can be standardized and so can be used as cosmological probes. Mg ii QSOs are also standardizable and so can be jointly analyzed with C iv QSOs to constrain cosmological model parameters. This is not true for current H QSOs (Khadka et al., 2022a) and more work is needed to clarify the H QSO situation.
However, we find a 2.3 difference in the measured slopes of the C iv and Mg ii relations, in the flat CDM model asymmetric error bars results of Table 3, or from the summary values of the measured C iv and Mg ii relation slopes, and . And while the C iv slope is only about lower than the slope predicted by simple photoionization theory (Bentz et al., 2013; Karas et al., 2021; Panda, 2022) or a dust-based model of the BLR (Czerny & Hryniewicz, 2011; Naddaf et al., 2021; Müller et al., 2022; Naddaf & Czerny, 2022), the Mg ii slope is about lower than , which is more statistically significant.
In this section we examine potential (selection effect produced) differences between the C iv and Mg ii compilations and conclude that the ones we study here are not very significant. We begin by computing the Eddington ratio for the 78 Mg ii sources and the 38 C iv sources. We use the definition where the bolometric luminosity is estimated as a multiple of the corresponding monochromatic luminosity ( for the C iv sample and for the Mg ii sample; for the calculations in this section we adopt the fixed flat CDM model with , , and ), taking into account the monochromatic luminosity-dependent bolometric correction factors according to Netzer (2019). Subsequently, we evaluate the correlations between and the monochromatic luminosity and the redshift.
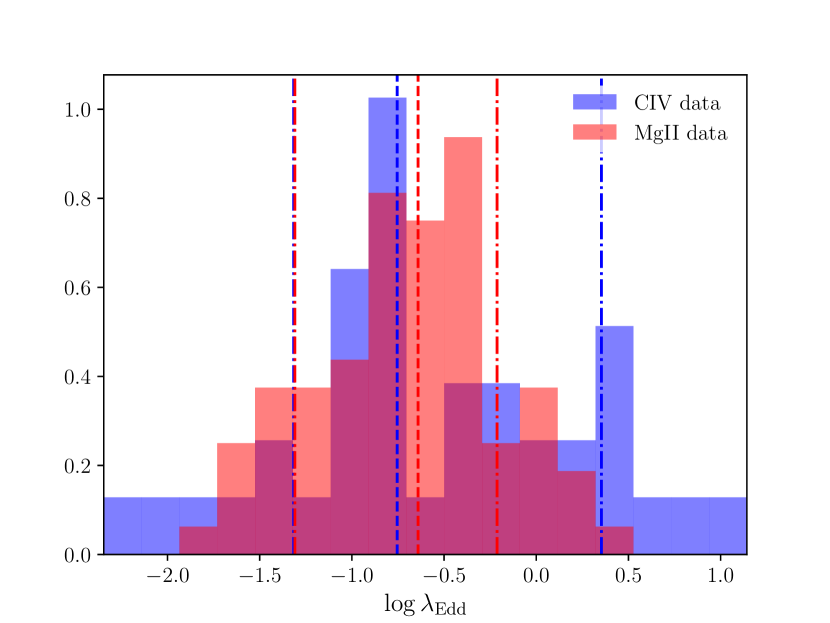
The Eddington-ratio normalized distributions for the C iv and Mg ii samples are shown in Fig. 9, represented by blue and pink histograms, respectively. The vertical dashed lines stand for the distribution medians, while vertical dot-dashed lines mark 16- and 84-% percentiles. For the Mg ii sample, the distribution median is , while 16- and 84-% percentiles are and , respectively. For the C iv sample, the median of the distribution is , while 16- and 84-% percentiles are and , respectively. The median of the Mg ii sources is larger than the median of the C iv sources. However, the C iv distribution is skewed significantly towards higher values, with a total range of , in comparison with the range of for the Mg ii sample. Also note that the Eddington ratios of the super-Eddington sources generally have large error bars, being consistent with the Eddington limit as well.
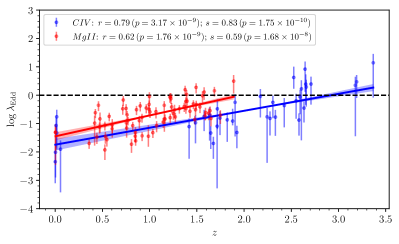
The - and - or - correlations are positive, see Fig. 10, left and right panels, respectively. The correlation significance is evaluated using Pearson and Spearman rank-order correlation coefficients, see the legend in Fig. 10. For both C iv and Mg ii samples, the - correlation is positive and significant, being slightly stronger and more significant for C iv sources. The correlation between and the corresponding monochromatic luminosity is also positive and significant for both samples. Here we stress that the correlation between the Eddington ratio and the corresponding monochromatic luminosities is enhanced intrinsically due to the definition of , where the bolometric luminosity is proportional to the monochromatic luminosity. However, the relative comparison of the correlation slopes provides hints about the similarities/differences of the two samples.
The slopes and the intercepts of the best-fitting linear relations between and are
| (19) |
while for the best-fitting linear relations between and the monochromatic luminosity we obtain
| (20) |
The best-fitting relations are depicted in Fig. 10 including 1 uncertainties of the best-fitting parameters. Compared to the C iv case, the Mg ii Eddington ratios for the sample of 78 sources appear to increase more steeply with both redshift and monochromatic luminosity, though the Mg ii and C iv slopes are consistent within 1.0 (for the vs. correlations) and 1.4 (for the vs. monochromatic luminosity correlations), respectively. The differences in slopes may merely be due to the limited number of sources in each sample, and hence a selection effect.
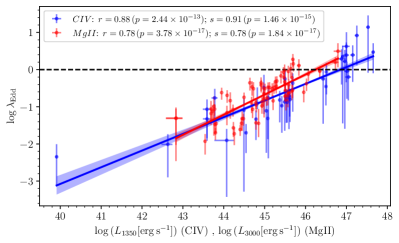
However, when we study how the time-delay difference between the measured value and the value predicted from the best-fit relation (in the fixed flat CDM model) — (Martínez-Aldama et al., 2019; Zajaček et al., 2020a) — correlates with the Eddington ratio, the (anti)correlation is more significant and steeper for Mg ii sources. This is shown in Fig. 11 for both C iv (blue points) and Mg ii sources (red points). As a caveat, we note that unless the SMBH mass is inferred independently of the RM, and are intrinsically correlated as , which implies anticorrelation.999It is generally thought advisable to use independent accretion-rate proxies, such as the relative Fe ii strength the variability factor (Martínez-Aldama et al., 2020b), or the shape of the ionizing continuum (Panda et al., 2019b; Fonseca Alvarez et al., 2020; Ferland et al., 2020), rather than the Eddington ratio, due to the interdependency on the rest-frame time delay and the monochromatic luminosity that appear in the correlation. However, here we focus on a relative comparison between the Mg ii and C iv samples instead of the absolute values of the correlation slopes and normalizations. Therefore, we can only assess the different behaviour between and based on the relative comparison of the correlation coefficients and the correlation slopes for the two samples. The anticorrelation between and is more significant for the Mg ii sample with a Spearman rank-order correlation coefficient of , while for the C iv sample we obtain (). When we fit a linear function to the anticorrelations we get
| (21) |
Hence, the anticorrelation is significantly steeper for the Mg ii sample (by nearly a factor of two) in comparison with the current C iv sample. A combination of steeper – anticorrelation with a slightly steeper correlation between and the monochromatic luminosity for the Mg ii sources can qualitatively account for the flatter Mg ii relation with respect to the C iv one. However, with a future increase in the number of Mg ii and C iv RM sources, both towards lower and higher redshifts, the difference in the correlation slopes is expected to become progressively weaker, since the general trends appear to be consistent between the Mg ii and the C iv samples and the differences can be traced to a few outlying sources.
There may also be a potential problem in the way was measured in the C iv QSOs. Such measurements are uncertain, particularly for C iv. The C iv-emitting material is likely not completely virialized as revealed by its blueshift and blueward asymmetry with respect to low-ionization lines, which hints at an outflow approaching the observer. Therefore, the SMBH mass determination may be biased (Baskin & Laor, 2005). The anticorrelation between the virial factor and the C iv FWHM is also the most uncertain among broad lines due to the smallest correlation coefficient as investigated by Mejía-Restrepo et al. (2018), which results in larger errorbars of C iv Eddington ratios in comparison with Mg ii ones in Fig. 10. Looking at how the C iv sample was selected might suggest that the histogram in Fig. 9 may not well represent the true C iv values. One of the criteria used when selecting the final C iv QSOs from the SDSS-RM sample is the variability of the light curve. Sources with no significant variability were excluded from the final sample to ensure a reliable time-lag estimate (Grier et al., 2019). Several papers claim that there is a negative correlation between the variability and the Eddington ratio (e.g. De Cicco et al., 2022, and references therein). This suggests that the criterion of the variability applied to the SDSS-RM sample excludes highly-radiating QSOs. Such QSOs flatten the relation and increase the scatter in the case of the H relation, which is not observed in the C iv relation. In addition, Kaspi et al. (2021) claim that their three sources do not show strong outflows, which are usually found in QSOs with high Eddington ratios (Coatman et al., 2017; Martínez-Aldama et al., 2018). We performed a visual inspection of the rest of the sources and most of them show spectral features associated with low Eddington ratios (symmetric profiles in C iv 1549, moderate He ii contribution, strong contribution of C iii] , and low contributions of Fe ii and Fe iii). All these facts, in contradiction to Fig. 9, suggest that the C iv sample mainly includes low Eddington sources. However, a detailed analysis of variability and spectral properties is needed to confirm the accretion state of sources in the C iv sample.
The C iv sample spans eight orders of luminosity ( erg s-1) and covers a large redshift range (), and is standardizable and suitable for constraining cosmological models. The Mg ii sample has smaller luminosity and redshift ranges ( erg s-1, ), but is standardizable and also suitable for constraining cosmological parameters (Khadka et al., 2021a; Khadka et al., 2022b), and can be jointly analyzed with the C iv sample. The same is not true for the H sample. Although the H sample spans almost five orders of luminosity ( erg s-1), the redshift range is narrow (), but most importantly the current H sample appears to be not standardizable (Khadka et al., 2022a). Therefore, we cannot jointly use the Mg ii, C iv and H samples, which is unfortunate since they together contain more sources over large luminosity and redshift ranges, all of which are beneficial if such QSOs are to be useful for cosmological purposes.
With future missions and surveys, such as the Black Hole Mapper by the SDSS-V (Kollmeier et al., 2017), long-term spectroscopic and photometric measurements of reverberation lags for the continuum and the “major" emission lines (C iv, Mg ii, and H/H) will be obtained for a large sample of quasars, adding wide-area, multi-epoch optical spectroscopy to the era of time-domain imaging. With the photometric Legacy Survey of Space and Time performed by the Vera C. Rubin observatory (Ivezić et al., 2019), many more RM objects will be obtained, e.g. the Rubin Deep Drilling Field should result in a few thousand measurements at redshifts (Kovačević et al., 2022; Brandt et al., 2018). This will lead to the decrease in the statistical error. The source monitoring will be performed photometrically in six broad optical bands, which will be used to probe the continuum accretion-disc response as well as the BLR response using the photometric RM (see e.g., Panda et al., 2019a; Martinez Aldama et al., 2020a, for the assessment of the photometric RM for BLR RM and the future application in cosmology). Currently, we obtain a difference with respect to BAO+ data constraints by at most when 116 C iv + Mg ii sources are included, hence a QSO dataset larger by an order of magnitude can naturally influence the overall cosmological constraints more. It is more challenging to lower the dispersion in the individual time-delay measurements. Using a consistent methodology for all the RM QSOs to infer time-delays will be necessary to avoid systematic errors introduced by combining different subsets of RM sources into one large dataset. Specifically, surveys and RM projects typically select sources in a narrow luminosity range, which can result in a problem. For instance, if the time-delay method used for higher-luminosity sources is systematically susceptible to yield smaller lags in comparison with the method used for lower-luminosity sources, it can lead to a systematically smaller slope of the R-L relation compared to the case when the same method is applied to all the sources across several orders of magnitude in luminosity.
7 Conclusions
In this paper, for the first time, we use 38 highest-quality C iv QSO data to simultaneously constrain cosmological model parameters, in six cosmological models, and C iv relation parameters. We use a new technique we have developed to more correctly take into account the asymmetric time-lag error bars and applied it to both C iv and Mg ii QSO data (Khadka et al., 2021a) for the first time. We find that similar to Mg ii QSO data, C iv QSO data are also standardizable through the relation since the C iv relation parameters are cosmological model-independent. Unlike the H QSOs cosmological constraints (Khadka et al., 2022a), those from C iv and Mg ii QSO data are consistent with cosmological constraints from better established + BAO data.
The mutually consistent cosmological parameter constraints from C iv, Mg ii, and + BAO data allow us to perform joint analyses on C iv + Mg ii data as well as on + BAO + C iv + Mg ii data. Although the joint C iv + Mg ii cosmological constraints are still weak, they do slightly ( at most) alter the + BAO constraints when jointly analyzed.
The Rubin Observatory Legacy Survey of Space and Time (Ivezić et al., 2019), as well as the SDSS-V Black Hole Mapper (Kollmeier et al., 2017), will find many more C iv and Mg ii QSOs. These new QSOs will result in significantly more restrictive C iv (and Mg ii) cosmological constraints than the first ones we have derived here.
| Model | Data set | /a | b | AIC | BIC | DIC | ||||||||||||||
|---|---|---|---|---|---|---|---|---|---|---|---|---|---|---|---|---|---|---|---|---|
| + BAO | 0.0244 | 0.1181 | 0.301 | – | – | 68.98 | – | – | – | – | – | – | 25.64 | 31.64 | 36.99 | 32.32 | 0.00 | 0.00 | 0.00 | |
| Mg ii QSO symm | – | 0.0518 | 0.157 | – | – | – | – | – | – | 0.282 | 0.285 | 1.670 | 30.16 | 38.16 | 47.59 | 37.68 | 0.00 | 0.00 | 0.00 | |
| Flat | Mg ii QSO asymm | – | 0.0472 | 0.148 | – | – | – | – | – | – | 0.278 | 0.282 | 1.676 | 30.18 | 38.18 | 47.61 | 37.86 | 0.00 | 0.00 | 0.00 |
| CDM | C iv QSO symm | – | 0.050 | – | – | – | 0.275 | 0.403 | 0.989 | – | – | – | 20.61 | 28.61 | 35.16 | 31.10 | 0.00 | 0.00 | 0.00 | |
| C iv QSO asymm | – | 0.046 | – | – | – | 0.265 | 0.411 | 0.980 | – | – | – | 20.51 | 28.51 | 35.06 | 32.74 | 0.00 | 0.00 | 0.00 | ||
| C iv QSO asymm + Mg ii QSO asymm | – | 0.0082 | 0.068 | – | – | – | 0.274 | 0.412 | 0.995 | 0.280 | 0.286 | 1.647 | 50.94 | 64.94 | 84.21 | 69.10 | 0.00 | 0.00 | 0.00 | |
| + BAO + C iv QSO asymm + Mg ii QSO asymm | 0.0245 | 0.1148 | 0.295 | – | – | 68.86 | 0.284 | 0.421 | 1.079 | 0.279 | 0.288 | 1.688 | 78.31 | 96.31 | 123.98 | 98.13 | 0.00 | 0.00 | 0.00 | |
| + BAO | 0.0260 | 0.1098 | 0.292 | 0.048 | – | 68.35 | – | – | – | – | – | – | 25.30 | 33.30 | 40.43 | 33.87 | 1.66 | 3.44 | 1.54 | |
| Mg ii QSO symm | – | 0.1703 | 0.399 | – | – | – | – | – | 0.275 | 0.352 | 1.625 | 25.39 | 35.39 | 47.17 | 40.12 | 2.44 | ||||
| Non-flat | Mg ii QSO asymm | – | 0.1708 | 0.400 | – | – | – | – | – | 0.270 | 0.349 | 1.635 | 25.62 | 35.62 | 47.40 | 40.25 | 2.38 | |||
| CDM | C iv QSO symm | – | 0.0147 | 0.081 | – | – | 0.237 | 0.486 | 0.968 | – | – | – | 9.38 | 19.38 | 27.57 | 36.94 | 5.84 | |||
| C iv QSO asymm | – | 0.0378 | 0.128 | – | – | 0.242 | 0.498 | 0.939 | – | – | – | 14.44 | 24.44 | 32.63 | 36.77 | 4.03 | ||||
| C iv QSO asymm + Mg ii QSO asymm | – | 0.0791 | 0.213 | – | – | 0.269 | 0.512 | 1.018 | 0.279 | 0.293 | 1.642 | 42.92 | 58.92 | 80.95 | 68.83 | |||||
| + BAO + C iv QSO asymm + Mg ii QSO asymm | 0.0260 | 0.1112 | 0.293 | 0.036 | – | 68.64 | 0.278 | 0.430 | 1.045 | 0.278 | 0.293 | 1.684 | 78.09 | 98.09 | 128.84 | 99.73 | 1.79 | 4.86 | 1.60 | |
| + BAO | 0.0296 | 0.0951 | 0.290 | – | 65.79 | – | – | – | – | – | – | 22.39 | 30.39 | 37.52 | 30.63 | 0.53 | ||||
| Mg ii QSO symm | – | 0.003 | – | – | – | – | – | 0.270 | 0.241 | 1.354 | 24.39 | 34.39 | 46.18 | 41.19 | 3.51 | |||||
| Flat | Mg ii QSO asymm | – | 0.005 | – | – | – | – | – | 0.267 | 0.249 | 1.361 | 24.35 | 34.35 | 46.13 | 41.14 | 3.28 | ||||
| XCDM | C iv QSO symm | – | 0.003 | – | – | 0.234 | 0.321 | 0.727 | – | – | – | 12.69 | 22.69 | 30.88 | 31.64 | 0.53 | ||||
| C iv QSO asymm | – | 0.010 | – | – | 0.232 | 0.355 | 0.736 | – | – | – | 15.58 | 25.58 | 33.77 | 33.67 | 0.93 | |||||
| C iv QSO asymm + Mg ii QSO asymm | – | 0.008 | – | – | 0.225 | 0.337 | 0.757 | 0.262 | 0.248 | 1.399 | 40.24 | 56.24 | 78.27 | 66.94 | ||||||
| + BAO + C iv QSO asymm + Mg ii QSO asymm | 0.0283 | 0.1007 | 0.297 | – | 66.05 | 0.283 | 0.425 | 1.074 | 0.279 | 0.286 | 1.691 | 75.85 | 95.85 | 126.60 | 97.19 | 2.62 | ||||
| + BAO | 0.0289 | 0.0985 | 0.296 | 65.76 | – | – | – | – | – | – | 22.13 | 32.13 | 41.05 | 32.51 | 0.49 | 4.06 | 0.19 | |||
| Mg ii QSO symm | – | 0.030 | – | – | – | – | 0.257 | 0.284 | 1.382 | 18.29 | 30.29 | 44.43 | 46.23 | 8.54 | ||||||
| Non-flat | Mg ii QSO asymm | – | 0.048 | – | – | – | – | 0.260 | 0.303 | 1.395 | 19.66 | 31.66 | 45.80 | 45.06 | 7.19 | |||||
| XCDM | C iv QSO symm | – | 0.019 | – | 0.220 | 0.428 | 0.827 | – | – | – | 6.26 | 18.26 | 28.09 | 38.74 | 7.64 | |||||
| C iv QSO asymm | – | 0.025 | – | 0.228 | 0.386 | 0.828 | – | – | – | 12.08 | 24.08 | 33.90 | 37.86 | 5.12 | ||||||
| C iv QSO asymm + Mg ii QSO asymm | – | 0.021 | – | 0.226 | 0.374 | 0.808 | 0.270 | 0.285 | 1.262 | 32.43 | 50.43 | 75.21 | 68.46 | |||||||
| + BAO + C iv QSO asymm + Mg ii QSO asymm | 0.0281 | 0.1046 | 0.296 | 67.10 | 0.276 | 0.434 | 1.064 | 0.274 | 0.298 | 1.676 | 75.81 | 97.81 | 131.64 | 98.92 | 1.51 | 7.66 | 0.79 | |||
| + BAO | 0.0310 | 0.0900 | 0.280 | – | 1.010 | 65.89 | – | – | – | – | – | – | 22.31 | 30.31 | 37.45 | 29.90 | 0.46 | |||
| Mg ii QSO symm | – | 0.0414 | 0.136 | – | 0.018 | – | – | – | – | 0.282 | 0.282 | 1.668 | 30.17 | 40.17 | 51.96 | 38.18 | 2.01 | 4.37 | 0.50 | |
| Flat | Mg ii QSO asymm | – | 0.0532 | 0.160 | – | 0.047 | – | – | – | – | 0.279 | 0.284 | 1.679 | 30.20 | 40.20 | 51.99 | 38.40 | 2.02 | 4.38 | 0.52 |
| CDM | C iv QSO symm | – | 0.0003 | 0.052 | – | 0.030 | – | 0.274 | 0.399 | 0.996 | – | – | – | 20.67 | 30.67 | 38.85 | 33.47 | 2.05 | 3.69 | 2.37 |
| C iv QSO asymm | – | 0.039 | – | 0.061 | – | 0.270 | 0.410 | 0.977 | – | – | – | 20.59 | 30.59 | 38.78 | 34.56 | 2.08 | 3.72 | 1.82 | ||
| C iv QSO asymm + Mg ii QSO asymm | – | 0.035 | – | 0.014 | – | 0.263 | 0.399 | 0.984 | 0.283 | 0.265 | 1.662 | 51.19 | 67.19 | 89.21 | 72.04 | 2.25 | 5.00 | 2.94 | ||
| + BAO + C iv QSO asymm + Mg ii QSO asymm | 0.0289 | 0.0985 | 0.288 | – | 0.663 | 66.68 | 0.275 | 0.430 | 1.050 | 0.278 | 0.304 | 1.668 | 75.78 | 95.78 | 126.54 | 96.48 | 2.55 | |||
| + BAO | 0.0306 | 0.0920 | 0.284 | 1.200 | 65.91 | – | – | – | – | – | – | 22.05 | 32.05 | 40.97 | 31.30 | 0.41 | 3.98 | |||
| Mg ii QSO symm | – | 0.1167 | 0.290 | 0.000 | – | – | – | – | 0.283 | 0.290 | 1.678 | 29.81 | 41.81 | 55.95 | 38.70 | 3.65 | 8.36 | 1.02 | ||
| Non-flat | Mg ii QSO asymm | – | 0.1354 | 0.328 | 0.042 | – | – | – | – | 0.275 | 0.292 | 1.675 | 29.91 | 41.91 | 56.05 | 38.65 | 3.73 | 8.45 | 0.78 | |
| CDM | C iv QSO symm | – | 0.0489 | 0.151 | 0.065 | – | 0.272 | 0.417 | 1.010 | – | – | – | 20.42 | 32.42 | 42.24 | 34.07 | 3.80 | 7.08 | 2.96 | |
| C iv QSO asymm | – | 0.0367 | 0.126 | 0.121 | – | 0.268 | 0.423 | 1.006 | – | – | – | 20.41 | 32.41 | 42.24 | 34.92 | 3.91 | 7.18 | 2.18 | ||
| C iv QSO asymm + Mg ii QSO asymm | – | 0.0611 | 0.176 | 0.115 | – | 0.264 | 0.421 | 1.034 | 0.271 | 0.289 | 1.659 | 50.74 | 68.74 | 93.52 | 72.86 | 3.80 | 9.31 | 3.76 | ||
| + BAO + C iv QSO asymm + Mg ii QSO asymm | 0.0313 | 0.0882 | 0.278 | 1.256 | 65.76 | 0.281 | 0.455 | 1.035 | 0.276 | 0.292 | 1.687 | 75.73 | 97.73 | 131.55 | 97.61 | 1.42 | 7.57 |
-
a
corresponds to flat/non-flat XCDM and corresponds to flat/non-flat CDM.
-
b
. and are set to be 0.05 and 70 , respectively.
| Model | Data set | /a | b | ||||||||||
|---|---|---|---|---|---|---|---|---|---|---|---|---|---|
| + BAO | – | – | – | – | – | – | – | – | |||||
| Mg ii QSO symm | – | – | – | – | – | – | – | – | |||||
| Flat | Mg ii QSO asymm | – | – | – | – | – | – | – | – | ||||
| CDM | C iv QSO symm | – | – | c | – | – | – | – | – | – | |||
| C iv QSO asymm | – | – | c | – | – | – | – | – | – | ||||
| C iv QSO asymm + Mg ii QSO asymm | – | – | c | – | – | – | |||||||
| + BAO + C iv QSO asymm + Mg ii QSO asymm | – | – | |||||||||||
| + BAO | – | – | – | – | – | – | – | ||||||
| Mg ii QSO symm | – | – | – | – | – | – | – | ||||||
| Non-flat | Mg ii QSO asymm | – | – | – | – | – | – | – | |||||
| CDM | C iv QSO symm | – | – | – | – | – | – | – | |||||
| C iv QSO asymm | – | – | – | – | – | – | – | ||||||
| C iv QSO asymm + Mg ii QSO asymm | – | – | – | – | |||||||||
| + BAO + C iv QSO asymm + Mg ii QSO asymm | – | ||||||||||||
| + BAO | – | – | – | – | – | – | – | ||||||
| Mg ii QSO symm | – | – | c | – | – | – | – | – | |||||
| Flat | Mg ii QSO asymm | – | – | c | – | – | – | – | – | ||||
| XCDM | C iv QSO symm | – | – | – | – | – | – | – | |||||
| C iv QSO asymm | – | – | – | – | – | – | – | ||||||
| C iv QSO asymm + Mg ii QSO asymm | – | – | – | – | |||||||||
| + BAO + C iv QSO asymm + Mg ii QSO asymm | – | ||||||||||||
| + BAO | – | – | – | – | – | – | |||||||
| Mg ii QSO symm | – | – | – | – | – | – | |||||||
| Mg ii QSO asymm | – | – | – | – | – | – | |||||||
| Non-flat | C iv QSO symm | – | – | – | – | – | – | ||||||
| XCDM | C iv QSO asymm | – | – | – | – | – | – | ||||||
| C iv QSO asymm + Mg ii QSO asymm | – | – | – | ||||||||||
| + BAO + C iv QSO asymm + Mg ii QSO asymm | |||||||||||||
| + BAO | – | – | – | – | – | – | – | ||||||
| Mg ii QSO symm | – | – | – | – | – | – | – | – | – | ||||
| Flat | Mg ii QSO asymm | – | – | – | – | – | – | – | – | – | |||
| CDM | C iv QSO symm | – | – | c | – | c | – | – | – | – | |||
| C iv QSO asymm | – | – | c | – | – | – | – | – | – | ||||
| C iv QSO asymm + Mg ii QSO asymm | – | – | c | – | c | – | |||||||
| + BAO + C iv QSO asymm + Mg ii QSO asymm | – | ||||||||||||
| + BAO | – | – | – | – | – | – | |||||||
| Mg ii QSO symm | – | – | – | – | – | – | – | ||||||
| Non-flat | Mg ii QSO asymm | – | – | – | – | – | – | – | |||||
| CDM | C iv QSO symm | – | – | c | – | – | – | – | – | ||||
| C iv QSO asymm | – | – | – | – | – | – | |||||||
| C iv QSO asymm + Mg ii QSO asymm | – | – | c | c | – | ||||||||
| + BAO + C iv QSO asymm + Mg ii QSO asymm |
-
a
corresponds to flat/non-flat XCDM and corresponds to flat/non-flat CDM.
-
b
. and are set to be 0.05 and 70 , respectively.
-
c
This is the 1 limit. The 2 limit is set by the prior and not shown here.
Acknowledgements
This research was supported in part by US DOE grant DE-SC0011840, by the Polish Funding Agency National Science Centre, project 2017/26/A/ST9/00756 (Maestro 9), by GAČR EXPRO grant 21-13491X, by Millenium Nucleus NCN (TITANs), and by the Conselho Nacional de Desenvolvimento Científico e Tecnológico (CNPq) Fellowship (164753/2020-6). The authors acknowledge the Czech-Polish mobility program (MŠMT 8J20PL037 and PPN/BCZ/2019/1/00069). Part of the computation for this project was performed on the Beocat Research Cluster at Kansas State University.
Data Availability
The data analysed in this article are listed in Table LABEL:tab:civdata of this paper and in table A1 of Khadka et al. (2021a).
References
- Abdalla et al. (2022) Abdalla E., et al., 2022, J. High En. Astrophys., 34, 49
- Arjona & Nesseris (2021) Arjona R., Nesseris S., 2021, Phys. Rev. D, 103, 103539
- Audren et al. (2013) Audren B., Lesgourgues J., Benabed K., Prunet S., 2013, J. Cosmology Astropart. Phys., 2013, 001
- Baskin & Laor (2005) Baskin A., Laor A., 2005, MNRAS, 356, 1029
- Bentz et al. (2013) Bentz M. C., et al., 2013, ApJ, 767, 149
- Blas et al. (2011) Blas D., Lesgourgues J., Tram T., 2011, J. Cosmology Astropart. Phys., 2011, 034
- Brandt et al. (2018) Brandt W. N., et al., 2018, preprint, (arXiv:1811.06542)
- Brinckmann & Lesgourgues (2019) Brinckmann T., Lesgourgues J., 2019, Physics of the Dark Universe, 24, 100260
- Britzen et al. (2021) Britzen S., et al., 2021, MNRAS, 503, 3145
- Cao & Ratra (2022) Cao S., Ratra B., 2022, MNRAS, 513, 5686
- Cao et al. (2017) Cao S., Biesiada M., Jackson J., Zheng X., Zhao Y., Zhu Z.-H., 2017, J. Cosmology Astropart. Phys., 2, 012
- Cao et al. (2020) Cao S., Ryan J., Ratra B., 2020, MNRAS, 497, 3191
- Cao et al. (2021a) Cao S., Ryan J., Khadka N., Ratra B., 2021a, MNRAS, 501, 1520
- Cao et al. (2021b) Cao S., Ryan J., Ratra B., 2021b, MNRAS, 504, 300
- Cao et al. (2022a) Cao S., Dainotti M., Ratra B., 2022a, preprint, (arXiv:2204.08710)
- Cao et al. (2022b) Cao S., Ryan J., Ratra B., 2022b, MNRAS, 509, 4745
- Cao et al. (2022c) Cao S., Khadka N., Ratra B., 2022c, MNRAS, 510, 2928
- Cao et al. (2022d) Cao S., Dainotti M., Ratra B., 2022d, MNRAS, 512, 439
- Chávez et al. (2014) Chávez R., Terlevich R., Terlevich E., Bresolin F., Melnick J., Plionis M., Basilakos S., 2014, MNRAS, 442, 3565
- Chen & Ratra (2011) Chen G., Ratra B., 2011, PASP, 123, 1127
- Chen et al. (2016) Chen Y., Ratra B., Biesiada M., Li S., Zhu Z.-H., 2016, ApJ, 829, 61
- Coatman et al. (2017) Coatman L., Hewett P. C., Banerji M., Richards G. T., Hennawi J. F., Prochaska J. X., 2017, MNRAS, 465, 2120
- Colgáin et al. (2022) Colgáin E. O., Sheikh-Jabbari M. M., Solomon R., Bargiacchi G., Capozziello S., Dainotti M. G., Stojkovic D., 2022, Phys. Rev. D, 106, L041301
- Collin-Souffrin et al. (1988) Collin-Souffrin S., Dyson J. E., McDowell J. C., Perry J. J., 1988, MNRAS, 232, 539
- Czerny & Hryniewicz (2011) Czerny B., Hryniewicz K., 2011, A&A, 525, L8
- Czerny et al. (2021) Czerny B., et al., 2021, Acta Physica Polonica A, 139, 389
- D’Agostini (2005) D’Agostini G., 2005, preprint, (arXiv:physics/0511182)
- DES Collaboration (2019) DES Collaboration 2019, Phys. Rev. D, 99, 123505
- Dainotti et al. (2022a) Dainotti M. G., Nielson V., Sarracino G., Rinaldi E., Nagataki S., Capozziello S., Gnedin O. Y., Bargiacchi G., 2022a, MNRAS, 514, 1828
- Dainotti et al. (2022b) Dainotti M. G., Bargiacchi G., Lenart A. Ł., Capozziello S., Ó Colgáin E., Solomon R., Stojkovic D., Sheikh-Jabbari M. M., 2022b, ApJ, 931, 106
- De Cicco et al. (2022) De Cicco D., et al., 2022, preprint, (arXiv:2205.12275)
- De Rosa et al. (2015) De Rosa G., et al., 2015, ApJ, 806, 128
- de Cruz Perez et al. (2021) de Cruz Perez J., Sola Peracaula J., Gomez-Valent A., Moreno-Pulido C., 2021, preprint, (arXiv:2110.07569)
- Demianski et al. (2021) Demianski M., Piedipalumbo E., Sawant D., Amati L., 2021, MNRAS, 506, 903
- Dhawan et al. (2021) Dhawan S., Alsing J., Vagnozzi S., 2021, MNRAS, 506, L1
- Di Valentino et al. (2021a) Di Valentino E., et al., 2021a, Classical and Quantum Gravity, 38, 153001
- Di Valentino et al. (2021b) Di Valentino E., Melchiorri A., Silk J., 2021b, ApJ, 908, L9
- eBOSS Collaboration (2021) eBOSS Collaboration 2021, Phys. Rev. D, 103, 083533
- Eckart et al. (2017) Eckart A., et al., 2017, Foundations of Physics, 47, 553
- Efstathiou & Gratton (2020) Efstathiou G., Gratton S., 2020, MNRAS, 496, L91
- Fana Dirirsa et al. (2019) Fana Dirirsa F., et al., 2019, ApJ, 887, 13
- Ferland et al. (2020) Ferland G. J., Done C., Jin C., Landt H., Ward M. J., 2020, MNRAS, 494, 5917
- Fonseca Alvarez et al. (2020) Fonseca Alvarez G., et al., 2020, ApJ, 899, 73
- Geng et al. (2022) Geng C.-Q., Hsu Y.-T., Lu J.-R., 2022, ApJ, 926, 74
- Glanville et al. (2022) Glanville A., Howlett C., Davis T. M., 2022, preprint, (arXiv:2205.05892)
- González-Morán et al. (2021) González-Morán A. L., et al., 2021, MNRAS, 505, 1441
- Grier et al. (2019) Grier C. J., et al., 2019, ApJ, 887, 38
- Handley (2019) Handley W., 2019, Phys. Rev. D, 100, 123517
- Homayouni et al. (2020) Homayouni Y., et al., 2020, ApJ, 901, 55
- Hoormann et al. (2019) Hoormann J. K., et al., 2019, MNRAS, 487, 3650
- Hu et al. (2021) Hu J. P., Wang F. Y., Dai Z. G., 2021, MNRAS, 507, 730
- Ivezić et al. (2019) Ivezić Ž., et al., 2019, ApJ, 873, 111
- Jesus et al. (2021) Jesus J. F., Valentim R., Escobal A. A., Pereira S. H., Benndorf D., 2021, preprint, (arXiv:2112.09722)
- Johnson et al. (2022) Johnson J. P., Sangwan A., Shankaranarayanan S., 2022, J. Cosmology Astropart. Phys., 2022, 024
- Karas et al. (2021) Karas V., Svoboda J., Zajaček M., 2021, in RAGtime: Workshops on black holes and netron stars. p. E1 (arXiv:1901.06507)
- Kaspi et al. (2007) Kaspi S., Brandt W. N., Maoz D., Netzer H., Schneider D. P., Shemmer O., 2007, ApJ, 659, 997
- Kaspi et al. (2021) Kaspi S., Brandt W. N., Maoz D., Netzer H., Schneider D. P., Shemmer O., Grier C. J., 2021, ApJ, 915, 129
- Khadka & Ratra (2020a) Khadka N., Ratra B., 2020a, MNRAS, 492, 4456
- Khadka & Ratra (2020b) Khadka N., Ratra B., 2020b, MNRAS, 497, 263
- Khadka & Ratra (2020c) Khadka N., Ratra B., 2020c, MNRAS, 499, 391
- Khadka & Ratra (2021) Khadka N., Ratra B., 2021, MNRAS, 502, 6140
- Khadka & Ratra (2022) Khadka N., Ratra B., 2022, MNRAS, 510, 2753
- Khadka et al. (2021a) Khadka N., Yu Z., Zajaček M., Martinez-Aldama M. L., Czerny B., Ratra B., 2021a, MNRAS, 508, 4722
- Khadka et al. (2021b) Khadka N., Luongo O., Muccino M., Ratra B., 2021b, J. Cosmology Astropart. Phys., 2021, 042
- Khadka et al. (2022a) Khadka N., Martínez-Aldama M. L., Zajaček M., Czerny B., Ratra B., 2022a, MNRAS, 513, 1985
- Khadka et al. (2022b) Khadka N., Zajaček M., Panda S., Martínez-Aldama M. L., Ratra B., 2022b, MNRAS, 515, 3729
- KiDS Collaboration (2021) KiDS Collaboration 2021, A&A, 649, A88
- Kollmeier et al. (2017) Kollmeier J. A., et al., 2017, preprint, (arXiv:1711.03234)
- Kovačević et al. (2022) Kovačević A., et al., 2022, The LSST era of supermassive black holes accretion-disk reverberation mapping, ApJS Focus Issue (submitted)
- Leizerovich et al. (2022) Leizerovich M., Kraiselburd L., Landau S., Scóccola C. G., 2022, Phys. Rev. D, 105, 103526
- Lewis (2019) Lewis A., 2019, preprint, (arXiv:1910.13970)
- Li et al. (2020) Li E.-K., Du M., Xu L., 2020, MNRAS, 491, 4960
- Lian et al. (2021) Lian Y., Cao S., Biesiada M., Chen Y., Zhang Y., Guo W., 2021, MNRAS, 505, 2111
- Liddle (2007) Liddle A. R., 2007, MNRAS, 377, L74
- Lira et al. (2018) Lira P., et al., 2018, ApJ, 865, 56
- Liu et al. (2022) Liu Y., Chen F., Liang N., Yuan Z., Yu H., Wu P., 2022, ApJ, 931, 50
- Luongo & Muccino (2021) Luongo O., Muccino M., 2021, Galaxies, 9, 77
- Luongo et al. (2022) Luongo O., Muccino M., Colgáin E. O., Sheikh-Jabbari M. M., Yin L., 2022, Phys. Rev. D, 105, 103510
- Lusso et al. (2020) Lusso E., et al., 2020, A&A, 642, A150
- Mania & Ratra (2012) Mania D., Ratra B., 2012, Physics Letters B, 715, 9
- Martínez-Aldama et al. (2018) Martínez-Aldama M. L., del Olmo A., Marziani P., Sulentic J. W., Negrete C. A., Dultzin D., D’Onofrio M., Perea J., 2018, A&A, 618, A179
- Martínez-Aldama et al. (2019) Martínez-Aldama M. L., Czerny B., Kawka D., Karas V., Panda S., Zajaček M., Życki P. T., 2019, ApJ, 883, 170
- Martinez Aldama et al. (2020a) Martinez Aldama M. L., Panda S., Czerny B., Zajacek M., LSST AGN SC Collaboration 2020a, in Multifrequency Behaviour of High Energy Cosmic Sources - XIII. 3-8 June 2019. Palermo. p. 10 (arXiv:1910.02725)
- Martínez-Aldama et al. (2020b) Martínez-Aldama M. L., Zajaček M., Czerny B., Panda S., 2020b, ApJ, 903, 86
- Mehrabi et al. (2022) Mehrabi A., et al., 2022, MNRAS, 509, 224
- Mejía-Restrepo et al. (2018) Mejía-Restrepo J. E., Lira P., Netzer H., Trakhtenbrot B., Capellupo D. M., 2018, Nature Astronomy, 2, 63
- Metzroth et al. (2006) Metzroth K. G., Onken C. A., Peterson B. M., 2006, ApJ, 647, 901
- Mukherjee & Banerjee (2022) Mukherjee P., Banerjee N., 2022, Phys. Rev. D, 105, 063516
- Müller et al. (2022) Müller A. L., Naddaf M.-H., Zajaček M., Czerny B., Araudo A., Karas V., 2022, ApJ, 931, 39
- Naddaf & Czerny (2022) Naddaf M. H., Czerny B., 2022, A&A, 663, A77
- Naddaf et al. (2021) Naddaf M.-H., Czerny B., Szczerba R., 2021, ApJ, 920, 30
- Netzer (2019) Netzer H., 2019, MNRAS, 488, 5185
- Ooba et al. (2018a) Ooba J., Ratra B., Sugiyama N., 2018a, ApJ, 864, 80
- Ooba et al. (2018b) Ooba J., Ratra B., Sugiyama N., 2018b, ApJ, 866, 68
- Ooba et al. (2018c) Ooba J., Ratra B., Sugiyama N., 2018c, ApJ, 869, 34
- Ooba et al. (2019) Ooba J., Ratra B., Sugiyama N., 2019, Ap&SS, 364, 176
- Panda (2022) Panda S., 2022, Frontiers in Astronomy and Space Sciences, 9, 850409
- Panda et al. (2019a) Panda S., Martínez-Aldama M. L., Zajaček M., 2019a, Frontiers in Astronomy and Space Sciences, 6, 75
- Panda et al. (2019b) Panda S., Marziani P., Czerny B., 2019b, ApJ, 882, 79
- Park & Ratra (2018) Park C.-G., Ratra B., 2018, ApJ, 868, 83
- Park & Ratra (2019a) Park C.-G., Ratra B., 2019a, Ap&SS, 364, 82
- Park & Ratra (2019b) Park C.-G., Ratra B., 2019b, Ap&SS, 364, 134
- Park & Ratra (2019c) Park C.-G., Ratra B., 2019c, ApJ, 882, 158
- Park & Ratra (2020) Park C.-G., Ratra B., 2020, Phys. Rev. D, 101, 083508
- Pavlov et al. (2013) Pavlov A., Westmoreland S., Saaidi K., Ratra B., 2013, Phys. Rev. D, 88, 123513
- Peebles (1984) Peebles P. J. E., 1984, ApJ, 284, 439
- Peebles & Ratra (1988) Peebles P. J. E., Ratra B., 1988, ApJ, 325, L17
- Penton et al. (2022) Penton A., et al., 2022, MNRAS, 509, 4008
- Perivolaropoulos & Skara (2022) Perivolaropoulos L., Skara F., 2022, New Astron. Rev., 95, 101659
- Peterson et al. (2005) Peterson B. M., et al., 2005, ApJ, 632, 799
- Peterson et al. (2006) Peterson B. M., et al., 2006, ApJ, 641, 638
- Planck Collaboration (2020) Planck Collaboration 2020, A&A, 641, A6
- Prince et al. (2022) Prince R., et al., 2022, preprint, (arXiv:2201.11062)
- Rakshit (2020) Rakshit S., 2020, A&A, 642, A59
- Rana et al. (2017) Rana A., Jain D., Mahajan S., Mukherjee A., 2017, J. Cosmology Astropart. Phys., 2017, 028
- Ratra & Peebles (1988) Ratra B., Peebles P. J. E., 1988, Phys. Rev. D, 37, 3406
- Renzi et al. (2022) Renzi F., Hogg N. B., Giarè W., 2022, Mon. Not. Roy. Astron. Soc., 513, 4004
- Rezaei et al. (2022) Rezaei M., Solà Peracaula J., Malekjani M., 2022, MNRAS, 509, 2593
- Riess et al. (2021) Riess A. G., Casertano S., Yuan W., Bowers J. B., Macri L., Zinn J. C., Scolnic D., 2021, ApJ, 908, L6
- Risaliti & Lusso (2015) Risaliti G., Lusso E., 2015, ApJ, 815, 33
- Risaliti & Lusso (2019) Risaliti G., Lusso E., 2019, Nature Astronomy, 3, 272
- Ryan et al. (2019) Ryan J., Chen Y., Ratra B., 2019, MNRAS, 488, 3844
- Scolnic et al. (2018) Scolnic D. M., et al., 2018, ApJ, 859, 101
- Shen et al. (2019) Shen Y., et al., 2019, ApJ, 883, L14
- Singh et al. (2019) Singh A., Sangwan A., Jassal H. K., 2019, J. Cosmology Astropart. Phys., 2019, 047
- Sinha & Banerjee (2021) Sinha S., Banerjee N., 2021, J. Cosmology Astropart. Phys., 2021, 060
- Solà Peracaula et al. (2019) Solà Peracaula J., Gómez-Valent A., de Cruz Pérez J., 2019, Physics of the Dark Universe, 25, 100311
- Spiegelhalter et al. (2002) Spiegelhalter D., Best N., Carlin B., Van Der Linde A., 2002, Journal of the Royal Statistical Society. Series B: Statistical Methodology, 64, 583
- Starkey et al. (2016) Starkey D. A., Horne K., Villforth C., 2016, MNRAS, 456, 1960
- Ureña-López & Roy (2020) Ureña-López L. A., Roy N., 2020, Phys. Rev. D, 102, 063510
- Vagnozzi et al. (2021a) Vagnozzi S., Di Valentino E., Gariazzo S., Melchiorri A., Mena O., Silk J., 2021a, Physics of the Dark Universe, 33, 100851
- Vagnozzi et al. (2021b) Vagnozzi S., Loeb A., Moresco M., 2021b, ApJ, 908, 84
- Wang et al. (2016) Wang J. S., Wang F. Y., Cheng K. S., Dai Z. G., 2016, A&A, 585, A68
- Wang et al. (2022) Wang F. Y., Hu J. P., Zhang G. Q., Dai Z. G., 2022, ApJ, 924, 97
- Wei & Melia (2022) Wei J.-J., Melia F., 2022, ApJ, 928, 165
- Xu et al. (2022) Xu T., Chen Y., Xu L., Cao S., 2022, Phys. Dark Univ., 36, 101023
- Yu et al. (2018) Yu H., Ratra B., Wang F.-Y., 2018, ApJ, 856, 3
- Zajaček et al. (2014) Zajaček M., Karas V., Eckart A., 2014, A&A, 565, A17
- Zajaček et al. (2019) Zajaček M., Czerny B., Martínez-Aldama M. L., Karas V., 2019, Astronomische Nachrichten, 340, 577
- Zajaček et al. (2020a) Zajaček M., et al., 2020a, ApJ, 896, 146
- Zajaček et al. (2020b) Zajaček M., Araudo A., Karas V., Czerny B., Eckart A., 2020b, ApJ, 903, 140
- Zajaček et al. (2021) Zajaček M., et al., 2021, ApJ, 912, 10
- Zhai et al. (2017) Zhai Z., Blanton M., Slosar A., Tinker J., 2017, ApJ, 850, 183
- Zhao & Xia (2021) Zhao D., Xia J.-Q., 2021, European Physical Journal C, 81, 694
- Zheng et al. (2021) Zheng X., Cao S., Biesiada M., Li X., Liu T., Liu Y., 2021, Science China Physics, Mechanics, and Astronomy, 64, 259511
- Zu et al. (2011) Zu Y., Kochanek C. S., Peterson B. M., 2011, ApJ, 735, 80
Appendix A Golden sample of C iv QSO data
| Object | (days) | Reference | |||
|---|---|---|---|---|---|
| NGC 4395 | 0.001064 | Peterson et al. (2005, 2006) | |||
| NGC 3783 | 0.00973 | Peterson et al. (2005, 2006) | |||
| NGC 7469 | 0.01632 | Peterson et al. (2005, 2006) | |||
| 3C 390.3 | 0.0561 | Peterson et al. (2005, 2006) | |||
| NGC 4151 | 0.00332 | Metzroth et al. (2006) | |||
| NGC 5548 | 0.01676 | De Rosa et al. (2015) | |||
| CTS 286 | 2.551 | Lira et al. (2018) | |||
| CTS 406 | 3.178 | Lira et al. (2018) | |||
| CTS 564 | 2.653 | Lira et al. (2018) | |||
| CTS 650 | 2.659 | Lira et al. (2018) | |||
| CTS 953 | 2.526 | Lira et al. (2018) | |||
| CTS 1061 | 3.368 | Lira et al. (2018) | |||
| J 214355 | 2.607 | Lira et al. (2018) | |||
| J 221516 | 2.709 | Lira et al. (2018) | |||
| DES J0228-04 | 1.905 | Hoormann et al. (2019) | |||
| DES J0033-42 | 2.593 | Hoormann et al. (2019) | |||
| RMID 032 | 1.715 | Grier et al. (2019) | |||
| RMID 052 | 2.305 | Grier et al. (2019) | |||
| RMID 181 | 1.675 | Grier et al. (2019) | |||
| RMID 249 | 1.717 | Grier et al. (2019) | |||
| RMID 256 | 2.244 | Grier et al. (2019) | |||
| RMID 275 | 1.577 | Grier et al. (2019) | |||
| RMID 298 | 1.635 | Grier et al. (2019) | |||
| RMID 312 | 1.924 | Grier et al. (2019) | |||
| RMID 332 | 2.581 | Grier et al. (2019) | |||
| RMID 387 | 2.426 | Grier et al. (2019) | |||
| RMID 401 | 1.822 | Grier et al. (2019) | |||
| RMID 418 | 1.418 | Grier et al. (2019) | |||
| RMID 470 | 1.879 | Grier et al. (2019) | |||
| RMID 527 | 1.647 | Grier et al. (2019) | |||
| RMID 549 | 2.275 | Grier et al. (2019) | |||
| RMID 734 | 2.332 | Grier et al. (2019) | |||
| RMID 363 | 2.635 | Shen et al. (2019) | |||
| RMID 372 | 1.745 | Shen et al. (2019) | |||
| RMID 651 | 1.486 | Shen et al. (2019) | |||
| S5 0836+71 | 2.172 | Kaspi et al. (2021) | |||
| SBS 1116+603 | 2.646 | Kaspi et al. (2021) | |||
| SBS 1425+606 | 3.192 | Kaspi et al. (2021) |