Local spiral structure traced by Red Clump stars
Abstract
Using the cross-matched data of Gaia EDR3 and the 2MASS Point Source Catalog, a sample of RC stars with parallax accuracies better than 20% is identified and used to reveal the nearby spiral pattern traced by old stars. As shown in the overdensity distribution of RC stars, there is an arc-like feature extended from 90∘ to 243∘, which passed close to the Sun. This feature is probably an arm segment traced by old stars, indicating the Galaxy potential in the vicinity of the Sun. By comparing to the spiral arms depicted by young objects, we found that there are considerable offsets between the two different components of Galactic spiral arms. The spiral arm traced by RC stars tends to have a larger pitch angle, hence a more loose wound pattern.
1 Introduction
As observers, we are deeply embedded in the Galactic disc, making it a difficult issue in astronomy to accurately reveal the spiral pattern of the Milky Way and understand its formation and evolution. In comparison to the Milky Way Galaxy, external spiral galaxies which are face on to can be intuitively mapped, studies on which have promoted our understanding of the Galactic spiral structure. It is suggested that there may be two different components of spiral arms for a spiral galaxy (Dobbs & Baba, 2014, and references therein), one component consists of the star formation arms (SF-arms) traced by diffuse or dense interstellar gas, and also young objects (e.g., massive OB stars, Hii regions, young open clusters), the other is composed of a spiral pattern indicated by the potential of old stars (hereafter P-arms throughout this work). Early views suggested that the optical (indicating the SF-arms) and near-infrared (hereafter NIR, indicating the P-arms) morphologies of spiral galaxies were decoupled (e.g. Block & Puerari, 1999). Later on, the Ohio State University (OSU) Bright Spiral Galaxy Survey found a good correlation between the optical and NIR band morphologies for most of their observed spiral galaxies, however, dramatic differences were also noticed in some cases (Eskridge et al., 2002). A simple picture may not be applied to all different types of spiral galaxies. With some understanding of the spiral galaxies, we look back on our own Milky Way. Is there any similarities and/or differences between two different spiral-arm components of the Milky Way through different tracers?
Since the 1950s, much efforts have been devoted to depict the spiral structure of the Milky Way through the distributions or kinematics of OB stars (Morgan et al., 1952, 1953), neutral hydrogen gas (Christiansen & Hindman, 1952; van de Hulst et al., 1954; Oort et al., 1958; Bok, 1959; Levine et al., 2006), and some other kinds of spiral tracers (e.g., Hii regions, CO gas, young open clusters and Cepheid variable stars Skowron et al. (2019); Poggio et al. (2021)), most of which were based on kinematic methods. Until the Bar and Spiral Structure Legacy (BeSSeL) Survey (Reid et al., 2019), which has obtained precise trigonometric parallaxes (Xu et al., 2006) for about 200 high-mass star-forming regions (HMSFRs), the four segments of SF-arms together with the Local Arm and several arm spurs have been depicted. This picture of SF-arms based on HMSFRs was also confirmed or extended by using other young objects with precise parallax measurements, e.g. massive OB stars (Xu et al., 2018, 2021) and young open clusters ( 20 Myr, Hao et al., 2021).
In the meantime, a different morphology for the P-arms of the Milky Way was proposed. The statistics of NIR and far-infrared (FIR) emissions of the Galactic disc indicate a two-armed spiral pattern, i.e. the Scutum-Centaurus Arm and the Perseus Arm (Drimmel, 2000; Drimmel & Spergel, 2001). The other two arms (Sagittarius-Carina and Norma) could perhaps be presented only in gas and young objects, as they were traced only by the FIR emission. Then, the Spitzer/GLIMPSE mid-infrared survey also supports that the Milky Way is a barred, two-armed spiral galaxy (Benjamin et al., 2003, 2005; Churchwell et al., 2009), because a large number of red clump stars detected by GLIMPSE present obvious convergence near the tangential directions of the Scutum-Centaurus Arm, in contrast, the tangential directions corresponding to the Sagittarius-Carina Arm and Norma Arm are indecipherable. Since the past few years, the morphological and kinematic properties of spiral arms traced by stars in the vicinity of the Sun can be explored with the aid of the ESA’s Gaia mission. By using the Gaia second data release (DR2), Miyachi et al. (2019) studied the surface density distribution of a number of turn-off stars. These stars with an age of 1 Gyr exhibit a marginal arm-like overdensity in the Galactic longitude of 90 190∘, which is close to the Local Arm traced by gas and young objects, but with a slightly larger pitch angle. Khoperskov et al. (2020) identified six stellar density structures in a guiding coordinate space based on the Gaia DR2 sources having 6D phase-space coordinates. These structures were interpreted as features related to spiral arms and resonances. Meanwhile, Hunt et al. (2020) presented a different viewpoint. They suggested that the stellar density structures found by Khoperskov et al. (2020) are known kinematic moving groups, rather than spiral arms. Poggio et al. (2021) derived the density distribution of a large number of upper main sequence stars (O, B, and A-type, Poggio et al., 2018), which cover a wide age range. The resulting maps exhibit extended arm-like structures indicating the arm segments in the Solar neighborhood. In addition, Hao et al. (2021) confirmed that the distribution of old open clusters (ages 1 Gyr) in the vicinity of the Sun does not present any obvious arm-like features.
The difference between the SF-arms and P-arms is a fundamental characteristic of the Milky Way, closely related to the formation mechanism of Galactic spiral structure, but still controversial in observation. To resolve this issue, high precision distance measurements for a large number of old stars are necessary. By taking advantage of the latest dataset of Gaia Early Data Release 3 (hereafter Gaia EDR3, Gaia Collaboration et al., 2021), it is now possible to identify a large number of red clump stars with high-precision parallaxes, and depict the nearby P-arms traced by older stars (ages 2 Gyr). In this work, we present the results and compare them with the SF-arms indicated by gas and young objects, aim to better understand the properties of spiral structure in the Milky Way.
2 Sample of red clump stars
In the late evolutionary stage of low mass ( 2.2 M⊙) stars, they will undergo core-helium and shell-hydrogen burning, and evolve to the phase of red clump stars, which have a narrow range of intrinsic luminosities and colors (Girardi, 2016). Red clump (RC) stars account for a large proportion of the cataloged GLIMPSE stars (Churchwell et al., 2009). As discussed in Sect. 1, the observational evidence for the two-armed picture of Galactic P-arms is primarily from the statistics of the surface density of GLIMPSE RC stars as a function of the Galactic longitude (Churchwell et al., 2009). The RC K-giants observed in K-band are always dominated by objects with ages of around 2 Gyr (Salaris, 2012). With a median absolute magnitude = 1.61 mag (Alves, 2000; Cabrera-Lavers et al., 2007) and = 0.5 mag (Gaia Collaboration et al., 2018; Andrae et al., 2018), RC stars within a few kpc of the Sun can be detected by Gaia, even in the presence of interstellar dust extinction, making them excellent tracers for the properties of P-arms in the Solar vicinity.
2.1 Sample selection
The Two Micron All Sky Survey (2MASS, Skrutskie et al., 2006) observed the entire celestial sphere in three NIR bands, i.e. J (1.25 m), H (1.65 m), and KS (2.16 m). The Gaia EDR3 has obtained astrometric parameters for about 1.468 billion stars (Gaia Collaboration et al., 2016, 2021), with a typical parallax uncertainty of 0.020.03 mas for G 15, and 0.07 mas at G17. By combining the astrometric/photometric data of Gaia EDR3 and the NIR photometric data of 2MASS, a large number of RC stars can be identified.
As the first step, we extract the sources by using the official Gaia EDR32MASS cross-match best neighbor table (Marrese et al., in prep.,111https://archives.esac.esa.int/gaia Marrese et al., 2019). For the 2MASS sources in the Point Source Catalog (Skrutskie et al., 2006), only those stars with and band magnitudes brighter than 14 mag are retained in consideration of the sensitivity. Considering the completeness of the cross-matched sample of Gaia EDR32MASS (Bennett & Bovy, 2019), the Gaia sources with G band magnitude brighter than 17 mag are selected. It is also required that the sources should have relative parallax uncertainties / 5, where and are the parallax and its uncertainty without systematic error, respectively. Then, the distance is simply calculated through , and represents the systematic zero point offset of the Gaia EDR3 parallaxes (Lindegren et al., 2021). As we focus on the properties of spiral arms in the Galactic disc, the stars with 0.3 kpc are excluded. Here, is the vertical height.
To derive the color-magnitude diagrams for classifying RC stars, extinction parameters for these sources need to be corrected. In this work, we adopt the extinction parameters corrected with the MWDUST222https://github.com/jobovy/mwdust (Bovy et al., 2016) algorithm, which combines the three dimensional (3D) dust maps of Marshall et al. (2006), Green et al. (2019), and Drimmel et al. (2003). This algorithm can determine the extinction value at a given Galactic longitude, latitude and distance. Besides, the extinction curve with = 3.1 (Cardelli et al., 1989; O’Donnell, 1994) is adopted. Together with the mean wavelengths of 2MASS and bands (Cohen et al., 2003), Gaia , , and bands (Weiler, 2018), we can derive the extinction coefficient relations, they are = 2.5 , = 1.5 , = 7.2 , and = 0.5 . The calculated relation of = 0.5 is well consistent with that of Andrae et al. (2018).
The absolute color and magnitude for a matched Gaia EDR32MASS source can be calculated via:
| (1) | |||
| (2) | |||
| (3) | |||
| (4) |
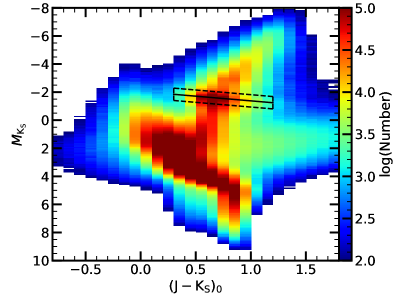
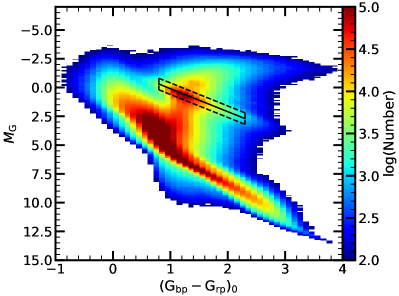
The absolute color-magnitude diagrams for the selected sample is presented in Fig. 1. In the diagrams, the RC stars are relatively isolated from other types of stars, hence can be easily identified (Girardi, 2016). It should be mentioned that, the actual extinction of a specific star depends on its spectral type and also the extinction itself (e.g., Jordi et al., 2010), which may deviate from the statistical extinction distribution of MWDUST. This effect results in the stretch of aggregation area of RC stars in the color-magnitude diagrams. Taking this into account, we select the RC stars by using their expected colour dependency and also the extinction uncertainty. The red clump stars typically have a median absolute magnitude = 1.61 mag, with a Gaussian width of = 0.22 mag (Alves, 2000; Cabrera-Lavers et al., 2007), and an intrinsic colour of = 0.65 mag. Considering a 2 confidence level, the stars with falling within [2.05,1.17] mag are selected as candidates of red clump stars. Then, the sample selection box is obtained in consideration of the properties of RC stars along the extinction direction as shown in Fig. 1, where the black solid line corresponds to the offset of median magnitude due to the extinction uncertainty. In this work, the RC stars are selected by requiring that 0.3 1.2, 3.725 1.5 2.405, 0.8 2.3, and 2.4 2 1.4, as indicated by the black dashed boxes in Fig. 1. In total, 2,685,075 candidates of RC star are selected by these criteria. To evaluate the influence of the adopted 3D extinction model, we also reproduce the sample of RC stars with a different 3D extinction algorithm of Amores et al. (2021), and found that the derived structure features in the overdensity maps of RC stars are consistent.
To inspect the reliability of the sample, we cross-matched the selected candidates of RC stars with the catalogue of Sanders & Das (2018). Sanders & Das (2018) obtained the parameters of distances, masses and ages for about 3 million stars from Gaia DR2, based on the spectroscopic parameters derived from several large spectroscopic surveys. We found that there are 92,525 matched sources, 87,623 ( 94.7%) of them are giant stars with a typical age of 3 Gyr. It supports that the overwhelming majority of our selected sources are indeed old stars.
2.2 Sample completeness
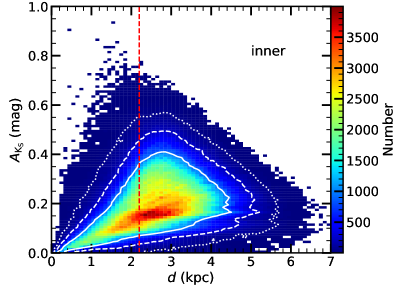
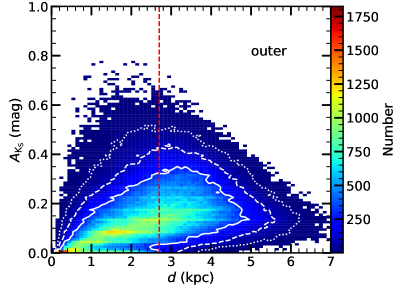
An important issue in uncovering the spiral arms with optically or NIR selected stars is the sample completeness. It depends on the dust extinction, which is related with the spiral structure to some degree. In Fig. 2, we present the extinction of the selected RC stars in this work. Considering that the dust extinction in the inner Galaxy region () is more severe than the outer Galaxy (), we simply divide the RC sample into two different parts. For the vast majority of the selected RC stars ( 99%), the extinction in the direction of the inner Galaxy is less than 0.54 mag, and less than 0.50 mag for the outer Galaxy direction. For more distant stellar objects, extinction values are bound to be greater than the maximum of the current sample.The completeness of samples drops at the farther distance. Considering that Gaia dataset of stars is complete down to at least 17 mag, as shown in Fig. 2, the RC stars selected in this work is believed to be complete at 2.2 kpc for the inner Galaxy direction, and at 2.7 kpc for the outer Galaxy regions. At 17 mag, the median error of the Gaia EDR3 parallax is around 0.07. At 2.22.7 kpc the parallax uncertainties (6.55.3) is large than 5. Fig. 2 also shows the situation that the sample completeness is insufficient. The high extinction data is missing beyond the distance far from the sample completeness (the red dashed lines in Fig. 2). Therefore, at present, we only discuss the distribution of old stars within the limits as indicated by sample completeness limit. Hence, the dataset of RC stars is expected to depict the properties of the nearby arm-segments of the Local arm. At larger distances (e.g., kpc), the sample is not complete, but a large number of RC stars are identified.
3 Distribution in the Galactic plane
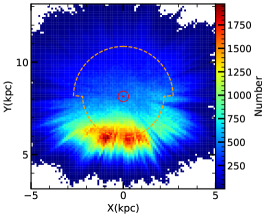
The distribution of RC stars projected onto the Galactic plane is shown in left panel of Fig. 3. In the studied area of the Galactic disc, the number density of RC stars decreases as the increase of Galactocentric distance. At a Galactocentric distance of 6 kpc, where presents an aggregation of RCs, the number density of RCs is about 1500 per 0.01 kpc2, and drops to less than 500 per 0.01 kpc2 at 10 kpc. From the number density distribution, no obvious arm-like features are discernible. This is not unexpected, as the features shown in the left panel of Fig. 3 is completely dominated by the global density profile of stars in the Galactic disc, which is roughly exponential. The P-arms indicated by the overdensities of old stars would be less significant and concealed beneath the global density profile. In addition, in comparison to the gas component or young objects, the velocity dispersion of old stars is larger, the overdensities of old stars (e.g., indicating the P-arms) causing by any perturbations in the Galactic disc would be less sharp and more difficult to identify from observations. In order to reveal the possible underlying P-arms, a bivariate kernel density estimator method (Feigelson & Babu, 2012; Poggio et al., 2021) is adopted. This method may be also helpful to reveal the underlying overdensity structures outside the completeness limits of the RC star sample, because the P-arms are expected to leave some marks on the distribution of the detected distant stars.
Following Poggio et al. (2021), the stellar overdensity, , is calculated by:
| (5) | |||
| (6) | |||
| (7) |
Here, is the local density at the position () in the Galactic disc, is the kernel function, is the kernel bandwidth which is adopted as 0.3 kpc in this work, () is the coordinate of the -th RC star, and is the total number of RC stars involved in the calculation. The mean density is calculated in a similar way as but with 2 kpc. The result is given in the middle panel of Fig. 3.
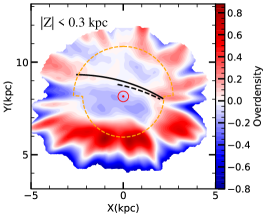
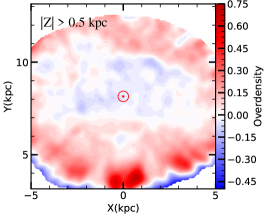
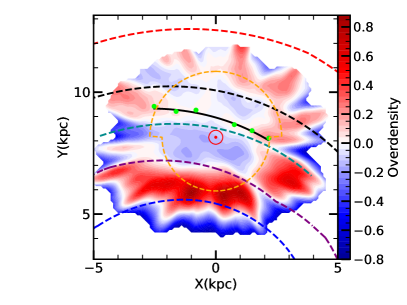
As shown in the overdensity maps in middle panel of Fig. 3, there is a weak arm-like feature extended from 90∘ to 243∘, passed close to the Sun. Most part of this feature is within the completeness limit of the RC sample ( 2.22.7 kpc, see Sect. 2.2), hence is very likely a real structure (as the black solid line shown in the middle panel in Fig. 3). This feature is close to the Local Arm depicted by gas and young objects. Besides, for comparision, we aslo show the overdensity maps of RC stars away from the Galactic plane ( 0.5 kpc) in right panel of Fig. 3. The arm-like structure is only present near the Galactic plane. This may imply that the disk stars show a spiral response under the action of spiral potential for a stellar disc (Lin & Shu, 1964; Kalnajs, 1965; Dobbs & Baba, 2014). When the stars are far away from the Galactic plane, the influence of spiral potential weakens, and the overdensity distribution shows a relatively uniform distribution.
In addition, there are obvious overdensity of RC stars in the regions far away from the Sun. There may be two different explanations about these overdensity features. One is the influence of the sample completeness, as many of these overdensity regions are close to the completeness limit of the RC stars. Another explanation is the spiral structure traced by old stars. We look forward to verifying these structures with more complete samples in the future.
3.1 Comparison with previous works
With a sample of turn-off stars of ages 1 Gyr, Miyachi et al. (2019) identified a marginal arm-like overdensity in the Galactic longitude range of 90 190∘. This feature is confirmed with the overdensity map of RC stars of ages 2 Gyr. As shown in the middle panel of Fig. 3, the arm-like overdensity proposed by Miyachi et al. (2019) is part of the intermediate arm-like features identified with RC stars in the same longitude range.
Recently, Poggio et al. (2021) derived the density distribution of a large number of upper main sequence stars (UMS stars). Their upper main sequence stars consist of O-, B- and A-type stars as discussed in Poggio et al. (2018). We overplotted their results on the overdensity map of RC stars in Fig. 4. The morphology of the overdensity regions given by Poggio et al. (2021) is generally similar to that of RC stars. Three arm-segmemts were proposed by Poggio et al. (2021) based on the distribution of UMS stars, which is similar to our interpretation about the overdensity map of RC stars.
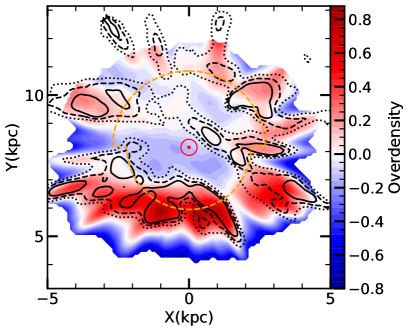
With UMS stars, Poggio et al. (2021) identified the Sagittarius-Carina Arm and also the Scutum-Centaurus Arm (also see their Fig. 2). RC stars also presents over-density in the Scutum-Centaurus Arm and Perseus Arm identified by Poggio et al. (2021), while it is outside the complete region. We only show the coincidence of this structure here.
Due to the limitation of sample completeness at present, we only compare RC stars and UMS stars in area of high completeness (orange contour region in Fig. 4). In the overdensity map of UMS stars, the arm-like feature near the Sun is more obvious. We speculate that, the main cause is that the sample used by Poggio et al. (2021) is a combination of stars covering a wide range of ages, e.g., the typical lifetime for a B-type star is 0.1 Gyr, and 1 Gyr for a A-type star, comparable to that of RC stars ( 2 Gyr). As discussed in Poggio et al. (2018), approximately 55% of their UMS stars are OB type, and 40% are A-type stars. Therefore, the overdensity map of UMS stars seems to present combined features of young objects and old stars. The older OCs (e.g., ages 0.2 Gyr) show a different distribution than the populous OCs with ages of tens of million years (Hao et al., 2021), this may indicate the dynamic evolution or state of star move out of spiral SF-arms. For the purpose of revealing the possible differences between SF-arms and P-arms in the Milky Way, the RC stars adopted in this work would be a suitable dataset for illustrating the properties of P-arms.
3.2 Local P-arm revealed by RC stars
A discernible feature passes close to the Sun, with a over-density in the azimuth angle range of . The overdensity regions from (X,Y)(2,8) kpc to (2,9) kpc are close to the Local Arm, and also possibly related with an arm-segment. As this feature is also shown by Miyachi et al. (2019) and Poggio et al. (2021) with different stellar samples, it is very likely a real arm-like structure. This arm-like feature is probably corresponding to the segments of the Local P-arm traced by older stars of 2 Gyr. The Galactocentric distance of local maxima corresponding to the Local P-arm along different azimuth angle (i.e., = , , , , , and ) are 9.75, 9.35, 9.3, 8.7, 8.55, 8.40 kpc, respectively. While at = , there seems a spur to connect the Local P-arm and outer over-density arc-like feature. Thus, we discarded the local maxima in this azimuth angle. Under the assumption that they are the segments of nearby P-arms, we can use logarithmic spiral-arm model, , to fit this structures (as green dots scattered in Fig. 5). The fitted pitch angle 159 11 for the Local P-arm. This fitted pitch angle is significantly larger than that of the Local () (Reid et al., 2019), as shown in Fig. 5. By researching turn-off stars in the Solar vicinity, Miyachi et al. (2019) found that the pitch angle of the P-arm is slightly larger than the SF-arm. The results for RC stars also consist with this result. The Milky Way’s old stars may exhibit a more loose spiral structure.
3.3 Comparison with SF-arms
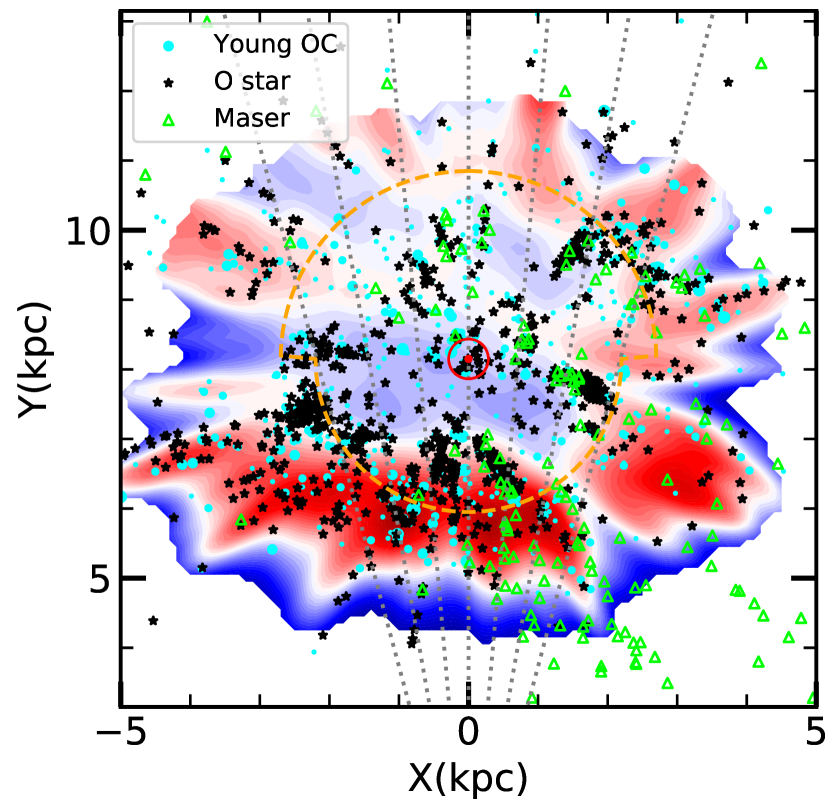
As discussed above, the two different components of spiral arms (SF-arms and P-arms) in a galaxy may be decoupled in their positions. In order to reveal the possible differences between the identified P-arms and the SF-arms of the Milky Way, we compare the distribution of young objects with the overdensity map of RC stars.
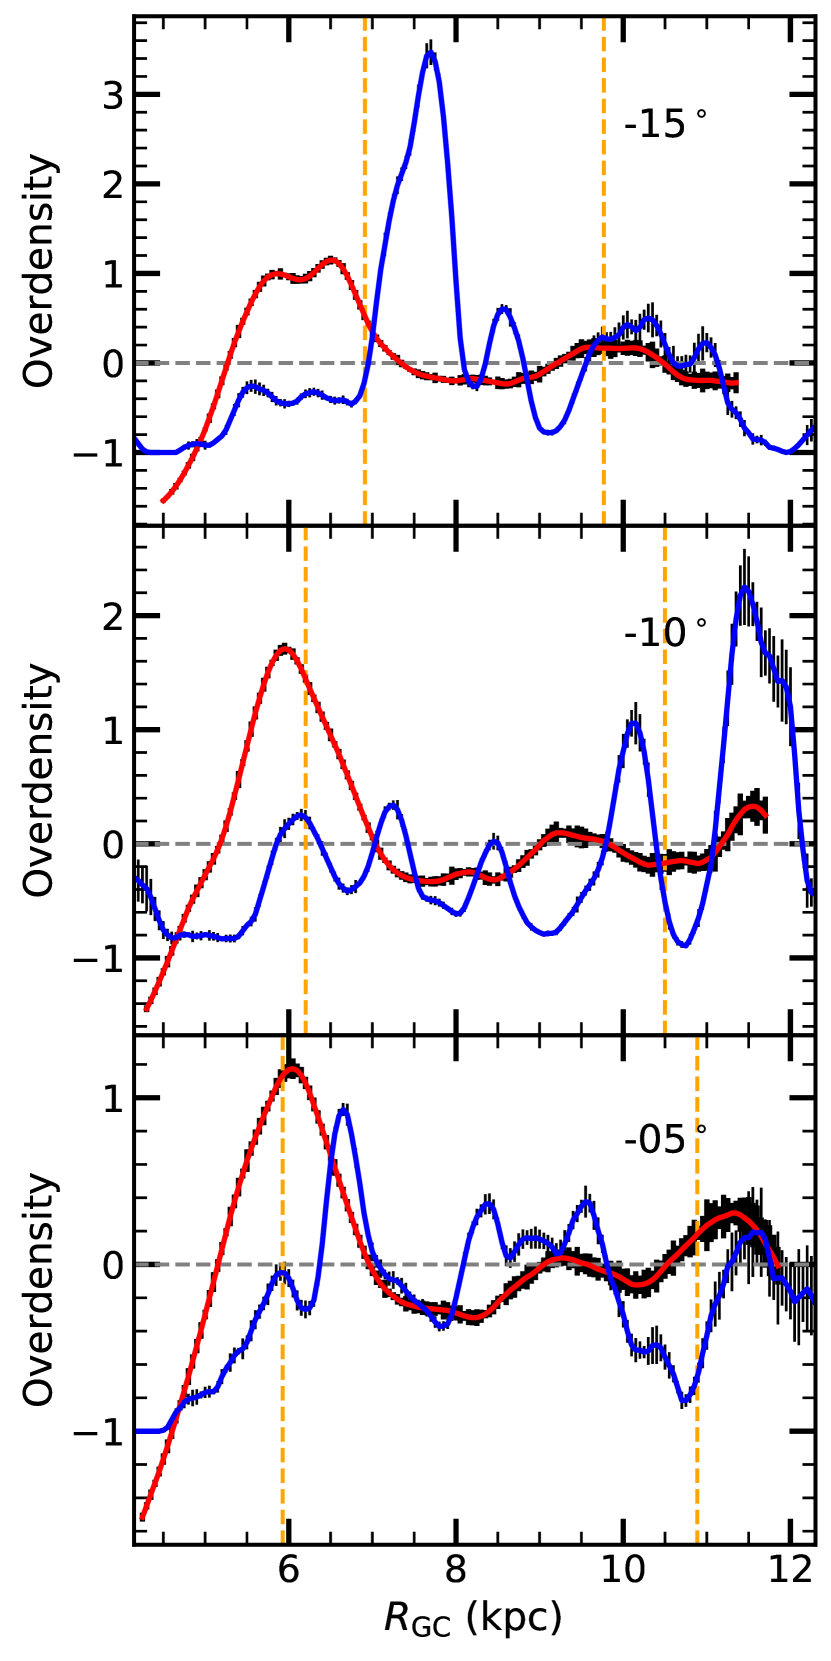
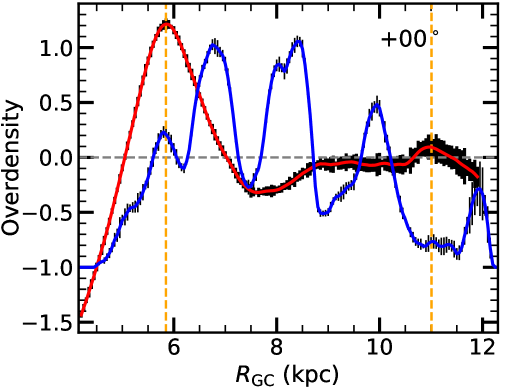
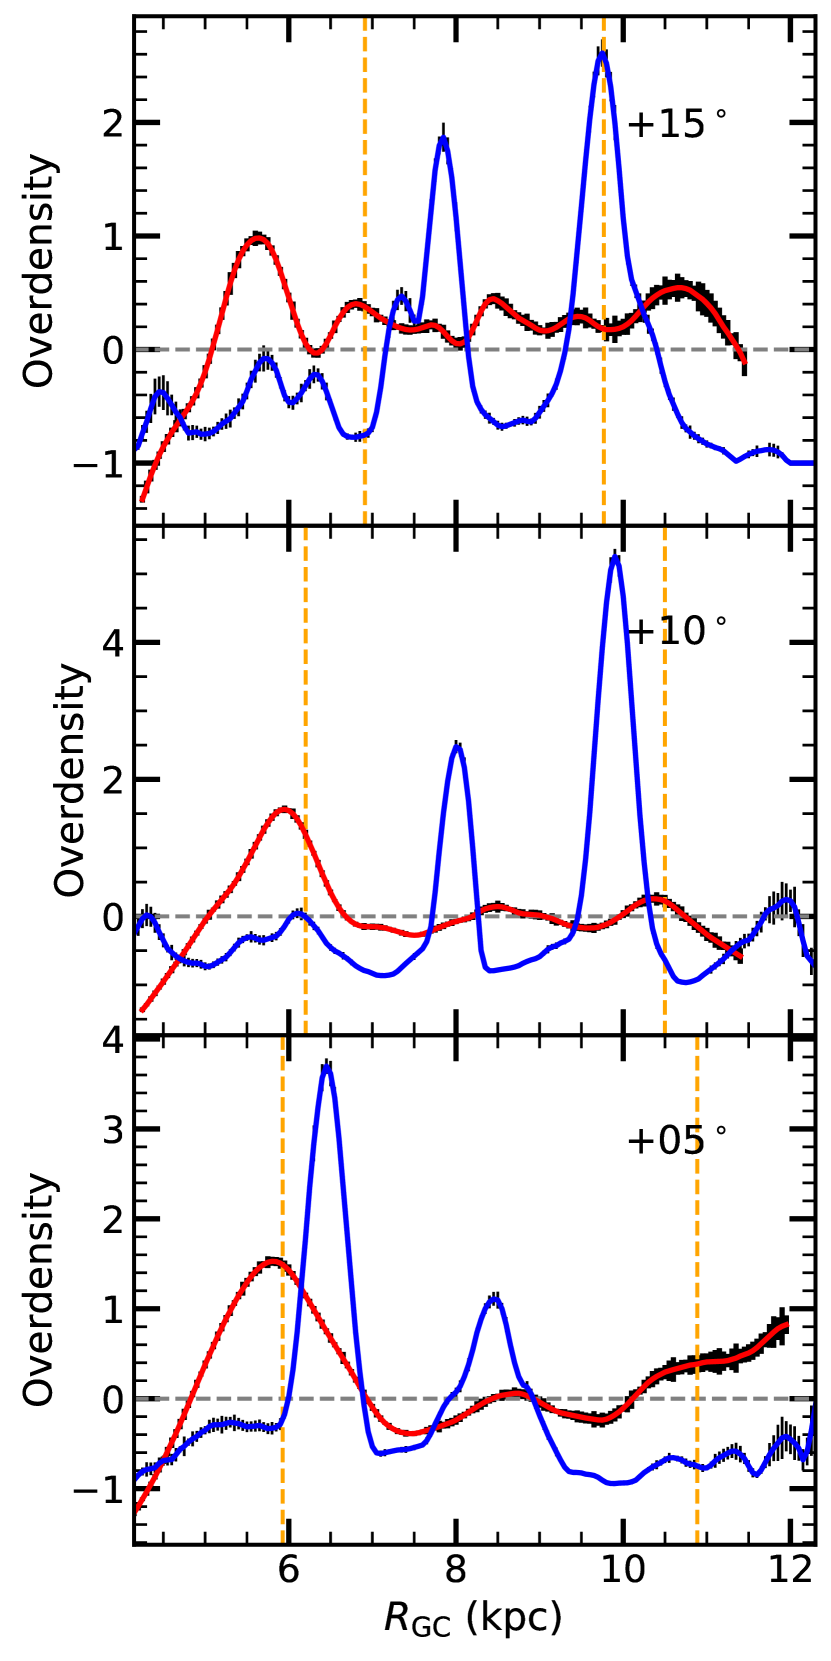
The segments of SF-arms traced by young objects (i.e. with ages less than 20 Myr) have been updated and well studied in the past few years, by using HMSFR masers, OB-type stars and young open clusters with accurate parallax distances. For these young objects, we adopted the data given by Reid et al. (2019), Xu et al. (2021) and Hao et al. (2021). The samples of young objects are also suffered from the completeness issues. The available dataset of young objects have been used to trace the SF-arms in the Galaxy disc as far as about 5 kpc from the Sun. The results are shown in Fig. 6. The prominent feature is that the segments of P-arms traced by RC stars (ages 2 Gyr) are obviously deviated from that of SF-arms, especially for the intermediate arm-like feature, which is not suffered from the sample completeness issue significantly. To indicate it clearly, a bivariate kernel density estimator method is also applied to the young objects, then used to calculate the overdensity profile of young objects as a function of the Galactocentric distance along the slices with azimuth angle of , , , , , , and . Take the result of = as an example (see Fig. 6).
The young objects gather in the areas with = 6.2, 8.0 and 9.9 kpc, correspond to the SF-arms of Sagittarius-Carina, Local and Perseus, respectively. In comparison, the overdensity of RC stars appear near = 8.5 kpc within the area of high completeness. As mentioned in Sect. 3.2, this area may correspond to the Local P-arm. There is an obvious outward drift between the Local P-arm and SF-arm. In previous works, the knowledge of P-arms of the Milky Way is primarily from analyzing the profiles of integrated NIR or FIR emission/sources as a function of Galactic longitude (Drimmel, 2000; Drimmel & Spergel, 2001; Benjamin et al., 2005; Churchwell et al., 2009). The P-arms in the Galactic disc indicate a two-major armed spiral pattern, i.e. the Scutum-Centaurus Arm and the Perseus Arm (Drimmel, 2000; Drimmel & Spergel, 2001). However, there is no obvious over-density of RC stars in the area of = 9.9 kpc, which is correspond to the SF-arms of Perseus Arm. There may be the similar outward shift of the Perseus P-arm. We look forward to a larger and more complete sample to obtain the distribution of Perseus P-arm. Similar properties are also noticed for the other slices, implying that the offsets between SF-arms and P-arms in the vicinity of the Sun are general phenomena.
As shown by studies on some external galaxies (e.g., Yu & Ho, 2018), the possible offsets between SF-arms and P-arms are generally small, especially for the regions close to the galaxy co-rotation radius. It is believed that the co-rotation radius of the Milky Way is close to the Solar circle (e.g., Dias et al., 2019). Under the circumstances, the P-arm of the Local arm traced by RC stars have larger pitch angles than SF-arms, and tend to shift outward toward the anti-Galactic centre direction. The offset between SF-arm and P-arm are increased as the arm segments spiral outward.
4 Discussions and Conclusions
In this work, a large number of RC stars with ages 2 Gyr is identified by using the survey data of 2MASS and Gaia EDR3. In the Solar vicinity, we found that there are obvious overdensity regions of RC stars. A picture composed of three features could be used to interpret these overdensity features. Two of the three structures are located outside the completeness limit of the data sample. And one of the three structures probably correspond to the segments of P-arms in the vicinity of the Sun, which have not been well traced in previous works. This arm-like features possibly correspond to the Local P-arm.
In comparison to the P-arms, the properties of SF-arms in the Milky Way have been better illustrated. By comparing the overdensity distributions of RC stars with that of young objects, we confirm that there are obvious offsets between the segments of P-arms and SF-arms in the vicinity of the Sun even though the completeness issue of the sample is considered to some degree. The segment of the Local Arm traced by RC stars has larger pitch angles than that of SF-arms, tend to spiral outward toward the anti-Galactic centre direction. From the studies on external spiral galaxies, it is found that the SF-arms of galaxies statistically have smaller pitch angles than that of P-arms (e.g., Yu & Ho, 2018), hence with a more tightly wound pattern. However, the relation between P-arm and SF-arm for the Local seems contradict to the measured arm tangential directions and corotation radius of the Milky Way. Based on the density wave theory, the azimuthal offsets between P-arms and SF-arms will be opposite for the Galaxy regions inside and outside the corotation radius (Roberts, 1969; Yuan & Grosbol, 1981; Martínez-García et al., 2009). The corotation radius for the Milky Way is around the Solar circle. In the inner Galaxy, the P-arms traced by old stars have also been found to be outside the corresponding SF-arms by analyzing the arm tangential directions (e.g., Hou & Han, 2015; Vallée, 2014, 2016, 2018), which is similar to the properties for the Local P-arm noticed in this work. However, it is not clear whether the systematic spatial offsets or age pattern exist or not (Vallée, 2018; He et al., 2021) beyond the outer Galaxy. More tests based on observations are needed and such contradictions are expected to be solved by more complete samples of RC stars and young objects with accurately measured distances.
References
- Alves (2000) Alves, D. R. 2000, ApJ, 539, 732. doi:10.1086/309278
- Amores et al. (2021) Amores, E. B., Jesus, R. M., Moitinho, A., et al. 2021, MNRAS, 508, 1788. doi:10.1093/mnras/stab2248
- Andrae et al. (2018) Andrae, R., Fouesneau, M., Creevey, O., et al. 2018, A&A, 616, A8. doi:10.1051/0004-6361/201732516
- Benjamin et al. (2003) Benjamin, R. A., Churchwell, E., Babler, B. L., et al. 2003, PASP, 115, 953. doi:10.1086/376696
- Benjamin et al. (2005) Benjamin, R. A., Churchwell, E., Babler, B. L., et al. 2005, ApJ, 630, L149. doi:10.1086/491785
- Bennett & Bovy (2019) Bennett, M. & Bovy, J. 2019, MNRAS, 482, 1417. doi:10.1093/mnras/sty2813
- Block & Puerari (1999) Block, D. L. & Puerari, I. 1999, A&A, 342, 627
- Bok (1959) Bok, B. J. 1959, The Observatory, 79, 58
- Bovy et al. (2016) Bovy, J., Rix, H.-W., Green, G. M., et al. 2016, ApJ, 818, 130. doi:10.3847/0004-637X/818/2/130
- Cabrera-Lavers et al. (2007) Cabrera-Lavers, A., Hammersley, P. L., González-Fernández, C., et al. 2007, A&A, 465, 825. doi:10.1051/0004-6361:20066185
- Cardelli et al. (1989) Cardelli, J. A., Clayton, G. C., & Mathis, J. S. 1989, ApJ, 345, 245. doi:10.1086/167900
- Christiansen & Hindman (1952) Christiansen, W. N. & Hindman, J. V. 1952, Australian Journal of Scientific Research A Physical Sciences, 5, 437. doi:10.1071/PH520437
- Churchwell et al. (2009) Churchwell, E., Babler, B. L., Meade, M. R., et al. 2009, PASP, 121, 213. doi:10.1086/597811
- Cohen et al. (2003) Cohen, M., Wheaton, W. A., & Megeath, S. T. 2003, AJ, 126, 1090. doi:10.1086/376474
- Dias et al. (2019) Dias, W. S., Monteiro, H., Lépine, J. R. D., et al. 2019, MNRAS, 486, 5726. doi:10.1093/mnras/stz1196
- Dobbs & Baba (2014) Dobbs, C. & Baba, J. 2014, PASA, 31, e035. doi:10.1017/pasa.2014.31
- Drimmel (2000) Drimmel, R. 2000, A&A, 358, L13
- Drimmel & Spergel (2001) Drimmel, R. & Spergel, D. N. 2001, ApJ, 556, 181. doi:10.1086/321556
- Drimmel et al. (2003) Drimmel, R., Cabrera-Lavers, A., & López-Corredoira, M. 2003, A&A, 409, 205. doi:10.1051/0004-6361:20031070
- Eskridge et al. (2002) Eskridge, P. B., Frogel, J. A., Pogge, R. W., et al. 2002, ApJS, 143, 73. doi:10.1086/342340
- Feigelson & Babu (2012) Feigelson, E. D. & Babu, G. J. 2012, Modern Statistical Methods for Astronomy, by Eric D. Feigelson , G. Jogesh Babu, Cambridge, UK: Cambridge University Press, 2012
- Gaia Collaboration et al. (2016) Gaia Collaboration, Prusti, T., de Bruijne, J. H. J., et al. 2016, A&A, 595, A1. doi:10.1051/0004-6361/201629272
- Gaia Collaboration et al. (2018) Gaia Collaboration, Babusiaux, C., van Leeuwen, F., et al. 2018, A&A, 616, A10. doi:10.1051/0004-6361/201832843
- Gaia Collaboration et al. (2021) Gaia Collaboration, Brown, A. G. A., Vallenari, A., et al. 2021, A&A, 649, A1. doi:10.1051/0004-6361/202039657
- Girardi (2016) Girardi, L. 2016, ARA&A, 54, 95. doi:10.1146/annurev-astro-081915-023354
- Green et al. (2019) Green, G. M., Schlafly, E., Zucker, C., et al. 2019, ApJ, 887, 93. doi:10.3847/1538-4357/ab5362
- Hao et al. (2021) Hao, C. J., Xu, Y., Hou, L. G., et al. 2021, A&A, 652, A102. doi:10.1051/0004-6361/202140608
- He et al. (2021) He, Z.-H., Xu, Y., & Hou, L.-G. 2021, Research in Astronomy and Astrophysics, 21, 009. doi:10.1088/1674-4527/21/1/9
- Hou & Han (2015) Hou, L. G. & Han, J. L. 2015, MNRAS, 454, 626. doi:10.1093/mnras/stv1904
- Hunt et al. (2020) Hunt, J. A. S., Johnston, K. V., Pettitt, A. R., et al. 2020, MNRAS, 497, 818. doi:10.1093/mnras/staa1987
- Jordi et al. (2010) Jordi, C., Gebran, M., Carrasco, J. M., et al. 2010, A&A, 523, A48. doi:10.1051/0004-6361/201015441
- Kalnajs (1965) Kalnajs, A. J. 1965, Ph.D. Thesis
- Khoperskov et al. (2020) Khoperskov, S., Gerhard, O., Di Matteo, P., et al. 2020, A&A, 634, L8. doi:10.1051/0004-6361/201936645
- Levine et al. (2006) Levine, E. S., Blitz, L., & Heiles, C. 2006, Science, 312, 1773. doi:10.1126/science.1128455
- Lin & Shu (1964) Lin, C. C. & Shu, F. H. 1964, ApJ, 140, 646. doi:10.1086/147955
- Lindegren et al. (2021) Lindegren, L., Bastian, U., Biermann, M., et al. 2021, A&A, 649, A4. doi:10.1051/0004-6361/202039653
- Marrese et al. (2019) Marrese, P. M., Marinoni, S., Fabrizio, M., et al. 2019, A&A, 621, A144. doi:10.1051/0004-6361/201834142
- Marshall et al. (2006) Marshall, D. J., Robin, A. C., Reylé, C., et al. 2006, A&A, 453, 635. doi:10.1051/0004-6361:20053842
- Martínez-García et al. (2009) Martínez-García, E. E., González-Lópezlira, R. A., & Bruzual-A, G. 2009, ApJ, 694, 512. doi:10.1088/0004-637X/694/1/512
- Miyachi et al. (2019) Miyachi, Y., Sakai, N., Kawata, D., et al. 2019, ApJ, 882, 48. doi:10.3847/1538-4357/ab2f86
- Morgan et al. (1952) Morgan, W. W., Sharpless, S., & Osterbrock, D. 1952, AJ, 57, 3. doi:10.1086/106673
- Morgan et al. (1953) Morgan, W. W., Whitford, A. E., & Code, A. D. 1953, ApJ, 118, 318. doi:10.1086/145754
- O’Donnell (1994) O’Donnell, J. E. 1994, ApJ, 422, 158. doi:10.1086/173713
- Oort et al. (1958) Oort, J. H., Kerr, F. J., & Westerhout, G. 1958, MNRAS, 118, 379. doi:10.1093/mnras/118.4.379
- Poggio et al. (2018) Poggio, E., Drimmel, R., Lattanzi, M. G., et al. 2018, MNRAS, 481, L21. doi:10.1093/mnrasl/sly148
- Poggio et al. (2021) Poggio, E., Drimmel, R., Cantat-Gaudin, T., et al. 2021, A&A, 651, A104. doi:10.1051/0004-6361/202140687
- Reid et al. (2019) Reid, M. J., Menten, K. M., Brunthaler, A., et al. 2019, ApJ, 885, 131. doi:10.3847/1538-4357/ab4a1
- Roberts (1969) Roberts, W. W. 1969, ApJ, 158, 123. doi:10.1086/1501771
- Salaris (2012) Salaris, M. 2012, Ap&SS, 341, 65. doi:10.1007/s10509-011-0927-z
- Sanders & Das (2018) Sanders, J. L. & Das, P. 2018, MNRAS, 481, 4093. doi:10.1093/mnras/sty2490
- Skowron et al. (2019) Skowron, D. M., Skowron, J., Mróz, P., et al. 2019, Science, 365, 478. doi:10.1126/science.aau3181
- Skrutskie et al. (2006) Skrutskie, M. F., Cutri, R. M., Stiening, R., et al. 2006, AJ, 131, 1163. doi:10.1086/498708
- Vallée (2014) Vallée, J. P. 2014, AJ, 148, 5. doi:10.1088/0004-6256/148/1/5
- Vallée (2016) Vallée, J. P. 2016, ApJ, 821, 53. doi:10.3847/0004-637X/821/1/53
- Vallée (2018) Vallée, J. P. 2018, ApJ, 863, 52. doi:10.3847/1538-4357/aad054
- van de Hulst et al. (1954) van de Hulst, H. C., Muller, C. A., & Oort, J. H. 1954, Bull. Astron. Inst. Netherlands, 12, 117
- Weiler (2018) Weiler, M. 2018, A&A, 617, A138. doi:10.1051/0004-6361/201833462
- Xu et al. (2006) Xu, Y., Reid, M. J., Zheng, X. W., et al. 2006, Science, 311, 54. doi:10.1126/science.1120914
- Xu et al. (2018) Xu, Y., Bian, S. B., Reid, M. J., et al. 2018, A&A, 616, L15. doi:10.1051/0004-6361/201833407
- Xu et al. (2021) Xu, Y., Hou, L. G., Bian, S. B., et al. 2021, A&A, 645, L8. doi:10.1051/0004-6361/202040103
- Yu & Ho (2018) Yu, S.-Y. & Ho, L. C. 2018, ApJ, 869, 29. doi:10.3847/1538-4357/aaeacd
- Yuan & Grosbol (1981) Yuan, C. & Grosbol, P. 1981, ApJ, 243, 432. doi:10.1086/158610