qtree/.style=for tree=parent anchor=south, child anchor=north,align=center,inner sep=0pt
Passively Measuring IPFS Churn and Network Size
Abstract
The InterPlanetary File System (IPFS) is a popular decentralized peer-to-peer network for exchanging data. While there are many use cases for IPFS, the success of these use cases depends on the network. In this paper, we provide a passive measurement study of the IPFS network, investigating peer dynamics and curiosities of the network. With the help of our measurement, we estimate the network size and confirm the results of previous active measurement studies.
Index Terms:
Network Measurement, IPFS, P2P NetworksI Introduction
In the last years, new peer-to-peer (P2P) data networks emerged, providing new opportunities for distributed and decentralized storage and exchange of files [1]. A prime example is the InterPlanetary File System (IPFS) [2]. By combining ideas from BitTorrent, Kademlia, Git, and information-centric networking, IPFS has become a major supplement for distributed storage solutions. IPFS is often combined with blockchains serving as off-chain storage [3, 4, 5]. Furthermore, IPFS is the originator and a major user of the libp2p library [6], which could become a quasi-standard for P2P communication.
In this paper, we take a look at a key component of IPFS: the P2P network. Our goal is to gain a better understanding of the dynamics of the IPFS network, with the help of passive measurements. In particular, the churn rate is an important aspect for identifying possible protocol and configuration weaknesses. Furthermore, we investigate changes in peer roles and are interested in finding an answer to a seemingly simple question: How large is the IPFS network? In contrast to active measurement, e.g., crawler [7, 8], which might influence a peer’s connection limit, triggering connection trimming, passive measurements are less intrusive. Due to the usage of the libp2p library, insights in the IPFS network might be applicable to other P2P projects as well.
By deploying two passive measurement clients (go-ipfs, hydra-booster), we record basic information about the network’s characteristics. We perform multiple short-term measurements, spanning a period of to in December 2021. Concerning the network dynamics, we found that the default configuration, which defines certain thresholds for connection trimming, causes a high connection churn rate for DHT-Servers, resulting in very short-lived connections. While the client did not have more than simultaneous connections, the client established connections to – different peer IDs (PID). This indicates either a high amount of nodes with changing PIDs, very volatile nodes, or many one-time users. The meta data of PIDs remains mostly constant. Naturally, the client version changes over time due to the appearance of new versions, however, we observed up- and downgrades. A small part of the PIDs changes their role in the network, by switching from a DHT-Server to a DHT-Client and vice versa. We also identified some anomalies, e.g., go-ipfs clients not supporting Bitswap or an Ethereum client.
With our passive measurement study, we contribute a novel perspective on IPFS peer dynamics that we utilize to approximate the network size. To this end, we explore two methods: distinguishing peers based on meta data and classifying peers based on their connection behavior. As a result, we conclude that during our measurement period the network consisted of roughly peers. Based on the classification the core network of IPFS has at least a size of nodes. With our results, we can also confirm the general observations of the overlay network made by [9] [9].
The remainder is structured as follows. In Section II, we give a brief overview of related work. The measurement method and setup is described in Section III. We present an overview of the measurement results in Section IV, before attempting to estimate the network size in Section V. Section VI concludes the paper and shows our future research direction.
II Related Work
There exists some literature evaluating IPFS metrics, e.g., Bitswap [10] or in general I/O performance [11]. Here, we focus mainly on paper investigating the IPFS P2P network. [12] [12] investigated the data persistence mechanisms and made a similar analysis about origin, distribution, and usage of transport protocol of peers. [13] [13] analysed an earlier version of the IPFS client software identifying the libp2p’s connection manager’s scoring system as a potential vulnerability, allowing a Sybil attack. The presented attack is mitigated in later versions (v0.5). [14] [14] investigate the nature and information of Bitswap messages, focusing on content privacy. [9] [9] estimated the size of the network and structure of the overlay network. The authors first get an impression of the default behavior with passive measurements and compare the results with results from a developed crawler [7]. They further report peer distribution, and uptime of peers. The measurements of the developed crawler is ongoing and the results are publicly available111https://trudi.weizenbaum-institut.de/ipfs_crawler.html (2022-05-30). Another crawler monitoring peer availability and liveness is the libp2p DHT “Nebula Crawler” [8].
Our passive measurement study is similar to the passive method of [9]. Through our measurements we can confirm their results and provide a more recent and closer look at peer dynamics. Furthermore, due to the passive approach of the measurement, we provide a different perspective on the IPFS network compared to different ongoing active measurements.
III Measurement Setup
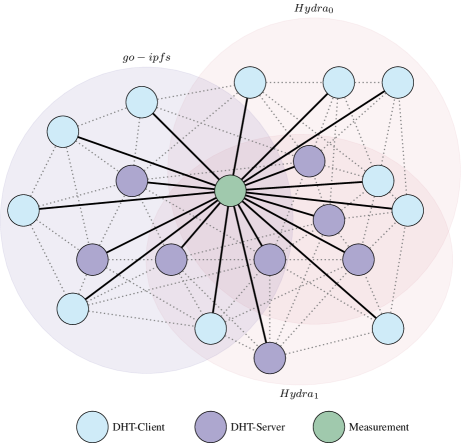
In general, a network can be measured actively or passively. In an active measurement, probing packets are sent to participants in the network. While this allows for detailed information on nodes at almost any time, it can disrupt normal node behavior. A passive measurement records data without creating additional or modified traffic in the network. Due to the decentralized nature of a P2P network, the horizon, i.e., the amount of reachable nodes at a time, is limited: there is no node which knows the exact amount of nodes in the network. While active nodes aggressively try to maximize their horizon by seeking peers, the passive nodes’ horizon is mainly dependent on its neighbors. Figure 1 visualizes the different network perspectives. In case of IPFS, active measurements like crawlers, which explore and search the Kademlia-based DHT, only gain information about peers actively participating in the DHT (DHT-Server). A passive measurement can potentially see all peers independent of their participation in the DHT routing, which also includes clients (DHT-Client). The horizon of a “normal” node, e.g., go-ipfs, also depends on its position in the DHT, which determines the priority of other nodes to maintain or establish a connection to the node. Special nodes, e.g., Hydras, can establish multiple identities providing the node with a broader horizon.
Passive measurements are a common method for gaining an understanding of peer-to-peer networks [15, 16]. The basic procedure of a passive measurement is the same for any P2P network. A node conforming to the protocols behavior is deployed. This measurement node itself behaves normally, i.e., answering requests. At most a node tries to establish and maintain as many connections as possible, with the goal to ideally connect to all nodes in the network. Internally, the node records data about the network.
For our measurement, we deployed two different measurement nodes on a VM hosted in Hesse, Germany by Google Cloud. The VM had RAM, 8 cores, Intel(R) Xeon(R) CPU @ , and Ubuntu 21.10. as the operating system (OS). During the measurement the VM had a public IPv4 address and was not externally reachable via IPv6. Toward the outside, the measurement nodes were a go-ipfs v0.11.0-dev222Commit: 0c2f9d5950c4245d89fcaf39dd1baa754587231b and a hydra-booster v0.7.4 node. The clients were mostly deployed simultaneously on port 4001 for go-ipfs and started by port 3001 for hydra-booster. Additionally, we deployed another go-ipfs v0.13.0-dev333Commit: b2efcf5ce3bba997997962122f85d12500962927 on a different VM reachable via IPv4 and IPv6. This VM had RAM, 8 cores, Intel(R) Xeon(TM) CPU , and Debian 9 as the OS.
We conducted five measurements with durations between and . Between the measurement periods, we adjusted LowWater and HighWater values of the connection manager to reduce connection trimming. Connections are selectively trimmed to the LowWater value, once the number of simultaneous connections reaches the HighWater threshold. An overview of the measurement periods and the used configuration is provided in TABLE I.
| Period | Measurement Duration | Low | High | go-ipfs | Hydra |
|---|---|---|---|---|---|
| 2021-12-03 – 2021-12-06 | 600 | 900 | Server | – | |
| 2021-12-03 – 2021-12-06 | 1.2k | 1.8k | – | 3 | |
| 2021-12-09 – 2021-12-10 | 2k | 4k | Server | 2 | |
| 2021-12-13 – 2021-12-14 | 18k | 20k | Server | 2 | |
| 2022-02-16 – 2022-02-17 | 18k | 20k | Client | – | |
| 2021-12-10 – 2021-12-13 | 18k | 20k | Server | – |
III-A Go-IPFS
Go-ipfs refers to the go reference client444https://github.com/ipfs/go-ipfs (2022-05-30) maintained by Protocol Labs. The reference client is open source and can be deployed by anyone to join the IPFS network or build a private IPFS network. It supports a wide range of functions to exchange and distribute data.
The client is started utilizing the default configuration, a random key, and a temporary repository. Neither key nor repository persisted over different measurement runs. For the measurements only the LowWater and HighWater values of the swarm connection manager were adjusted.
After the initial bootstrap, no further user activity was introduced such as actively connecting to specific peers or requesting data. During the deployment every peer and connection data was recorded and updated. It recorded for the PID of all known peers in the Peerstore, agent version, protocols, and multiaddresses. Furthermore, changes to the information were recorded with a timestamp. Additionally, information of all PeerHost connections per connection-id, e.g., direction, multiaddress, opened, connectedness were checked. The whole information was exported periodically to a json-file.
The go-ipfs client can be deployed as a DHT-Server or DHT-Client, determining its participation in the Kademlia-based DHT routing. Depending on the setting the clients significance in the network changes. Other nodes rather connect and maintain a connection to a DHT-Server since the node can answer routing requests and is detectable via the DHT. Due to the Kademlia-based DHT peers actively seek a connection with the measurement node. The view of a single node, however, is limited due to its location based on the PID.
III-B Hydra-booster
Hydra-booster, in the following Hydra, refers to a node type designed to accelerate IPFS content provision and routing555https://github.com/libp2p/hydra-booster (2022-05-30). The node’s main purpose is the provision and collection of DHT records by deploying multiple “heads”, which provide basic networking functionality and DHT management, and the same “belly” for storing records. The heads of the Hydra have different PIDs, allowing the heads to be responsible for different parts of the DHT.
For our measurement, we added two new PeriodicTasks to the Hydra, to update and export measurement data. The client was configured to record and update peer data every . The Hydra recorded each head’s known PIDs in the Peerstore, agent version, protocols, and multiaddresses. Furthermore, changes to the information were recorded with a timestamp. Additionally, during a connection and disconnection event information about the connection, e.g., duration, timestamp, and direction was logged. All information was periodically exported to a json-file.
Due to the nature of the Hydra, the node is a DHT-Server participating in the Kademlia-based DHT routing. Since every head is located in a different location of the DHT, the Hydra can cover a broader range of the network, increasing its range by increasing the number of heads. As indicated in Figure 1, a head’s view on the network is not distinctly different from other heads and peers might be observed by multiple heads.
III-C Measurement Horizon
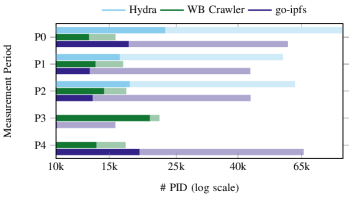
As previously mentioned, passive measurements can have a limited view on the network. To determine if our passive measurement covers a sufficient range of the network, we compare our measurement results with public crawler results666https://trudi.weizenbaum-institut.de/ipfs_crawler.html (2022-05-30) (WB Crawler). Figure 2 shows the total number of observed PIDs (whole bar) and the number of identified DHT-Server nodes (solid) for our passive approaches and an active crawler. Since crawls are executed every , the crawler reports varying number of nodes. We therefore decided to show the results as a range with the reported min. (solid) and max. (whole bar) values. The number of PIDs for the Hydra are the union of all heads. It should be noted that the crawler can only see DHT-Server nodes and our measurement node can only determine if a node is a DHT-Server, if protocol information were exchanged between the nodes.
In order to get a complete view of the network, we should deploy multiple vantage points. Therefore, we expect to see the least amount of nodes with the go-ipfs client, more clients with the hydra, and almost all nodes with the crawler. If we compare the numbers, we can see that for the measurement periods lasting more than the passive nodes see more DHT-Server nodes than the crawler. For the measurement periods of the Hydra sees more than the go-ipfs client. The crawler sees a similar amount of PIDs as the Hydra with two heads. In with three heads, the amount of nodes seen by the Hydra is much higher. One explanation for the difference are disappearing nodes. The crawler provides a fresh snapshot of the network and does not consider results of previous runs. When peers remove a node’s DHT entry, the crawler cannot gain information about the node, even though it was previously seen. Our passive measurement node provides a historic snapshot, keeping the record of all nodes once seen over time independent of their activity.
In general, the numbers show a similar range of PIDs. It therefore seems that one passive measurement node is enough to reach a reasonable sample of DHT-Server nodes. Assuming that the crawler covers most of the network and considering the results shown by the Hydra, two measurements nodes with strategically placed keys should be sufficient to cover almost the whole network. The geolocation of the measurement nodes should not have an influence on the number of seen nodes as IPFS does not enforce any geographic clustering of nodes. However, it is possible that the geolocation of the measurement node has an influence on the peer dynamics like connection churn.
IV Peer Dynamics
In this section, we take a closer look at peer dynamics. We investigate connection churn with the measurement data from periods – . which has a longer duration covers observations of data directly related to the peers. In the following, we distinguish peers based on their PID.
IV-A Connection Churn
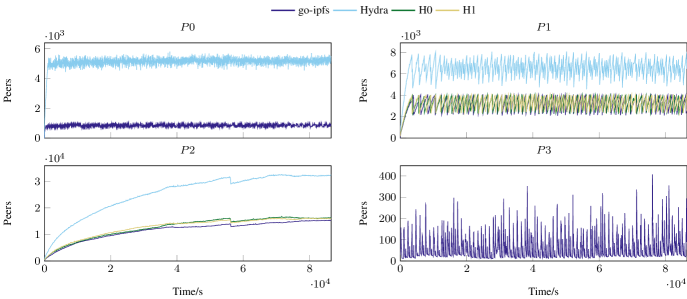
To investigate connection dynamics, we conducted different measurements with different Low-/HighWater values. Please note, that due to our measurement setup in go-ipfs the connection information is only refreshed every and the real values should be slightly smaller than shown. All connections still active at the end of the measurement are considered to be closed at that moment and are included in the statistics. An overview of the results of the different measurement values can be seen in TABLE II. In the statistic, we consider only peers with recorded connection information. Type “All” means that the results represent all connections from all peers, meaning that some peers provide multiple values. Type “Peer” means that the results are calculated over the average connection duration of each peer, giving each peer exactly one value.
Overall, the measurements show similar results for the go-ipfs DHT-Server and Hydra, except for where the peer average is much lower compared to the Hydra value. This exception could be explained by the difference of the default LowWater and HighWater values. For the go-ipfs DHT-Client in , we see overall short connection durations.
| Period | Type | Sum | Avg. | Median | |
| go-ipfs | |||||
| All | 1’285’513 | ||||
| Peer | 55’258 | ||||
| All | 355’965 | ||||
| Peer | 41’880 | ||||
| All | 285’357 | ||||
| Peer | 42’038 | ||||
| All | 47’571 | ||||
| Peer | 10’004 | ||||
| Hydra H0 | |||||
| All | 1’733’511 | ||||
| Peer | 56’465 | ||||
| All | 422’164 | ||||
| Peer | 43’550 | ||||
| All | 416’711 | ||||
| Peer | 52’134 | ||||
| Hydra H1 | |||||
| All | 1’851’308 | ||||
| Peer | 64’147 | ||||
| All | 538’366 | ||||
| Peer | 43’810 | ||||
| All | 408’621 | ||||
| Peer | 48’889 | ||||
| Hydra H2 | |||||
| All | 1’890’556 | ||||
| Peer | 63’981 | ||||
We observe rather low connection durations lasting in general only a few minutes up to . The lower average value of all connections indicates peers initiating many short lasting connections. An example for such peers are crawlers, which connect to a node query their information, e.g., DHT buckets and then close the connection.
The increase of the connection duration between measurement periods indicates, however, that more connections are closed due to connection trimming than due to nodes leaving the network. Taking a closer look at the connection type, we observe vastly more inbound than outbound connections. In all periods, the duration of inbound connections is longer than the duration of outbound connections, which confirms the assumption that the connections are mainly closed due to connection trimming. With higher threshold values, the measurement node no longer trims its own connection, however, the connection still gets trimmed by the other nodes which most likely use the default threshold values.
IV-B Meta Data
To increase the versatility and for a better understanding of the roles of specific nodes, nodes reveal information about themselves, e.g., agent version, supported protocols, and reachable multiaddresses. This information can be used to, e.g., identify DHT-Server nodes. It can also be used to estimate node behavior and identify anomalies.
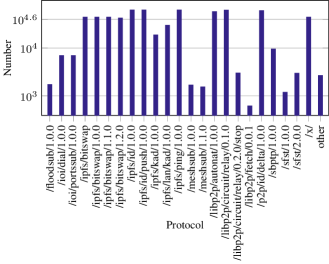
From the data set, we observe overall 323 different agent strings and 101 different supported protocols. Figure 3 and Figure 4 show the occurrences of the different agents and protocols. For a better overview, agents used by 100 or less and protocols supported by 300 or less are grouped as other. The go-ipfs versions are grouped by their version number. From the 323 different agent strings 263 are different versions of go-ipfs and 61 are other agent strings. Overall from the 65’853 known PIDs, 50’254 claim to use some sort of go-ipfs version, 1’028 are Hydra nodes, 586 are some kind of crawler, 10’926 use a different agent, and from 3’059 no version string was obtained. One of the agents claimed to be a go-ethereum node.
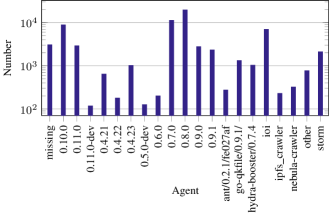
However, agents are prone to change. During the three days, we could observe some version changes, mainly affecting go-ipfs clients. Surprisingly, we could identify not only upgrades but also downgrades. An overview of the version changes can be seen in TABLE III. As an upgrade, we define an increase in the version number. A downgrade is, therefore, a decrease in the version number. A change is indicated by a change of the commit part of the go-ipfs version string. A dirty version is a version, containing changes from the release’s main version as indicated by the commit message, e.g., our used go-ipfs versions are dirty versions. The version of agents other than go-ipfs did not change in the observed time period. Once the agent changed from a non-go-ipfs agent to a go-ipfs agent.
The announced agent can be used as an indicator, for peers’ behavior. This should be further distinguishable by the announced protocol. Almost all of the clients support the basic IPFS protocols like ipfs/id and ipfs/ping. A few custom protocols are used by only a distinct number of peers. Surprisingly, only 44’463 support ipfs/bitswap when 50’163 use go-ipfs. There are 7’498 go-ipfs v0.8.0 clients which do not support Bitswap and instead support sbptp, a protocol, which is otherwise only supported by storm nodes. Furthermore, libp2p/circuit/relay is support by almost all clients. The ipfs/kad protocol, which should indicate an IPFS DHT-Server, is supported by 18’845 peers.
The combination of agent version and supported protocol can be used to detect unusual behavior. In case of curiosities like a go-ipfs agent, which does not support ipfs/bitswap, it reveals information about the configuration or reveals an attempt to hide potentially malign agents, e.g., storm nodes, identified to be part of a botnet [17].
| Version | Type | |||
|---|---|---|---|---|
| Upgrade | 218 | main–main | 291 | |
| Downgrade | 107 | dirty–main | 9 | |
| Change | 205 | main–dirty | 5 | |
| dirty–dirty | 225 | |||
During normal operation, we do not expect a change in the announced supported protocols, except when the used client changes. In general, only a few nodes changed their supported protocols. However, we observed many changes concerning /ipfs/kad/1.0.0 and /libp2p/autonat/1.0.0. 2’481 peers changed in sum 68’396 times their support announcement of the /ipfs/kad/1.0.0 protocol switching their roles from a DHT-Server to DHT-Client. 3’603 peers changed in sum 86’651 times their support announcement of /libp2p/autonat/1.0.0. While autonat is not a crucial feature, switching roles from a DHT-Server to a DHT-Client could have a negative influence on the network, e.g., due to many control messages.
While the meta data is useful for the operation of the network, it shows potential for misuse. Due to the almost homogeneous distribution of agent versions and supported protocols, exotic combinations or exotic names could be used to re-identify or track specific peers independent of their PID. Furthermore, the meta data seems to be rather constant, which means that this information could be further utilized for peer identification. However, long term observations are necessary to confirm or deny this assumption.
V Network size
Previously, we differentiated peers by their PID. Therefore, the network size would be equal to the number of PIDs.
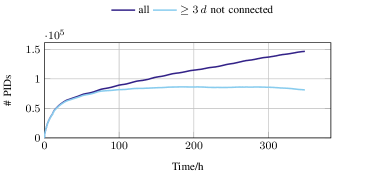
Looking at the number of PIDs in TABLE II, we see between – peers. Since the position in the network and the day of the measurements vary, it is plausible that the number of peers vary as well. However, looking at the number of simultaneous connections provides a different perspective on these numbers. A comparison of the number of connections over time for the different periods can be seen in Figure 5. For better comparison, the figure shows only the connections of the first . In case of and , we can directly see our nodes’ connection trimming due to the configured threshold values. For , we can see around 15k–16k simultaneous connection, which does not even reach the LowWater threshold. probably shows other nodes’ connection trimming, since even peak values are below the default go-ipfs LowWater value. The passive DHT-Client node, which does not even provide any files is a prime candidate for connection trimming. Naturally, not every peer needs to establish a connection to our measurement node. Investigating the number of PIDs over a longer time, however, shows a certain trend. In Figure 6, we can see the number of PIDs over time and the number of PIDs that were more than three days disconnected from the measurement node and never returned. To this end, we conducted an additional measurement of approximately (from 2022-03-29 to 2022-04-12). The measurement shows a continuous grow in the number of seen PIDs and a plateau of connected PIDs. The difference between simultaneous connections, connected peers, and the amount of seen PIDs over time are indicators for a possible misinterpretation of one peer as one PID.
In general, one participant can use multiple PIDs, e.g., to use a different outer profile, different IPNS entries, or increasing the privacy against nodes monitoring the Bitswap traffic [14]. The difference between simultaneous connections and known PIDs in our measurement would suggest that every peer has around two PIDs.
To determine the size of the network, it is therefore necessary to group PIDs or find a different method to distinguish peers. In the following, we discuss two approaches to estimate the network size: based on the multiaddress and based on the connection time and number of connections.
V-A Multiaddress
A simple approach to group PIDs is the usage of the connected multiaddress, especially, the IP address part. PIDs establishing a connection from the same IP address belong to the same group. In case of the data of with 65’853 PIDs, we had a connection with 62’204 PIDs, communicating from 56’536 different IP addresses. Grouping the PIDs by connected IP address results in 47’516 different groups, with 44’301 groups consisting of only one PID and overall 40’193 PIDs with unique IP addresses.
This method can detect non-persistent or rotating PIDs to some degree. For example, we observed one IP address with 2’156 PIDs, where all PIDs have the same agent version and support the same protocols. However, the amount of groups are still three times the amount of simultaneous connections. Additionally, this method has some serious flaws: Hydra nodes operate a multitude of heads not necessarily deployed on different IP addresses. In our data set, the 1’028 Hydra nodes 1’026 operate from 11 IP addresses 9 with 100, one with 98, and one with 28 nodes. The last two are run on one IP address with two go-ipfs nodes. These are most likely simultaneously active peers but would be grouped to 12 peers. Other problems consist in non-persisting PIDs in combination with NAT, NAT in general, smaller Cloud provider sharing IP addresses, or one-time users.
V-B Connection Time
In addition to distinguish peers based on IP addresses, we also make an attempt to classify peers based on connection information. To this end, we will consider the number of connections established by a peer and duration of a connection with a PID. This goes beyond differentiating between clients and non-clients [9] and is able to identify the core network.
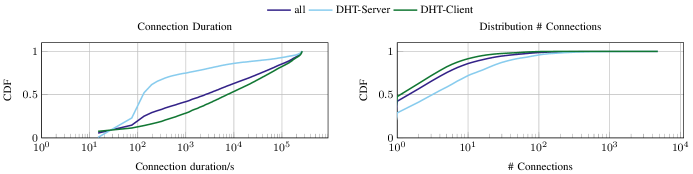
To see if there are certain trends, we use the data of . The left side of Figure 7 shows the cumulative distribution function (CDF) for the maximum duration per PID for DHT-Clients, DHT-Server, and all PIDs. Around 53 % are connected less than and around 16 % of the nodes maintained a connection longer than . The trend for shorter durations of DHT-Server nodes, might be due to the connection trimming as also experienced by our node. On the right side of Figure 7, we can see the CDF for the number of connections a PID had with the measurement node. The figure shows that only around 10 % have more than 15 connections and around 50 % have one connection. From the results of Figure 7, we can conclude that most PIDs connected only a few times and a small amount of nodes maintained the connection for a long time.
In order to classify peers based on connection information, we define four classes: heavy, normal, light, and one-time. We consider heavy peers to be stable and constantly active i.e., more than a day. Normal peers have comparably shorter but still somewhat long connection durations, e.g., more than two hours but less than a day. Light peers have many short connections i.e., repeatedly connecting to the networking, which summarizes recurring, experimental, faulty, or malicious peers. Lastly, one-time peers connect once or twice to the network in a short time frame for a short period of time (max. ).
| Class | Time | # Conn. | Peers | DHT-Server |
|---|---|---|---|---|
| Heavy | – | 10’540 | 1’449 | |
| Normal | – | 15’895 | 1’420 | |
| Light | 16’880 | 9’755 | ||
| One-time | 18’889 | 6’108 |
TABLE IV shows the classification of peers. We observed heavy DHT-Server nodes, yielding heavy DHT-client nodes. Since the DHT clients do not participate in DHT routing, we can also refer to them as the core user base. The number of heavy DHT-Server nodes seems rather low, which is not surprising as it represents a subset of all core nodes only. That is, some light and one-time DHT-Server nodes might be core nodes as well. This misclassification of nodes is a weakness of the passive measurement approach, because we can only see connection churn and not node churn. Connection churn can be triggered by connection trimming, due to new nodes joining the network, or new connections caused by file exchange and search. While the number of core nodes might be higher, it is, however, unlikely that the number is lower.
VI Conclusion and Future Work
In this paper, we presented a passive measurement study of the IPFS network, revealing a different perspective of the network compared to previous active measurements. While in many other P2P networks connection churn can be expected to be approximately equal to node churn, it is different in IPFS: We identify a rather high connection churn. Instead of nodes joining and leaving the network, we believe that the reason for the high connection churn is IPFS’s connection trimming mechanism. Due to these results, we recommend to investigate the default threshold values for DHT-Server nodes further and possibly adjust it to a higher value.
Moreover, we show the complexity of determining the network size. To this end, we presented two methods for estimating network size and conclude that both methods cannot capture the full complexity. Additionally, the short measurement period, cannot capture long-term behavior. In the future, we will investigate, if it is possible to improve our method to distinguish peers by utilizing a wide range of peer meta data, e.g., latency, agent version, and history of announced multiaddresses. However, the possibility of a clear distinction of every peer can be cause of concern considering the privacy of users.
References
- [1] Erik Daniel and Florian Tschorsch “IPFS and Friends: A Qualitative Comparison of Next Generation Peer-to-Peer Data Networks” In IEEE Communications Surveys Tutorials 24.1, 2022, pp. 31–52 DOI: 10.1109/COMST.2022.3143147
- [2] Juan Benet “IPFS - Content Addressed, Versioned, P2P File System (DRAFT 3)”, 2014
- [3] Van-Hoan Hoang, Elyes Lehtihet and Yacine Ghamri-Doudane “Privacy-Preserving Blockchain-Based Data Sharing Platform for Decentralized Storage Systems” In Networking ’20: Proceedings of the 19th IFIP Networking Conference, 2020, pp. 280–288
- [4] Yongle Chen, Hui Li, Kejiao Li and Jiyang Zhang “An improved P2P File System Scheme based on IPFS and Blockchain” In BigData Congress ’17: 2017 IEEE International Congress on Big Data, 2017, pp. 2652–2657
- [5] Muhammad Salek Ali, Koustabh Dolui and Fabio Antonelli “IoT Data Privacy via Blockchains and IPFS” In IOT ’17: Proceedings of the 7th International Conference on the Internet of Things, 2017, pp. 14:1–14:7
- [6] Protocol Labs “libp2p - Github” Acessed: 2022-05 In GitHub repository Github, https://github.com/libp2p
- [7] Sebastian Henningsen, Sebastian Rust, Martin Florian and Björn Scheuermann “Crawling the IPFS Network” In Networking ’20: Proceedings of the 19th IFIP Networking Conference, 2020, pp. 679–680
- [8] Dennis Trautwein “Github - dennis-tra/nebula-crawler” Accessed: 2022-05 In GitHub repository GitHub, https://github.com/dennis-tra/nebula-crawler
- [9] Sebastian Henningsen, Martin Florian, Sebastian Rust and Björn Scheuermann “Mapping the Interplanetary Filesystem” In Networking ’20: Proceedings of the 19th IFIP Networking Conference, 2020, pp. 289–297
- [10] Alfonso Rocha, David Dias and Yiannis Psaras “Accelerating Content Routing with Bitswap: A Multi-Path File Transfer Protocol in IPFS and Filecoin”, 2021, pp. 11
- [11] Jiajie Shen, Yi Li, Yangfan Zhou and Xin Wang “Understanding I/O Performance of IPFS storage: a client’s perspective” In IWQoS ’19: Proceedings of the International Symposium on Quality of Service, 2019, pp. 17:1–17:10
- [12] Barbara Guidi, Andrea Michienzi and Laura Ricci “Data Persistence in Decentralized Social Applications: The IPFS approach” In CCNC ’21: Proceedings of the 18th IEEE Annual Consumer Communications & Networking Conference, 2021, pp. 1–4
- [13] Bernd Prünster, Alexander Marsalek and Thomas Zefferer “Total Eclipse of the Heart–Disrupting the InterPlanetary File System” In arXiv preprint arXiv:2011.00874, 2020
- [14] Leonhard Balduf, Sebastian Henningsen, Martin Florian, Sebastian Rust and Björn Scheuermann “Monitoring Data Requests in Decentralized Data Storage Systems: A Case Study of IPFS” In arXiv preprint arXiv:2104.09202, 2021
- [15] Christian Decker and Roger Wattenhofer “Information propagation in the bitcoin network” In P2P ’13: Proceedings of the 13th IEEE International Conference on Peer-to-Peer Computing, 2013, pp. 1–10
- [16] Erik Daniel, Elias Rohrer and Florian Tschorsch “Map-Z: Exposing the Zcash Network in Times of Transition” In LCN ’19: Proceedings of the 44th IEEE International Conference on Local Computer Networks, 2019, pp. 84–92
- [17] Silvia Pripoae “Looking Into the Eye of the Interplanetary Storm”, 2020 Bitdefender URL: https://www.bitdefender.com/files/News/CaseStudies/study/376/Bitdefender-Whitepaper-IPStorm.pdf