LatticeOPT: A heuristic topology optimization framework for thin-walled, 2D extruded lattices
Abstract
This paper introduces a heuristic topology optimization framework for thin-walled, 2D extruded lattice structures subject to complex high-speed loading. The proposed framework optimizes the wall thickness distribution in the lattice cross section through different thickness update schemes, inspired by the idea of equalization of absorbed energy density across all lattice walls. The proposed framework is ubiquitous and can be used in explicit dynamic simulations, which is the primary numerical method used in crashworthiness studies. No information on the material tangent stiffness matrix is required, and complex material behaviors and complex loading conditions can be handled. Three numerical examples are presented to demonstrate framework capabilities: (1) Optimization of a long, slender column under axial compression to maximize specific energy absorption, (2) Optimization of a lattice-filled sandwich panel under off-center blast loading to minimize material damage, (3) Generation of a periodic lattice core design under blast loading. The results show that the framework can effectively increase specific energy absorption or minimize material damage with as few as 25 finite element simulations and optimization iterations.
Graphical abstract
![[Uncaptioned image]](/html/2205.14832/assets/x1.png)
keywords:
Topology optimization , Thin-walled extruded lattice , Blast loading , High strain rate loading*[inlinelist,1]label=(),
1 Introduction
Thin-walled lattices are often employed to strengthen structures for energy absorbing purposes [1, 2, 3]. Typically, these structures absorb energy by undergoing highly nonlinear large deformation that extends well beyond the linear elastic region [4]. Irreversible processes such as plastic deformation, damage, and fracture become the primary means of energy dissipation [5, 6]. It is of significant practical interest to leverage topology optimization (TO) algorithms to identify the optimum cross-sectional design and location of reinforcements [4]. The objectives are typically to maximize specific energy absorption [2, 7, 8], maximize crashing force efficiency[9, 8], and minimize peak crashing force [10, 11]. However, TO frameworks that are based on quasi-static loading, linear elastic, small-strain finite element (FE) formulations are unsuitable in this case, due to the large deformation and dynamic nature of the loading. For those that do account for geometric nonlinearility [12, 13, 14], material plasticity [15, 14, 16], and damage [17, 18, 19], an in-house implementation of the FE procedure is required, as information on the material tangent stiffness matrix and values of the internal state variables are needed in the adjoint method to compute the gradient of the objective function [20, 21, 15]. This requirement is cumbersome for two reasons: (1) many general purpose FE codes, either open source or proprietary, already exist that can robustly solve large deformation nonlinear problems, they should be leveraged whenever possible; and (2) information on the tangent stiffness matrix may not be provided by those programs, or in the case of explicit dynamic simulations it is simply not formed. In particular, it is also noted that adjoint analysis for transient problems is complex and difficult to implement [22] and can be as expensive as the forward FE analysis [23].
Given that existing crashworthiness research widely employs commercial explicit dynamics FE code such as Abaqus/Explicit [24] and LS-DYNA [25], it is highly relevant and of great importance to study how these codes can be coupled to TO frameworks that do not require information beyond what the commercial code provides. In the case of TO for thin-walled structures, several frameworks have been proposed and demonstrated. Notable ones are: (1) the equivalent static load approach, which seeks a static load that generates equivalent deformation to the true dynamic load, and thus converts the problem to a quasi-static TO problem [26, 27]; (2) cellular automata-based approaches, which use a series of update rules to iteratively update the thickness of the shell elements defining the lattice walls [28, 4, 29, 30]; (3) the response surface method, which seeks to approximate the true response surface of the objective function through simple functions and repeated FE simulations [31, 32]; and (4) various probabilistic and evolutionary methods like Bayesian optimization [33], ant colony method [34, 35], and particle swarm method [36]. Most of these methods, although capable of improving the design, take many FE simulation and optimization iterations to do so [28], and can be computationally expensive for large scale problems. Therefore, the current work aims at proposing a novel heuristic framework named LatticeOPT that can work with commercial FE code to generate lattice cross-section designs with improved specific energy absorption or minimized damage, with as few design iterations as possible.
This paper is organized as follows: Section 2 presents an overview of the definition of the lattice design space, thickness update schemes, and the workflow of the LatticeOPT algorithm. Section 3 presents and discusses the results from three numerical examples. Section 4 summarizes the outcomes and highlights possible future works.
2 Methods
2.1 Defining the lattice design space and design variables
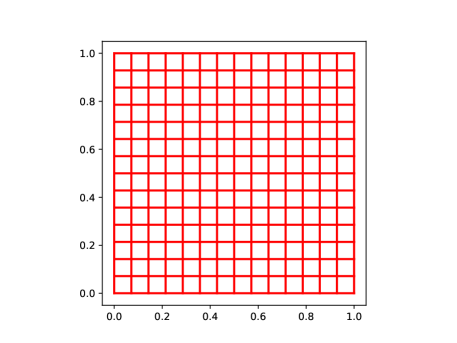
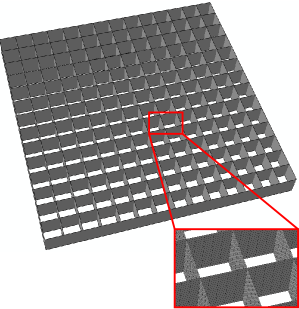
Currently, the LatticeOPT framework supports the definition of a cubic lattice design space, defined by the in-plane cross-section length (L) and width (W), as well as the out-of-plane height (H). Inspired by the ground structure approach [37], which is typically applied to TO of truss structures, we partition the in-plane cross section into smaller rectangular cells, where each cell wall is represented by shell elements in FE simulations, see Fig. 1. The user provides the number of cells in the X- and Y-directions, denoted by and , respectively. A larger means smaller partitions and larger design space with more degrees of freedom. While in the Z-direction, the user can specify the number of finite elements used to discretize the lattice height, denoted by .
Contrary to TO applied to solid structures, where the design variables are material densities of the elements, the design variables in LatticeOPT are the thicknesses of lattice walls, and the material property is not interpolated as is typically done in typical TO. In addition, typical TO frameworks penalize material densities using either the SIMP or RAMP schemes to avoid the presence of intermediate density values [38], while in the present framework, no penalty scheme is needed. Wall thickness can be regarded as a continuous variable, and any intermediate thickness values within a reasonable range is physically meaningful and is manufacturable via additive manufacturing techniques such as selective laser melting [39]. We would like to emphasize that, although the process of varying the shell element thickness is similar to a sizing optimization and/or topometry optimization [40], since LatticeOPT usually involves many more design variables and it alters the cross section topology directly by removing edges below a minimum thickness, this is still considered to be a topology optimization framework. The use of the term topology optimization is also consistent with many previous studies on optimization of thin-walled shell structure cross sections that focus on updating shell thickness and remove cell walls below a thickness threshold [28, 29, 4]
2.2 Thickness update schemes
Many previous heuristic TO frameworks for thin-walled structures, like the hybrid cellular automata (HCA)-based framework by Hunkeler [29] and Duddeck et al. [4], evolve the design by iteratively updating the lattice wall thicknesses through some predetermined, intuition-based updating rules. The central idea embedded in these rules is the equalization of energy density: for efficient energy absorption, different parts of the lattice should contribute equally to the energy absorption [29]. In terms of the ground lattice structure depicted in Fig. 1b, it means that each lattice wall should contribute equally to the total energy absorption [29].
Since a design can be uniquely characterized by the wall thickness of each lattice wall, design update boils down to the update of lattice wall thicknesses. Inspired by the idea of equalization of energy density, we propose two different thickness update schemes, which produce the updated thickness distribution for the next design iteration.
2.2.1 Scheme 1
Given the current wall thickness distribution (superscript denotes the design iteration index), FE simulation provides the energy absorbed by each lattice wall, which accounts for the stored elastic strain energy and energy dissipated due to plasticity and damage. Approaching equalization of energy density at the next design iteration is mathematically equivalent to the following optimization problem:
| (1) |
where the projection area of lattice wall at design iteration (denoted by ) is given by , with being the length of that lattice wall. In the case of a uniform energy density distribution, the standard deviation attains its global minimum of 0. However, Eq. (1) offers little value in practice: is not known a priori, nor can it be estimated to first order using a truncated Taylor series given a thickness change :
| (2) |
In general, it is difficult to obtain the gradient through the adjoint method since the FE tangent stiffness matrix (which is needed in the calculation of the adjoint vector) is not always available from commercial FE packages, and for explicit dynamic simulations, the tangent stiffness matrix is simply not formed. The sheer size of the gradient matrix also makes it prohibitively expensive to estimate using the finite difference method. Therefore, we modify the optimization problem using a zeroth order estimate for :
| (3) |
Note that now the only unknowns are the updated thickness array embedded inside the projection area array , and the gradient of the objective function is straightforward ( is independent of ). This is beneficial, as gradient-based optimizers can be employed to efficiently reduce the objective function, which is highly urged in the famous forum paper [23]. For practical purposes, we further require the following variable bounds, volume, and thickness change constraints:
| (4) |
| (5) |
| (6) |
where and denote the target volume and lattice height, respectively. In practice, the maximum thickness change constraint (Eq. (6)) is converted to bounds on the design variables during the optimization. Eq. (3) - Eq. (6) define a nonlinear constrained optimization problem, the solution to which provides the updated thickness distribution .
2.2.2 Scheme 2
The second updating scheme is inspired by the bi-directional evolutionary structural optimization (BESO) method, pioneered by Huang and Xie [41]. It is a heuristic TO method typically applied to solid structures, where each element in the mesh is ranked by a so-called sensitivity number, and elements are added or removed based on their relative sensitivity ranking. When optimizing for SEA, the element sensitivity at iteration is defined as [42]:
| (7) |
where and denote the undeformed volume and absorbed energy of the elements, respectively. Following this definition, we can analogously define the sensitivity for lattice walls at design iteration as:
| (8) |
Equalization of energy density can again be expressed as minimizing the standard deviation of the lattice wall sensitivity number. Estimating with , the second updating scheme can be stated in terms of the following optimization problem:
2.2.3 Implication of the update schemes
Note that both update schemes introduced above originate from optimizing energy absorption of the lattice. However, it is not immediately obvious how the attempted equalization of energy density actually affects the performance of the updated lattice.
As we shall see in Section 3, the two schemes actually lead to improved stiffness of the optimized lattice structure. In the case of a fixed-displacement loading scenario (e.g., Section 3.1), a stiffer structure absorbs more energy compared to its more compliant counterparts, thus agreeing with the expected objective of maximizing SEA. We also demonstrate in the case of a fixed-load loading scenario (e.g., Section 3.2) that, instead of maximizing energy absorption, a stiffer structure minimizes material damage.
2.3 Periodic lattice structures
LatticeOPT supports the generation of periodic lattices. The user can enable this functionality by specifying the number of unit cells in the X- and Y-directions, denoted by and . The algorithmic treatment is inspired by the work of Huang and Xie [43], where the BESO method is applied to generate periodic lattice structures. In this case, the effective design variables become the thickness of all lattice walls in the periodic unit cell, denoted as . The absorbed energy of each lattice wall in the system is aggregated to the periodic unit cell through the following aggregation matrix :
| (10) |
where and denote the number of lattice walls in the unit cell and full design space. The nonzero entries in the aggregation matrix indicate which wall entry in the unit cell does the current wall correspond to, and the aggregation operation effectively sums the absorbed energies of all periodic images of a particular wall in the unit cell. The aggregated energy is fed into the thickness update scheme to generate . The complete thickness array can be recovered by the scattering operation:
| (11) |
which enforces that all periodic images of a particular wall in the unit cell must share identical thickness.
2.4 Implementation
The workflow of the LatticeOPT framework is summarized in Alg. (1). To begin the analysis, the user supplies the design space dimensions and the number of periodic unit cells. The user also needs to provide information about the material properties, loading, and BCs in the form of a FE input file compatible with the analysis package of choice. For this work, we have selected Abaqus [24] to be the analysis tool, but we emphasize that the LatticeOPT framework can work with any other FE packages so long as the user provides a compatible FE input file. A linear thickness scaling is applied to the initial thickness distribution to satisfy the volume constraint directly (lines 1-2). The aggregation matrix is formed if the system contains more than one unit cell (lines 3-4). A uniform mesh of the ground lattice structure containing all lattice walls in the system, is generated and added to the FE input file (line 5).
With all the preparation work done, we now begin the optimization. The current thickness distribution is added to the input file, from which a FE simulation is conducted, and the wall energy array is calculated (lines 8-10). Two different performance metrics are calculated for the current design, they are (1) SEA:
| (12) |
and in the presence of material damage (2) mean wall connectedness (MWC):
| (13) |
where denotes the number of layers of finite elements (out of a total of layers) in the Z-direction that remain totally undamaged for lattice wall in the design space. MWC provides a quantitative measure of how much the lattice walls remain interconnected after the applied loading. MWC falls in the range . A lower MWC means that more lattice walls are damaged and become disconnected from their neighbours. Both SEA and MWC are evaluated at the end of the load step.
Following the recommendation in [43], we average the wall energy array in the current iteration with that from the previous iteration to stabilize the evolution (line 12). Note that unlike classical TO, a mesh independence filter is not applied to the energy array, since each lattice wall contains multiple finite elements, and sums the energy contribution of all those elements. Thus is expected to be less prone to mesh dependence. If the structure is periodic, wall energies are aggregated to the unit cell (line 14). Before solving the optimization problem, we set the variables’ bounds based on their current values and the maximum allowable thickness change per iteration, as well as the range of allowable thicknesses (line 16). To solve the nonlinear optimization problem resulted from the thickness updating scheme (line 17), we used the minimize function from Scipy [44], and in particular, the trust region constrained algorithm (trust-constr) [45, 46] is used. It is worth noting that different nonlinear optimizers were tested, such as the sequential least-squares programming (SLSQP), the interior point method (IPOPT) [47] and the method of moving asymptotes (MMA) [48]. It was found that IPOPT and trust-constr gave similar computational performance and were more robust than other methods tested. The trust-constr method was selected for its performance and the advantage that it is a built-in package in Scipy, which is a widely used Python package. Finally, periodic scattering is applied to recover the full thickness distribution if the system is periodic (line 19).
To ensure that the generated designs are manufacturable, we remove walls whose thickness fall below the threshold (line 20). Similar to the soft-kill BESO method [49], we assign a small thickness ( mm) to those ’removed’ walls, instead of actually removing them from the FE model. After wall removal, a linear thickness scaling is again applied to ensure that the thresholded design also satisfies the volume constraint (line 22). Finally, the algorithm checks for convergence by monitoring the maximum thickness change (line 24), and moves on to the next design iteration if convergence is not achieved (line 26).
3 Results and discussion
In this section, we present three numerical examples that showcase the capabilities of LatticeOPT. In the first example, we performed a benchmark test against the HCA framework developed by Hunkeler [29], as well as the commercial TO package LS-OPT [50] studied therein. In the second example, we performed optimization of a square lattice sandwiched between two face sheets, subjected to a blast loading, to maximize its stiffness and minimize damage. In the last example, we repeated example 2, but enforced a 2-by-2 periodic unit cell arrangement. All simulations presented in this section were conducted in Abaqus/Explicit [24] on an Intel i7-11800H processor using 8 cores.
3.1 Benchmark test against HCA and LS-OPT
Hunkeler [29] studied the TO of a long, slender column under dynamic axial compression using a HCA-based algorithm. The column has a cross sectional dimensions of 80-by-100 mm2, and a height of 400 mm. The out-most rectangular boundaries of the column are nondesignable and have a fixed wall thickness of 1.5 mm. The cross section is partitioned into 4 cells in the X direction and 5 cells in the Y direction, leading to a total of 31 designable lattice walls. However, symmetry boundary conditions were used by Hunkeler [29], so only a quarter of the cross section with a total of 10 designable edges were included. The material was aluminum with elasto-plastic material behavior modeled with a rate-independent Mises plasticity model with a piece-wise linear isotropic hardening curve. The hardening curve is provided in Table 1, which was taken from the data in [29] (see Table 5.4 therein). The column was fixed at the bottom, and was subjected to compression by a rigid plate having an initial downward velocity of 5 m/s and a mass of 500 kg. To ensure comparability of results, mesh sizes identical to that in [29] were used to discretize the structure.
| Flow stress (MPa) | 180.0 | 190.0 | 197.0 | 211.5 | 225.8 | 233.6 | 238.5 | 248.5 |
| Equivalent plastic strain | 0.0 | 0.01 | 0.02 | 0.05 | 0.1 | 0.15 | 0.2 | 0.4 |
The original optimization problem studied in [29] was to minimize mass of the structure while maintaining an end displacement of less than 75 mm after 25 ms. However, the author did report structure SEA at 10 ms for the optimized designs generated by HCA and LS-OPT (see Table 5.5 therein). As LatticeOPT focuses more on optimizing for energy absorption and stiffness enhancement instead of controlling end displacement, we reformulated the optimization problem to maximize SEA at 10 ms, subject to a structure mass constraint of 870 g. This target mass is comparable to that of the optimized designs from HCA and LS-OPT, which have masses of 878 and 863 g, respectively (see Table 5.5 therein). Two different TO runs were completed, one with each update schemes presented in Section 2.2, and the maximum allowable iterations was set to 25. The minimum and maximum allowable thicknesses were set to 0.4 mm and 2 mm, respectively.
To confirm comparability of results, the trivial design with only the out-most boundary walls present was simulated, and SEA at 10 ms was found to be 2.09 kJ/kg, very comparable to the 2.01 kJ/kg originally reported in [29]. The small difference can be attributed to the use of symmetry boundary conditions in [29], which resulted in a slightly different deformation.
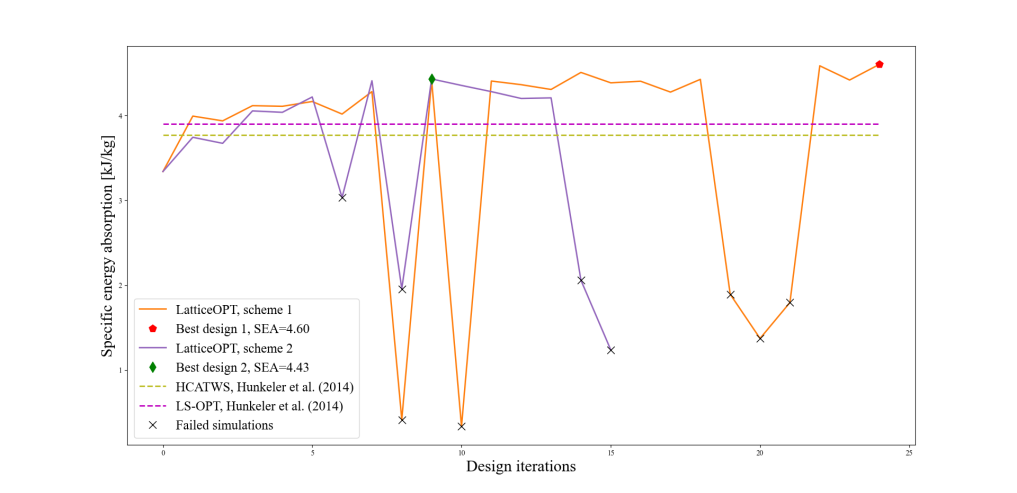
When using a convergence tolerance of 0.01 mm (see line 24 of Alg. (1)), thickness update scheme 1 did not converge on a design and ran the full 25 design iterations, while update scheme 2 converged after 16 iterations. The SEA evolution histories for both update schemes, along with those from HCA and LS-OPT, are shown in Fig. 2. Note that the iteration indices in LatticeOPT are zero-based, so the initial design is iteration 0, and the last design iteration is 24 (for a total of 25 iterations). From the evolution history, we see that neither of the thickness update schemes guarantees increment in the objective function as more design iterations are conducted. This is reasonable, as the LatticeOPT framework is heuristic-based instead of gradient-based, so there is no strict guarantee that the objective function will improve every iteration. We also note that due to that large deformation nature of the problem, not all the simulations ran to completion (failed simulations are marked with black crosses in Fig. 2). LatticeOPT does not require the successful completion of the simulation to proceed. In the case of a failed simulation, is simply extracted from the last output step in the simulation output, hence the lower SEA values for the failed iterations. Despite the oscillatory evolution history, we see that both update schemes produced an optimized design that has higher SEA than the best designs from HCA and LS-OPT. In this example, since the mass of the rigid impactor is much larger than the column, the impactor velocity was approximately constant, this loading case can be approximated as a fixed-displacement case. In this scenario, it is obvious from Fig. 2 that the apparent consequence of the thickness update schemes is to maximize structure SEA, which implies that the structure stiffness is also improved. Selected intermediate designs generated by both schemes at different iterations are shown in Fig. 3.
 (a) Scheme 1, iteration 1
|
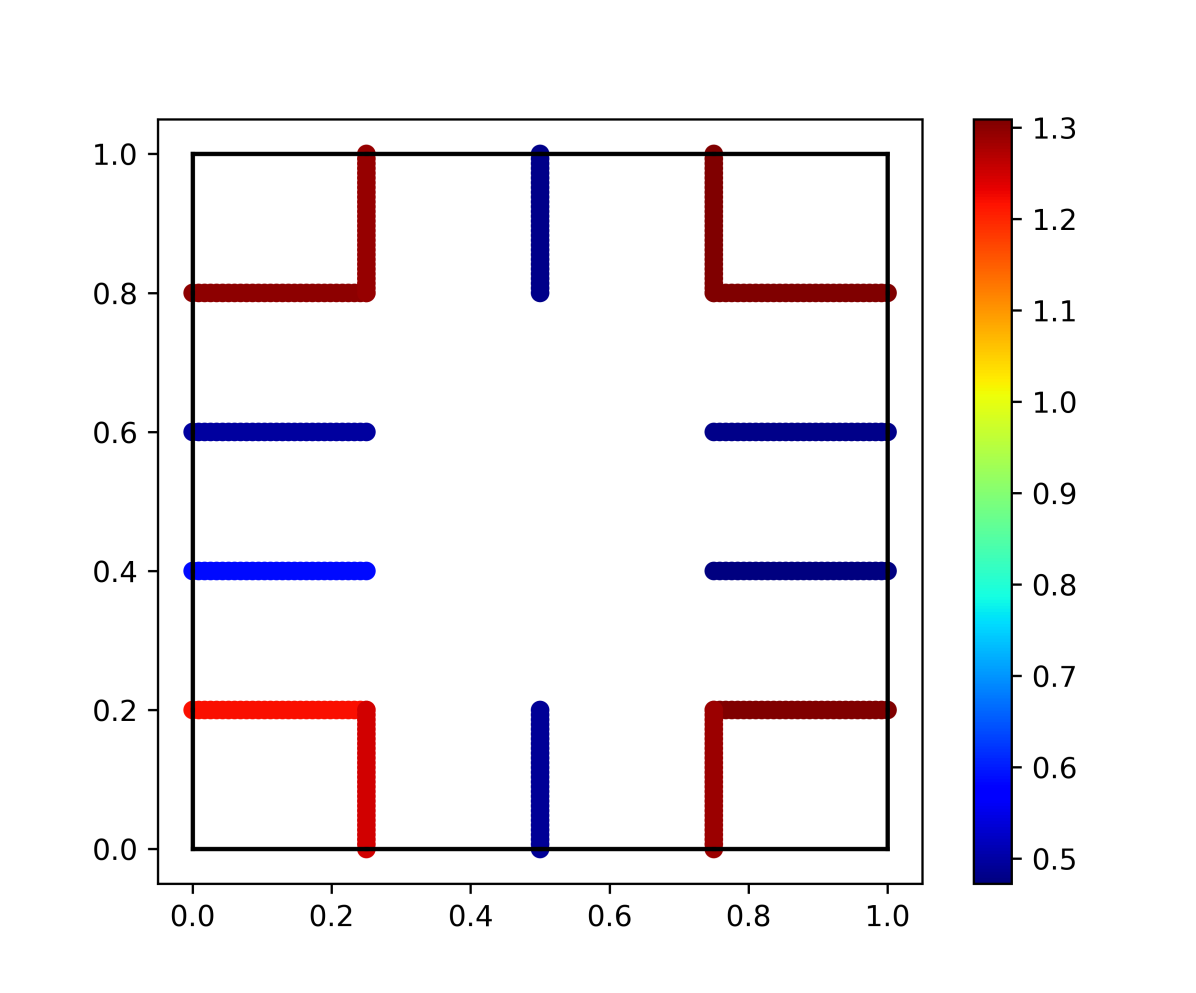 (b) Scheme 1, iteration 12
|
 (c) Scheme 1, iteration 24 ∗
|
 (d) Scheme 2, iteration 1
|
 (e) Scheme 2, iteration 9 ∗
|
 (f) Scheme 2, iteration 15
|
From Fig. 3, we see that both update schemes quickly removed lattice walls near the center of the column. As the optimization progressed, lattice walls on the four corners of the rectangular column were thickened, and this trend continued to the end of the optimization, where they became the only remaining lattice walls in the designable space. This design feature is consistent with the best designs generated from HCA (see Figure 5.35 therein) as well as LS-OPT (see Figure 5.41 therein). The trend where the corner walls get strengthened is also consistent with the findings described in the work of Kim et al. [51], which found this to be an effective strategy for increasing SEA. We also note that our generated designs are asymmetric due to the lack of symmetry boundary conditions, but this is considered more realistic as a long, slender column tends to buckle in compression, thus breaking the plane of symmetry. The larger design space (31 walls in our case vs. 10 in [29]) is likely the reason for the higher SEA of the optimized designs generated from LatticeOPT.
Finally, it is worth highlighting the effectiveness of LatticeOPT: both update schemes were able to generate high SEA designs with 25 or less FE simulations. As a comparison, the best HCA design was found after 84 simulations, and the best LS-OPT design after 187 simulations. The ability of LatticeOPT to generate optimized designs effectively is vital when the design space is large and results in an expensive FE simulation.
3.2 Optimization of a lattice-filled sandwich panel under blast loading
In the second example, a square lattice with side length of 100 mm and a height of 8.5 mm was considered. Two square face sheets with a side length of 105 mm and a thickness of 2.5 mm were placed on the top and bottom ends of the lattice, and perfect bonding was assumed between the lattice core and face sheets. The assembly was held fixed at the outer region defined by an offset width of 6.07 mm. Taking the center of the face sheet as the origin, 8 g of TNT was placed at position (15,15) mm with a stand-off distance of 19 mm from the top surface of the top face sheet. The blast loading generated by the TNT was modeled using the CONWEP model [52], and the simulation duration is 0.1 ms. The material of all components was Ti-6Al-4V. Due to the complex and dynamic nature of the applied loading, we used the rate-dependent Johnson-Cook plasticity and damage models to capture its material behavior. Key parameters for the model were adapted from the work of Wang and Shi [53] (see Table 2 therein), and are presented in Table 2. Fig. 4a depicts the applied BCs and loads.
| Johnson-Cook plasticity model | ||||||||||||||||||||
|---|---|---|---|---|---|---|---|---|---|---|---|---|---|---|---|---|---|---|---|---|
| Name |
|
|
|
|
|
|||||||||||||||
| Value | 1098 | 1092 | 0.93 | 0.014 | 1.1 | |||||||||||||||
| Johnson-Cook damage model | ||||||||||||||||||||
| Name | ||||||||||||||||||||
| Value | -0.09 | 0.27 | 0.48 | 0.014 | 3.87 | |||||||||||||||
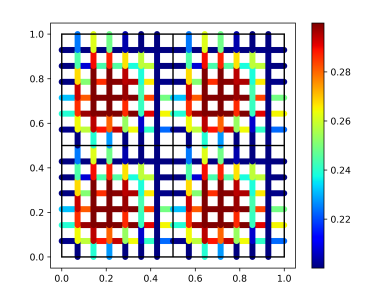
The lattice cross section was partitioned into 14 cells in the X- and Y-directions, and the out-most boundaries were nondesignable with a constant thickness of 0.5 mm. The initial thickness distribution is a uniform wall thickness of 0.25 mm. The optimization used the first thickness update scheme and maintained a mass identical to the initial design. Fig. 4b depicts the deformation and equivalent plastic strain distribution on the initial lattice design at the end of the simulation.

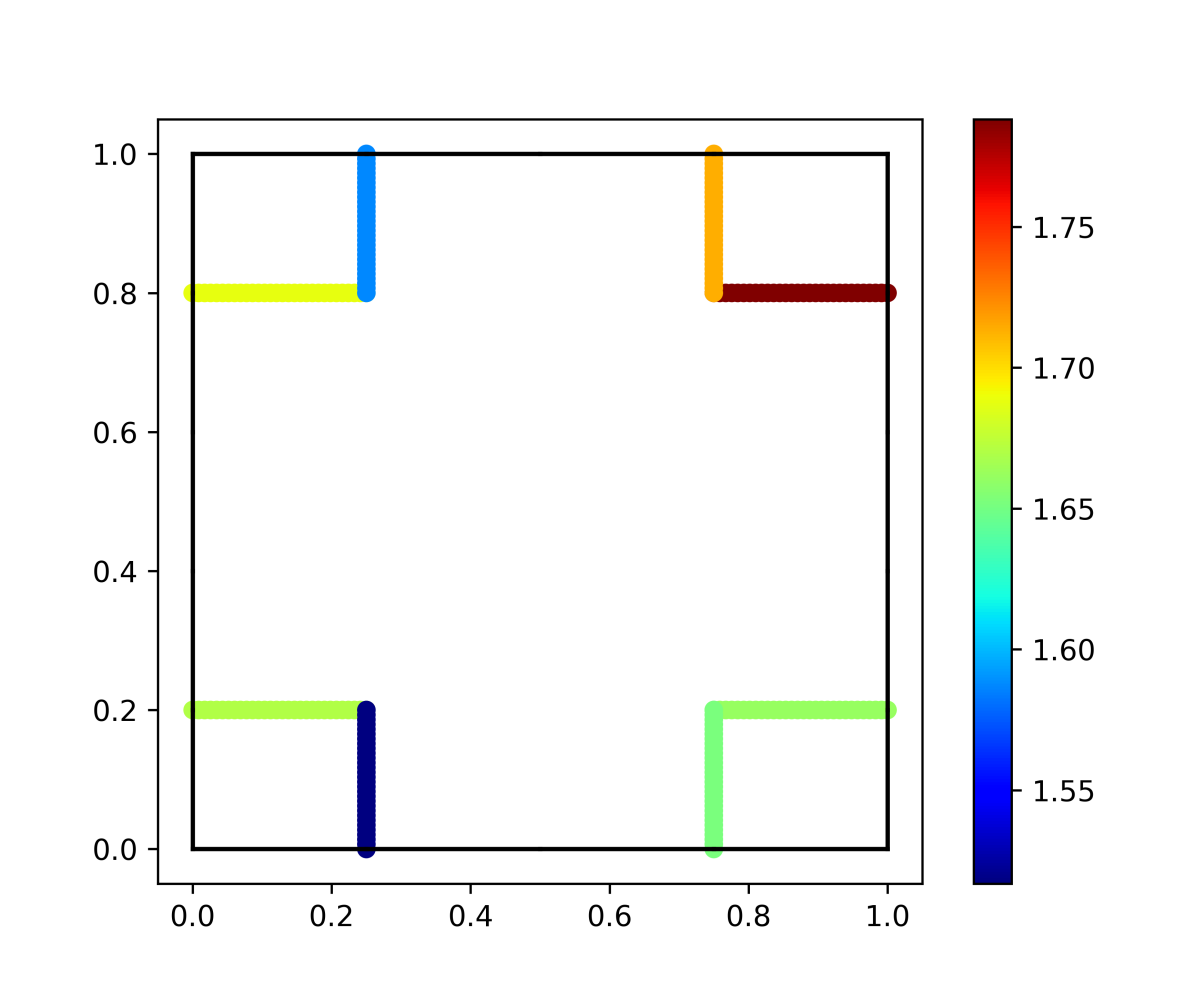
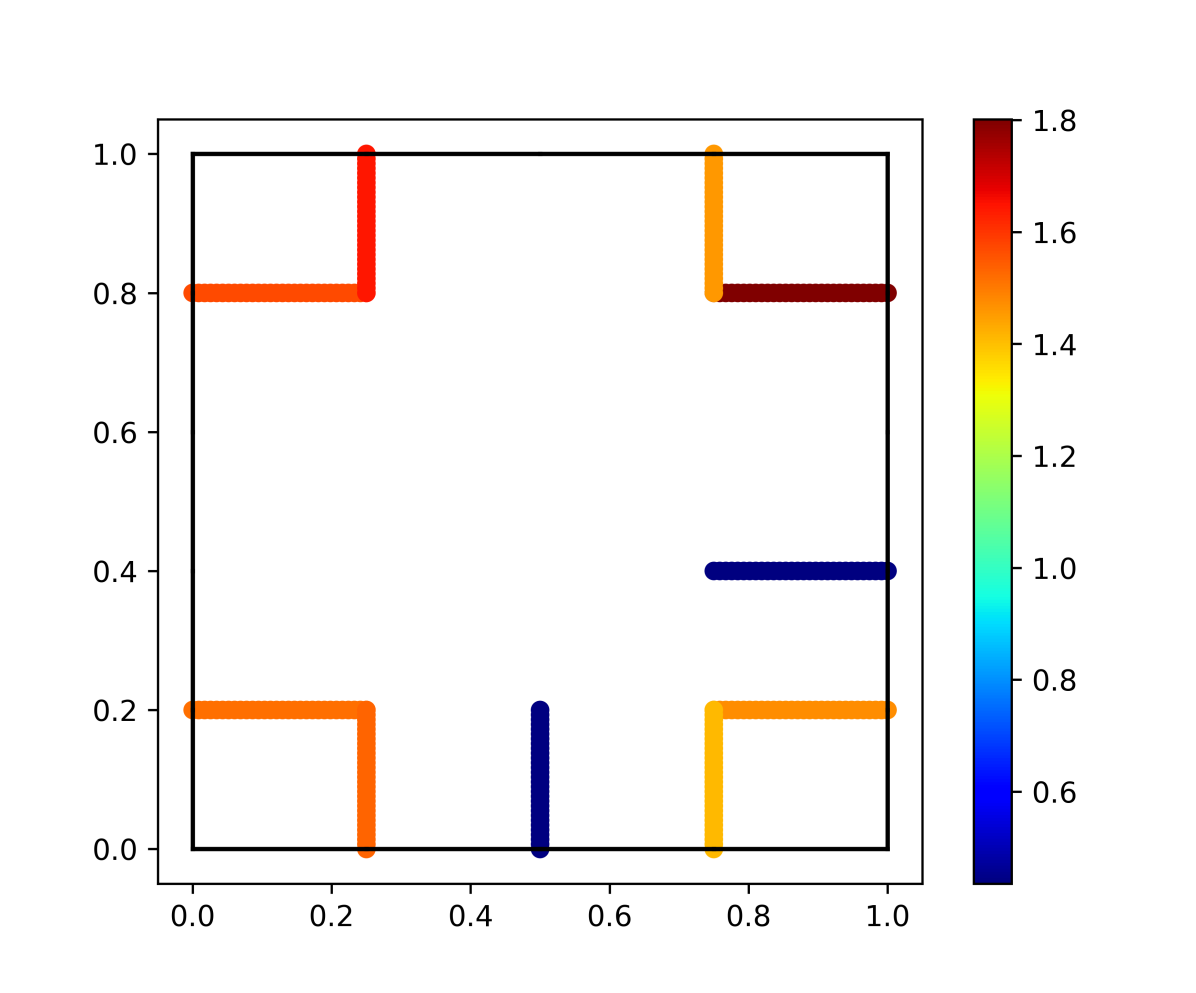
The thickness update scheme did not converge on a design within the 0.01 mm tolerance, and ran the entire 25 design iterations. The intermediate designs generated by LatticeOPT are shown in Fig. 5. We clearly see that the update scheme decided to strengthen walls near the blast center, and quickly removed walls at the lower left corner, which were far away from the blast center. However, it is interesting to note that the top and right edges immediately connecting the lattice walls under the fixture were assigned the highest thickness (see Fig. 5d), which helps with connecting the center of the lattice structure to the surrounding fixtures to prevent shear failure at the edge of the fixture. We also noticed that the design topology stabilizes after about 13 iterations, and only the wall thicknesses fluctuated.
 (a) Iteration 1
|
 (b) Iteration 3
|
 (c) Iteration 12
|
 (d) Iteration 24 ∗
|
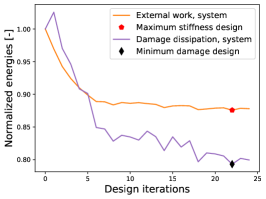
For a critical evaluation of performance, we first investigate the lattice core, excluding the face sheets. For easiness of comparison, we normalized all energy quantities with the corresponding values of the initial design. Fig. 6 shows how the normalized energies and the MWC (defined in Eq. (13)) at four different time points evolved as the design optimization progressed.
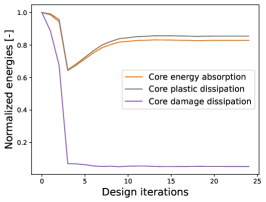
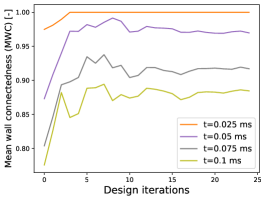
From Fig. 6a, we see that as the design optimization progressed, the damage sustained by the lattice core was greatly reduced: the damage energy at iteration 24 was about 5.5% of that in the initial design. Mitigation of core damage is also evident in Fig. 6b, where we see that the MWC at four different time points during the blast all showed an increasing trend with design iterations (a higher MWC indicates more walls remain interconnected). However, when inspecting the core energy absorption, we noticed that unlike the first example, the SEA at the end of the optimization is less than the initial design. This indicates that the apparent consequence of the thickness update schemes is not always to maximize structure SEA, and its implication will be clear once we inspect the sandwich panel system as a whole (including the face sheets).
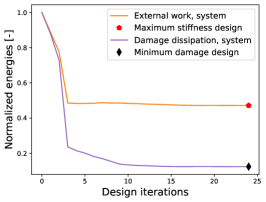
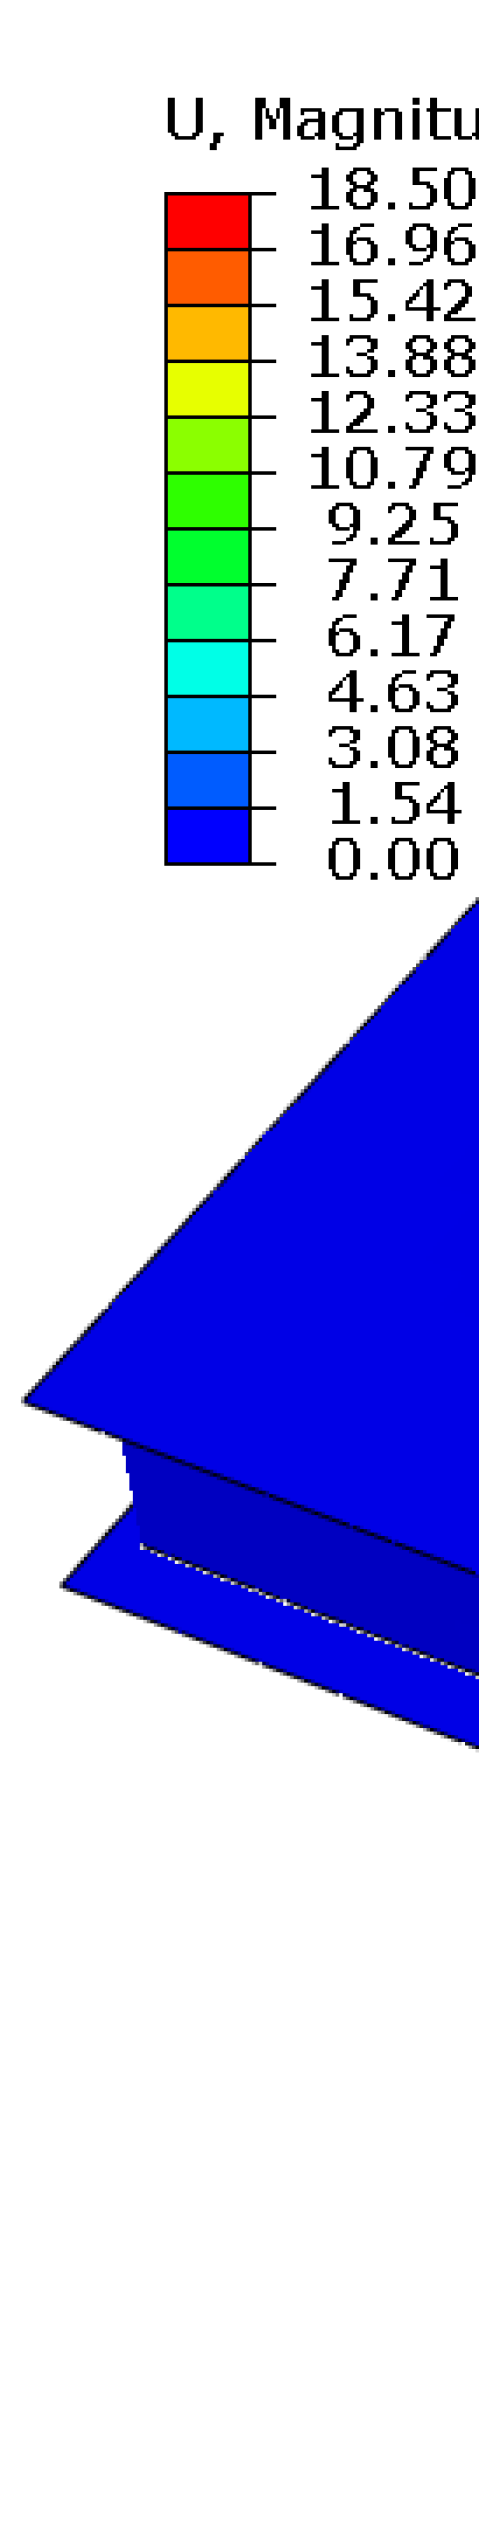
For the sandwich panel system, we present the normalized total external work as well as damage dissipation in Fig. 6c, where it is evident that both the external work and damage dissipation decreased monotonically. The external work and damage dissipation at the last iteration was 47% and 12.5% of their initial values, respectively. Under a fixed load, decreasing external work is evidence that the system stiffness is increasing. Therefore, Fig. 6c elucidates that in the fixed-load scenario, the apparent consequence of the thickness update schemes is to increase system stiffness and minimize material damage. This example again highlights the effectiveness of LatticeOPT: in a case with complex blast loading and a total of 364 designable lattice walls, our framework was able to reduce the sandwich panel damage by 87.5% in merely 25 design iterations. For a direct visual comparison of system stiffness and sustained damage, the deformed shape of the sandwich panel was plotted for the initial and optimized designs, shown in Fig. 7.

Finally, it is of practical interest to investigate how different designs respond as the magnitude of the blast load increases. Therefore, we gradually increased the normalized load magnitude from 1 to 2, and tested the initial lattice design, as well as design iterations 3 (has lowest SEA) and 24 (has highest stiffness), the plot of the normalized energies is presented in Fig. 8.
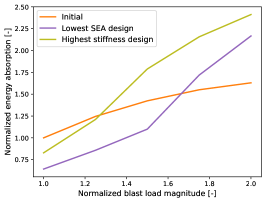
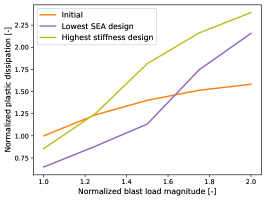
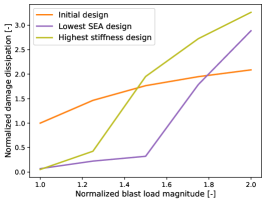
We clearly see that, although the optimized design and the minimum SEA design had low energy absorption at the original load level, they were able to absorb much more energy than the initial design at elevated load magnitudes. At twice the original load magnitude, the optimized design and the minimum SEA design absorbed 48.3% and 32.8% more energy than the initial design. From Fig. 8b and Fig. 8c, it is evident that the increased energy absorption is due to increases in plastic and damage dissipation for the optimized designs. This demonstrates that, besides stiffness enhancement, the optimized designs generated by LatticeOPT are also more robust, meaning that they have potential to absorb more energy should the load magnitude increase.
3.3 Generation of periodic lattices
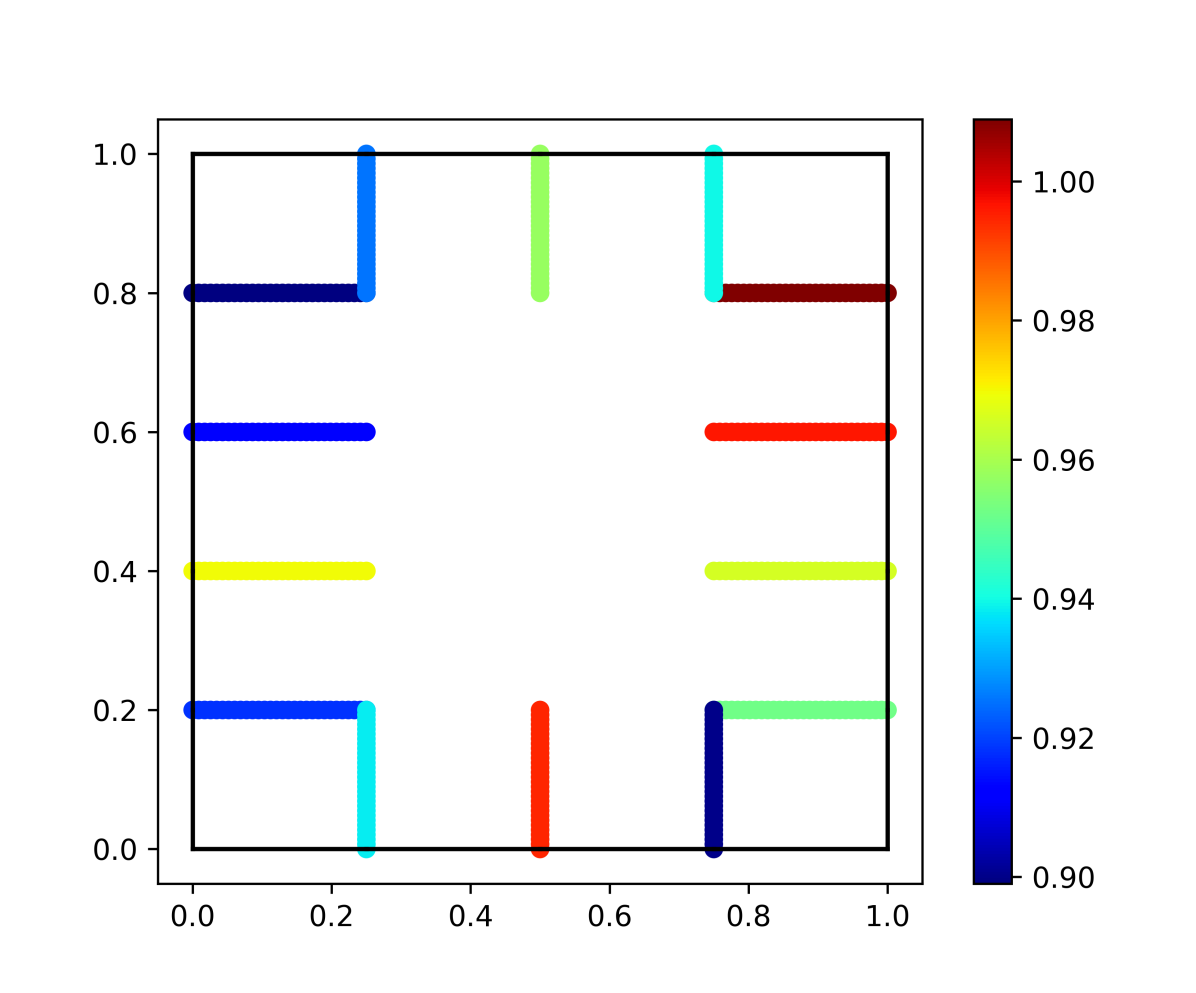
The setup of the third example followed exactly from Section 3.2, except we enforced a 2-by-2 periodic cell arrangement. The total external work and the damage dissipation of the sandwich panel assembly are shown in Fig. 9a, and the designs at iterations 1 and 22 (highest stiffness) are shown in Fig. 9b and Fig. 9c.
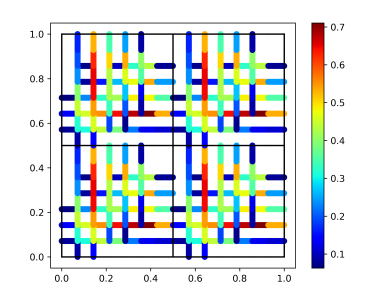
From Fig. 9a, we again confirmed that the apparent consequence of the thickness update scheme in this fixed-load case is to maximize system stiffness and minimize damage. However, we noticed that the periodic design, having a minimum damage of 79.3% of the initial value, is inferior to the free design presented in Section 3.2, which has a minimum damage of only 5.5% of initial value. This is reasonable, as the 2-by-2 periodicity constraint greatly reduced the size of the design space, and a more restrained system typically offers inferior performance compared to a system with more design degrees of freedom (i.e., number of lattice walls). Inspecting the optimized designs, we clearly see the 2-by-2 periodic unit cell arrangement. Note the generated designs are distinct from those in Section 3.2 due to this added constraint.
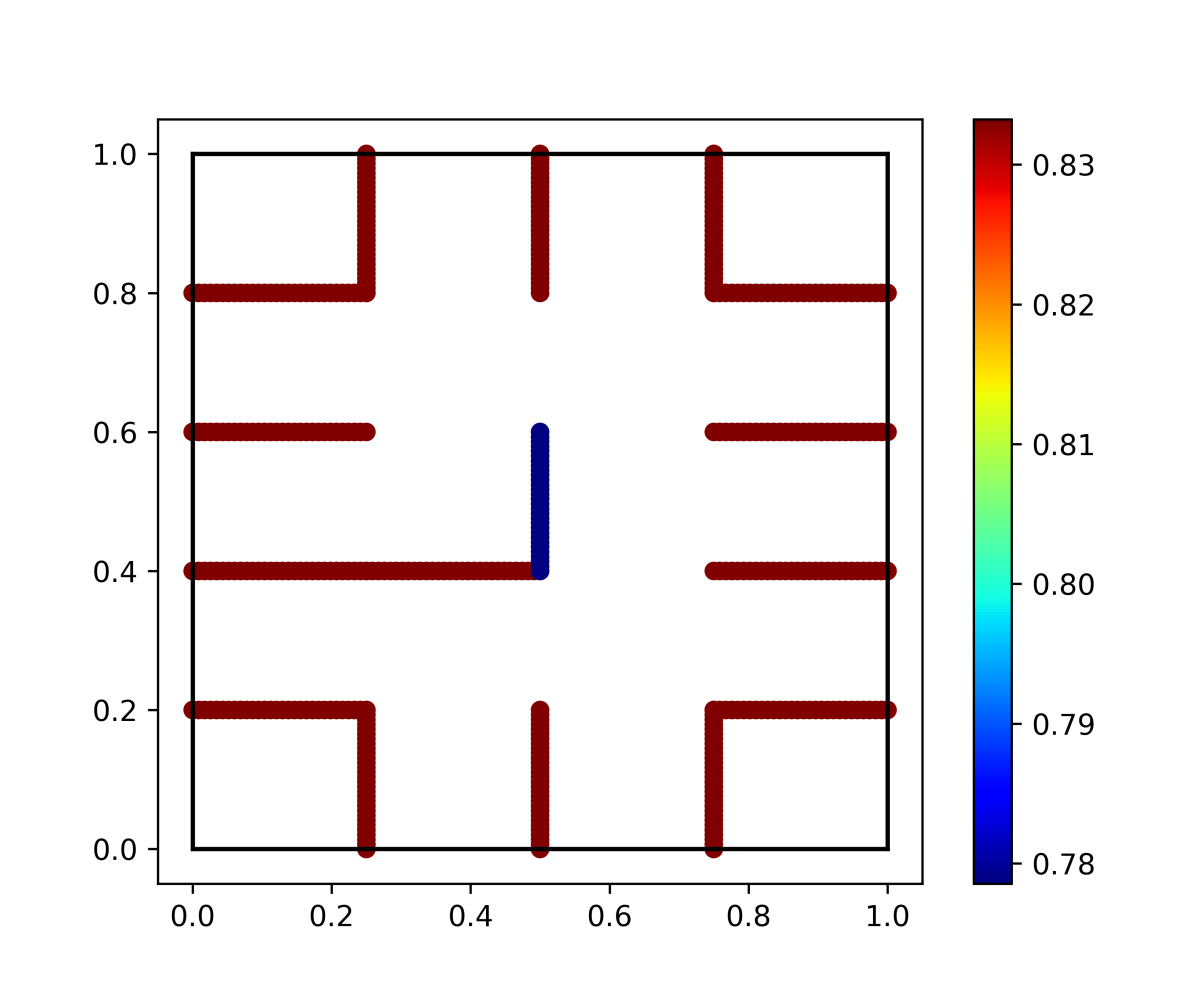
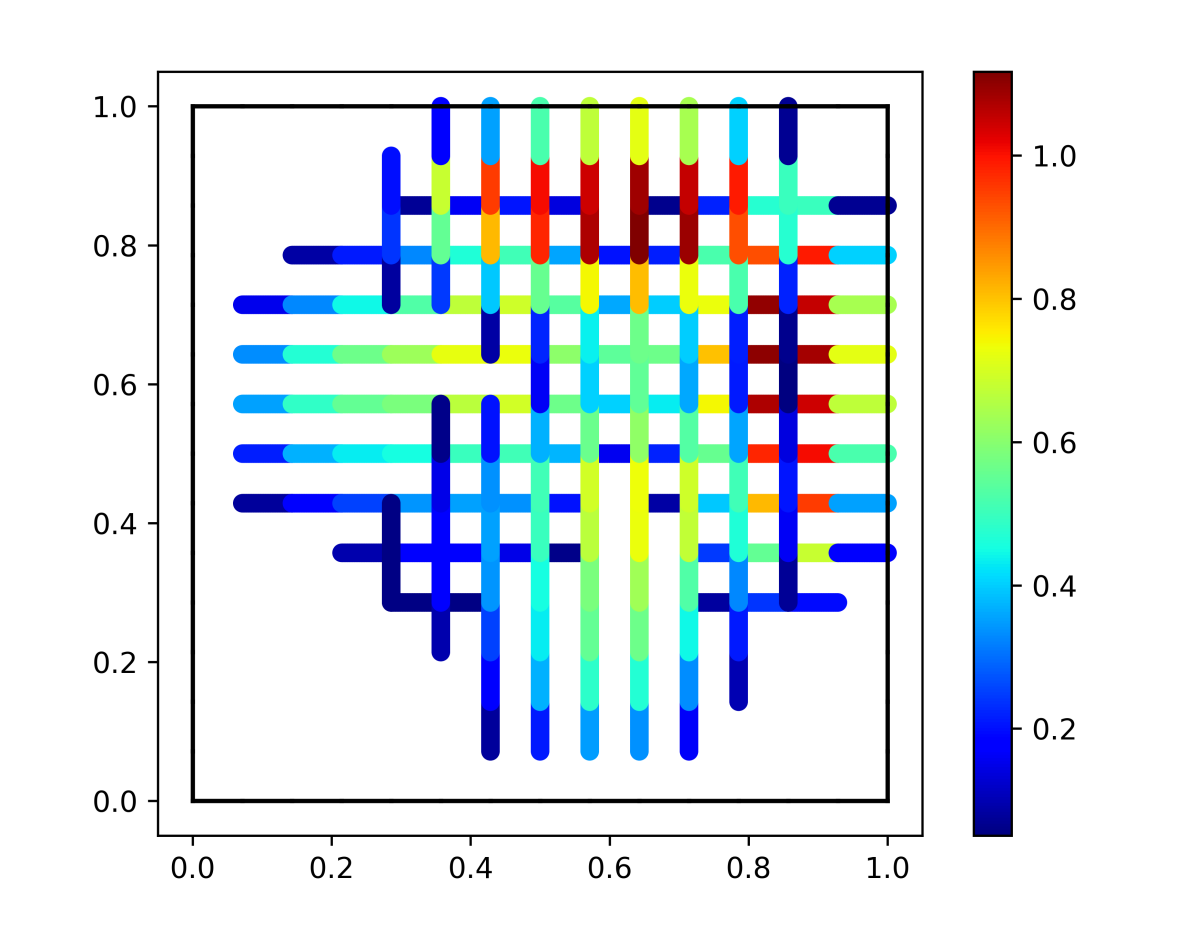
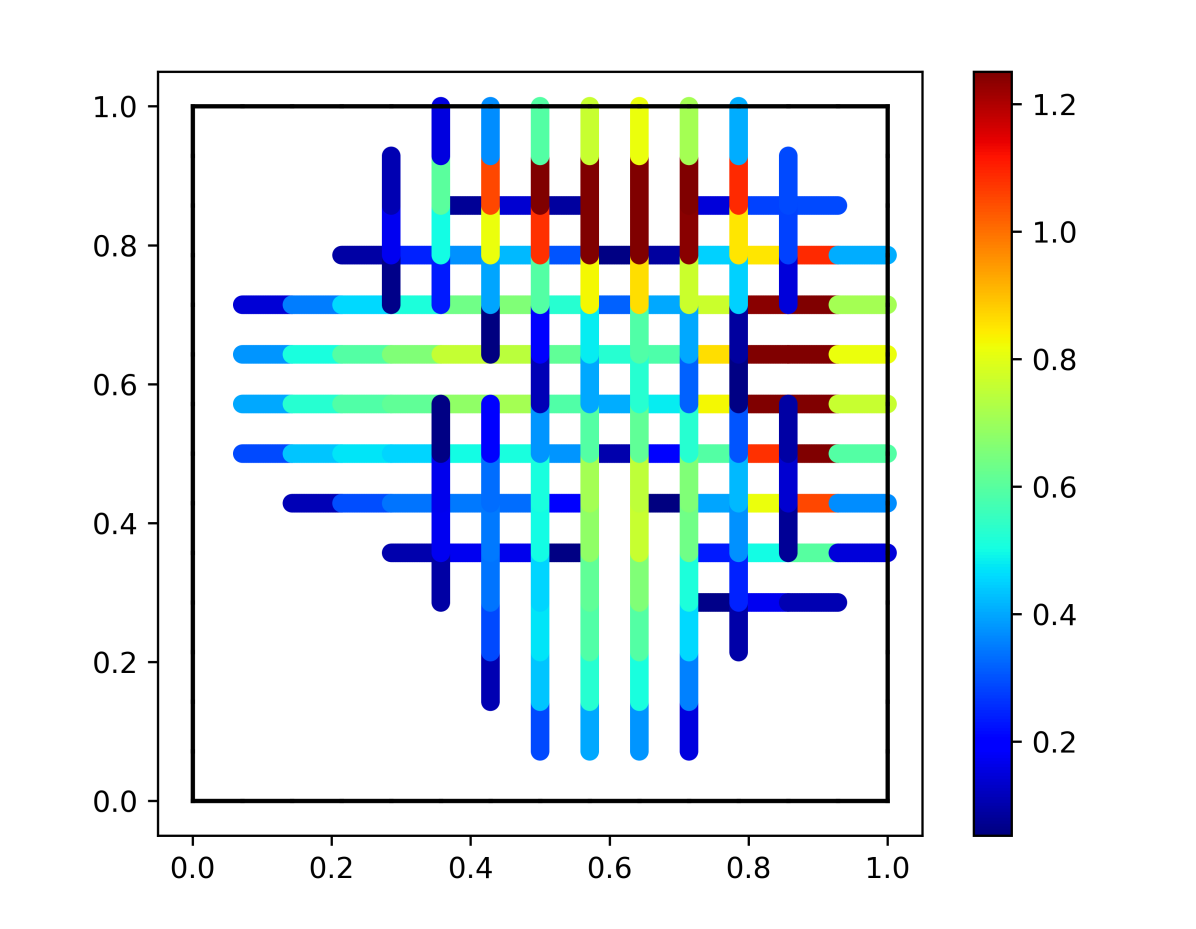
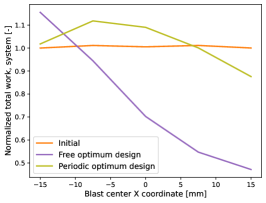
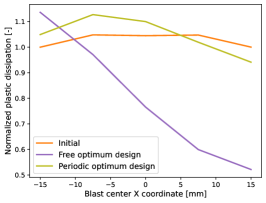
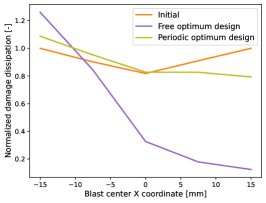
Finally, to evaluate the robustness of the periodic design, we gradually moved the location of the blast center from (15,15) mm to (-15,-15) mm, while maintaining the same blast load magnitude. We tested the initial design, and the final optimized designs from the free optimization (Section 3.2) and the periodic optimization (Section 3.3). The plot of the normalized energy quantities for the sandwich panel system (including the face sheets) is presented in Fig. 10. Selected surface plots of displacement of the top face sheet are presented in Fig. 11.
|
|
|
|
|
|
|
|
|
|
|
|
From Fig. 10, we see that the periodic optimized design only performed better than the initial lattice design for the last two cases, where the blast center remained close to its original location. As the blast center shifted further away from its original position, the initial design outperformed the periodic optimized, showing higher stiffness (indicated by lower external work) and less plastic and damage dissipation. Interestingly, we noticed that the free optimized design, although optimized with a blast center location of (15,15) mm, remained largely better than both the initial and periodic optimized designs, especially in terms of the high structure stiffness and low material damage. The free optimized design was only inferior to the other designs for a blast center location of (-15,-15) mm, which is reasonable since that region of the face sheet was poorly supported by the lattice core (see the lattice wall thickness distribution in Fig. 5d). The surface displacement plots in Fig. 11 further confirms the trends seen in Fig. 10. We observe that both optimized designs are effective in reducing the top face sheet displacements at the original blast center location (third column of Fig. 11). However, as the blast shifted to the center of the face sheet (center column of Fig. 11), the periodic optimized design became less effective and started showing top face sheet fracture, which was absent from the free optimized design. When the blast center shifted to (-15,-15) mm (first column in Fig. 11), we notice a new failure mode emerged for the free optimized design, where both the top and bottom face sheets sheared off the fixed edges due to the lack of underlying lattice core support.
Evidence presented in both Fig. 10 and Fig. 11 indicate that the periodic optimized design is inferior to the free optimized design. This observation is reasonable for the specific setup of these two examples, where the periodic optimization case had a much smaller design space compared to the free optimization case (84 vs. 364 designable lattice walls). Optimized design performance typically deteriorates as the available design space become smaller and more restricted. If we were to increase the design space by increasing the number of lattice walls in one periodic unit cell, the optimized design is expected to provide better performance than the current one.
4 Conclusions and future work
In this work, a heuristic topology optimization framework for thin-walled lattice structure is proposed and tested. The framework relies on a heuristic thickness update scheme that is based on the idea of equalization of energy density across all lattice walls. The thickness update is achieved by solving a nonlinear optimization defined by the update scheme. Two novel thickness update schemes are presented, one being a direct minimization of the scatter in energy density, and the other is inspired by the BESO method. The framework allows the specification of minimum and maximum allowable wall thicknesses for manufacturing considerations, and lattice walls with thickness below the minimum threshold are removed from the structure. The framework also allows for the generation of periodic lattice structures through the use of periodic aggregation and scattering operators, which ensures the periodicity of the generated design. The proposed framework terminates either when the thickness change is below a minimum threshold, or when the maximum number of design iterations is reached.
Three numerical examples are presented to demonstrate the capabilities of the proposed framework. In the first example, we performed a benchmark test with the previous HCA-based topology optimization framework by [29], where both thickness update schemes were capable of generating designs with higher specific energy absorption than the optimized designs in [29]. In the second example, we performed topology optimization for a sandwich panel under blast loading, considering material damage behavior. It was found that the proposed thickness update schemes were effective in reducing damage and increasing stiffness of the sandwich panel, and when the load magnitude is increased, increasing specific energy absorption. The last example follows from the previous one, except we generated a periodic lattice. We observed improved stiffness and reduced damage compared to the initial design, but the performance of the periodic design was inferior to the free design. In all three examples, the proposed framework was able to greatly improve key performance metrics such as specific energy absorption, stiffness and material damage in about 25 design iterations, and in the first example, it is more efficient than the HCA framework proposed in [29] and the commercial software LS-OPT. Although all simulations presented in this work were conducted in Abaqus [24], the proposed framework can be easily adapted to work with other finite element software.
We conclude that the proposed topology optimization framework can effectively generate optimized thin-walled lattice structures under different loading conditions. The high effectiveness and the ability to handle complex loading and material behavior renders our framework a suitable tool to generate optimized lattice structures for energy absorbing applications and for improving crashworthiness of components.
In future work, we will focus on validating the generated designs through experiments. In addition, it is known in the literature that the material properties of additively manufactured materials are typically depend on the feature size (e.g., wall thickness and strut diameter) [54, 55, 56]. Therefore, it is of interest to leverage the current framework to study how the size dependence affects the optimized lattice designs at different length scales. The current framework also provides a physics-informed way to generate designs with high performance for training of machine learning frameworks, which can be a more suitable alternative to the random combinatorial generation method used in our previous work [57].
Replication of results
The data and source code that support the findings of this study can be found at: https://github.com/Jasiuk-Research-Group/LatticeOPT. Note to editor and reviewers: the link above will be made public upon the publication of this manuscript. During the review period, the data and source code can be made available upon request to the corresponding author.
Conflict of interest
The authors declare that they have no conflict of interest.
Acknowledgements
We (I. J.) acknowledges the support of the Army Research Office contract (No. W 911NF-18-2-0067) and the National Science Foundation grant (MOMS-1926353).
CRediT author contributions
Junyan He: Conceptualization, Methodology, Software, Formal analysis, Investigation, Data Curation, Writing - Original Draft. Shashank Kushwaha: Methodology, Investigation, Writing - Original Draft. Diab Abueidda: Supervision, Writing - Review & Editing. Iwona Jasiuk: Supervision, Resources, Writing - Review & Editing, Funding Acquisition.
References
- Sun et al. [2010] Guangyong Sun, Guangyao Li, Shujuan Hou, Shiwei Zhou, Wei Li, and Qing Li. Crashworthiness design for functionally graded foam-filled thin-walled structures. Materials Science and Engineering: A, 527(7-8):1911–1919, 2010.
- Yin et al. [2014] Hanfeng Yin, Guilin Wen, Zhibo Liu, and Qixiang Qing. Crashworthiness optimization design for foam-filled multi-cell thin-walled structures. Thin-Walled Structures, 75:8–17, 2014.
- San Ha and Lu [2020] Ngoc San Ha and Guoxing Lu. Thin-walled corrugated structures: A review of crashworthiness designs and energy absorption characteristics. Thin-Walled Structures, 157:106995, 2020.
- Duddeck et al. [2016] Fabian Duddeck, Stephan Hunkeler, Pablo Lozano, Erich Wehrle, and Duo Zeng. Topology optimization for crashworthiness of thin-walled structures under axial impact using hybrid cellular automata. Structural and Multidisciplinary Optimization, 54(3):415–428, 2016.
- Zhu et al. [2020] Guohua Zhu, Qiang Yu, Xuan Zhao, Lulu Wei, and Hao Chen. Energy-absorbing mechanisms and crashworthiness design of cfrp multi-cell structures. Composite Structures, 233:111631, 2020.
- Baroutaji et al. [2017] Ahmad Baroutaji, Mustafa Sajjia, and Abdul-Ghani Olabi. On the crashworthiness performance of thin-walled energy absorbers: recent advances and future developments. Thin-Walled Structures, 118:137–163, 2017.
- Fu et al. [2019] Jie Fu, Qiang Liu, Kangmin Liufu, Yuanchang Deng, Jianguang Fang, and Qing Li. Design of bionic-bamboo thin-walled structures for energy absorption. Thin-Walled Structures, 135:400–413, 2019.
- Sun et al. [2014] Guangyong Sun, Fengxiang Xu, Guangyao Li, and Qing Li. Crashing analysis and multiobjective optimization for thin-walled structures with functionally graded thickness. International Journal of Impact Engineering, 64:62–74, 2014.
- Zarei and Kröger [2007] HR Zarei and M Kröger. Crashworthiness optimization of empty and filled aluminum crash boxes. International Journal of Crashworthiness, 12(3):255–264, 2007.
- Wu et al. [2016] Suzhen Wu, Gang Zheng, Guangyong Sun, Qiang Liu, Guangyao Li, and Qing Li. On design of multi-cell thin-wall structures for crashworthiness. International Journal of Impact Engineering, 88:102–117, 2016.
- Abramowicz [2003] W Abramowicz. Thin-walled structures as impact energy absorbers. Thin-walled structures, 41(2-3):91–107, 2003.
- Jung and Gea [2004] Daeyoon Jung and Hae Chang Gea. Topology optimization of nonlinear structures. Finite Elements in Analysis and Design, 40(11):1417–1427, 2004.
- Clausen et al. [2015] Anders Clausen, Fengwen Wang, Jakob S Jensen, Ole Sigmund, and Jennifer A Lewis. Topology optimized architectures with programmable poisson’s ratio over large deformations. Adv. Mater, 27(37):5523–5527, 2015.
- Wallin et al. [2016] Mathias Wallin, Viktor Jönsson, and Eric Wingren. Topology optimization based on finite strain plasticity. Structural and multidisciplinary optimization, 54(4):783–793, 2016.
- Abueidda et al. [2021] Diab W Abueidda, Ziliang Kang, Seid Koric, Kai A James, and Iwona M Jasiuk. Topology optimization for three-dimensional elastoplastic architected materials using a path-dependent adjoint method. International Journal for Numerical Methods in Engineering, 122(8):1889–1910, 2021.
- Maute et al. [1998] Kurt Maute, Stefan Schwarz, and Ekkehard Ramm. Adaptive topology optimization of elastoplastic structures. Structural optimization, 15(2):81–91, 1998.
- Verbart et al. [2016] Alexander Verbart, Matthijs Langelaar, and Fred van Keulen. Damage approach: A new method for topology optimization with local stress constraints. Structural and Multidisciplinary Optimization, 53(5):1081–1098, 2016.
- Li et al. [2017] Lei Li, Guodong Zhang, and Kapil Khandelwal. Topology optimization of energy absorbing structures with maximum damage constraint. International Journal for Numerical Methods in Engineering, 112(7):737–775, 2017.
- James and Waisman [2015] Kai A James and Haim Waisman. Topology optimization of structures under variable loading using a damage superposition approach. International Journal for Numerical Methods in Engineering, 101(5):375–406, 2015.
- Tsay and Arora [1990] JJ Tsay and JS Arora. Nonlinear structural design sensivitity analysis for path dependent problems. part 1: General theory. Computer Methods in Applied Mechanics and Engineering, 81(2):183–208, 1990.
- Alberdi et al. [2018] Ryan Alberdi, Guodong Zhang, Lei Li, and Kapil Khandelwal. A unified framework for nonlinear path-dependent sensitivity analysis in topology optimization. International Journal for Numerical Methods in Engineering, 115(1):1–56, 2018.
- Farrell et al. [2013] Patrick E Farrell, David A Ham, Simon W Funke, and Marie E Rognes. Automated derivation of the adjoint of high-level transient finite element programs. SIAM Journal on Scientific Computing, 35(4):C369–C393, 2013.
- Sigmund [2011] Ole Sigmund. On the usefulness of non-gradient approaches in topology optimization. Structural and Multidisciplinary Optimization, 43(5):589–596, 2011.
- SIMULIA [2020] SIMULIA. Abaqus, 2020.
- Murray et al. [2007] Yvonne D Murray et al. Users manual for ls-dyna concrete material model 159. Technical report, United States. Federal Highway Administration. Office of Research …, 2007.
- Lee and Park [2015] Hyun-Ah Lee and Gyung-Jin Park. Nonlinear dynamic response topology optimization using the equivalent static loads method. Computer Methods in Applied Mechanics and Engineering, 283:956–970, 2015.
- Jang et al. [2012] Hwan-Hak Jang, HA Lee, JY Lee, and GJ Park. Dynamic response topology optimization in the time domain using equivalent static loads. AIAA journal, 50(1):226–234, 2012.
- Hunkeler et al. [2013] Stephan Hunkeler, Fabian Duddeck, and Milan Rayamajhi. Topology optimisation method for crashworthiness design using hybrid cellular automata and thin-walled ground structures. In 9th Europ LS-DYNA conf. Manchester, 2013.
- Hunkeler [2014] Stephan Hunkeler. Topology Optimisation in Crashworthiness Design via Hybrid Cellular Automata for Thin Walled Structures. PhD thesis, Queen Mary University of London, 2014.
- Zeng and Duddeck [2017] Duo Zeng and Fabian Duddeck. Improved hybrid cellular automata for crashworthiness optimization of thin-walled structures. Structural and Multidisciplinary Optimization, 56(1):101–115, 2017.
- Kurtaran et al. [2002] H Kurtaran, A Eskandarian, D Marzougui, and NE Bedewi. Crashworthiness design optimization using successive response surface approximations. Computational mechanics, 29(4):409–421, 2002.
- Avalle et al. [2002] M Avalle, G Chiandussi, and G Belingardi. Design optimization by response surface methodology: application to crashworthiness design of vehicle structures. Structural and Multidisciplinary Optimization, 24(4):325–332, 2002.
- Liu et al. [2019a] Kai Liu, Tong Wu, Duane Detwiler, Jitesh Panchal, and Andres Tovar. Design for crashworthiness of categorical multimaterial structures using cluster analysis and bayesian optimization. Journal of Mechanical Design, 141(12), 2019a.
- Liu et al. [2021] Jiao Liu, Yong Wang, Guangyong Sun, and Tong Pang. Multisurrogate-assisted ant colony optimization for expensive optimization problems with continuous and categorical variables. IEEE Transactions on Cybernetics, 2021.
- Liu et al. [2019b] Tangying Liu, Guangyong Sun, Jianguang Fang, Jingtao Zhang, and Qing Li. Topographical design of stiffener layout for plates against blast loading using a modified ant colony optimization algorithm. Structural and Multidisciplinary Optimization, 59(2):335–350, 2019b.
- Gao et al. [2019] Dawei Gao, Xiangyang Li, and Haifeng Chen. Application of improved particle swarm optimization in vehicle crashworthiness. Mathematical problems in Engineering, 2019, 2019.
- Soto and Diaz [1999] Ciro A Soto and Alejandro R Diaz. Basic models for topology design optimization in crashworthiness problems. In International Design Engineering Technical Conferences and Computers and Information in Engineering Conference, volume 19715, pages 1055–1064. American Society of Mechanical Engineers, 1999.
- Rozvany [2009] George IN Rozvany. A critical review of established methods of structural topology optimization. Structural and multidisciplinary optimization, 37(3):217–237, 2009.
- Frazier [2014] William E Frazier. Metal additive manufacturing: a review. Journal of Materials Engineering and performance, 23(6):1917–1928, 2014.
- Leiva [2004] Juan Leiva. Topometry optimization: a new capability to perform element by element sizing optimization of structures. In 10th AIAA/ISSMO multidisciplinary analysis and optimization conference, page 4595, 2004.
- Huang and Xie [2007] Xiaodong Huang and YM Xie. Convergent and mesh-independent solutions for the bi-directional evolutionary structural optimization method. Finite elements in analysis and design, 43(14):1039–1049, 2007.
- Huang et al. [2007] X Huang, Y M Xie, and G Lu. Topology optimization of energy-absorbing structures. International Journal of Crashworthiness, 12(6):663–675, 2007. doi: 10.1080/13588260701497862. URL https://doi.org/10.1080/13588260701497862.
- Huang and Xie [2008] Xiaodong Huang and YM Xie. Optimal design of periodic structures using evolutionary topology optimization. Structural and Multidisciplinary Optimization, 36(6):597–606, 2008.
- Virtanen et al. [2020] Pauli Virtanen, Ralf Gommers, Travis E. Oliphant, Matt Haberland, Tyler Reddy, David Cournapeau, Evgeni Burovski, Pearu Peterson, Warren Weckesser, Jonathan Bright, Stéfan J. van der Walt, Matthew Brett, Joshua Wilson, K. Jarrod Millman, Nikolay Mayorov, Andrew R. J. Nelson, Eric Jones, Robert Kern, Eric Larson, C J Carey, İlhan Polat, Yu Feng, Eric W. Moore, Jake VanderPlas, Denis Laxalde, Josef Perktold, Robert Cimrman, Ian Henriksen, E. A. Quintero, Charles R. Harris, Anne M. Archibald, Antônio H. Ribeiro, Fabian Pedregosa, Paul van Mulbregt, and SciPy 1.0 Contributors. SciPy 1.0: Fundamental Algorithms for Scientific Computing in Python. Nature Methods, 17:261–272, 2020. doi: 10.1038/s41592-019-0686-2.
- Conn et al. [2000] Andrew R Conn, Nicholas IM Gould, and Philippe L Toint. Trust region methods. SIAM, 2000.
- Byrd et al. [1987] Richard H Byrd, Robert B Schnabel, and Gerald A Shultz. A trust region algorithm for nonlinearly constrained optimization. SIAM Journal on Numerical Analysis, 24(5):1152–1170, 1987.
- Biegler and Zavala [2009] Lorenz T Biegler and Victor M Zavala. Large-scale nonlinear programming using ipopt: An integrating framework for enterprise-wide dynamic optimization. Computers & Chemical Engineering, 33(3):575–582, 2009.
- Svanberg [1987] Krister Svanberg. The method of moving asymptotes—a new method for structural optimization. International journal for numerical methods in engineering, 24(2):359–373, 1987.
- Yang et al. [1999] XY Yang, YM Xie, GP Steven, and OM Querin. Bidirectional evolutionary method for stiffness optimization. AIAA journal, 37(11):1483–1488, 1999.
- Goel et al. [2009] Tushar Goel, Willem Roux, and Nielen Stander. A topology optimization tool for LS-Dyna users: LS-OPT/Topology. In 7th european LS-Dyna conference, pages 14–15, 2009.
- Kim [2002] Heung-Soo Kim. New extruded multi-cell aluminum profile for maximum crash energy absorption and weight efficiency. Thin-Walled Structures, 40(4):311–327, 2002.
- Randers-Pehrson and Bannister [1997] Glenn Randers-Pehrson and Kenneth A Bannister. Airblast loading model for DYNA2D and DYNA3D. Technical report, Army research lab aberdeen proving Ground MD, 1997.
- Wang and Shi [2013] Xuemei Wang and Jun Shi. Validation of Johnson-Cook plasticity and damage model using impact experiment. International Journal of Impact Engineering, 60:67–75, 2013.
- Phutela et al. [2019] Chinmay Phutela, Nesma T Aboulkhair, Christopher J Tuck, and Ian Ashcroft. The effects of feature sizes in selectively laser melted Ti-6Al-4V parts on the validity of optimised process parameters. Materials, 13(1):117, 2019.
- Barba et al. [2020] D Barba, C Alabort, YT Tang, MJ Viscasillas, RC Reed, and E Alabort. On the size and orientation effect in additive manufactured Ti-6Al-4V. Materials & Design, 186:108235, 2020.
- Alghamdi et al. [2021] Ahmad Alghamdi, David Downing, Rance Tino, Abduladheem Almalki, Tobias Maconachie, Bill Lozanovski, Milan Brandt, Ma Qian, and Martin Leary. Buckling phenomena in am lattice strut elements: A design tool applied to Ti-6Al-4V LB-PBF. Materials & Design, 208:109892, 2021.
- He et al. [2022] Junyan He, Shashank Kushwaha, Diab Abueidda, and Iwona Jasiuk. Exploring the structure-property relations of thin-walled, 2d extruded lattices using neural networks, 2022.