GW170817 4.5 years after merger: Dynamical ejecta afterglow constraints
Abstract
GW170817 is the first binary neutron star (NS) merger detected in gravitational waves (GWs) and photons, and so far remains the only GW event of its class with a definitive electromagnetic (EM) counterpart. Radio emission from the structured jet associated with GW170817 has faded below the sensitivity achievable via deep radio observations with the most sensitive radio arrays currently in operation. Hence, we now have the opportunity to probe the radio re-brightening that some models predict, should emerge at late times from the interaction of the dynamically-stripped merger ejecta with the interstellar medium. Here we present the latest results from our deep radio observations of the GW170817 field with the Karl G. Jansky Very Large Array (VLA), 4.5 years after the merger. Our new data at 3 GHz do not show any compelling evidence for emission in excess to the tail of the jet afterglow (Jy), confirming our previous results. We thus set new constraints on the dynamical ejecta afterglow models. These constraints favor single-speed ejecta with energy erg (for an ejecta speed of ), or steeper energy-speed distributions of the kilonova ejecta. Our results also suggest larger values of the cold, non-rotating maximum NS mass in equal mass scenarios. However, without a detection of the dynamical ejecta afterglow, obtaining precise constraints on the NS equation of state remains challenging.
Subject headings:
GW170817, Kilonova afterglow: general — radio continuum: general1. Introduction
GW170817 remains the first and only example yet of the merger of two neutron stars (NSs), observed by LIGO and VIRGO (Abbott et al., 2017b), whose discovery in gravitational waves (GWs) was followed by the identification of a definitive electromagnetic (EM) counterpart from radio to -ray frequencies.
The treasure trove of information that this event has provided to the astronomy community cannot be understated. We refer the reader to the many papers written on this event for a comprehensive description of all of the observations that enabled the identification of a coincident gamma-ray burst (GRB; e.g. Abbott et al., 2017a, and references therein); a host galaxy at 40 Mpc and a UV/optical/IR kilonova (e.g., Arcavi et al., 2017; Chornock et al., 2017; Coulter et al., 2017; Cowperthwaite et al., 2017; Drout et al., 2017; Kasliwal et al., 2017; Kasen et al., 2017; Kilpatrick et al., 2017; Pian et al., 2017; Shappee et al., 2017; Smartt et al., 2017; Tanvir et al., 2017; Valenti et al., 2017; Metzger, 2017); a delayed non-thermal afterglow observed from radio to X-rays (e.g., Troja et al., 2017; Haggard et al., 2017; Margutti et al., 2017; Hallinan et al., 2017).
Extensive observations of the quasi-thermal kilonova and of the non-thermal afterglow associated with GW170817 have painted a detailed picture of the ejecta that resulted from the merger of the two NSs in the compact binary progenitor of GW170817. While the kilonova was powered by quasi-isotropic and relatively slow neutron-rich debris originating from a combination of dynamical ejecta and disk winds (e.g. Metzger, 2017), the non-thermal radio afterglow probed the existence of an off-axis jet that successfully burrowed through the neutron-rich debris. Radio observations, in particular, were instrumental in narrowing down the morphology of relativistic ejecta to a structured jet (a.k.a. jetcocoon), and in providing crucial insights into the geometry of the merger itself, and the density of the interstellar medium (ISM) through which the jet was launched (Mooley et al., 2018c; Lazzati et al., 2018; Ren et al., 2020; Ghirlanda et al., 2019; Corsi et al., 2018; Dobie et al., 2018; Alexander et al., 2017; Margutti et al., 2018; Mooley et al., 2018a, b; Hajela et al., 2019).
Well before the discovery of GW170817, models had been proposed predicting that, regardless of whether a jet is successfully launched in a binary NS merger, the interaction of the kilonova ejecta with the ISM can produce non-thermal emission in the radio a few years after merger (e.g., Nakar & Piran, 2011; Piran et al., 2013; Hotokezaka & Piran, 2015), motivating several related observational efforts in cosmological short GRBs (e.g. Metzger & Bower, 2014; Fong et al., 2016; Horesh et al., 2016). With GW170817, these late-time re-brightening models have spurred new interest in the community (Kathirgamaraju et al., 2019; Hotokezaka et al., 2018; Bartos et al., 2019; Margalit & Piran, 2020; Liu et al., 2020), especially given their potential to probe the nature of the merger remnant in relation to the Equation of State (EoS) of nuclear matter (see e.g. Nedora et al., 2021, and references therein). Thus, additional observational campaigns have been carried out in search for late-time radio afterglows in both GW170817 (Balasubramanian et al., 2021; Hajela et al., 2022; Troja et al., 2022) and other short GRBs (e.g., Klose et al., 2019; Bruni et al., 2021; Grandorf et al., 2021; Ricci et al., 2021), albeit without any definitive detections so far.
Motivated by the above considerations, in Balasubramanian et al. (2021) we presented the deepest radio observations of the GW170817 field at 3.5 years after merger, and found no evidence for a late-time radio re-brightening. This result helped constrain the energy-speed distribution of the kilonova ejecta (Balasubramanian et al., 2021), and provided hints on the NS EoS (Nedora et al., 2021). On the other hand, late-time X-ray observations of the GW170817 field around the same epoch had left open the possibility of late-time emission in excess to that expected from the tail of the GW170817 jet afterglow (Hajela et al., 2022; Troja et al., 2022). However, continued follow-up in the X-rays at 4.3-4.8 years since merger did not confirm the presence of an X-ray excess at these later times (Hajela et al., 2021; O’Connor & Troja, 2022).
Here, we present new deep observations of the GW170817 field carried carried out with the Karl G. Jansky Very large Array (VLA) at 3 GHz and at the epoch of about 4.5 years since merger. These observations improve substantially on the sensitivity reached by recently reported radio observations of the same field (Ricci et al., 2022). Our paper is organized as follows. We report our new observations in 2; in 3 we discuss our results within the kilonova ejecta afterglow model; finally, in 4 we summarize and conclude.
| Date | VLA | Time on-source | RMS | VLA | PI | Nominal synth. beam | |
| (UT) | (GHz) | config. | (hr) | (Jy) | program | (″) | |
| 2021 Dec 06 | 3.0 | B | 2 h24 m54 s | 4.9 (3.6) | 21B-057 | Balasubramanian | 2.1 |
| 2021 Dec 20 | 3.0 | B | 2 h25 m57 s | 4.4 (3.9) | 21B-057 | Balasubramanian | 2.1 |
| 2021 Dec 28 | 3.0 | B | 2 h25 m57 s | 4.7 (3.9) | 21B-057 | Balasubramanian | 2.1 |
| 2022 Jan 05 | 3.0 | B | 2 h25 m57 s | 4.9 (4.3) | 21B-057 | Balasubramanian | 2.1 |
| 2022 Mar 05 | 2.9 | A | 2 h28 m00 s | 4.4 (3.9) | 22A-168 | Balasubramanian | 0.65 |
| 2022 Mar 10 | 3.0 | A | 2 h28 m08 s | 4.4 (3.9) | 22A-168 | Balasubramanian | 0.65 |
| 2022 Mar 14 | 3.0 | A | 2 h28 m02 s | 4.0 (3.9) | 22A-168 | Balasubramanian | 0.65 |
| 2022 Mar 17 | 3.0 | A | 2 h28 m08 s | 4.0 (3.9) | 22A-168 | Balasubramanian | 0.65 |
| 2022 Mar 22 | 3.0 | A | 2 h28 m10 s | 4.1 (4.0) | 22A-168 | Balasubramanian | 0.65 |
| 2022 Mar 23 | 3.0 | A | 2 h17 m34 s | 4.4 (4.1) | 22A-168 | Balasubramanian | 0.65 |
| 2022 Mar 28 | 3.0 | A | 2 h38 m42 s | 3.7 (3.4) | 22A-168 | Balasubramanian | 0.65 |
| 2022 Mar 29 | 3.0 | A | 2 h28 m00 s | 3.9 (3.7) | 22A-168 | Balasubramanian | 0.65 |
| Date | Epoch | Instrument | Reference | |||
| (UT) | (yr) | (Hz) | (Jy) | (Jy) | ||
| 2021 Dec 06 - 2022 Jan 05 | 4.3 | 2.2 | VLA B | This work | ||
| 2022 Mar 05 - 2022 Mar 29 | 4.6 | 1.5 | VLA A | This work | ||
| 2021 Dec 06 - 2022 Mar 29 | 4.5 | 1.1 | VLA A&B | This work | ||
| 2021 Dec 07 - 2022 May 18 | 4.5 | Chandra | O’Connor & Troja (2022) |
2. Observations and data reduction
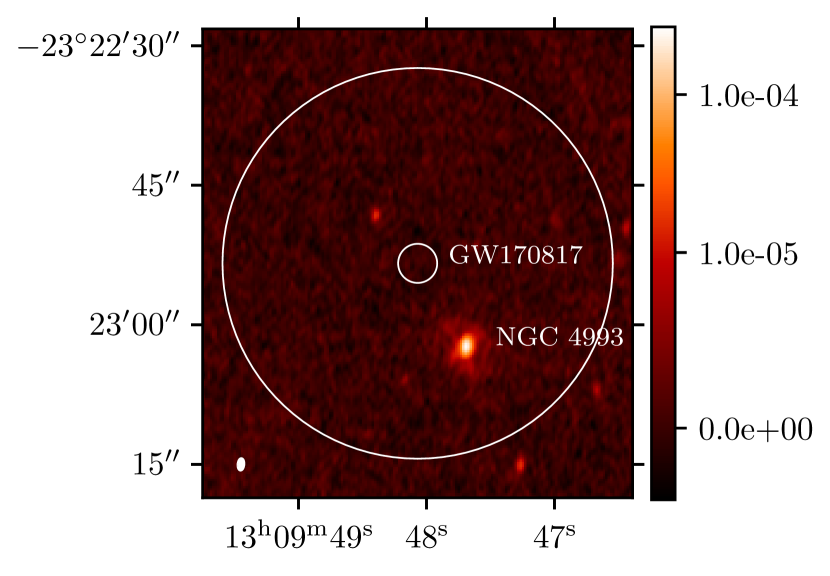
We carried out radio continuum observations of the GW170817 field with the VLA. Our observations were executed with the standard VLA S band setup, with a nominal central frequency of 3 GHz, and split in 12 epochs (each providing approximately 2.5 hours on source) between December 2021 and March 2022. The first four epochs were observed with the VLA in its B configuration, while the subsequent eight epochs were carried out with the array in its most extended A configuration. These observations are listed in Table LABEL:tab:rad_obs. After calibration was performed with the automated VLA calibration pipeline, we manually inspected the data and performed further flagging for radio frequency interference (RFI) as needed. We then imaged the data using the CASA (McMullin et al., 2007) task tclean with one Taylor term (nterms=1) and robust weighting (robust=0.5; see also Balasubramanian et al., 2021), and derived the sensitivity RMS measurements running imstat on the residual images within a circular region of radius equal to 10 nominal synthesized beams111As recommended by Hancock et al. (2012) and Mooley et al. (2013). around the position of GW170817 (, , J2000; Mooley et al., 2018c). Because this region may include residuals associated with the host galaxy light (see Figure 1), we also list in parenthesis in Table LABEL:tab:rad_obs the RMS values we obtain using a circular region of the same size in a source-free portion of the image. We find no significant (RMS) excess in a region of one synthesized beam around the position of GW170817 in any of the individual epochs.
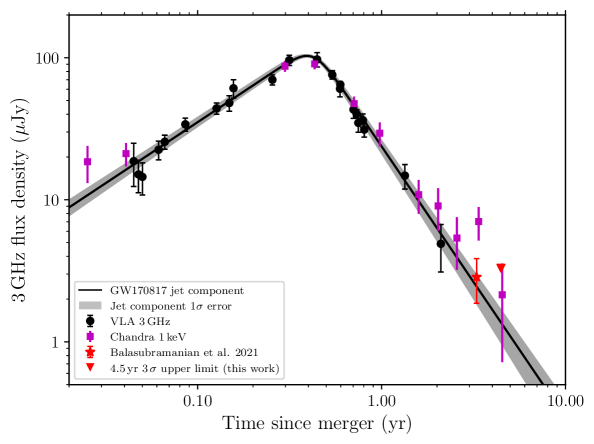
Next, we co-add the four B configuration observations, and the eight A configuration observations separately; finally, we co-add the full multiple configuration data set (all in the visibility domain) for a total of 12 observations. The imaging for these co-added datasets was performed similar to what is described above, with the CASA task tclean but using nterms=2 to better clean the emission from bright radio sources in the field. To estimate the RMS sensitivity for the co-added observations in the A and B configurations, we conservatively use a circular region of radius 10 times the nominal synthesized beam width of the B configuration, centered on the location of GW170817 in the residual images (Figure 1 and Table LABEL:tab:obs). We note that the RMS values estimated this way differ by less than 10% from RMS values calculated in source free regions of the cleaned image. In our deepest co-added image we reach an RMS sensitivity of Jy at 3.0 GHz. No emission in excess to the co-added image RMS is found in a circular region of radius 2.1 arcsec (FWHM of the nominal VLA synthesized beam in B configuration at 3 GHz) around the location of GW170817. Specifically, at the location of GW170817 we measure a 3 GHz flux of Jy. Therefore, we constrain the radio emission from GW170817 to Jy at 4.5 years since merger (see Figure 2).
3. Discussion
In Figure 2, we show the 3 GHz light curve of GW170817 (see the panchromatic afterglow data webpage222http://www.tauceti.caltech.edu/kunal/gw170817/gw170817_afterglow_data_full.txt and https://github.com/kmooley/GW170817/ for a compilation of the full dataset). The black data points are the previous radio observations (Hallinan et al., 2017; Mooley et al., 2018a, b; Makhathini et al., 2021) that follow the jetcocoon afterglow model (black line with gray 1 error region). The red star shows our previous radio detection at years since merger (Balasubramanian et al., 2021). The radio upper limit from this work is shown with a downward pointing red triangle. As evident from this Figure, we do not find any significant evidence for emission in excess to the expectations from a decaying jetcocoon afterglow model, confirming our previous results (Balasubramanian et al., 2021).
For comparison, in Figure 2 we also show the X-ray flux measurements derived from Chandra observations of the GW170817 field are shown as purple squares (see e.g. Haggard et al., 2017; Margutti et al., 2017; Troja et al., 2017; Hajela et al., 2022; Troja et al., 2022, and references therein) extrapolated to the radio band using a radio-to-X-ray spectral index of (see Makhathini et al., 2021). Recently, O’Connor & Troja (2022) also reported a measurement of for the keV flux of GW170817 at years after the merger (assuming a spectral index of ), using observations carried out with the Chandra observatory (O’Connor & Troja, 2022; Hajela et al., 2021). We convert this flux into a flux density at 1 keV (see Table LABEL:tab:obs) and, by combining it with the radio upper-limit presented here, we derive a radio-to-X-ray spectral index of . This is compatible with the best fit value obtained via previous observations of the structured jet afterglow (; Makhathini et al., 2021), and with the results of our analysis at 3.5 years after merger ( ; Balasubramanian et al., 2021).
Hereafter we discuss the implications of our latest radio observations in the context of the kilonova ejecta model, following the formulation of Kathirgamaraju et al. (2019). In this model, the kilonova blast wave drives a shock through the ISM, resulting in synchrotron emission. Electrons are accelerated to a power-law distribution of Lorentz gamma factors , with power-law index . The energy in the kilonova spherical blast wave is distributed as (with being the Lorentz factor, being the speed in units of speed of light of the shocked fluid and being the power law index of the energy speed distribution) and normalized to the total energy at some minimum velocity such that . It is reasonable to assume that radio (GHz) observations are in between the minimum frequency, (corresponding to , see Nakar & Piran, 2011), and the cooling frequency, . In this case, the kilonova peak flux density reads (Nakar & Piran, 2011):
| (1) |
where is followed for all quantities (, all expressed in cgs units); and are the fractions of the total energy in the magnetic field and electrons respectively; , the number density of the medium; is the distance to the source; the normalization constant is calculated for . The time at which the kilonova afterglow emission peaks can be calculated as (Kathirgamaraju et al., 2019):
| (2) |
where is the power law index of the energy speed distribution discussed earlier. The blast wave can be approximated to be mildly relativistic before this peak, and therefore the rising part of the kilonova ejecta light curve can be easily modeled as (see Kathirgamaraju et al., 2019, and references therein):
| (3) |
where:
| (4) |
For , Equations (1)-(3) reduce to the case of a spherical outflow of total energy with uniform velocity (Nakar & Piran, 2011). In this case, our flux upper-limit at 4.5 yr constrains the energy and speed for a given choice of the density and micro-physical parameters. Indeed, setting these parameters as in Makhathini et al. (2021), an energy of erg and speed of would produce a radio peak flux comparable to our upper-limit at 4.5 yrs since merger. Hence, single-speed ejecta more energetic than erg must be slower than . Else, radio emission from such ejecta would have peaked before 4.5 yrs in the radio, at a flux level above Jy.
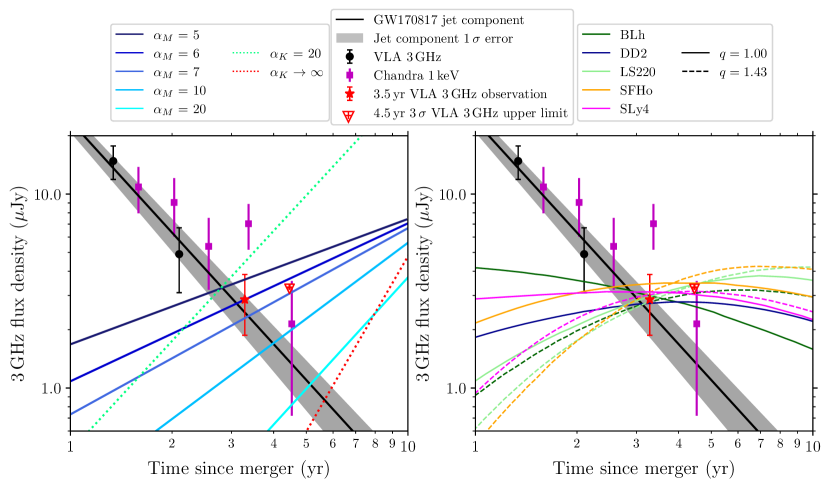
Next, in Figure 3 we consider the case of a stratified ejecta with an energy-speed distribution described by the parameter . In this case, we can use our observations to constrain the values of under specific assumptions on the energy and minimum speed of the ejecta, and of the density and micro-physical parameters. The blue and green curves in the left panel of Figure 3 show the rising portion of the predicted kilonova afterglow. Specifically, the shades of solid blue curves assume the parameters erg, , , , , , Mpc (as in Makhathini et al., 2021); the dotted green and red curves assume the parameters erg, , , , , , Mpc (as in Kathirgamaraju et al., 2019). The radio observations presented here (red downward pointing triangle for our upper-limit) constrain to if we assume the parameters as in Makhathini et al. (2021). This is compatible with the constraints one can derive from the X-ray observations reported by O’Connor & Troja (2022) within the large error bars that affect this X-ray measurement (see the last purple square in Figure 3). For the more general choice of micro-physical parameters (Kathirgamaraju et al., 2019), our latest upper-limit is compatible only with the more extreme cases of very steep values of or with a kilonova blast wave comprised of a single velocity component ().
The results presented here can also improve on the constraints discussed in Nedora et al. (2021) regarding the NS EoS. In the right panel of Figure 3 we show a plot of the EoS-dependent model radio light curves from Nedora et al. (2021), compared with the radio upper-limit derived in this analysis. As evident from this Figure, our radio observations at 4.5 yrs since merger add new constraints on the possible EoSs, disfavoring the softer EoS SFHo (with , , and cm-3), as well as the stiffer LS220 (with , , and cm-3) in moderate mass ratio scenarios (). The SFHo and LS220 EoSs predict the same maximum mass of the cold non-rotating NS, but LS220 correlates with a steeper ejecta energy-speed distribution for (Radice et al., 2018). On the other hand, scenarios like a DD2 EoS with , that predict a larger value of the cold, non-rotating maximum NS mass, are still possible.
4. Summary and conclusion
In this work, we have presented deep, 3 GHz observations of GW170817 at years since merger. We co-added all the data collected with the VLA via our programs to obtain a deep image of the field, and find no evidence for a re-brightening that can be associated with the kilonova ejecta afterglow in the radio. This confirms our previous results (Balasubramanian et al., 2021). Overall, the upper-limit we set here and the latest X-ray observations reported by O’Connor & Troja (2022) reinforce the conclusion that there is no clear evidence for a late-time re-brightening of the GW170817 non-thermal afterglow emission. Qualitatively speaking, models that envision the emergence of a new emission component at late times, with constant or declining X-ray emission beyond the epoch of yrs since merger and without accompanying bright radio emission, could likely still be fit to the data (Hajela et al., 2022) but would be very hard to test via further radio (or X-ray) observations of the GW170817 field.
Kilonova ejecta afterglow models could still be constrained with further radio observations of sensitivity similar to the one reached in this work (and thus not without a substantial investment of observing time). Indeed, the observations presented here tighten the constraints on the power-law index of the energy-speed distribution of the kilonova ejecta to , somewhat steeper than the constraint that we obtained at 3.5 years post-merger (see Balasubramanian et al., 2021), and favor EoS predicting larger values of the cold, non-rotating NS mass for scenarios.
In the future, a radio non-detection at yrs since merger would constrain the ejecta energy-speed distribution to for reasonable assumptions on the ejecta parameters. A detection would also facilitate more precise constraints on the possible EoSs (see e.g. BLh in the right panel of Figure 3), though previous considerations regarding the challenges of pinpointing a specific EoS remain true (see e.g. Nedora et al., 2021; Balasubramanian et al., 2021).
References
- Abbott et al. (2017a) Abbott, B. P., Abbott, R., Abbott, T. D., et al. 2017a, ApJ, 848, L13
- Abbott et al. (2017b) —. 2017b, Phys. Rev. Lett., 119, 161101
- Alexander et al. (2017) Alexander, K. D., Berger, E., Fong, W., et al. 2017, ApJ, 848, L21
- Arcavi et al. (2017) Arcavi, I., Hosseinzadeh, G., Howell, D. A., et al. 2017, Nature, 551, 64
- Balasubramanian et al. (2021) Balasubramanian, A., Corsi, A., Mooley, K. P., et al. 2021, ApJ, 914, L20
- Bartos et al. (2019) Bartos, I., Lee, K. H., Corsi, A., Márka, Z., & Márka, S. 2019, MNRAS, 485, 4150
- Bruni et al. (2021) Bruni, G., O’Connor, B., Matsumoto, T., et al. 2021, MNRAS, 505, L41
- Chornock et al. (2017) Chornock, R., Berger, E., Kasen, D., et al. 2017, ApJ, 848, L19
- Corsi et al. (2018) Corsi, A., Hallinan, G. W., Lazzati, D., et al. 2018, ApJ, 861, L10
- Coulter et al. (2017) Coulter, D. A., Foley, R. J., Kilpatrick, C. D., et al. 2017, Science, 358, 1556
- Cowperthwaite et al. (2017) Cowperthwaite, P. S., Berger, E., Villar, V. A., et al. 2017, ApJ, 848, L17
- Dobie et al. (2018) Dobie, D., Kaplan, D. L., Murphy, T., et al. 2018, ApJ, 858, L15
- Drout et al. (2017) Drout, M. R., Piro, A. L., Shappee, B. J., et al. 2017, Science, 358, 1570
- Fong et al. (2016) Fong, W., Metzger, B. D., Berger, E., & Özel, F. 2016, ApJ, 831, 141
- Ghirlanda et al. (2019) Ghirlanda, G., Salafia, O. S., Paragi, Z., et al. 2019, Science, 363, 968
- Grandorf et al. (2021) Grandorf, C., McCarty, J., Rajkumar, P., et al. 2021, ApJ, 908, 63
- Haggard et al. (2017) Haggard, D., Nynka, M., Ruan, J. J., et al. 2017, ApJ, 848, L25
- Hajela et al. (2021) Hajela, A., Margutti, R., Alexander, K. D., et al. 2021, GRB Coordinates Network, 31231, 1
- Hajela et al. (2019) —. 2019, ApJ, 886, L17
- Hajela et al. (2022) Hajela, A., Margutti, R., Bright, J. S., et al. 2022, ApJ, 927, L17
- Hallinan et al. (2017) Hallinan, G., Corsi, A., Mooley, K. P., et al. 2017, Science, 358, 1579
- Hancock et al. (2012) Hancock, P. J., Murphy, T., Gaensler, B. M., Hopkins, A., & Curran, J. R. 2012, MNRAS, 422, 1812
- Horesh et al. (2016) Horesh, A., Hotokezaka, K., Piran, T., Nakar, E., & Hancock, P. 2016, ApJ, 819, L22
- Hotokezaka et al. (2018) Hotokezaka, K., Kiuchi, K., Shibata, M., Nakar, E., & Piran, T. 2018, ApJ, 867, 95
- Hotokezaka & Piran (2015) Hotokezaka, K., & Piran, T. 2015, MNRAS, 450, 1430
- Kasen et al. (2017) Kasen, D., Metzger, B., Barnes, J., Quataert, E., & Ramirez-Ruiz, E. 2017, Nature, 551, 80
- Kasliwal et al. (2017) Kasliwal, M. M., Nakar, E., Singer, L. P., et al. 2017, Science, 358, 1559
- Kathirgamaraju et al. (2019) Kathirgamaraju, A., Giannios, D., & Beniamini, P. 2019, MNRAS, 487, 3914
- Kilpatrick et al. (2017) Kilpatrick, C. D., Foley, R. J., Kasen, D., et al. 2017, Science, 358, 1583
- Klose et al. (2019) Klose, S., Nicuesa Guelbenzu, A. M., Michałowski, M. J., et al. 2019, ApJ, 887, 206
- Lazzati et al. (2018) Lazzati, D., Perna, R., Morsony, B. J., et al. 2018, Phys. Rev. Lett., 120, 241103
- Liu et al. (2020) Liu, L.-D., Gao, H., & Zhang, B. 2020, ApJ, 890, 102
- Makhathini et al. (2021) Makhathini, S., Mooley, K. P., Brightman, M., et al. 2021, ApJ, 922, 154
- Margalit & Piran (2020) Margalit, B., & Piran, T. 2020, MNRAS, 495, 4981
- Margutti et al. (2017) Margutti, R., Berger, E., Fong, W., et al. 2017, ApJ, 848, L20
- Margutti et al. (2018) Margutti, R., Alexander, K. D., Xie, X., et al. 2018, ApJ, 856, L18
- McMullin et al. (2007) McMullin, J. P., Waters, B., Schiebel, D., Young, W., & Golap, K. 2007, in Astronomical Society of the Pacific Conference Series, Vol. 376, Astronomical Data Analysis Software and Systems XVI, ed. R. A. Shaw, F. Hill, & D. J. Bell, 127
- Metzger (2017) Metzger, B. D. 2017, arXiv e-prints, arXiv:1710.05931
- Metzger & Bower (2014) Metzger, B. D., & Bower, G. C. 2014, MNRAS, 437, 1821
- Mooley et al. (2013) Mooley, K. P., Frail, D. A., Ofek, E. O., et al. 2013, ApJ, 768, 165
- Mooley et al. (2018a) Mooley, K. P., Nakar, E., Hotokezaka, K., et al. 2018a, Nature, 554, 207
- Mooley et al. (2018b) Mooley, K. P., Frail, D. A., Dobie, D., et al. 2018b, ApJ, 868, L11
- Mooley et al. (2018c) Mooley, K. P., Deller, A. T., Gottlieb, O., et al. 2018c, Nature, 561, 355
- Nakar & Piran (2011) Nakar, E., & Piran, T. 2011, Nature, 478, 82
- Nedora et al. (2021) Nedora, V., Radice, D., Bernuzzi, S., et al. 2021, MNRAS, 506, 5908
- O’Connor & Troja (2022) O’Connor, B., & Troja, E. 2022, GRB Coordinates Network, 32065, 1
- Pian et al. (2017) Pian, E., D’Avanzo, P., Benetti, S., et al. 2017, Nature, 551, 67
- Piran et al. (2013) Piran, T., Nakar, E., & Rosswog, S. 2013, MNRAS, 430, 2121
- Radice et al. (2018) Radice, D., Perego, A., Hotokezaka, K., et al. 2018, ApJ, 869, 130
- Ren et al. (2020) Ren, J., Lin, D.-B., Zhang, L.-L., et al. 2020, ApJ, 901, L26
- Ricci et al. (2022) Ricci, R., O’Connor, B., & Troja, E. 2022, GRB Coordinates Network, 32094, 1
- Ricci et al. (2021) Ricci, R., Troja, E., Bruni, G., et al. 2021, MNRAS, 500, 1708
- Shappee et al. (2017) Shappee, B. J., Simon, J. D., Drout, M. R., et al. 2017, Science, 358, 1574
- Smartt et al. (2017) Smartt, S. J., Chen, T. W., Jerkstrand, A., et al. 2017, Nature, 551, 75
- Tanvir et al. (2017) Tanvir, N. R., Levan, A. J., González-Fernández, C., et al. 2017, ApJ, 848, L27
- Troja et al. (2017) Troja, E., Piro, L., van Eerten, H., et al. 2017, Nature, 551, 71
- Troja et al. (2022) Troja, E., O’Connor, B., Ryan, G., et al. 2022, MNRAS, 510, 1902
- Valenti et al. (2017) Valenti, S., Sand, D. J., Yang, S., et al. 2017, ApJ, 848, L24