[1,2]Anastassia M.Makarieva \Author[2]Andrei V.Nefiodov \Author[3]Antonio DonatoNobre \Author[4]MaraBaudena \Author[5]UgoBardi \Author[6,7,8]DouglasSheil \Author[9]Scott R.Saleska \Author[10]Ruben D.Molina \Author[11]AnjaRammig
1]Institute for Advanced Study, Technical University of Munich, Lichtenbergstrasse 2 a, 85748 Garching, Germany 2]Theoretical Physics Division, Petersburg Nuclear Physics Institute, 188300 Gatchina, St. Petersburg, Russia 3]Centro de Ciência do Sistema Terrestre INPE, São José dos Campos, 12227-010 São Paulo, Brazil 4]National Research Council of Italy, Institute of Atmospheric Sciences and Climate (CNR-ISAC), Torino, Italy 5]Department of Chemistry, University of Florence, Italy 6]Forest Ecology and Forest Management Group, Wageningen University & Research, PO Box 47, 6700 AA, Wageningen, The Netherlands 7]Center for International Forestry Research (CIFOR), Kota Bogor, Jawa Barat, 16115, Indonesia 8]Faculty of Environmental Sciences and Natural Resource Management, Norwegian University of Life Sciences, Ås, Norway 9]Department of Ecology and Evolutionary Biology, University of Arizona, Tucson, 85721, Arizona, USA 10]Escuela Ambiental, Facultad de Ingeniería, Universidad de Antioquia, Medellín, Colombia 11]Technical University of Munich, School of Life Sciences, Hans-Carl-von-Carlowitz-Platz 2, 85354 Freising, Germany
A. D. Nobre (anobre27@gmail.com), A. M. Makarieva (ammakarieva@gmail.com)
The role of ecosystem transpiration in creating alternate moisture regimes by influencing atmospheric moisture convergence
Abstract
The terrestrial water cycle links the soil and atmosphere moisture reservoirs through four fluxes: precipitation, evaporation, runoff, and atmospheric moisture convergence (net import of water vapor to balance runoff). Each of these processes is essential for sustaining human and ecosystem well-being. Predicting how the water cycle responds to changes in vegetation cover remains a challenge. Recently, changes in plant transpiration across the Amazon basin were shown to be associated disproportionately with changes in rainfall, suggesting that even small declines in transpiration (e.g., from deforestation) would lead to much larger declines in rainfall. Here, constraining these findings by the law of mass conservation, we show that in a sufficiently wet atmosphere, forest transpiration can control atmospheric moisture convergence such that increased transpiration enhances atmospheric moisture import and resulting water yield. Conversely, in a sufficiently dry atmosphere increased transpiration reduces atmospheric moisture convergence and water yield. This previously unrecognized dichotomy can explain the otherwise mixed observations of how water yield responds to re-greening, as we illustrate with examples from China’s Loess Plateau. Our analysis indicates that any additional precipitation recycling due to additional vegetation increases precipitation but decreases local water yield and steady-state runoff. Therefore, in the drier regions/periods and early stages of ecological restoration, the role of vegetation can be confined to precipitation recycling, while once a wetter stage is achieved, additional vegetation enhances atmospheric moisture convergence and water yield. Recent analyses indicate that the latter regime dominates the global response of the terrestrial water cycle to re-greening. Evaluating the transition between regimes, and recognizing the potential of vegetation for enhancing moisture convergence, are crucial for characterizing the consequences of deforestation as well as for motivating and guiding ecological restoration.
[Introduction]
Land loses water through runoff to oceans. The terrestrial water cycle depends on atmospheric moisture convergence: the water that arrives via the atmosphere to compensate for runoff. This water is delivered to land by the wind in the form of water vapor. When moist air rises over the land, it cools, and water vapor condenses and precipitates. If the air does not rise and cool, the airflow carries the water vapor further downwind. Atmospheric moisture convergence is the term used to express difference between gross import and export of water vapor in the region of interest. When the atmospheric and groundwater storages are steady-state, atmospheric moisture convergence equals runoff (Fig. 1a).
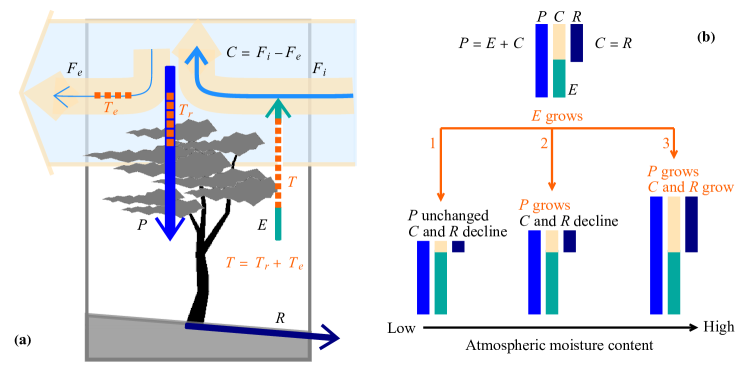
Forests play a major role in the water cycle, which deforestation and reforestation can potentially alter in multiple ways. Atmospheric moisture convergence and evapotranspiration add moisture to the atmosphere, while precipitation removes it. The steady-state water budget for the atmosphere is
| (1) |
If precipitation is constant, then increased evapotranspiration due to reforestation will diminish atmospheric moisture convergence and runoff (Fig. 1b, case ). This can potentially compromise freshwater availability, irrigation, navigation, and hydropower. If atmospheric moisture convergence is constant, increased evapotranspiration will elevate rainfall. This, conversely, will benefit freshwater availability and agriculture. Ellison et al. (2012) grouped these contrasting responses into “demand-side” versus “supply-side”, respectively. Published syntheses reveal diverse hydrological responses to land cover change that depend on the spatiotemporal scales and locations (e.g., Lawrence and Vandecar, 2015; te Wierik et al., 2021; Posada-Marín and Salazar, 2022, and references therein). For example, deforestation in Brazil can increase local rainfall but leads to declines on a larger scale (Leite-Filho et al., 2021). During the massive afforestation on the Loess Plateau in China, atmospheric moisture convergence initially diminished but later began to increase (Zhang et al., 2022).
Compared to this diversity, the prevailing approach to studying how changes in evapotranspiration impact the water cycle has been relatively uniform, based on the concept of precipitation recycling (e.g., Salati et al., 1979; Eltahir and Bras, 1994; Savenije, 1995; van der Ent et al., 2010; Keys et al., 2012; Ellison et al., 2012; Zemp et al., 2017a, b; Staal et al., 2018; Wang-Erlandsson et al., 2018; Hoek van Dijke et al., 2022). Evapotranspiration returns water to the atmosphere. Some of this evapotranspired water vapor may condense and precipitate again, which can be seen as precipitation recycling in the considered area. The remaining vapor will be blown away by the wind. Recycled precipitation is, therefore, always smaller than, or equal to, evapotranspiration (see Fig. 1a and discussion by Eltahir and Bras, 1994).
The conventional precipitation recycling approach assumes that the air circulation (i.e., wind speed and direction) does not change in response to land cover change. Water vapor is viewed as a tracer that merely follows the airflow. This implies that if evapotranspiration diminishes/increases by a certain amount, precipitation is diminished/increased by a smaller amount of recycled precipitation. Consequently, this approach invariably predicts that atmospheric moisture convergence (and steady-state runoff) will decline with increasing evapotranspiration (and rise with declining evapotranspiration upon deforestation) (Fig. 1, case ). (As an example, for a large-scale continental reforestation, the precipitation recycling approach predicts a considerable decline in global runoff as a result of increased evapotranspiration (Hoek van Dijke et al., 2022), but see our discussion in Section 3.1 below.) This implies that competition for water resources between added vegetation and humans is unavoidable (Ricciardi et al., 2022). This implication has particular relevance in China, where the hydrological impacts of large-scale re-greening programs are actively debated (Feng et al., 2016; Zheng et al., 2021; Zhang et al., 2022). Conversely, reduced evapotranspiration associated with elevated concentrations of carbon dioxide was expected to increase moisture convergence and runoff (e.g., Gedney et al., 2006).
Besides precipitation recycling and consideration of water vapor as a tracer, it has been recognized that change in evapotranspiration can cause changes in atmospheric moisture convergence by modifying the surface temperature and atmospheric temperature profile (e.g., Pu and Dickinson, 2014; Eiras-Barca et al., 2020). However, the direction of such changes has long been a matter of controversy, as illustrated, for example, by an early discussion between Ripley (1976) and Charney (1976) (see also Makarieva et al. (2022) for an overview) and more recently by modelling studies revealing diverse responses in different regions (e.g., Kooperman et al., 2018). Accordingly, increase (reduction) of moisture convergence with reduced (increased) evapotranspiration has been acknowledged as the first-order effect in the water cycle response to changes in evapotranspiration (Kooperman et al., 2018; Fowler et al., 2019, and references therein).
Our goal in the present paper is to develop a more comprehensive conceptual approach taking into account that vegetation can alter atmospheric dynamics and hence the water cycle via its impact on atmospheric moisture content – such that both precipitation and moisture convergence will grow in response to increasing evapotranspiration (Fig. 1b, case ). Our key point is that a moist atmosphere close to saturation displays different dynamics compared to a dry, unsaturated atmosphere. As increased evapotranspiration leads to higher atmospheric moisture content, this can elicit dynamics with both precipitation and moisture convergence enhanced. From this more comprehensive perspective, the strategic question for any large-scale ecological restoration effort will not be “When/where should we stop/avoid ecological restoration to not run into water limitation?” (cf. Feng et al., 2016; Ricciardi et al., 2022). It will be “What conditions are necessary for restoration to maximally enhance the water cycle (both precipitation and runoff)? How can we plan restoration to achieve these conditions?”.
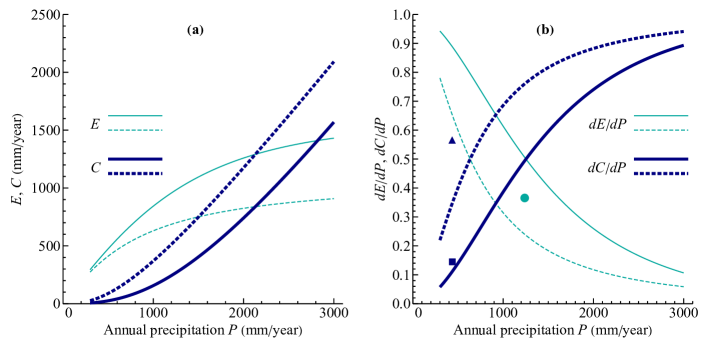
There are multiple independent lines of evidence testifying that a simultaneous enhancement of all moisture flows by vegetation is plausible. Generally, ecosystems with higher evapotranspiration tend to have higher atmospheric moisture convergence and runoff. In Fig. 2, the dependence of annual evapotranspiration on annual precipitation is shown for forests and grasslands as established by Zhang et al. (2001) based on catchment water balance (see also Teuling, 2018). From this dependence and the steady-state water budget, one can see that atmospheric moisture convergence and runoff increase with evapotranspiration. In the Amazon forest, increased forest transpiration at the end of the dry season leads to the accumulation of atmospheric moisture. This moistening facilitates convection, which, in turn, boosts atmospheric moisture convergence (Wright et al., 2017).
Furthermore, previous studies established the link between atmospheric water content and convection and precipitation. Bretherton et al. (2004) found that observations of tropical oceanic daily and monthly mean precipitation depend exponentially on atmospheric moisture content. Based on data for a tropical island, Holloway and Neelin (2010) showed that the rainfall probability rises sharply with increasing atmospheric moisture content (see also Yano and Manzato, 2022). Using the radiosonde data for several meteostations in Brazil (Fig. 5a) and the relationship established by Holloway and Neelin (2010), Makarieva et al. (2014) found that, in the Amazon forest with its wet atmosphere, a small increment in the atmospheric moisture content leads to a several times’ larger increment in rainfall probability than in the drier regions. Makarieva et al. (2014) suggested that, due to its moist atmosphere, local Amazonian vegetation can trigger or suppress convection and rainfall by changes in transpiration, emission of biogenic condensation nuclei, and other biotically mediated processes. Baudena et al. (2021) used reanalyses data in a part of the Amazon basin to establish that hourly precipitation grows non-linearly with increasing atmospheric moisture content.
Finally, Mapes et al. (2018) showed that the persistence of spatial domains with high atmospheric moisture and high precipitation rates in the tropics testifies to their maintenance by atmospheric moisture convergence. Where atmospheric moisture content and precipitation exceed a certain threshold, such an area becomes self-sustainable. It generates a sufficient inflow of moist air to keep the high moisture content and to feed the high precipitation that significantly exceeds local evaporation. Therefore, all the three processes necessary for realizing case 3 in Fig. 1b, have been independently reported on different spatial and temporal scales: 1) increased evapotranspiration leads to increased atmospheric moisture content; 2) increased atmospheric moisture content leads to a sharp increase in precipitation; 3) high precipitation induces and/or sustains efficient atmospheric moisture convergence. Here we combine and extend these analyses and conceptualize them into a new comprehensive approach to describing vegetation’s impact on the water cycle. We shall see that this approach accommodates the precipitation recycling approach as a special case.
1 Data and methods
1.1 Key variables and relationships
We quantify local atmospheric moisture content as column water vapor (mm):
| (2) |
Here is the density of water vapor and kg/m3 is the density of liquid water, and the integration is performed over the entire atmospheric column from the Earth’s surface to the top of the troposphere , where water vapor density is negligible. Condensed water makes a negligible contribution to the atmospheric moisture content (Makarieva et al., 2013b). Due to the factor, measures atmospheric water content in terms of equivalent water depth: mm is equivalent to kg of water vapor per squared meter. Local groundwater storage (mm) is defined similarly to .
| (3) |
where is the mean water density in the ground (water mass per unit ground volume) and the absolute value of is the depth of the considered ground layer ().
The mean value of for a region of area and atmospheric volume is
| (4) |
The atmospheric moisture convergence in the considered region is determined as follows:
| (5) |
where is the vector of air velocity. The closed surface encloses volume . The unit normal vector is directed outward. Flux corresponds to the case when the normal component of air velocity , i.e., the water vapor flows into the region. Flux corresponds to the case when , i.e., the water vapor flows out of the region. Since at and at , atmospheric moisture convergence describes the net flux of water vapor through the lateral surface of the considered atmospheric volume (Fig. 1a). Note that the precipitation recycling approach assumes that the air velocity does not change upon reforestation/deforestation, but only does.
The difference between evaporation and precipitation is
| (6) |
where is the mass source/sink of water vapor, i.e., evaporation if and condensation if . The quantities , , and are measured in units of length per unit of time (for example, mm/day). Local values of and are obtained by substituting the volume integration in Eqs. (5) and (6) by one-dimentional integration over altitude , cf. Eqs. (2) and (4).
The mass balance for the atmospheric moisture and groundwater can be written as follows:
| (7) | |||
| (8) |
Here is precipitation, is evapotranspiration, and (mm/day) is runoff. These mass balance equations apply both locally and on a regional scale.
The steady-state mass balance for the atmosphere, Eq. (1), is valid when the rate of change in the atmospheric moisture content is low compared to precipitation (). This pertains to time scales , where is the time scale of atmospheric moisture turnover via precipitation; is about ten days on a global average (Läderach and Sodemann, 2016). The groundwater storage is several orders of magnitude larger than . The so-called modern groundwater (recycled within the last years) constitutes about m on a global average, and its mean turnover time via global runoff m/year is years (L’vovitch, 1979; Gleeson et al., 2016). On the time scales when both atmosphere and soil moisture are steady-state, runoff equals moisture convergence, (Fig. 1). When the groundwater storage is not steady, then , whereby is referred to as the water yield (Zhang et al., 2022) or water availability (Cui et al., 2022).
Dynamics is introduced by relating the atmospheric moisture content (mm) to precipitation (mm/day). Since there is no fundamental constant to relate these two magnitudes of different dimensions, the dependence between them is formulated in terms of their dimensionless relative increments and (Gorshkov, 1995, Chapter 2.6):
| (9) |
In biology, this type of relationships is widely used and known as allometric. Here dimensionless is the slope of the - dependence on a log-log scale. Observations show that , i.e., precipitation rises with increasing atmospheric moisture content (see the next section).
The proposed control of atmospheric moisture convergence by evapotranspiration can occur as follows. At a certain point of time evapotranspiration begins to rise, . According to the mass balance equation (7), an increase in leads to an increase in the rate of change of the atmospheric moisture content, . If at the initial moment of time , this rate becomes positive as time goes, . Consequently, itself also grows, .
Without losing generality, for the relationship between evapotranspiration and moisture content we can write
| (10) |
As the moisture content increases, so, according to Eq. (9), does precipitation. The physical mechanisms that relate increased precipitation to increased atmospheric moisture convergence can cause the moisture convergence to rise as well. We do not consider these mechanisms here. According to the mass balance equation, an increase in precipitation leads to a decline in the rate of change of the atmospheric moisture content: other things being equal, the increase of slows down when . When the accumulation of atmospheric moisture ceases, a new steady state with is reached with a higher , , and .
When the ecosystem goes from one steady state with evapotranspiration to another steady state with altered evapotranspiration , from the mass balance equation (1) we have
| (11) |
Moisture convergence will rise if precipitation increases more rapidly than evapotranspiration: if . More specifically, it will rise with increasing evapotranspiration if .
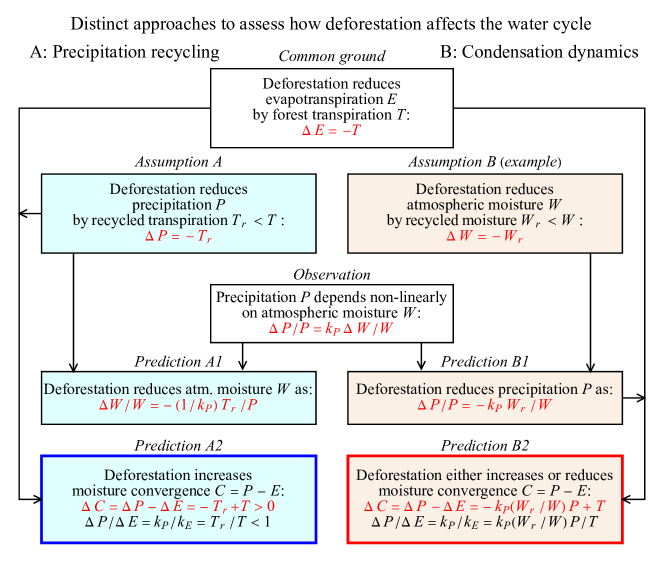
We will term the approach based on Eq. (11) and the consideration of atmospheric moisture content, the condensation dynamics approach – as we will see, there are different states of the water cycle depending on whether the atmosphere is moist enough to permit condensation. Equation (11) indicates that, to know how moisture convergence changes, distinct constraints on the behavior of evapotranspiration and precipitation with changing , i.e., constraints determining and , are required. In this comprehensive approach, deforestation or reforestation can either increase or decrease moisture convergence, depending on specific conditions. In contrast, the precipitation recycling approach uniquely predicts a decline in moisture convergence upon reforestation. Figure 3 summarizes the conceptual difference between the two approaches.
1.2 Data description
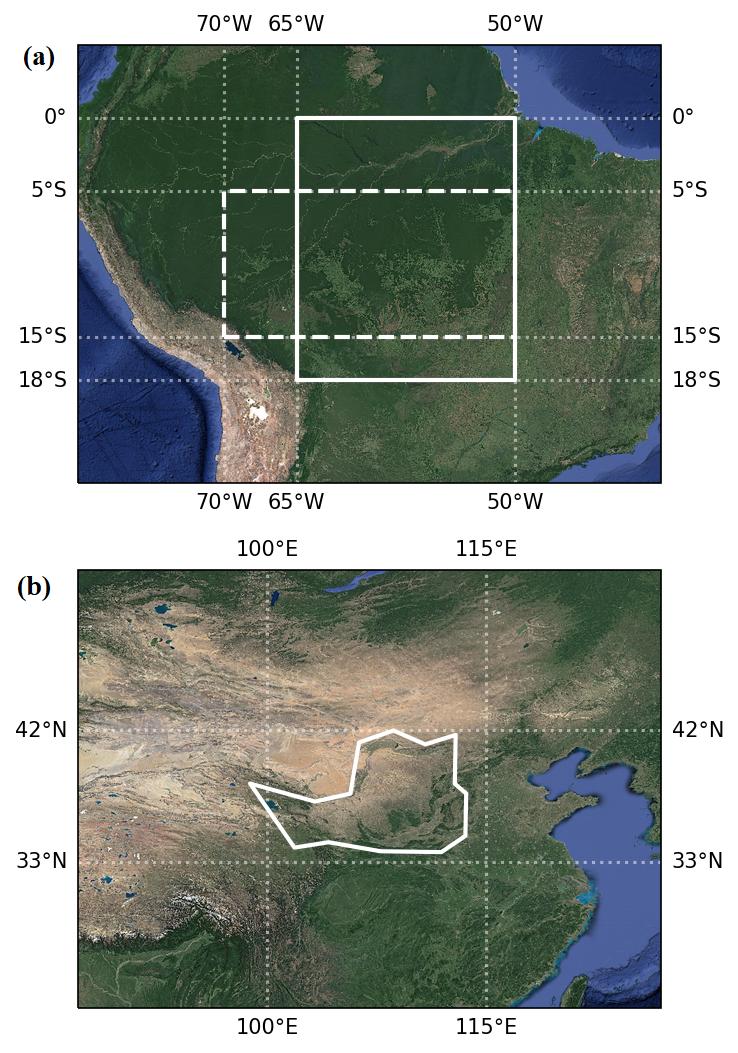
To study processes formalized by Eqs. (5)–(11), we used the data for the Amazon rainforest, as the largest and best studied tropical forest region, and for the Loess Plateau in China, as the largest and best studied long-term experiment on ecological restoration (Table 1 and Fig. 4).
| Process | Hypothetical deforestation | Onset of the wet season | Long-term regreening |
|---|---|---|---|
| Region | Amazon | Amazon | The Loess Plateau |
| 0–18S, 50–65W | 5–15S, 50–70W | China | |
| Study period | 2003–2014 | 2005–2011 | 1982–2018 |
| Temporal resolution | hourly | 5 days | annual |
| Key data sources | ERA5 | ERA-Interim, TRMM, AIRS | MERRA-2 |
| Key references | Baudena et al. (2021) | Wright et al. (2017) | Zheng et al. (2021); |
| Zhang et al. (2022); | |||
| Tian et al. (2022) |
For the Amazon rainforest, we first established the dependence between precipitation and atmospheric moisture content, Eq. (9), using local hourly data. We acquired ERA5 reanalysis data (Hersbach et al., 2018) for a large and relatively flat study area between 0–18S and 50–65W, following the methods of Baudena et al. (2021). Reanalysis data combine and refine/adjust observations with short-term model-derived simulations to interpolate values and ensure consistent and complete (gap-free) global coverage. The studied area includes the Amazon forest and a part of the transition zone to the Cerrado (i.e., a savanna), also encompassing agricultural areas. Hourly precipitation (mm/hour) and column water vapor (mm) were acquired for 2003–2014 at a resolution (Copernicus Climate Change Service).
Similarly to Baudena et al. (2021), we binned hourly precipitation data for every 1 mm of total column water vapor for the study area, and we calculated the average of the distribution of the precipitation for each bin. For each bin, we used in our analysis the average values only if there were more than points in the bin or about of the observations (see inset in Fig. 5b), thus retaining values from mm to mm. Additional data on the statistics of precipitation values in each bin (percentiles and standard deviation) are presented in the Supplementary Information (Table S1).
To compare the obtained dependence with the previous findings, in Fig. 5 we plotted the empirically fitted exponential dependence of daily (mm/day) and monthly (mm/month) oceanic precipitation on (mm) according to, respectively, Eqs. (1) and (2) of Bretherton et al. (2004):
| (12) |
Bretherton et al.’s (2004) Eqs. (1) and (2) relate to the relative moisture content , where is the saturated moisture content for a given atmospheric sounding. To obtain Eq. (12) we used the characteristic mean mm (Bretherton et al., 2004, p. 1521). This introduces an uncertainty associated with a possible dependence of on temperature.
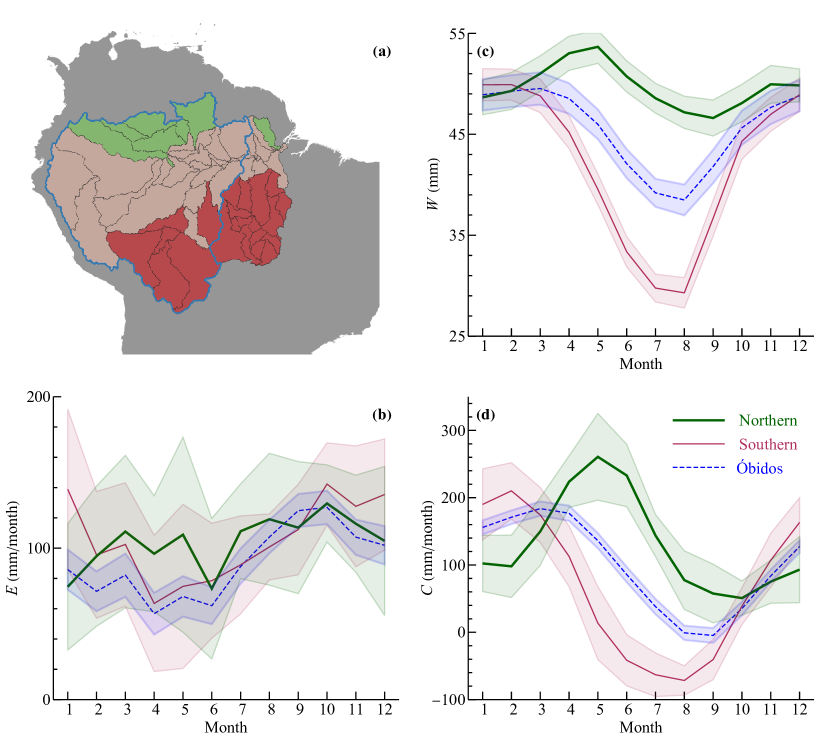
We analyzed the dependence between precipitation and atmospheric moisture content on a seasonal scale using the data from Fig. S7 of Wright et al. (2017) for the Southern Amazon (Fig. 4). These data include evapotranspiration retrieved from ERA-Interim reanalysis (Dee et al., 2011), precipitation retrieved from TRMM 3B42 daily gridded precipitation product at resolution (Huffman et al., 2007) and atmospheric moisture content retrieved from Version 6 of the AIRS Level 3 daily gridded product at resolution (Manning et al., 2017; Tian et al., 2017). All analyzed variables are area-weighted spatial averages for the region bounded by S to S and W to W. Variables are averaged over discrete five days’ periods (pentads) for years from to . In each year, the pentads are aligned relative to the onset of the wet season defined as the first pentad when the rain rate exceeded the climatological mean and the rain rate in at least five of the eight preceding (subsequent) pentads was less (greater) than the climatological mean.
For the Loess Plateau, we used the data from Fig. 10 of Tian et al. (2022), which include evapotranspiration, precipitation, atmospheric moisture content and atmospheric moisture fluxes and from MERRA-2 reanalysis (monthly data at resolution) for the years from to for the rainy season (from June to September).
2 Results
2.1 Dependence of precipitation on atmospheric moisture content
The established relationship (9) between hourly precipitation and atmospheric moisture content in the Amazon is shown in Fig. 5. It displays three distinct features. At low moisture content, precipitation is practically constant and independent of : for mm. At an intermediate moisture content of mm (corresponding to most observations, see the inset in Fig. 5b), precipitation increases several times faster than moisture content: . At the highest moisture content mm, there is an even more abrupt increase in precipitation, corresponding to a sharp rise in up to .
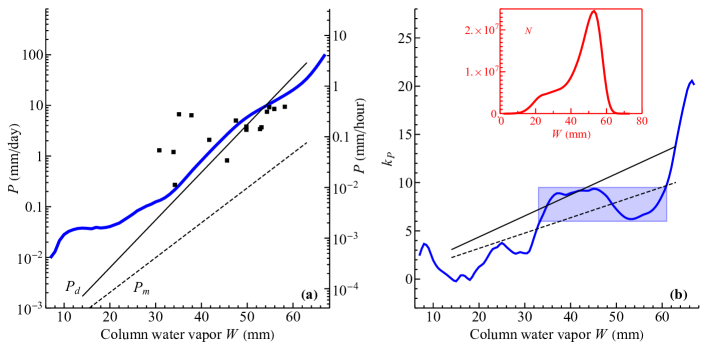
In comparison, the exponential dependence used to approximate the relationship between daily and monthly precipitation and atmospheric moisture content over the ocean (Bretherton et al., 2004) corresponds to a linear increase of over the entire range of moisture content values (Fig. 5b). The exponential model does not permit the identification of moisture content intervals with distinct behavior of .
Let us discuss the physical meaning of these three features. At the lowest moisture content values, the dry atmosphere is far from saturation. Under such conditions, water vapor behaves merely as a tracer that cannot perturb but passively follows atmospheric dynamics. Accordingly, precipitation (which reflects these dynamics) is independent of atmospheric moisture content. Makarieva et al. (2014) discussed evidence for how, during the drier periods and in drier locations in Brazil, precipitation is, rather, determined by non-local weather systems.
As low is associated with unsaturated conditions, this feature in seasonal climates should become pronounced only after temperature and relative humidity considerations are taken into account (cf. discussion by Bretherton et al., 2004). For example, according to the data of Dong et al. (2019), extreme summer rainfall in various regions of China is relatively constant at the lower end of observed moisture content values: mm for the colder northwestern regions and mm for the warmer southeastern regions (Fig. 6).
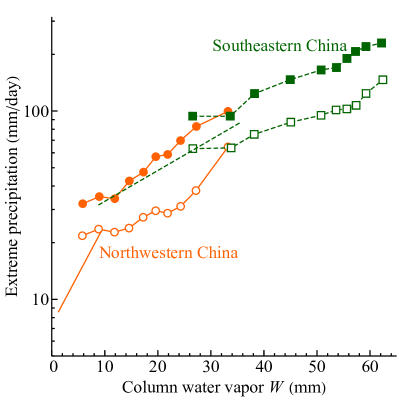
In winter, due to the lower temperature, the same moisture content intervals correspond to a higher relative humidity and the atmospheric column is closer to saturation. Accordingly, for winter rainfall there is no leveling off at these values (Fig. 6). Merging the winter and summer rainfall leads to the disappearance of this feature. It is noteworthy that the limited response of extreme summer rainfall to changes in moisture content is registered in both northwestern and southeastern regions of China that differ greatly in their annual precipitation and atmospheric moisture contents (Dong et al., 2019). (Dong et al. (2019) mention that the linear slopes in the - dependencies are “less than one” which, according to them, is in agreement with “indications that lower tropospheric moisture content increases faster than rainfall”. However, linear slopes in the - dependencies are not unitless, so they cannot be compared to one. In fact, according to the data of Dong et al. (2019, their Fig. 5b), rainfall increases faster than moisture content and not vice versa: e.g., while moisture content increases by 1.5-fold from mm to mm, rainfall increases two-fold from about mm/day to mm/day. A related notice is that precipitation efficiency that Ye et al. (2014) define as monthly precipitation divided by mean monthly moisture content and measure it in per cent, is not unitless but has the units of inverse time.)
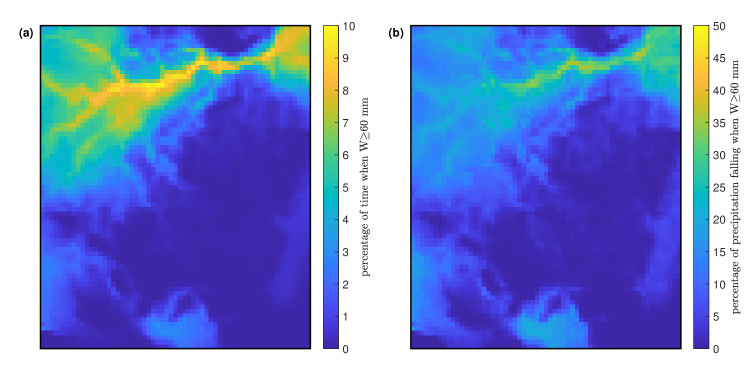
The highest values of hourly precipitation and in the Amazon at mm correspond to the opposite case: a saturated atmosphere with ongoing precipitation. Observations with mm constitute of all observations and account for of all precipitation (Fig. 7). Among the observations with mm, there are very few () observations with zero rain. One can hypothesize that these highest values of atmospheric moisture appear as a consequence of extreme rainfall. The positive dependence between and can be explained by the fact that a more intense rainfall is associated with higher convection; hence, a greater part of the atmospheric column is brought close to saturation.
More than of rainfall correspond to the intermediate interval mm, which is characterized by a relatively constant (Fig. 5b). For each of increasing , precipitation rises by %. This indicates that a higher value of increases the probability of subsequent rainfall (rather than results from rainfall, as in the case of the highest ).
On a different temporal scale, this dichotomy in the - cause-effect relationship was noted for the North Atlantic hurricanes (Makarieva et al., 2017). These hurricanes tend to occur where atmospheric moisture content in the preceding days is about mm higher than the local climatology in the hurricane absence ( mm versus mm). When a hurricane does occur, the maximum moisture content is raised by vigorous convection in the windwall up to over mm (Makarieva et al., 2017, their Fig. 4d,e). Thus, for intermediate moisture content values, higher moisture content on average causes more precipitation. The highest moisture content values are caused by intense precipitation. The change in behavior at high may reflect these patterns.
2.2 Estimating
With known (9), we also need to know (10), to be able to assess how atmospheric moisture convergence changes with increasing evapotranspiration from Eq. (11).
To find a characteristic value for for the case of a hypothetical deforestation in the Amazon, we used the following data for the Amazon basin. With mean transpiration mm/month (Staal et al., 2018) and mean annual rainfall of mm/year (Marengo, 2006), the relative reduction of evapotranspiration due to the loss of transpiration from the entire basin is equal to , i.e., a decrease of 25% (in proportion to precipitation). Baudena et al. (2021) assumed that zeroing transpiration in a region reduces in a given location by the fraction of water vapor originating from transpiration (i.e., by the recycled moisture content ) (see Assumption B in Fig. 3). In the Amazon basin, the fraction of water vapor originating from the Amazon transpiration is equal to (Staal et al., 2018). Thus, with and , we have .
To assess the plausibility of this estimate (and the underlying assumption), we combine Eqs. (9) and (10) to find a relationship between and :
| (14) |
Using Eq. (13) to calculate , we can find from Eq. (14). Figure 8 shows that for grasses, we have and for forests, we have corresponding to the Amazonian rainfall. These estimates provide independent support to that derives from the analysis of Baudena et al. (2021). We recognize the caveat that the data of Zhang et al. (2001) used in Fig. 8 are obtained for annual precipitation and evapotranspiration, while is calculated from hourly precipitation data. However, we can see from Fig. 5b that calculated from monthly and daily precipitation data of Bretherton et al. (2004) are close (within a factor of two) to hourly data in the interval of moisture content values where is relatively constant. This suggests that can appear roughly time-scale invariant at least at characteristic precipitation rates. However, we must also acknowledge that these patterns require further study.
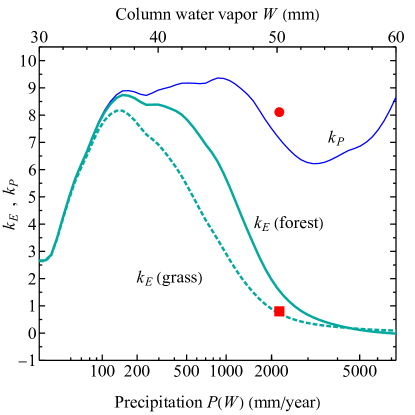
As illustrated by Fig. 3, the precipitation recycling approach yields a different result for . According to Staal et al. (2018), about one-third of the Amazonian precipitation is due to recycled moisture, and of this, two-thirds are due to recycled transpired moisture. If one assumes (see Assumption A in Fig. 3) that zeroing Amazonian transpiration reduces precipitation by , i.e., by , with , from Eq. (14) we have (Fig. 8). This value, one order of magnitude larger than obtained from considering the change in atmospheric moisture content, is too high as compared to what one derives from the data of Zhang et al. (2001). This is unsurprising since the precipitating recycling assumption predicts a decrease in runoff with growing precipitation, while the data of Zhang et al. (2001) shown in Fig. 2 indicate an opposite pattern.
2.3 Ecosystem’s two moisture regimes
Using the dependence (Fig. 5a) and the estimated value of , we can now integrate Eq. (10) assuming for minimal water vapor content mm. This assumption implies that when a steady-state atmosphere is dry, it is because there is no moisture inputs, i.e., the evapotranspiration is negligible. With known and (Fig. 9a) we find moisture convergence from Eq. (11) and evaluate how it depends on .
This reveals two regimes, for low and high (Fig. 9b). In the drier regime with and , moisture convergence declines with increasing evapotranspiration and moisture content, while precipitation remains relatively constant. At higher (i.e., a slower accumulation of atmospheric moisture with growing ), there appears an interval of with negative moisture convergence. This corresponds to dry conditions when the ecosystem becomes a net source of atmospheric moisture as it transpires at the expense of previously accumulated soil moisture or at the expense of irrigation. We characterize this dry regime as “abiotic”, because the ecosystem exploits the geophysical moisture flows and, at , the previously accumulated water stores (Fig. 9b).
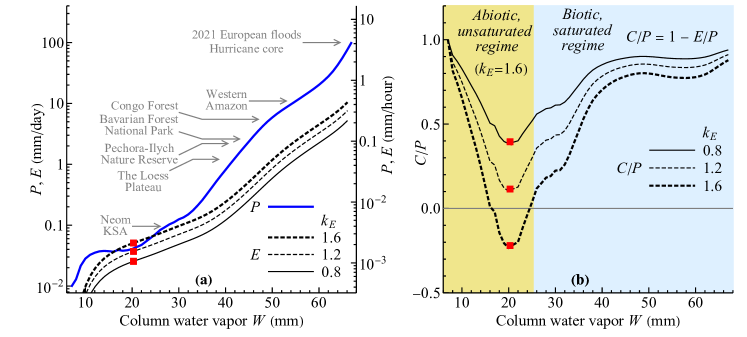
In the wetter regime with , moisture convergence increases together with evapotranspiration, moisture content, and precipitation. (If the soil moisture content is steady, runoff equals moisture convergence and thus behaves similarly.) As the air column approaches saturation at high , precipitation begins to increase markedly with (Fig. 9a). Evaporation, on the other hand, depends on the moisture deficit near the surface atmosphere, which is largely decoupled from total water vapor content (Holloway and Neelin, 2009, their Fig. 3e,f). (Indeed, evapotranspiration and moisture convergence have distinct physics. Moisture convergence occurs when the air rises and water vapor condenses. In contrast, evapotranspiration is not explicitly linked to directional air motions but adds water vapor directly to the atmospheric column facilitated by turbulent diffusion.) Under nearly saturated conditions, evaporation can only proceed if precipitation depletes moisture from the atmosphere creating a water vapor deficit (Murakami, 2006, 2021; Jiménez-Rodríguez et al., 2021). Therefore, at high , precipitation and evapotranspiration should grow approximately proportionally to each other. The evapotranspiration-to-precipitation ratio and the runoff-to-precipitation ratio stabilize at high values of and then remain approximately constant (Fig. 9b). In this wet regime, all the components of the water cycle fall under biotic control.
We note that, by using a constant for all values of moisture content, we have obtained a conservative estimate of moisture convergence at higher moisture content. This is because with the moisture column approaching saturation at higher moisture content, increasing evapotranspiration with increasing relative humidity on a larger time scale becomes more difficult. Therefore, on a time scale of days and months (not taking into account intense evaporation during the rainfall), evaporation should increase more slowly with rising moisture content and precipitation (Fig. 2) causing moisture convergence to raise faster with increasing moisture content than under our conservative assumption of constant .
2.4 Wet season onset in the Southern Amazon
Interestingly, relationship (9) established for local hourly rainfall for a specific study area in the Amazon region (Baudena et al., 2021) encompasses characteristic precipitation rates over a broad range of spatial and temporal scales, from annual precipitation in deserts (Almazroui, 2020) and semi-arid zones (Zhang et al., 2022), boreal (Smirnova et al., 2017), temperate (Beudert et al., 2018) and tropical (Makarieva et al., 2013a) forests, to hurricane- (Makarieva et al., 2017) and flood-causing (Kreienkamp et al., 2021) rainfall (Fig. 9a). How universal the dependence of precipitation on atmospheric moisture content could be in different regions and on different time and spatial scales? What should an experiment look like to demonstrate that ecosystem transpiration can indeed trigger atmospheric moisture convergence on a large scale?
First, one would need data on , and for a large region, to show that when evapotranspiration grows, so do atmospheric moisture and precipitation, and that during this process , such that the atmospheric moisture convergence increases, . Second, one would need data that would prove that the observed increase in moisture content is indeed caused by enhanced evapotranspiration rather than by an external inflow (i.e., not by an increased in Fig. 1). Third, one would need to provide arguments for the cause-effect relationship to exclude the mere coincidence, i.e., that moisture convergence increased due to external geophysical reasons rather than due to local atmospheric moistening by transpiration.
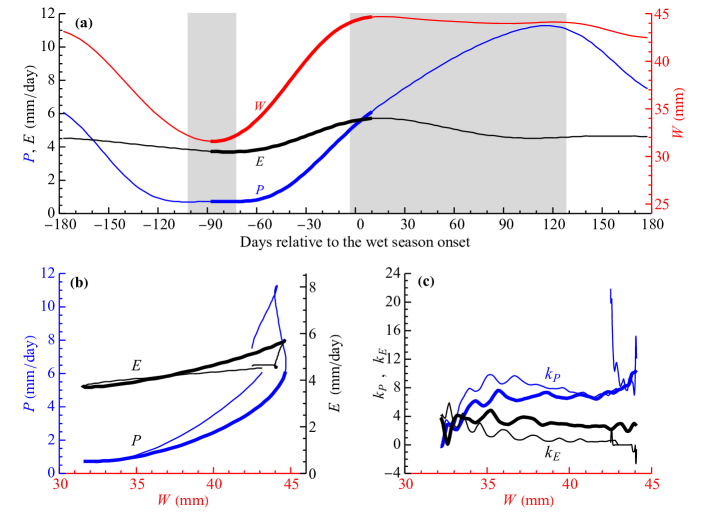
The onset of the wet season in the Southern Amazon studied by Wright et al. (2017) meets these requirements. It has long puzzled researchers as it occurs two months before the major geophysical driver of precipitation at these latitudes: the seasonal migration of the Intertropical Convergence Zone (ITCZ). There are no a priori geophysical grounds to expect the wet season onset so early in this region.
Figure 10, based on the data of Wright et al. (2017), shows that the annual minimal moisture content coincides with the annual minima of precipitation and evapotranspiration. Prior to the onset of the wet season, the atmospheric moisture content, evapotranspiration, and precipitation all increase. Using data on isotopic fractionation that allow to discriminate water vapor originating from transpiration versus oceanic evaporation, Wright et al. (2017) concluded that this additional atmospheric moisture comes from evapotranspiration. The established and dependencies allow to calculate and (Fig. 10b,c). One can see that is, first, within a similar range – for most of the interval as established for the hourly data (cf. Fig. 5b). Second, increases with growing , and most conspicuously so at higher – this feature is also present in the hourly data. Third, and most important, (i.e., atmospheric moisture convergence grows with increasing evapotranspiration) at all except the lowest and the highest.
Between the timepoints with minimal and maximum moisture content (thick curves in Fig. 10), precipitation increases by relative to the mean precipitation during this period ( mm/day = mm/year), evapotranspiration increases by relative to this mean precipitation, and moisture content increases by relative to the mean moisture content during this period ( mm). This gives , and . Interestingly, the latter value during the late dry season in the Amazon falls between the corresponding values for grasses () and forests () for mm/year according to the empirically established dependence of Zhang et al. (2001) (Fig. 2).
At the lowest with one can suspect the presence of the abiotic regime (Fig. 9b). It can extend with the increasing perturbation of the Amazon forest. At the highest during the wet season (the right gray rectangle in Fig. 10a) we can see that evapotranspiration declines, but precipitation continues to increase ( and are undefined due to being constant). This looks like an “autocatalytic” regime when more rainfall produces more moisture convergence that sustains a high atmospheric moisture content. Once this regime is switched on, the role of evapotranspiration in the maintenance of moisture content should decline. Studies are ongoing to understand the physics of similar phenomena over the ocean (Mapes et al., 2018; Masunaga and Mapes, 2020).
In the view of substantial uncertainties in the observational and model estimates of atmospheric moisture content, moisture convergence and runoff, and evapotranspiration (e.g., Allan et al., 2022; Hagemann et al., 2011; Baker et al., 2021), it is essential that and can be measured independently. Atmospheric moisture content can be assessed using satellite data like that of the Atmospheric Infrared Sounder (AIRS) (Tian et al., 2019). Atmospheric moisture convergence can be estimated from the water balance at the catchment scale from measured streamflow and estimated groundwater dynamics (Baker et al., 2021). Using separate estimates for the Southern and Northern parts of the Amazon basin together with the corresponding ERA5 estimates of atmospheric moisture content, we find that their monthly climatologies are similar: the minima and maxima fall on the same months (Fig. S1 in the Supplementary Information). This is consistent with our proposition that a higher atmospheric moisture content can increase atmospheric moisture convergence.
Evapotranspiration, estimated as the difference between precipitation and moisture convergence, accumulates uncertainties from both and estimates and is the least certain term of the catchment water budget (Baker et al., 2021), see also Fig. S1b. However, the available data robustly indicate that the climatological month-to-month variability of evapotranspiration (defined as the standard deviation of climatological monthly values, ) is small relative to precipitation variability , but comparable to that of the atmospheric moisture content, . For the time period – (Fig. S1), we have , and for the Amazon basin as a whole (approximated by the Óbidos gauge), while the corresponding figures for the Southern and Northern parts of the Amazon basin are, respectively, , , and , , (see the Supplementary Information). This is consistent with and . The peculiarities of how evapotranspiration regulates moisture content require further studies.
2.5 Ecological restoration at low and high atmospheric moisture: the Loess Plateau example
The Loess Plateau in China experienced widespread greening since . The greening rate has nearly doubled since with the implementation of a state-supported Green for Grain Program (GFGP) (Zhang et al., 2022). The response of the regional hydrological cycle to re-greening has been complex, inconsistent and debated (Feng et al., 2016; Jia et al., 2017; Wang et al., 2018a; Zheng et al., 2021; Zhang et al., 2022; Wei et al., 2022, and references therein).
The Loess Plateau harbors a gradient of summer atmospheric moisture, with the northwest being drier (at – mm) and the southeast wetter ( around 40 mm) (Jiang and Liang, 2013; Dong et al., 2019). These values span abiotic and biotic regimes in Fig. 9b. Increased greenness has been associated with a rise of atmospheric water content by about – mm per year across the plateau (Jiang and Liang, 2013; Tian et al., 2022). Our findings predict distinct responses across the region. Two recent observation-based studies confirm these conclusions (Zheng et al., 2021; Zhang et al., 2022).
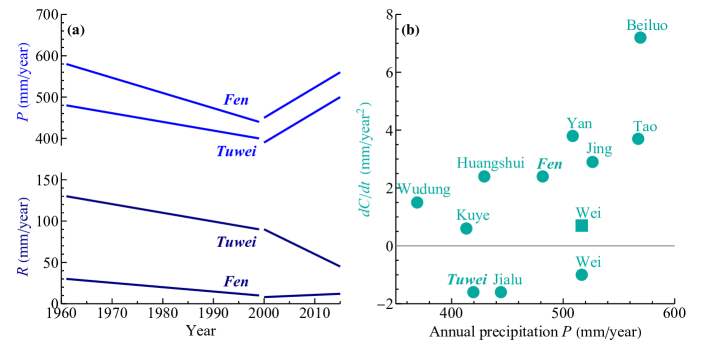
According to Zheng et al. (2021), both annual precipitation () and the runoff-to-precipitation ratio () declined in most river basins on the plateau during –, preceding the large-scale re-greening. When the intense re-greening began in , precipitation began to increase across the plateau (Fig. 11a). Meanwhile, the runoff-to-precipitation ratio in the drier northwestern basins continued to decline, while in the wetter southeastern basins (with annual precipitation exceeding mm/year) it either grew or remained stable, indicating an increasing runoff (Fig. 11a). Zheng et al. (2021) also noted that soil moisture in the upper 5 cm has increased in the wetter regions in – as compared to –, while in the drier regions it decreased.
Zhang et al. (2022) used precipitation data and model-estimated evapotranspiration to study the dynamics of the water yield,
| (15) |
during intense re-greening. They also found that in the drier parts of the basin with annual precipitation not exceeding mm/year, the water yield was declining, while in the wetter parts of the plateau it was increasing (Fig. 11b). It is important to note that the rate of water yield change does not comprise the rate of ground water (soil water) change (), but rather the rate at which the groundwater accumulation changes (). A positive means that the recharge of groundwater accelerates, or the decline of groundwater slows down. For example, in – on several sites on the Loess Plateau, the soil water content was shown to decline, , during the first five years of afforestation, but then stabilized () during the next years (Jia et al., 2017). For this period on average , i.e., the increasing water yield has led to a slower decline of soil water content despite the same (or increasing) runoff.
While there are disagreements between the two studies (e.g., some runoff trends, Fig. 11b), the general patterns support our propositions. The current mean annual precipitation on the Loess Plateau, mm/year, appears to be the point of this region’s transition from the abiotic to the biotic regime.
| Quantity | Pre-GFGP | Post-GFGP | Difference | Change (%) |
|---|---|---|---|---|
| (mm) | ||||
| (mm/year) | ||||
| (mm/year) | ||||
| (mm/year) | ||||
| LAI (%) | ||||
| (mm/year) | ||||
| (mm/year) | ||||
| (mm/year) |
-
; .
The analysis of the MERRA-2 reanalyses dataset by Tian et al. (2022) revealed that the long-term intense re-greening on the Loess Plateau was accompanied by intensification of moisture convergence (Table 2). This suggest that the region is undergoing a transition towards the biotic regime. In twenty years, the net import of moisture has increased almost twofold. This increase occurred despite the decline in the gross import of moisture (i.e., flux in Fig. 1). The gross export of moisture , however, declined even more, thus the net moisture income increased. Since the mean moisture content increased during the same period, the declines in and were due to the decline in the mean wind speed. Eiras-Barca et al. (2020) in a model study found that, conversely, deforestation in the Amazon led to increased wind speeds and reduced rainfall. This illustrates that a high gross moisture import does not guarantee an intense water cycle. Unless the incoming moist air participates in the ascending rain-generating dynamics, it may flow away again without affecting the local water cycle.
Coefficients and corresponding to the long-term re-greening are, respectively, and (Table 2) as compared to and for the onset of the wet season in the Amazon (Section 2.4). Besides different spatiotemporal scales and geographic location, the difference between the two patterns concerns the spatially limited re-greening (and, hence, limited evapotranspiration increase) on the Loess Plateau. During the onset of the wet season, evapotranspiration in the Amazon increases by about (Fig. 10a). On the Loess Plateau, evapotranspiration has increased by about (Table 2). This reflects the limited change in the vegetation cover, which increased by only of the total area, from approximately in – to in – (Tian et al., 2022, their Fig. 3c). An analysis of isotopic data, similar to the one performed by Wright et al. (2017) for the Amazon, could help quantify the contribution of increased evapotranspiration to the added atmospheric moisture.
3 Discussion
3.1 Transpiration triggers moisture convergence
We combined two facts: 1) high atmospheric moisture induces precipitation and moisture convergence and 2) transpiration increases atmospheric moisture. We conclude that transpiration can trigger and control moisture convergence under suitable conditions.
Precipitation occurs when moist air rises and cools. Due to continuity, upward air motion also implies a horizontal air motion and moisture import. The fact that precipitation is associated with high atmospheric moisture content has long been known. Related proposals are that high atmospheric moisture content is not simply a result of precipitation (when the rising air brings the atmospheric column closer to saturation) but can itself trigger precipitation and convection (Peters and Neelin, 2006; Kuo et al., 2017, and references therein) and that high precipitation can trigger and sustain moisture convergence (Mapes et al., 2018). If so, any process that sufficiently increases atmospheric moisture content can also trigger moisture convergence. Transpiration is such a process (Fig. 9b). This echoes the suggestion of Millán (2012, 2014), made in the context of the Mediterranean region, when he argued that the rainfall must be “cultivated” by maintaining a vigorously transpiring vegetation that can import moisture from the ocean.
Work is in progress to obtain a rigorous theoretical understanding of the transition between non-precipitation and precipitation (e.g., Masunaga and Mapes, 2020; Abbott and Cronin, 2021). While theoretical research is ongoing, the projections of numerical models examining hydrological responses to changes in land cover remain uncertain. The water yields and runoff in the major river basins are poorly reproduced by global climate models (Hagemann et al., 2011), and modeling soil moisture has likewise been challenging (Zhou et al., 2021). Global climate models cannot reproduce key elements of observed climatologies without considerable tuning and adjustment (Papadimitriou et al., 2017; Betts et al., 2018; Tan et al., 2021). Therefore, one cannot rely on the models alone to conceptualize vegetation responses and impacts on the water cycle. A search for new governing principles to describe these impacts is well justified.
By demonstrating the link between atmospheric moisture content and changes in runoff (water yield), our findings emphasize the need to make atmospheric moisture an integral part of hydrological assessments, along with the conventional analyses of the other water budget terms. Current analyses of water yield are often decoupled from the analyses of atmospheric moisture content, see, e.g., Li et al. (2018) and Zhang et al. (2022) versus Jiang and Liang (2013) and Dong et al. (2019) for China and Feng et al. (2021) versus Ye et al. (2014) for the boreal zone.
We have pointed out that when the vegetation impact on the water cycle is confined to moisture recycling (i.e., when water vapor is considered as a tracer), then moisture convergence grows as evapotranspiration declines, and vice versa. This pattern has been characterized in the literature as the first-order response of the water cycle to changes in evapotranspiration (e.g., Kooperman et al., 2018; Fowler et al., 2019) and referred to as supported by overwhelming evidence (Ricciardi et al., 2022). In contrast to moisture recycling, which is recognized as being directly affected by vegetation, moisture supply by atmospheric circulation is more commonly attributed to abiotic factors like climate change and variability (e.g., Zhang et al., 2022, and references therein).
Conversely, here we have illustrated that under wetter conditions, increased evapotranspiration should enhance moisture convergence by contributing to increased atmospheric moisture content and rapidly rising precipitation. We have argued that only under drier conditions, increased evapotranspiration can reduce moisture convergence unless the added atmospheric moisture is sufficient to significantly enhance precipitation.
Recent global compilations of the trends in the water cycle are consistent with the proposed duality. Hobeichi et al. (2022) ranked the world’s major regions according to their precipitation and found that in three wettest regions there are statistically significant increases in precipitation, evapotranspiration and runoff in the analyzed time period – (Table S2). In contrast, in the drier regions with increasing evapotranspiration, there is no statistically significant trend in runoff. In the drier regions with increasing runoff, there is no statistically significant trend in evapotranspiration. Furthermore, ratio declines with increasing aridity (Table S2), which is consistent with a declining at lower (Fig. 5b), increasing at lower (Fig. 8), or both.
Another global study indicating distinct responses of the water cycle to increased evapotranspiration under wet and dry conditions, is that of Cui et al. (2022). The authors analyzed how changes in leaf area index in the upwind precipitationsheds (LAI_w) impacted local precipitation and water yields from to . Cui et al. (2022) explored the abiotic influences by performing multiple regression of local annual precipitation versus LAI_w and sea surface temperature, net radiation and local surface air temperature. They found that a global rise in LAI is associated with an increase in annual precipitation of mm/year in –, i.e., by mm/year2. The LAI-associated increase in evapotranspiration constituted of the precipitation value, i.e., mm/year2. The water yield accordingly increased by mm/year2.
Comparing these figures with the results of Hobeichi et al. (2022), who found global mean mm/year2, mm/year2 and runoff mm/year2 in – (Zhang et al. (2016) obtained similar results), we conclude that a major part of precipitation and moisture convergence increase on land is likely due to re-greening accompanied by increasing evapotranspiration – a pattern corresponding to case 3 in Fig. 1b. This pattern, and not the reduction of moisture convergence with growing evapotranspiration (cases 1 and 2), appears to dominate the global response of the terrestrial water cycle to re-greening (Table 3). (Note that Cui et al. (2022) incorrectly stated that the global water availability declines at a rate of mm/year2. This contradicts the available evidence (Table 3).) At the same time, Cui et al. (2022) noted that in the drier regions re-greening appeared to reduce water yield. While further studies are clearly needed to refine and consolidate these conclusions, the available data are consistent with our propositions.
| Source | Period | ||||
|---|---|---|---|---|---|
| Gedney et al. (2006, Fig. 3)∗ | – | 0.68 | |||
| Zhang et al. (2016, Fig. 4c) | – | 0.3 | |||
| Hobeichi et al. (2022) | – | 0.5 | |||
| Cui et al. (2022, Fig. 3f)∗∗ | – |
-
Numbers in italics were calculated by us from the water balance, Eq. (15), using the data reported in the corresponding source.
∗In the first row, it is assumed that .
∗∗Global trends associated with re-greening are shown (, and their difference as water yield, years). Partial derivative was obtained from the multiple regression (see text), , where is the LAI_w increment in years. For evapotranspiration , a similar procedure was applied with local LAI, .
3.2 Future research questions
A new fundamental question is the relative evaluation of the effects of plant transpiration on moisture convergence versus the larger-scale geophysical climatic impacts. Obviously, not all moisture convergence is due to plant transpiration. As an example, the mean change of the water yield with precipitation established by Zhang et al. (2022) for the Loess Plateau as a whole, see Fig. 2b, is about two times the values characteristic of grassland ecosystems (if we use the dependencies in Fig. 2 as a space-for-time substitution). This might be an indication that approximately half of the observed response reflects increased plant transpiration in the region with the rest due to external climatic conditions, e.g. regional warming and, hence, increased carrying capacity of the atmosphere with respect to the water vapor (Tian et al., 2022). This is consistent with the findings of Cui et al. (2022): the trend of moisture convergence attributed to re-greening, mm/year2, is approximately half of the observed long-term moisture convergence trend established by Hobeichi et al. (2022) (Table 3).
Another important question pertains the spatial scale where vegetation effects can become pronounced. Regarding spatial scale, Peters and Neelin (2006) found that self-organization of convection over the ocean triggered by high moisture content can happen over a region of km in diameter. In case of a transpiring ecosystem, the spatial scale should depend on the size of the ecosystem. The Amazon forest can thus modify moisture convergence on a near continental scale (Section 2.4).
Joint consideration of moist atmospheric processes over land (mediated by terrestrial vegetation) and over the ocean (largely governed by geophysics alone) can illuminate the nature of both. For example, Mapes et al. (2018) emphasized the stable coupling of high oceanic precipitation with moisture convergence (advection) and brought up the problem of an unclear causality: whether advection causes forced ascent and precipitation, or, conversely, local convection becomes the cause of a large-scale advection? Mapes et al. (2018) noted that “a finer temporal discernment” is required to answer this question. Wright et al. (2017) had already responded to this question in the Amazon case: using isotopic fractionation, they showed that, at first, transpiration moistens the atmosphere facilitating local convection, which leads to large-scale moisture advection.
Given the non-linearity of the precipitation dependence on moisture content, one caveat when considering deforestation and ecorestoration is that the transient values of precipitation and atmospheric moisture content may not be the same but depend whether the ecosystem is degraded or restored (i.e., hysteresis) (te Wierik et al., 2021).
When restoration begins from dry condition, often the decline of moisture convergence and runoff can be viewed as a virtue. Because under dry conditions most rainfall may occur in violent bursts, after which most water runs away as streamflow without being able to infiltrate into the soil, thus not becoming available to plants and not maintaining the photosynthesis. Besides, such extreme weather events can cause structural damage to the vegetation cover and promote the soil compaction. Therefore, the first stage of restoration is to reduce the loss of water from runoff (e.g., Kravčík et al., 2007; te Wierik et al., 2021, their Fig. 4). Once the hydrological cycle has been sufficiently restored and there is an adequate precipitation and more stable runoff that can be used for human activities, i.e., near the transition, then there appears a competition for moisture convergence between the recovering ecosystem and people.
Indeed, the decline of the water yield in several reforested areas in China has been interpreted as limiting further ecosystem restoration in these areas (Feng et al., 2016). However, Fig. 9b suggests that if re-greening is continued, the ecosystem can tip into a wetter state when further re-greening enhances both rainfall, moisture convergence, and runoff. Indeed, in the wetter areas in China, re-greening did cause an increase in runoff and water yield (e.g., Wang et al., 2018b; Zheng et al., 2021; Zhang et al., 2022). Establishing key parameters of the two regimes and assessing the potential transition from the drier to the wetter state (during which the recovering ecosystem might require extra water inputs) can inform and guide afforestation and reforestation strategies, including assessing the possibilities for the recovery of ecosystem productivity in the arid regions.
3.3 The role of natural forests, native vegetation and ecological succession
In a seasonal climate with a pronounced dry and wet season, transpiration during the dry season may cause loss of moisture that will not be recovered during the wet season. How much water a recovering ecosystem spends for transpiration at each stage of recovery will determine whether the system reaches a successful transition to the wetter, sustainable regime. It is noteworthy that most trees are C3-plants that have a higher “water loss” per each carbon dioxide molecule fixed, while the C4-plants that use water more sparingly are predominantly herbs such as grasses and sedges. Accordingly, ecological restoration imitating natural succession with the first stages represented by grasses, with trees appearing on a later (i.e., wetter) stage, should have more chances to achieve a stable wet state than an artificial tree planting (of exotic or native tree species) that transpire actively under the dry conditions and thus can deplete soil water storage (e.g., Li et al., 2021; Yang et al., 2022).
The wetter the atmosphere, the stronger the biotic control of the water cycle and the more resilient the forest: by slightly changing evapotranspiration, forests should be able to compensate for unfavorable disturbances of the water cycle, e.g., they can adjust to reduced moisture import by enhancing transpiration-induced moisture convergence. In a drier atmosphere with less rainfall, the control of moisture convergence by transpiration is limited, and the forest is more vulnerable to external perturbations. This could explain why the Amazon forest appears to be losing resilience where the rainfall is already relatively low (rather than where rainfall is decreasing) (Boulton et al., 2022). Conversely, external forest disturbances (for example, antropogenic fires) can undermine ecological mechanisms responsible for the maintenance of the wetter regime (e.g., Aleinikov, 2019). External disturbances can also facilitate a potentially irreversible transition of the ecosystem to the drier regime where it will be losing rather than gaining moisture, with complete ecosystem degradation as a possible outcome. This scenario can stand behind the “landscape trap ” phenomenon, when repeated disturbances (in particular, logging) increase the ecosystem’s susceptibility to fire preventing its recovery (Lindenmayer et al., 2022).
Regulation of moisture convergence could explain how forests buffer precipitation extremes across continents (O’Connor et al., 2021; Silva de Oliveira et al., 2021). While over a broad range of mm the value of is relatively constant (the light blue area in Fig. 5b), it increases sharply at larger . The interval of mm harbors very high precipitation rates observed under extreme weather conditions (Fig. 9a). Volatile organic compounds produced by the forest ecosystem can facilitate precipitation at lower moisture content values, thus not allowing extreme precipitation and winds to develop. It remains to be investigated whether/how forest disturbances influence the probability of and extremes.
Our finding that forest transpiration can trigger and control atmospheric moisture convergence corroborates the biotic pump concept (Makarieva and Gorshkov, 2007; Makarieva et al., 2014). The Amazon forest transpiration during the late dry season moistens the atmosphere and triggers the wet season and associated ocean-to-land moisture inflow (Wright et al., 2017). This dry-season transpiration has a phenological and, hence, an evolutionary component that encodes the Amazon dry-season greening (Saleska et al., 2016). Enhanced transpiration preceding the wet season was also observed in the forests of Northeast India and the Congo basin (Pradhan et al., 2019; Worden et al., 2021).
There is a complex interplay of physical and biotic factors behind the ecosystem control of moisture convergence. We have discussed that moisture convergence will grow if precipitation increases faster than evapotranspiration with increasing moisture content (Section 1.1). Physics dictates that the probability of precipitation rises as the atmosphere approaches saturation. In contrast, other things being equal, evaporation declines as the water vapor deficit diminishes. Therefore, with increasing , physics alone guarantees that the required condition is fulfilled due to the negative . On the other hand, a declining evapotranspiration cannot cause the moisture content to rise. It is here where the biotic processes come into play. For a given water vapor deficit, evapotranspiration can be increased as young actively transpiring leaves replace old leaves during dry season leaf flush, as seen in the Amazon (Saleska et al., 2016; Wu et al., 2016; Albert et al., 2018). Leaf flushing can make evapotranspiration grow while (and despite) the atmosphere moistens and the water vapor deficit diminishes, as during the late dry season in the Southern Amazon (Fig. 10). Once leaf flushing ceases and the atmosphere is sufficiently moistened to enter the “autocatalytic ” regime when precipitation and high moisture are maintained by moisture convergence, the evapotranspiration can decline, as it does with the onset of the wet season in the Southern Amazon (Fig. 10).
For such a scenario to occur, there should be a proper synchronization between the key geophysical and biotic processes. We emphasize the importance of when evapotranspiration increases. The change in evapotranspiration, as governed by the moisture balance equation, impacts how rapidly the rate of moisture content changes (Section 1.1). If evapotranspiration begins to rise when the atmospheric moisture content is decreasing due to geophysical factors, this can partially compensate for the decrease but may be insufficient to revert it. In such a case, moisture convergence cannot grow, and the transpired moisture can be lost from the ecosystem. On the other hand, compensation of the decline in the atmospheric moisture content can mitigate potentially greater moisture losses. The ecosystem can react both to the deviation of the atmospheric moisture content from some optimal value as well as to the rate of moisture content change, a similar mechanism to what has been proposed for biotic temperature control (Leggett and Ball, 2020). Native communities, over evolutionary time, evolve phenologies optimized for regional geophysical conditions (Gauzere et al., 2020), and the ecohydrological links elucidated here could in principle also select for maximizing the efficiency of the biotic control of the water cycle. When some set of cultivated species, selected on whatever basis, replaces native ecosystems, this synchronization can be disrupted, and transpiration can contribute to drying rather than moistening. These complicated processes should be further investigated.
If natural forest ecosystems have indeed evolved mechanisms to stabilize and sustain the continental water cycle, their destruction contributes to the destabilization and impoverishment of regional water cycles and climates. This contribution is underestimated (Sheil et al., 2019). Future studies of vegetation cover impacts on atmospheric moisture flows must emphasize the role of natural forests (Zemp et al., 2017a; Sheil, 2018; Makarieva et al., 2020; Leite-Filho et al., 2021; Hua et al., 2022).
4 Conclusions
We have shown that deforestation reduces not just precipitation, but also atmospheric moisture convergence. Conversely, increased transpiration from ecological restoration should increase both – provided it occurs at a sufficiently high atmospheric moisture content. These conclusions offer good news for global restoration, where reduced global runoff has often been predicted. Our results indicate that restoration can transition through this negative phase into a context when re-greening can profoundly improve water yields and overall availability. Rigorous interdisciplinary scientific planning merging ecology and atmospheric science is required to achieve this.
Acknowledgments
We thank Dr. Arie Staal and Dr. David Ellison for their useful comments on early drafts of this work. The work of A.M. Makarieva is funded by the Federal Ministry of Education and Research (BMBF) and the Free State of Bavaria under the Excellence Strategy of the Federal Government and the Länder, as well as by the Technical University of Munich – Institute for Advanced Study. Thanks to BemTeVi Foundation for support to Ruben Molina under the Windrose Research Grant. Scott Saleska acknowledges support from the U.S. National Science Foundation (award #2106804).
Supplementary Information
| This table reports the -th percentiles , the mean () and the standard deviations (sd) of the distribution of hourly precipitation (mm/hour) in the Amazon study area of Baudena et al. (2021), between 0–18S and 50–65W (Fig. 4). The analyses were performed for the period 2003–2014 at resolution. Hourly precipitation and column water vapor () are from the ERA5 dataset (Hersbach et al., 2018). Precipitation was binned for different values of , every millimeter of . For each bin, we calculated the precipitation percentiles only if there were more than five points in the bin, from mm up to the maximum retained value of mm. | |||||||||
| bin | sd | ||||||||
| \endfirsthead Table S0 – continued from previous page | |||||||||
| bin | sd | ||||||||
| \endhead Continued on next page | |||||||||
| \endfoot\endlastfoot 3 | 0.00 | 0.00 | 0.00 | 0.00 | 0.00 | 0.00 | 0.01 | 0.00 | 0.00 |
| 4 | 0.00 | 0.00 | 0.00 | 0.00 | 0.00 | 0.00 | 0.01 | 0.00 | 0.01 |
| 5 | 0.00 | 0.00 | 0.00 | 0.00 | 0.00 | 0.00 | 0.01 | 0.00 | 0.00 |
| 6 | 0.00 | 0.00 | 0.00 | 0.00 | 0.00 | 0.00 | 0.01 | 0.00 | 0.00 |
| 7 | 0.00 | 0.00 | 0.00 | 0.00 | 0.00 | 0.00 | 0.01 | 0.00 | 0.00 |
| 8 | 0.00 | 0.00 | 0.00 | 0.00 | 0.00 | 0.00 | 0.02 | 0.00 | 0.00 |
| 9 | 0.00 | 0.00 | 0.00 | 0.00 | 0.00 | 0.00 | 0.02 | 0.00 | 0.01 |
| 10 | 0.00 | 0.00 | 0.00 | 0.00 | 0.00 | 0.00 | 0.03 | 0.00 | 0.01 |
| 11 | 0.00 | 0.00 | 0.00 | 0.00 | 0.00 | 0.00 | 0.04 | 0.00 | 0.01 |
| 12 | 0.00 | 0.00 | 0.00 | 0.00 | 0.00 | 0.00 | 0.05 | 0.00 | 0.01 |
| 13 | 0.00 | 0.00 | 0.00 | 0.00 | 0.00 | 0.00 | 0.05 | 0.00 | 0.01 |
| 14 | 0.00 | 0.00 | 0.00 | 0.00 | 0.00 | 0.00 | 0.05 | 0.00 | 0.02 |
| 15 | 0.00 | 0.00 | 0.00 | 0.00 | 0.00 | 0.00 | 0.04 | 0.00 | 0.02 |
| 16 | 0.00 | 0.00 | 0.00 | 0.00 | 0.00 | 0.00 | 0.04 | 0.00 | 0.02 |
| 17 | 0.00 | 0.00 | 0.00 | 0.00 | 0.00 | 0.00 | 0.04 | 0.00 | 0.02 |
| 18 | 0.00 | 0.00 | 0.00 | 0.00 | 0.00 | 0.00 | 0.03 | 0.00 | 0.02 |
| 19 | 0.00 | 0.00 | 0.00 | 0.00 | 0.00 | 0.00 | 0.03 | 0.00 | 0.02 |
| 20 | 0.00 | 0.00 | 0.00 | 0.00 | 0.00 | 0.00 | 0.02 | 0.00 | 0.03 |
| 21 | 0.00 | 0.00 | 0.00 | 0.00 | 0.00 | 0.00 | 0.02 | 0.00 | 0.03 |
| 22 | 0.00 | 0.00 | 0.00 | 0.00 | 0.00 | 0.00 | 0.02 | 0.00 | 0.03 |
| 23 | 0.00 | 0.00 | 0.00 | 0.00 | 0.00 | 0.00 | 0.02 | 0.00 | 0.04 |
| 24 | 0.00 | 0.00 | 0.00 | 0.00 | 0.00 | 0.00 | 0.03 | 0.00 | 0.05 |
| 25 | 0.00 | 0.00 | 0.00 | 0.00 | 0.00 | 0.00 | 0.04 | 0.00 | 0.05 |
| 26 | 0.00 | 0.00 | 0.00 | 0.00 | 0.00 | 0.00 | 0.05 | 0.00 | 0.06 |
| 27 | 0.00 | 0.00 | 0.00 | 0.00 | 0.00 | 0.00 | 0.06 | 0.00 | 0.07 |
| 28 | 0.00 | 0.00 | 0.00 | 0.00 | 0.00 | 0.00 | 0.06 | 0.00 | 0.08 |
| 29 | 0.00 | 0.00 | 0.00 | 0.00 | 0.00 | 0.00 | 0.07 | 0.00 | 0.08 |
| 30 | 0.00 | 0.00 | 0.00 | 0.00 | 0.00 | 0.00 | 0.08 | 0.01 | 0.09 |
| 31 | 0.00 | 0.00 | 0.00 | 0.00 | 0.00 | 0.00 | 0.10 | 0.01 | 0.09 |
| 32 | 0.00 | 0.00 | 0.00 | 0.00 | 0.00 | 0.00 | 0.12 | 0.01 | 0.09 |
| 33 | 0.00 | 0.00 | 0.00 | 0.00 | 0.00 | 0.00 | 0.14 | 0.01 | 0.10 |
| 34 | 0.00 | 0.00 | 0.00 | 0.00 | 0.00 | 0.00 | 0.17 | 0.01 | 0.10 |
| 35 | 0.00 | 0.00 | 0.00 | 0.00 | 0.00 | 0.01 | 0.20 | 0.01 | 0.10 |
| 36 | 0.00 | 0.00 | 0.00 | 0.00 | 0.00 | 0.01 | 0.25 | 0.01 | 0.12 |
| 37 | 0.00 | 0.00 | 0.00 | 0.00 | 0.00 | 0.02 | 0.30 | 0.02 | 0.13 |
| 38 | 0.00 | 0.00 | 0.00 | 0.00 | 0.00 | 0.03 | 0.38 | 0.02 | 0.15 |
| 39 | 0.00 | 0.00 | 0.00 | 0.00 | 0.00 | 0.05 | 0.48 | 0.03 | 0.17 |
| 40 | 0.00 | 0.00 | 0.00 | 0.00 | 0.01 | 0.06 | 0.60 | 0.03 | 0.19 |
| 41 | 0.00 | 0.00 | 0.00 | 0.00 | 0.01 | 0.08 | 0.77 | 0.04 | 0.23 |
| 42 | 0.00 | 0.00 | 0.00 | 0.00 | 0.02 | 0.09 | 0.99 | 0.05 | 0.26 |
| 43 | 0.00 | 0.00 | 0.00 | 0.00 | 0.02 | 0.12 | 1.27 | 0.07 | 0.30 |
| 44 | 0.00 | 0.00 | 0.00 | 0.00 | 0.03 | 0.15 | 1.54 | 0.08 | 0.34 |
| 45 | 0.00 | 0.00 | 0.00 | 0.00 | 0.04 | 0.19 | 1.85 | 0.10 | 0.39 |
| 46 | 0.00 | 0.00 | 0.00 | 0.00 | 0.06 | 0.24 | 2.20 | 0.12 | 0.44 |
| 47 | 0.00 | 0.00 | 0.00 | 0.00 | 0.07 | 0.31 | 2.53 | 0.15 | 0.50 |
| 48 | 0.00 | 0.00 | 0.00 | 0.01 | 0.10 | 0.40 | 2.85 | 0.18 | 0.56 |
| 49 | 0.00 | 0.00 | 0.00 | 0.01 | 0.12 | 0.52 | 3.16 | 0.21 | 0.61 |
| 50 | 0.00 | 0.00 | 0.00 | 0.02 | 0.16 | 0.64 | 3.42 | 0.24 | 0.66 |
| 51 | 0.00 | 0.00 | 0.00 | 0.03 | 0.20 | 0.78 | 3.64 | 0.28 | 0.71 |
| 52 | 0.00 | 0.00 | 0.00 | 0.04 | 0.24 | 0.91 | 3.83 | 0.32 | 0.76 |
| 53 | 0.00 | 0.00 | 0.00 | 0.06 | 0.30 | 1.05 | 4.01 | 0.36 | 0.80 |
| 54 | 0.00 | 0.00 | 0.00 | 0.08 | 0.37 | 1.19 | 4.17 | 0.40 | 0.84 |
| 55 | 0.00 | 0.00 | 0.01 | 0.10 | 0.46 | 1.34 | 4.36 | 0.45 | 0.89 |
| 56 | 0.00 | 0.00 | 0.01 | 0.13 | 0.55 | 1.50 | 4.55 | 0.51 | 0.95 |
| 57 | 0.00 | 0.00 | 0.02 | 0.18 | 0.66 | 1.66 | 4.78 | 0.57 | 1.01 |
| 58 | 0.00 | 0.00 | 0.03 | 0.23 | 0.79 | 1.84 | 5.05 | 0.65 | 1.08 |
| 59 | 0.00 | 0.00 | 0.05 | 0.29 | 0.93 | 2.03 | 5.39 | 0.73 | 1.17 |
| 60 | 0.00 | 0.00 | 0.07 | 0.36 | 1.09 | 2.26 | 5.92 | 0.84 | 1.30 |
| 61 | 0.00 | 0.01 | 0.10 | 0.45 | 1.28 | 2.54 | 6.79 | 0.98 | 1.48 |
| 62 | 0.00 | 0.01 | 0.13 | 0.56 | 1.50 | 2.90 | 8.29 | 1.15 | 1.74 |
| 63 | 0.00 | 0.02 | 0.19 | 0.71 | 1.79 | 3.40 | 10.72 | 1.41 | 2.12 |
| 64 | 0.00 | 0.04 | 0.26 | 0.91 | 2.20 | 4.23 | 13.89 | 1.78 | 2.66 |
| 65 | 0.00 | 0.07 | 0.37 | 1.19 | 2.77 | 5.70 | 16.98 | 2.32 | 3.35 |
| 66 | 0.00 | 0.12 | 0.51 | 1.57 | 3.71 | 8.39 | 20.25 | 3.11 | 4.23 |
| 67 | 0.00 | 0.18 | 0.77 | 2.25 | 5.55 | 11.71 | 22.72 | 4.23 | 5.15 |
| 68 | 0.00 | 0.26 | 1.07 | 3.37 | 8.40 | 14.70 | 25.11 | 5.65 | 6.07 |
| 69 | 0.00 | 0.28 | 1.36 | 4.95 | 11.26 | 16.95 | 26.27 | 7.05 | 6.75 |
| 70 | 0.03 | 0.56 | 2.19 | 6.64 | 13.38 | 19.64 | 29.85 | 8.60 | 7.60 |
| 71 | 0.02 | 0.75 | 2.76 | 10.29 | 15.52 | 21.23 | 29.22 | 10.26 | 7.76 |
| 72 | 0.04 | 0.52 | 3.15 | 11.37 | 17.13 | 20.40 | 28.52 | 10.62 | 7.61 |
| 73 | 0.07 | 0.10 | 0.17 | 0.78 | 2.30 | 29.90 | 35.50 | 6.29 | 11.89 |
In Fig. S1, to approximate the Northern and Southern Amazon regions from Baker et al.’s (2021) Figs. S12, we used basin polygons from HydroBASINS (Lehner and Grill, 2013). For the Amazon basin up to the Óbidos station, we used the polygon from the Global Runoff Data Base (https://www.bafg.de/GRDC/EN/02_srvcs/22_gslrs/gislayers_node.html). For geoprocessing, we used geopandas (Ver. 0.12.2; Jordahl et al., 2022) to select and join the HydroBASINS vector data, xarray (Ver. 2022.12.0; Hoyer et al., 2022) and rioxarray (Ver. 0.13.2; Snow et al., 2022a) to load and subset the ERA5 raster data, and geocube (Ver. 0.3.3; Snow et al., 2022b) to rasterize the regions into the ERA5 data grid. The Óbidos mask has cells (the bounding box spans from latitudes to and longitudes to ). The Southern mask has cells (the bounding box spans from latitudes to and longitudes to ). The Northern mask has cells (the bounding box spans from latitudes to and longitudes to ).
The quantities , and , discussed in Section 2.4, represent month-to-month variability:
| (S1) |
where is the value of in the -th month as shown in Fig. S1, is the mean annual value, and . According to ERA5 data, the mean annual precipitation values are mm/year, mm/year and mm/year for Northern, Southern and Óbidos, respectively. The corresponding mean annual atmospheric moisture content and evapotranspiration values are mm, mm and mm and mm/year, mm/year and mm/year, respectively.
| Regime | |||||
|---|---|---|---|---|---|
| “Extremely wet, low variability” | (–) | (–) | (–) | ||
| “Very wet, low variability” | (–) | (–) | (–) | ||
| “Wet, low variability” | (–) | (–) | (–) | ||
| “Wet, medium variability” | NS | NS | NS | ||
| “Mild wet, medium variability” | NS | (–) | NS | ||
| “Mild dry, medium variability” | NS | (–) | NS | ||
| “Dry, medium variability” | (–) | (–) | NS | ||
| “Dry, high variability” | (–) | NS | (–) | ||
| “Very dry, very high variability” | NS | NS | (–) |
-
Abbreviation: NS, no significant trend.
References
- Abbott and Cronin (2021) Abbott, T. H. and Cronin, T. W.: Aerosol invigoration of atmospheric convection through increases in humidity, Science, 371, 83–85, 10.1126/science.abc5181, 2021.
- Albert et al. (2018) Albert, L. P., Wu, J., Prohaska, N., de Camargo, P. B., Huxman, T. E., Tribuzy, E. S., Ivanov, V. Y., Oliveira, R. S., Garcia, S., Smith, M. N., Oliveira Junior, R. C., Restrepo-Coupe, N., da Silva, R., Stark, S. C., Martins, G. A., Penha, D. V., and Saleska, S. R.: Age-dependent leaf physiology and consequences for crown-scale carbon uptake during the dry season in an Amazon evergreen forest, New Phytologist, 219, 870–884, 10.1111/nph.15056, 2018.
- Aleinikov (2019) Aleinikov, A.: The fire history in pine forests of the plain area in the Pechora-Ilych Nature Biosphere Reserve (Russia) before 1942: Possible anthropogenic causes and long-term effects, Nature Conservation Research, 4, 21–34, 10.24189/ncr.2019.033, 2019.
- Allan et al. (2022) Allan, R. P., Willett, K. M., John, V. O., and Trent, T.: Global changes in water vapor 1979–2020, Journal of Geophysical Research: Atmospheres, 127, e2022JD036 728, 10.1029/2022JD036728, 2022.
- Almazroui (2020) Almazroui, M.: Rainfall trends and extremes in Saudi Arabia in recent decades, Atmosphere, 11, 964, 10.3390/atmos11090964, 2020.
- Baker et al. (2021) Baker, J. C. A., Garcia-Carreras, L., Gloor, M., Marsham, J. H., Buermann, W., da Rocha, H. R., Nobre, A. D., de Araujo, A. C., and Spracklen, D. V.: Evapotranspiration in the Amazon: spatial patterns, seasonality, and recent trends in observations, reanalysis, and climate models, Hydrology and Earth System Sciences, 25, 2279–2300, 10.5194/hess-25-2279-2021, 2021.
- Baudena et al. (2021) Baudena, M., Tuinenburg, O. A., Ferdinand, P. A., and Staal, A.: Effects of land-use change in the Amazon on precipitation are likely underestimated, Global Change Biology, 27, 5580–5587, 10.1111/gcb.15810, 2021.
- Betts et al. (2018) Betts, R. A., Alfieri, L., Bradshaw, C., Caesar, J., Feyen, L., Friedlingstein, P., Gohar, L., Koutroulis, A., Lewis, K., Morfopoulos, C., Papadimitriou, L., Richardson, K. J., Tsanis, I., and Wyser, K.: Changes in climate extremes, fresh water availability and vulnerability to food insecurity projected at 1.5oC and 2oC global warming with a higher-resolution global climate model, Philosophical Transactions of the Royal Society A: Mathematical, Physical and Engineering Sciences, 376, 20160 452, 10.1098/rsta.2016.0452, 2018.
- Beudert et al. (2018) Beudert, B., Bernsteinová, J., Premier, J., and Bässler, C.: Natural disturbance by bark beetle offsets climate change effects on streamflow in headwater catchments of the Bohemian Forest, Silva Gabreta, 24, 21–45, 2018.
- Boulton et al. (2022) Boulton, C. A., Lenton, T. M., and Boers, N.: Pronounced loss of Amazon rainforest resilience since the early 2000s, Nature Climate Change, 12, 271–278, 10.1038/s41558-022-01287-8, 2022.
- Bretherton et al. (2004) Bretherton, C. S., Peters, M. E., and Back, L. E.: Relationships between water vapor path and precipitation over the tropical oceans, Journal of Climate, 17, 1517–1528, 10.1175/1520-0442(2004)017<1517:RBWVPA>2.0.CO;2, 2004.
- Charney (1976) Charney, J.: Reply, Quarterly Journal of the Royal Meteorological Society, 102, 468, 10.1002/qj.49710243220, 1976.
- Cui et al. (2022) Cui, J., Lian, X., Huntingford, C., Gimeno, L., Wang, T., Ding, J., He, M., Xu, H., Chen, A., Gentine, P., and Piao, S.: Global water availability boosted by vegetation-driven changes in atmospheric moisture transport, Nature Geoscience, 15, 982–988, 10.1038/s41561-022-01061-7, 2022.
- Dee et al. (2011) Dee, D. P., Uppala, S. M., Simmons, A. J., Berrisford, P., Poli, P., Kobayashi, S., Andrae, U., Balmaseda, M. A., Balsamo, G., Bauer, P., Bechtold, P., Beljaars, A. C. M., van de Berg, L., Bidlot, J., Bormann, N., Delsol, C., Dragani, R., Fuentes, M., Geer, A. J., Haimberger, L., Healy, S. B., Hersbach, H., Hólm, E. V., Isaksen, L., Kållberg, P., Köhler, M., Matricardi, M., McNally, A. P., Monge-Sanz, B. M., Morcrette, J.-J., Park, B.-K., Peubey, C., de Rosnay, P., Tavolato, C., Thépaut, J.-N., and Vitart, F.: The ERA-Interim reanalysis: Configuration and performance of the data assimilation system, Quarterly Journal of the Royal Meteorological Society, 137, 553–597, 10.1002/qj.828, 2011.
- Dong et al. (2019) Dong, W., Lin, Y., Wright, J. S., Xie, Y., Yin, X., and Guo, J.: Precipitable water and CAPE dependence of rainfall intensities in China, Climate Dynamics, 52, 3357–3368, 10.1007/s00382-018-4327-8, 2019.
- Eiras-Barca et al. (2020) Eiras-Barca, J., Dominguez, F., Yang, Z., Chug, D., Nieto, R., Gimeno, L., and Miguez-Macho, G.: Changes in South American hydroclimate under projected Amazonian deforestation, Annals of the New York Academy of Sciences, 1472, 104–122, 10.1111/nyas.14364, 2020.
- Ellison et al. (2012) Ellison, D., N. Futter, M., and Bishop, K.: On the forest cover–water yield debate: from demand- to supply-side thinking, Global Change Biology, 18, 806–820, 10.1111/j.1365-2486.2011.02589.x, 2012.
- Eltahir and Bras (1994) Eltahir, E. A. B. and Bras, R. L.: Precipitation recycling in the Amazon basin, Quarterly Journal of the Royal Meteorological Society, 120, 861–880, 10.1002/qj.49712051806, 1994.
- Feng et al. (2021) Feng, D., Gleason, C. J., Lin, P., Yang, X., Pan, M., and Ishitsuka, Y.: Recent changes to Arctic river discharge, Nature Communications, 12, 6917, 10.1038/s41467-021-27228-1, 2021.
- Feng et al. (2016) Feng, X., Fu, B., Piao, S., Wang, S., Ciais, P., Zeng, Z., Lü, Y., Zeng, Y., Li, Y., Jiang, X., and Wu, B.: Revegetation in China’s Loess Plateau is approaching sustainable water resource limits, Nature Climate Change, 6, 1019–1022, 10.1038/nclimate3092, 2016.
- Fowler et al. (2019) Fowler, M. D., Kooperman, G. J., Randerson, J. T., and Pritchard, M. S.: The effect of plant physiological responses to rising CO2 on global streamflow, Nature Climate Change, 9, 873–879, 10.1038/s41558-019-0602-x, 2019.
- Gauzere et al. (2020) Gauzere, J., Teuf, B., Davi, H., Chevin, L.-M., Caignard, T., Leys, B., Delzon, S., Ronce, O., and Chuine, I.: Where is the optimum? Predicting the variation of selection along climatic gradients and the adaptive value of plasticity. A case study on tree phenology, Evolution Letters, 4, 109–123, 10.1002/evl3.160, 2020.
- Gedney et al. (2006) Gedney, N., Cox, P. M., Betts, R. A., Boucher, O., Huntingford, C., and Stott, P. A.: Detection of a direct carbon dioxide effect in continental river runoff records, Nature, 439, 835–838, 10.1038/nature04504, 2006.
- Gleeson et al. (2016) Gleeson, T., Befus, K. M., Jasechko, S., Luijendijk, E., and Cardenas, M. B.: The global volume and distribution of modern groundwater, Nature Geoscience, 9, 161–167, 10.1038/ngeo2590, 2016.
- Gorshkov (1995) Gorshkov, V. G.: Physical and biological bases of life stability. Man, Biota, Environment, Springer, Berlin, Heidelberg, 10.1007/978-3-642-85001-1, 1995.
- Hagemann et al. (2011) Hagemann, S., Chen, C., Haerter, J. O., Heinke, J., Gerten, D., and Piani, C.: Impact of a statistical bias correction on the projected hydrological changes obtained from three GCMs and two hydrology models, Journal of Hydrometeorology, 12, 556–578, 10.1175/2011JHM1336.1, 2011.
- Hersbach et al. (2018) Hersbach, H., Bell, B., Berrisford, P., Biavati, G., Horányi, A., Muñoz Sabater, J., Nicolas, J., Peubey, C., Radu, R., Rozum, I., Schepers, D., Simmons, A., Soci, C., Dee, D., and Thépaut, J.-N.: ERA5 hourly data on single levels from 1979 to present, Copernicus Climate Change Service (C3S) Climate Data Store (CDS). (Accessed on 22-03-2021), 10.24381/cds.adbb2d47, 2018.
- Hobeichi et al. (2022) Hobeichi, S., Abramowitz, G., Ukkola, A. M., De Kauwe, M., Pitman, A., Evans, J. P., and Beck, H.: Reconciling historical changes in the hydrological cycle over land, npj Climate and Atmospheric Science, 5, 17, 10.1038/s41612-022-00240-y, 2022.
- Hoek van Dijke et al. (2022) Hoek van Dijke, A. J., Herold, M., Mallick, K., Benedict, I., Machwitz, M., Schlerf, M., Pranindita, A., Theeuwen, J. J. E., Bastin, J.-F., and Teuling, A. J.: Shifts in regional water availability due to global tree restoration, Nature Geoscience, 15, 363–368, 10.1038/s41561-022-00935-0, 2022.
- Holloway and Neelin (2009) Holloway, C. E. and Neelin, J. D.: Moisture vertical structure, column water vapor, and tropical deep convection, Journal of the Atmospheric Sciences, 66, 1665–1683, 10.1175/2008JAS2806.1, 2009.
- Holloway and Neelin (2010) Holloway, C. E. and Neelin, J. D.: Temporal relations of column water vapor and tropical precipitation, Journal of the Atmospheric Sciences, 67, 1091–1105, 10.1175/2009JAS3284.1, 2010.
- Hoyer et al. (2022) Hoyer, S., Roos, M., Joseph, H., Magin, J., Cherian, D., Fitzgerald, C., Hauser, M., Fujii, K., Maussion, F., Imperiale, G., Clark, S., Kleeman, A., Nicholas, T., Kluyver, T., Westling, J., Munroe, J., Amici, A., Barghini, A., Banihirwe, A., Bell, R., Hatfield-Dodds, Z., Abernathey, R., Bovy, B., Omotani, J., Mühlbauer, K., Roszko, M. K., and Wolfram, P. J.: xarray, 10.5281/zenodo.7392365, 2022.
- Hua et al. (2022) Hua, F., Bruijnzeel, L. A., Meli, P., Martin, P. A., Zhang, J., Nakagawa, S., Miao, X., Wang, W., McEvoy, C., Peña-Arancibia, J. L., Brancalion, P. H. S., Smith, P., Edwards, D. P., and Balmford, A.: The biodiversity and ecosystem service contributions and trade-offs of forest restoration approaches, Science, 376, 839–844, 10.1126/science.abl4649, 2022.
- Huffman et al. (2007) Huffman, G. J., Bolvin, D. T., Nelkin, E. J., Wolff, D. B., Adler, R. F., Gu, G., Hong, Y., Bowman, K. P., and Stocker, E. F.: The TRMM Multisatellite Precipitation Analysis (TMPA): Quasi-global, multiyear, combined-sensor precipitation estimates at fine scales, Journal of Hydrometeorology, 8, 38–55, 10.1175/JHM560.1, 2007.
- Jia et al. (2017) Jia, X., Shao, M., Zhu, Y., and Luo, Y.: Soil moisture decline due to afforestation across the Loess Plateau, China, Journal of Hydrology, 546, 113–122, 10.1016/j.jhydrol.2017.01.011, 2017.
- Jiang and Liang (2013) Jiang, B. and Liang, S.: Improved vegetation greenness increases summer atmospheric water vapor over Northern China, Journal of Geophysical Research: Atmospheres, 118, 8129–8139, 10.1002/jgrd.50602, 2013.
- Jiménez-Rodríguez et al. (2021) Jiménez-Rodríguez, C. D., Coenders-Gerrits, M., Schilperoort, B., González-Angarita, A. P., and Savenije, H.: Vapor plumes in a tropical wet forest: Spotting the invisible evaporation, Hydrology and Earth System Sciences, 25, 619–635, 10.5194/hess-25-619-2021, 2021.
- Jordahl et al. (2022) Jordahl, K., den Bossche, J. V., Fleischmann, M., McBride, J., Wasserman, J., Richards, M., Badaracco, A. G., Snow, A. D., Gerard, J., Tratner, J., Perry, M., Ward, B., Farmer, C., Hjelle, G. A., Taves, M., ter Hoeven, E., Cochran, M., rraymondgh, Gillies, S., Caria, G., Culbertson, L., Bartos, M., Eubank, N., Bell, R., sangarshanan, Flavin, J., Rey, S., maxalbert, Bilogur, A., and Ren, C.: geopandas/geopandas: v0.12.2, 10.5281/zenodo.7422493, 2022.
- Keys et al. (2012) Keys, P. W., van der Ent, R. J., Gordon, L. J., Hoff, H., Nikoli, R., and Savenije, H. H. G.: Analyzing precipitationsheds to understand the vulnerability of rainfall dependent regions, Biogeosciences, 9, 733–746, 10.5194/bg-9-733-2012, 2012.
- Kooperman et al. (2018) Kooperman, G. J., Chen, Y., Hoffman, F. M., Koven, C. D., Lindsay, K., Pritchard, M. S., Swann, A. L. S., and Randerson, J. T.: Forest response to rising CO2 drives zonally asymmetric rainfall change over tropical land, Nature Climate Change, 8, 434–440, 10.1038/s41558-018-0144-7, 2018.
- Kravčík et al. (2007) Kravčík, M., Pokorný, J., Kohutiar, J., Kováč, M., and Tóth, E.: Water for the Recovery of the Climate: A New Water Paradigm, Krupa Print, Žilina, URL http://www.waterparadigm.org, 2007.
- Kreienkamp et al. (2021) Kreienkamp, F., Philip, S. Y., Tradowsky, J. S., Kew, S. F., Lorenz, P., Arrighi, J., Belleflamme, A., Bettmann, T., Caluwaerts, S., Chan, S. C., Ciavarella, A., De Cruz, L., de Vries, H., Demuth, N., Ferrone, A., Fischer, E. M., Fowler, H. J., Goergen, K., Heinrich, D., Henrichs, Y., Lenderink, G., Kaspar, F., Nilson, E., Otto, F. E. L., Ragone, F., Seneviratne, S. I., Singh, R. K., Skålevåg, A., Termonia, P., Thalheimer, L., van Aalst, M., Van den Bergh, J., Van de Vyver, H., Vannitsem, S., van Oldenborgh, G. J., Van Schaeybroeck, B., Vautard, R., Vonk, D., and Wanders, N.: Rapid attribution of heavy rainfall events leading to the severe flooding in Western Europe during July 2021, Report, URL http://hdl.handle.net/1854/LU-8732135, 2021.
- Kuo et al. (2017) Kuo, Y.-H., Neelin, J. D., and Mechoso, C. R.: Tropical convective transition statistics and causality in the water vapor-precipitation relation, Journal of the Atmospheric Sciences, 74, 915–931, 10.1175/JAS-D-16-0182.1, 2017.
- Läderach and Sodemann (2016) Läderach, A. and Sodemann, H.: A revised picture of the atmospheric moisture residence time, Geophysical Research Letters, 43, 924–933, 10.1002/2015GL067449, 2016.
- Lawrence and Vandecar (2015) Lawrence, D. and Vandecar, K.: Effects of tropical deforestation on climate and agriculture, Nature Climate Change, 5, 27–36, 10.1038/nclimate2430, 2015.
- Leggett and Ball (2020) Leggett, L. M. W. and Ball, D. A.: Observational evidence that a feedback control system with proportional-integral-derivative characteristics is operating on atmospheric surface temperature at global scale, Tellus A: Dynamic Meteorology and Oceanography, 72, 1–14, 10.1080/16000870.2020.1717268, 2020.
- Lehner and Grill (2013) Lehner, B. and Grill, G.: Global river hydrography and network routing: baseline data and new approaches to study the world’s large river systems, Hydrological Processes, 27, 2171–2186, 10.1002/hyp.9740, 2013.
- Leite-Filho et al. (2021) Leite-Filho, A. T., Soares-Filho, B. S., Davis, J. L., Abrahão, G. M., and Börner, J.: Deforestation reduces rainfall and agricultural revenues in the Brazilian Amazon, Nature Communications, 12, 2591, 10.1038/s41467-021-22840-7, 2021.
- Li et al. (2021) Li, B.-B., Li, P.-P., Zhang, W.-T., Ji, J.-Y., Liu, G.-B., and Xu, M.-X.: Deep soil moisture limits the sustainable vegetation restoration in arid and semi-arid Loess Plateau, Geoderma, 399, 115 122, 10.1016/j.geoderma.2021.115122, 2021.
- Li et al. (2018) Li, Y., Piao, S., Li, L. Z. X., Chen, A., Wang, X., Ciais, P., Huang, L., Lian, X., Peng, S., Zeng, Z., Wang, K., and Zhou, L.: Divergent hydrological response to large-scale afforestation and vegetation greening in China, Science Advances, 4, eaar4182, 10.1126/sciadv.aar4182, 2018.
- Lindenmayer et al. (2022) Lindenmayer, D. B., Bowd, E. J., Taylor, C., and Likens, G. E.: The interactions among fire, logging, and climate change have sprung a landscape trap in Victoria’s montane ash forests, Plant Ecology, 223, 733–749, 10.1007/s11258-021-01217-2, 2022.
- L’vovitch (1979) L’vovitch, M. I.: World water resources and their future, American Geophysical Union, 1979.
- Makarieva and Gorshkov (2007) Makarieva, A. M. and Gorshkov, V. G.: Biotic pump of atmospheric moisture as driver of the hydrological cycle on land, Hydrology and Earth System Sciences, 11, 1013–1033, 10.5194/hess-11-1013-2007, 2007.
- Makarieva et al. (2013a) Makarieva, A. M., Gorshkov, V. G., and Li, B.-L.: Revisiting forest impact on atmospheric water vapor transport and precipitation, Theoretical and Applied Climatology, 111, 79–96, 10.1007/s00704-012-0643-9, 2013a.
- Makarieva et al. (2013b) Makarieva, A. M., Gorshkov, V. G., Nefiodov, A. V., Sheil, D., Nobre, A. D., Bunyard, P., and Li, B.-L.: The key physical parameters governing frictional dissipation in a precipitating atmosphere, Journal of the Atmospheric Sciences, 70, 2916–2929, 10.1175/JAS-D-12-0231.1, 2013b.
- Makarieva et al. (2014) Makarieva, A. M., Gorshkov, V. G., Sheil, D., Nobre, A. D., Bunyard, P., and Li, B.-L.: Why does air passage over forest yield more rain? Examining the coupling between rainfall, pressure, and atmospheric moisture content, Journal of Hydrometeorology, 15, 411–426, 10.1175/JHM-D-12-0190.1, 2014.
- Makarieva et al. (2017) Makarieva, A. M., Gorshkov, V. G., Nefiodov, A. V., Chikunov, A. V., Sheil, D., Nobre, A. D., and Li, B.-L.: Fuel for cyclones: The water vapor budget of a hurricane as dependent on its movement, Atmospheric Research, 193, 216–230, 10.1016/j.atmosres.2017.04.006, 2017.
- Makarieva et al. (2020) Makarieva, A. M., Nefiodov, A. V., Morozov, V. E., Aleynikov, A. A., and Vasilov, R. G.: Science in the vanguard of rethinking the role of forests in the third millennium: Comments on the draft concept of the federal law “Forest code of the Russian Federation”, Forest Science Issues, 3, 10.31509/2658-607x-2020-3-3-1-25, 2020.
- Makarieva et al. (2022) Makarieva, A. M., Nefiodov, A. V., Nobre, A. D., Sheil, D., Nobre, P., Pokorný, J., Hesslerová, P., and Li, B.-L.: Vegetation impact on atmospheric moisture transport under increasing land-ocean temperature contrasts, Heliyon, 8, E11 173, 10.1016/j.heliyon.2022.e11173, 2022.
- Manning et al. (2017) Manning, E., Licata, S., Blaisdell, J., Iredell, L., and Susskind, J.: AIRS/AMSU/HSB Version 6 data release user guide, Tech. rep., Jet Propulsion Laboratory, California Institute of Technology, Pasadena, CA, 2017.
- Mapes et al. (2018) Mapes, B. E., Chung, E. S., Hannah, W. M., Masunaga, H., Wimmers, A. J., and Velden, C. S.: The meandering margin of the meteorological moist Tropics, Geophysical Research Letters, 45, 1177–1184, https://doi.org/10.1002/2017GL076440, 2018.
- Marengo (2006) Marengo, J. A.: On the hydrological cycle of the Amazon basin: A historical review and current state-of-the-art, Revista Brasileira de Meteorologia, 21, 1–19, 2006.
- Masunaga and Mapes (2020) Masunaga, H. and Mapes, B. E.: A mechanism for the maintenance of sharp tropical margins, Journal of the Atmospheric Sciences, 77, 1181–1197, 10.1175/JAS-D-19-0154.1, 2020.
- Millán (2012) Millán, M. M.: An example: reforestation, in: Reframing the Problem of Climate Change: From Zero Sum Game to Win-Win Solutions, edited by Jaeger, C. C., Hasselmann, K., Leipold, G., Mangalagiu, D., and Tàbara, J. D., pp. 218–236, Earthscan, New York, 2012.
- Millán (2014) Millán, M. M.: Extreme hydrometeorological events and climate change predictions in Europe, Journal of Hydrology, 518, 206–224, 10.1016/j.jhydrol.2013.12.041, 2014.
- Murakami (2006) Murakami, S.: A proposal for a new forest canopy interception mechanism: Splash droplet evaporation, Journal of Hydrology, 319, 72–82, 10.1016/j.jhydrol.2005.07.002, 2006.
- Murakami (2021) Murakami, S.: Water and energy balance of canopy interception as evidence of splash droplet evaporation hypothesis, Hydrological Sciences Journal, 66, 1248–1264, 10.1080/02626667.2021.1924378, 2021.
- O’Connor et al. (2021) O’Connor, J. C., Dekker, S. C., Staal, A., Tuinenburg, O. A., Rebel, K. T., and Santos, M. J.: Forests buffer against variations in precipitation, Global Change Biology, 27, 4686–4696, 10.1111/gcb.15763, 2021.
- Papadimitriou et al. (2017) Papadimitriou, L. V., Koutroulis, A. G., Grillakis, M. G., and Tsanis, I. K.: The effect of GCM biases on global runoff simulations of a land surface model, Hydrology and Earth System Sciences, 21, 4379–4401, 10.5194/hess-21-4379-2017, 2017.
- Peters and Neelin (2006) Peters, O. and Neelin, J. D.: Critical phenomena in atmospheric precipitation, Nature Physics, 2, 393–396, 10.1038/nphys314, 2006.
- Posada-Marín and Salazar (2022) Posada-Marín, J. A. and Salazar, J. F.: River flow response to deforestation: Contrasting results from different models, Water Security, 15, 100 115, 10.1016/j.wasec.2022.100115, 2022.
- Pradhan et al. (2019) Pradhan, R., Singh, N., and Singh, R. P.: Onset of summer monsoon in Northeast India is preceded by enhanced transpiration, Scientific Reports, 9, 10.1038/s41598-019-55186-8, 2019.
- Pu and Dickinson (2014) Pu, B. and Dickinson, R. E.: Hydrological changes in the climate system from leaf responses to increasing CO2, Climate Dynamics, 42, 1905–1923, 10.1007/s00382-013-1781-1, 2014.
- Ricciardi et al. (2022) Ricciardi, L., D’Odorico, P., Galli, N., Chiarelli, D. D., and Rulli, M. C.: Hydrological implications of large-scale afforestation in tropical biomes for climate change mitigation, Philosophical Transactions of the Royal Society B: Biological Sciences, 377, 20210 391, 10.1098/rstb.2021.0391, 2022.
- Ripley (1976) Ripley, E. A.: Comment on the paper ‘Dynamics of deserts and drought in the Sahel’ by J. G. Charney, Quarterly Journal of the Royal Meteorological Society, 102, 466–467, 10.1002/qj.49710243220, 1976.
- Salati et al. (1979) Salati, E., Dall’Olio, A., Matsui, E., and Gat, J. R.: Recycling of water in the Amazon Basin: An isotopic study, Water Resources Research, 15, 1250–1258, 10.1029/WR015i005p01250, 1979.
- Saleska et al. (2016) Saleska, S. R., Wu, J., Guan, K., Araujo, A. C., Huete, A., Nobre, A. D., and Restrepo-Coupe, N.: Dry-season greening of Amazon forests, Nature, 531, E4–E5, 10.1038/nature16457, 2016.
- Savenije (1995) Savenije, H. H.: New definitions for moisture recycling and the relationship with land-use change in the Sahel, Journal of Hydrology, 167, 57–78, 10.1016/0022-1694(94)02632-L, 1995.
- Sheil (2018) Sheil, D.: Forests, atmospheric water and an uncertain future: The new biology of the global water cycle, Forest Ecosystems, 5, 19, 10.1186/s40663-018-0138-y, 2018.
- Sheil et al. (2019) Sheil, D., Bargués-Tobella, A., Ilstedt, U., Ibisch, P. L., Makarieva, A., McAlpine, C., Morris, C. E., Murdiyarso, D., Nobre, A. D., Poveda, G., Spracklen, D. V., Sullivan, C. A., Tuinenburg, O. A., and van der Ent, R. J.: Forest restoration: Transformative trees, Science, 366, 316–317, 10.1126/science.aay7309, 2019.
- Silva de Oliveira et al. (2021) Silva de Oliveira, A., Sande Silva, J., Gaspar, J., Nunes Guiomar, N. R. G., and Fernandes, P. M.: Is native forest an alternative to prevent wildfires in the WUI in Central Portugal?, vol. 2, pp. 67–77, RISCOS – Associação Portuguesa de Riscos, Prevenção e Segurança, Simões & Linhares, Lda., 10.34037/978-989-9053-06-9_1.2_05, 2021.
- Smirnova et al. (2017) Smirnova, O. V., Bobrovsky, M. V., Khanina, L. G., Zaugolnova, L. B., Korotkov, V. N., Aleynikov, A. A., Evstigneev, O. I., Smirnov, V. E., Smirnov, N. S., and Zaprudina, M. V.: Boreal Forests, in: European Russian Forests., pp. 59–203, Springer, Dordrecht, 10.1007/978-94-024-1172-0_3, 2017.
- Snow et al. (2022a) Snow, A. D., Brochart, D., Raspaud, M., Taves, M., Bell, R., RichardScottOZ, Chegini, T., Amici, A., Braun, R., Henderson, S., Annex, A., Brandt, C. H., Hoese, D., Bunt, F., GBallesteros, Scheick, J., Hamman, J., jonasViehweger, Zehner, M., Cordeiro, M., Miller, S., Badger, T. G., Augspurger, T., apiwat-chantawibul, and pmallas: corteva/rioxarray: 0.13.2 Release, 10.5281/zenodo.7429004, 2022a.
- Snow et al. (2022b) Snow, A. D., Taves, M., BENR0, Cook, J., LiamRMoore, Abdalla, M., Pierrick, R., and Bell, R.: corteva/geocube: 0.3.3 Release, 10.5281/zenodo.7144336, 2022b.
- Staal et al. (2018) Staal, A., Tuinenburg, O. A., Bosmans, J. H. C., Holmgren, M., van Nes, E. H., Scheffer, M., Zemp, D. C., and Dekker, S. C.: Forest-rainfall cascades buffer against drought across the Amazon, Nature Climate Change, 8, 539–543, 10.1038/s41558-018-0177-y, 2018.
- Tan et al. (2021) Tan, M. L., Liang, J., Samat, N., Chan, N. W., Haywood, J. M., and Hodges, K.: Hydrological extremes and responses to climate change in the Kelantan River Basin, Malaysia, based on the CMIP6 HighResMIP experiments, Water, 13, 1472, 10.3390/w13111472, 2021.
- te Wierik et al. (2021) te Wierik, S. A., Cammeraat, E. L. H., Gupta, J., and Artzy-Randrup, Y. A.: Reviewing the impact of land use and land-use change on moisture recycling and precipitation patterns, Water Resources Research, 57, e2020WR029 234, 10.1029/2020WR029234, 2021.
- Teuling (2018) Teuling, A. J.: A forest evapotranspiration paradox investigated using lysimeter data, Vadose Zone Journal, 17, 170 031, 10.2136/vzj2017.01.0031, 2018.
- Tian et al. (2017) Tian, B., Manning, E., Fetzer, E. J., Olsen, E. T., Wong, S., Susskind, J., and Iredell, L.: AIRS/AMSU/HSB Version 6 Level 3 product user guide, Tech. rep., Jet Propulsion Laboratory, California Institute of Technology, Pasadena, CA, 2017.
- Tian et al. (2019) Tian, B., Fetzer, E. J., and Manning, E. M.: The Atmospheric Infrared Sounder Obs4MIPs Version 2 data set, Earth and Space Science, 6, 324–333, 10.1029/2018EA000508, 2019.
- Tian et al. (2022) Tian, L., Zhang, B., Chen, S., Wang, X., Ma, X., and Pan, B.: Large-scale afforestation enhances precipitation by intensifying the atmospheric water cycle over the Chinese Loess Plateau, Journal of Geophysical Research: Atmospheres, 127, e2022JD036 738, 10.1029/2022JD036738, 2022.
- van der Ent et al. (2010) van der Ent, R. J., Savenije, H. H. G., Schaefli, B., and Steele-Dunne, S. C.: Origin and fate of atmospheric moisture over continents, Water Resources Research, 46, W09 525, 10.1029/2010WR009127, 2010.
- Wang et al. (2018a) Wang, X., Wang, B., Xu, X., Liu, T., Duan, Y., and Zhao, Y.: Spatial and temporal variations in surface soil moisture and vegetation cover in the Loess Plateau from 2000 to 2015, Ecological Indicators, 95, 320–330, 10.1016/j.ecolind.2018.07.058, 2018a.
- Wang et al. (2018b) Wang, Y., Liu, Y., and Jin, J.: Contrast effects of vegetation cover change on evapotranspiration during a revegetation period in the Poyang Lake Basin, China, Forests, 9, 10.3390/f9040217, 2018b.
- Wang-Erlandsson et al. (2018) Wang-Erlandsson, L., Fetzer, I., Keys, P. W., van der Ent, R. J., Savenije, H. H. G., and Gordon, L. J.: Remote land use impacts on river flows through atmospheric teleconnections, Hydrology and Earth System Sciences, 22, 4311–4328, 10.5194/hess-22-4311-2018, 2018.
- Wei et al. (2022) Wei, X., Huang, Q., Huang, S., Leng, G., Qu, Y., Deng, M., Han, Z., Zhao, J., Liu, D., and Bai, Q.: Assessing the feedback relationship between vegetation and soil moisture over the Loess Plateau, China, Ecological Indicators, 134, 108 493, 10.1016/j.ecolind.2021.108493, 2022.
- Worden et al. (2021) Worden, S., Fu, R., Chakraborty, S., Liu, J., and Worden, J.: Where does moisture come from over the Congo Basin?, Journal of Geophysical Research: Biogeosciences, 126, e2020JG006 024, 10.1029/2020JG006024, 2021.
- Wright et al. (2017) Wright, J. S., Fu, R., Worden, J. R., Chakraborty, S., Clinton, N. E., Risi, C., Sun, Y., and Yin, L.: Rainforest-initiated wet season onset over the Southern Amazon, Proceedings of the National Academy of Sciences of the United States of America, 114, 8481–8486, 10.1073/pnas.1621516114, 2017.
- Wu et al. (2016) Wu, J., Albert, L. P., Lopes, A. P., Restrepo-Coupe, N., Hayek, M., Wiedemann, K. T., Guan, K., Stark, S. C., Christoffersen, B., Prohaska, N., Tavares, J. V., Marostica, S., Kobayashi, H., Ferreira, M. L., Campos, K. S., da Silva, R., Brando, P. M., Dye, D. G., Huxman, T. E., Huete, A. R., Nelson, B. W., and Saleska, S. R.: Leaf development and demography explain photosynthetic seasonality in Amazon evergreen forests, Science, 351, 972–976, 10.1126/science.aad5068, 2016.
- Yang et al. (2022) Yang, Y., Fan, Y., Basang, C. M., Lu, J., Zheng, C., and Wen, Z.: Different biomass production and soil water patterns between natural and artificial vegetation along an environmental gradient on the Loess Plateau, Science of the Total Environment, 814, 152 839, 10.1016/j.scitotenv.2021.152839, 2022.
- Yano and Manzato (2022) Yano, J.-I. and Manzato, A.: Does more moisture in the atmosphere lead to more intense rains?, Journal of the Atmospheric Sciences, 79, 663–681, 10.1175/JAS-D-21-0117.1, 2022.
- Ye et al. (2014) Ye, H., Fetzer, E. J., Wong, S., Behrangi, A., Olsen, E. T., Cohen, J., Lambrigtsen, B. H., and Chen, L.: Impact of increased water vapor on precipitation efficiency over northern Eurasia, Geophysical Research Letters, 41, 2941–2947, 10.1002/2014GL059830, 2014.
- Zemp et al. (2017a) Zemp, D. C., Schleussner, C.-F., Barbosa, H. M. J., Hirota, M., Montade, V., Sampaio, G., Staal, A., Wang-Erlandsson, L., and Rammig, A.: Self-amplified Amazon forest loss due to vegetation-atmosphere feedbacks, Nature Communications, 8, 10.1038/ncomms14681, 2017a.
- Zemp et al. (2017b) Zemp, D. C., Schleussner, C.-F., Barbosa, H. M. J., and Rammig, A.: Deforestation effects on Amazon forest resilience, Geophysical Research Letters, 44, 6182–6190, 10.1002/2017GL072955, 2017b.
- Zhang et al. (2022) Zhang, B., Tian, L., Yang, Y., and He, X.: Revegetation does not decrease water yield in the Loess Plateau of China, Geophysical Research Letters, 49, 10.1029/2022GL098025, 2022.
- Zhang et al. (2001) Zhang, L., Dawes, W. R., and Walker, G. R.: Response of mean annual evapotranspiration to vegetation changes at catchment scale, Water Resources Research, 37, 701–708, 10.1029/2000WR900325, 2001.
- Zhang et al. (2016) Zhang, Y., Peña Arancibia, J. L., McVicar, T. R., Chiew, F. H. S., Vaze, J., Liu, C., Lu, X., Zheng, H., Wang, Y., Liu, Y. Y., Miralles, D. G., and Pan, M.: Multi-decadal trends in global terrestrial evapotranspiration and its components, Scientific Reports, 6, 10.1038/srep19124, 2016.
- Zheng et al. (2021) Zheng, H., Miao, C., Zhang, G., Li, X., Wang, S., Wu, J., and Gou, J.: Is the runoff coefficient increasing or decreasing after ecological restoration on China’s Loess Plateau?, International Soil and Water Conservation Research, 9, 333–343, 10.1016/j.iswcr.2021.04.009, 2021.
- Zhou et al. (2021) Zhou, S., Williams, A. P., Lintner, B. R., Berg, A. M., Zhang, Y., Keenan, T. F., Cook, B. I., Hagemann, S., Seneviratne, S. I., and Gentine, P.: Soil moisture-atmosphere feedbacks mitigate declining water availability in drylands, Nature Climate Change, 11, 38–44, 10.1038/s41558-020-00945-z, 2021.