First discoveries and localisations of Fast Radio Bursts with MeerTRAP: a real-time, commensal MeerKAT survey
Abstract
We report on the discovery and localization of fast radio bursts (FRBs) from the MeerTRAP project, a commensal fast radio transient-detection programme at MeerKAT in South Africa. Our hybrid approach combines a coherent search with an average field-of-view of 0.4 with an incoherent search utilizing a field-of-view of 1.27 (both at 1284 MHz). Here, we present results on the first three FRBs: FRB 20200413A (DM=1990.05 pc cm-3), FRB 20200915A (DM=740.65 pc cm-3), and FRB 20201123A (DM=433.55 pc cm-3). FRB 20200413A was discovered only in the incoherent beam. FRB 20200915A (also discovered only in the incoherent beam) shows speckled emission in the dynamic spectrum which cannot be explained by interstellar scintillation in our Galaxy or plasma lensing, and might be intrinsic to the source. FRB 20201123A shows a faint post-cursor burst about 200 ms after the main burst and warrants further follow-up to confirm whether it is a repeating FRB. FRB 20201123A also exhibits significant temporal broadening consistent with scattering by a turbulent medium. The broadening exceeds that predicted for medium along the sightline through our Galaxy. We associate this scattering with the turbulent medium in the environment of the FRB in the host galaxy. Within the approximately localization region of FRB 20201123A , we identify one luminous galaxy (; J173438.35504550.4) that dominates the posterior probability for a host association. The galaxy’s measured properties are consistent with other FRB hosts with secure associations.
keywords:
stars:neutron – radio continuum:transients1 Introduction
FRBs are bright radio flashes of hitherto unknown origin. They last for less than a few milliseconds and their dispersion measures (DMs), the integrated electron densities along the lines of sight, far exceed the contributions from our own Galaxy, indicating their cosmological nature (Lorimer et al., 2007; Thornton et al., 2013). FRBs are therefore potentially new probes to study the cosmic history of the Universe and are currently in use to probe important cosmological milestones (e.g. Macquart et al., 2020). Since their discovery in 2007 (Lorimer et al., 2007), more than 600 FRBs have been reported (The CHIME/FRB Collaboration et al., 2021). Initially, most FRBs were observed as one-off events i.e., a single burst detected from a given part of the sky. The lack of multiple pulses from the same FRB suggested cataclysmic models to explain their origins (see Platts et al., 2019, for a full review of theories). This changed when a FRB was found to repeat (Spitler et al., 2016). This was followed by its localisation to a host galaxy confirming their extragalactic nature. Moreover, evidence of a periodicity in the activity cycle of two repeating FRBs (Rajwade et al., 2020; Chime/Frb Collaboration et al., 2020) combined with a detection of a FRB-like radio pulse from a highly magnetized neutron star located in our Galaxy (CHIME/FRB Collaboration et al., 2020; Bochenek et al., 2020) were major breakthroughs towards constraining the progenitors of these enigmatic bursts. In the last few years, the field has progressed rapidly, owing to a slew of new repeaters discovered by the Canadian Hydrogen Intensity Mapping Experiment (CHIME), and the localisations and host galaxy identifications of many one-off FRBs discovered by the Australian SKA Pathfinder (ASKAP) telescope (Shannon et al., 2018). While the rate of FRB discoveries has increased tremendously, every new FRB shows interesting emission characteristics and morphology that pose more questions. For example, there is an obvious dichotomy between the spectral features and pulse widths of repeating and one-off FRBs (Pleunis et al., 2021) but their rates are still consistent with all FRBs originating from a single underlying population (Caleb et al., 2019). This highlights the importance of discovering and following up these sources at radio, optical, and other frequencies.
Radio transient surveys have expedited progress in the field of transient astrophysics in the recent years. The use of state of the art Central Processing Units (CPUs) and Graphical Processing Units (GPUs) can enable processing of high volumes of telescope data in real-time. Furthermore, with the advent of new technology, astronomers have been able to increase the field-of-view (FoV) and sensitivity of radio telescopes. All of this has led to commensal transients searches where by the radio data taken for a different science goal are being used to look for FRBs and other radio transients. This is an important approach, especially when telescope resources are oversubscribed and a limited amount of time is available to do achieve all the scientific goals. Additionally, the need to not only discover new FRBs but the need to localise them and identify their host galaxies is paramount to elucidate some of these mysteries surrounding the FRB phenomenon. The MeerKAT radio telescope (Jonas & MeerKAT Team, 2016) in South Africa is the ideal telescope to perform this task by the virtue of its high sensitivity to transients and excellent angular resolution to localise. MeerTRAP (More TRansients And Pulsars) is an ERC funded project (PI: Stappers) and has been deployed on the telescope to commensally discover and localise FRBs and other transients in real-time.
MeerTRAP piggybacks on other Large Survey Projects (LSPs) that are using MeerKAT for science observations. During these commensal observations, MeerTRAP performs time domain searches for transients in real-time with the primary goal of discovering and localising FRBs in order identify their host galaxies. The instrument was commissioned in early 2019 and has been fully operational on all LSPs at MeerKAT since September of 2020. Since then, MeerTRAP has been discovering new radio transients within and beyond the Galaxy (Bezuidenhout et al., 2022). In this paper, we present the first three FRB discoveries by the MeerTRAP instrument. The paper is organized as follows: In Section 2, we give a brief overview of the MeerTRAP project. Then we present the new FRBs discovered and discuss some interesting emission properties for a few of them. In the next section, we discuss the localisation constraints on the FRBs, specifically focusing on one of them and discuss its potential host galaxy identification. Finally, we present our discussion and summarize our results in Sections 7 and 8 respectively.
2 The MeerTRAP System
The MeerTRAP compute cluster also known as the Transient User Supplied Equipment (TUSE) consists of 67 servers with one head node and 66 compute nodes located in the Karoo Array Processing Building at the MeerKAT site. Each compute node contains two Intel Xeon 8C/16T CPUs, each possessing 16 logical cores for computation, two Nvidia GeForce 1080 Ti GPUs and 256 GB of DDR4 Random Access Memory (RAM) blocks. Each node is connected to a breakout switch via 10 GbE network interface cards (NIC) that are used to ingest data.
The signals from all the antennas are detected and summed to form an incoherent beam (IB) that samples the entire field of view (FoV) of the telescope ( 1.27 at 1284 MHz). Simultaneously, signals from a subset of antennas are added by using the phase information to create a large set of narrow, highly sensitive coherent beams (CBs) that sample a fraction of the primary FoV. Typically, the coherent beams are more sensitive than the incoherent beam by a factor of 5 but cover only a fraction of the primary FoV of the telescope (0.4 deg2 at 1284 MHz). However, this fraction depends strongly on the observing frequency and elevation as the telescope array projected on the sky modifies the shape of the CBs significantly (see Chen et al., 2021, for a detailed treatment). The coherent beams’ positions are determined by an algorithm that efficiently arranges them within a circular tiling region such that they intersect at a user-specified relative sensitivity. By default MeerTRAP specifies that the CBs intersect at 25 per cent of their maximum sensitivity. The full details of the method used for modelling the CB point-spread function are provided in Chen et al. (2021) and further details about the full algorithm along with the verification and validation tests are being compiled as a separate paper (Bezuidenhout et al, submitted.). The incoherent and coherent beams are created in the Filterbank BeamFormer User Supplied Equipment (FBFUSE) cluster that has been built by the Max Planck Institute for Radio Astronomy in Bonn (see Barr, 2018, for more details). Commissioning tests in early 2019 have shown that the beamforming efficiency at 1284 MHz is typically between 0.92–0.96 which gave us confidence that we were able to exploit almost the entire sensitivity of the array. The results of this commissioning are presented in Chen et al. (2021). Data from FBFUSE are received over the network on the NICs as SPEAD2111https://casper.ssl.berkeley.edu/wiki/SPEAD packets that are read by the data ingest code and written to POSIX shared memory ring buffers of 50 seconds duration. The data are arranged such that each compute node ingests a number of coherent beams to be processed in real-time. Since the data from the beamformer arrive in a frequency-time format (i.e. frequency being the slowest moving axis), they are transposed to a time-frequency format on a per beam basis, as required by the transient search code. The data are also scrunched in time and frequency, resulting in an effective time resolution of 306 s over a band of 856 MHz that is split into 1024 channels (channel width of 208.4 kHz), 4096 channels (channel width of 104.2 kHz) depending on the number of frequency channels that are scrunched in the beamformer. The resulting filterbank data are saved in separate shared memory buffers corresponding to each beam. Details of the MeerTRAP instrumentation have been presented in Sanidas et al. (2018); Caleb et al. (2020), Jankowski et al. (2020), Malenta et al. (2020), Rajwade et al. (2020), and a complete system overview will be given in Stappers et al. (in prep.).
| DM range | DM | Downsampling factor |
|---|---|---|
| (pc cm-3) | (pc cm-3) | |
| 0.00 – 383.75 | 0.307 | 1 |
| 383.75 – 774.95 | 0.652 | 2 |
| 774.95 – 1534.55 | 1.266 | 4 |
| 1534.55 – 3041.75 | 2.512 | 8 |
| 3041.75 – 5241.75 | 4.000 | 16 |
The data at 1.284 GHz for each beam are searched for bright bursts using the state-of-the-art, GPU-based single pulse search pipeline AstroAccelerate222https://github.com/AstroAccelerateOrg/astro-accelerate (Armour et al., 2011; Adámek & Armour, 2020). The real-time search was done by incoherently de-dispersing in the DM range 0–5118.4 pc cm-3, divided into multiple sub-ranges with varying DM steps and time averaging factors (see Table 1 for details) across a bandwidth of 856 MHz with a sampling interval of 306 s. We also searched up to a maximum boxcar width of 0.67 s. This particular choice of parameters allowed us to process all data in real time, thanks to strict optimisations applied in the AstroAccelerate algorithms.
To reduce the number of detections due to Radio Frequency Interference (RFI), we applied a static frequency channel mask to the data before the de-dispersion and single-pulse search. While the RFI remained stable most of the time, the static mask did suffer from instances where the channels were corrupted by RFI varied, resulting in many spurious detections.
Additionally, the data are filtered using standard zero-DM excision (Eatough et al., 2009) to remove any remaining broadband RFI that was infrequent enough not to be included in the mask. Then, the candidates are sifted based on some static cutoffs of DMs below 20 pc cm-3, widths above 300 ms and signal-to-noise (S/N) below 8.0 to reduce the number of noise or RFI candidates. The resulting candidates are then clustered using the Friends-of-Friends algorithm (see Huchra & Geller, 1982, for more details) by combining candidates that are in close proximity in time and DM space. This resulted in a significant reduction of the total number of output candidates ( 40). The final list of candidates are then saved to disk for further inspection.The extracted candidate files contain raw filterbank data of the dispersed pulse and additional padding of 0.5 s at the start and at the end of the file. This entire pipeline with all the aforementioned steps is encapsulated in a modular C++ framework called cheetah 333https://gitlab.com/SKA-TDT/cheetah which is deployed on the compute nodes of MeerTRAP.
3 FRB discoveries
| Name | Barycentric MJD | RA | Dec | gl | gb | S/N | DM | Width | DMne2001 | DMymw16 | |
|---|---|---|---|---|---|---|---|---|---|---|---|
| (∘) | (∘) | (∘) | (∘) | (pc cm-3) | (ms) | (pc cm-3) | (pc cm-3) | (Jy ms) | |||
| FRB 20200413A | 58952.382356 | 328.57 | 28.21 | 20.72 | 50.98 | 14 | 1990.05 (88) | 4.9 (2) | 39.2 | 26.22 | 3.1 |
| FRB 20200915A | 59107.105051 | 42.41 | 4.67 | 169.35 | 47.25 | 35 | 740.65 (40) | 2.2 (1) | 39.1 | 33.72 | 3.0 |
| FRB 20201123A | 59176.421148 | 263.67 | 50.76 | 340.229 | 9.681 | 45 | 433.55 (36) | 4.6 (2) | 251.93 | 162.4 | 1.4 |
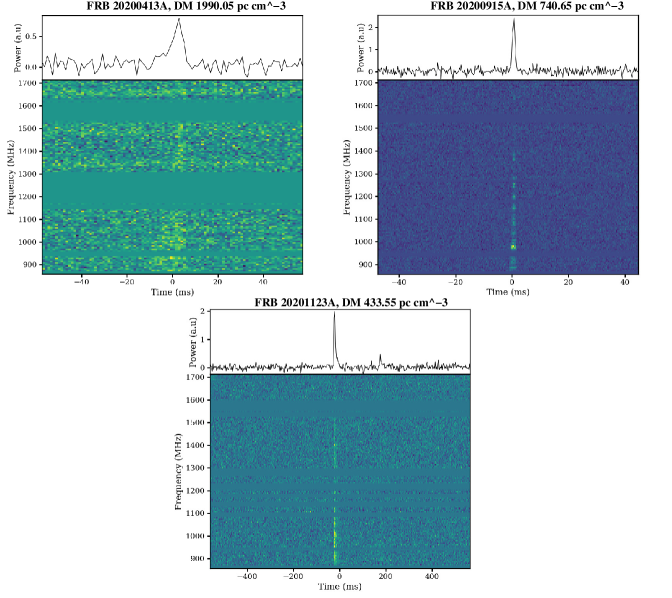
The dynamic spectra of the first three FRB discoveries are shown in Figure 1 and the measured and derived parameters for them are presented in table 2. We note here that beam size and shape of the CB and the IB strongly depend on the frequency and the elevation of the source. This is an important factor contributing to the FRBs being brighter in the lower half of the band and may not represent the true emission dependence on observing frequency. The three FRBs reported here are all discovered far off the Galactic Plane (gb: 10∘ – 50∘).
3.1 FRB 20200413A
This is the first FRB discovered by MeerTRAP. It was detected in the Incoherent Beam (IB) on UT 13th April 2020 during commensal observations of the pulsar timing experiment at MeerKAT (MeerTime; Bailes et al., 2020). The FRB was only detected in the IB with no detections in the CB suggesting that the FRB was outside the more sensitive CB tiling pattern. The source was detected in the real-time pipeline with a S/N of 9.1 and a DM of 1988 pc cm-3. The S/N and the DM were then optimized to values of 14 and 1990.05 pc cm-3 respectively using a custom made S/N-DM optimization code mtcutils444https://bitbucket.org/vmorello/mtcutils/. The FRB spans the entire bandwidth of the MeerKAT L-Band receiver (856–1712 MHz) and shows broadening of the pulse width at lower frequencies probably due to the increase in the intra-channel dispersion smearing (tDMsmear 20 ms at a frequency of 856 MHz for 1024 channels) and scattering. Unfortunately, the S/N of the burst is too low for a thorough analysis of this smearing.
3.2 FRB 20200915A
FRB 20200915A was discovered on UT 15th of September 2020, again only in the IB. This FRB is much brighter than FRB 20200413A and was detected with a S/N of 29. Subsequent optimization of the S/N and DM with mtcutils showed that the FRB has S/N ratio of 35 at the best DM of 740.65 pc cm-3. The FRB was discovered when MeerTRAP was commensally observing with the MeerKAT Absorption Line Survey (MALS; Gupta et al., 2016) observation. The lack of CB detections meant that localising the FRB based solely on the IB detection was not constraining. FRB 20200915A shows broadening at lower frequencies along with evidence of scintillation in the dynamic spectrum akin to what is seen in pulses from radio emitting neutron stars in our Galaxy (for e.g. Cordes & Rickett, 1998).
3.3 FRB 20201123A
FRB 20201123A was discovered on UT 23rd of November, 2020. It was detected in a single CB with no other detections in any other neighbouring CBs nor in the IB, making this the first discovery in the coherent beams. The burst was discovered at a S/N of 30.6 during a commensal observing run with the MeerTIME project (Bailes et al., 2020). The best optimized DM with mtcutils is 433.55 pc cm-3 with a S/N of 45. The burst shows hints of scatter broadening in the bottom half of the band. Interestingly, there is a faint post-cursor seen in the time series separated from the main burst by 200 ms. The burst separation is consistent with separations observed for bursts from other repeating FRBs like FRB 20121102A (Cruces et al., 2021) suggesting that FRB 20201123A could be a repeater.
4 Scattering and Scintillation
4.1 FRB 20200915A
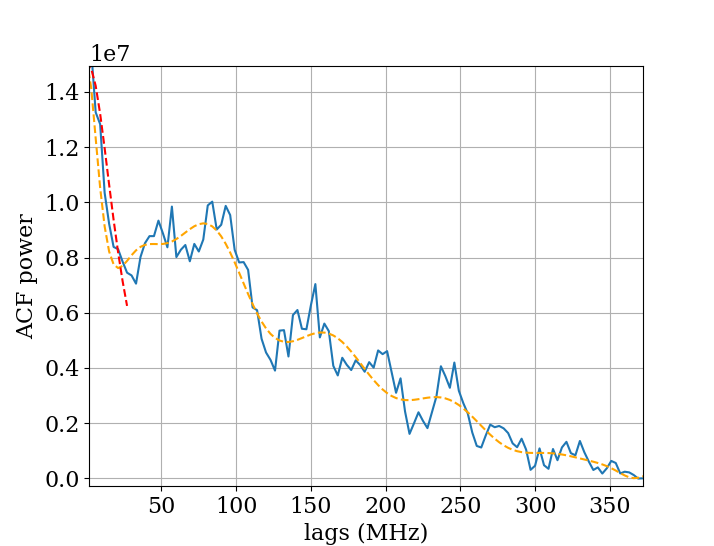
While FRB 20200915A does not show any obvious signatures for interstellar scattering, the dynamic spectrum clearly shows islands of band-limited emission in the lower half of the bandwidth (Figure 1). While this could be intrinsic to the source, such emission behaviour is typically an indication of diffractive interstellar scintillation (DISS) (Rickett, 1970). In order to quantify whether this is indeed scintillation, we computed the scintillation bandwidth. To do that, we selected the dynamic spectrum (after removal of channels corrupted by RFI) for only the time bins corresponding to the on-pulse region of the burst. Then the data were added along time axis to generate a frequency spectrum that corresponds just to the pulse integrated to a single time bin. Since the emission is dominated by the lower-half of the frequency band, we decided to perform the analysis on just the lower half (856–1284 MHz) of the band. Then, we computed the discrete auto-correlation function (ACF) of this spectrum. For a given signal ,
| (1) |
where is the lag in frequency axis, is the signal at an observing frequency of and is the total number frequency channels. The resulting ACF is shown in figure 2. The decorrelation bandwidth of interstellar scintillation in the strong scattering regime is given by the full-width at half-maximum (FWHM) of a Lorentzian function fit to the ACF (Cordes & Rickett, 1998). After removing the DC component that can be attributed to self-noise of the burst itself, we fit a Lorentzian function to the ACF to obtain the 14.75 MHz. To compute the expected scintillation bandwidth due to our own Galaxy along the line of sight to this FRB, we use the ne2001 model for Galactic electron density (Cordes & Lazio, 2002). The ne2001 model predicts the expected free electron density in the Galaxy based on estimates of DMs along various lines-of-sight from known radio pulsars. The predicted scintillation bandwidth is 3.4 MHz, a factor of 4 smaller than what is measured. We note that it is hard to gauge the significance of this deviation as no quantification of any formal model uncertainties is available currently in the literature. Hence, we can only say that assuming the model correctly predicts scintillation bandwidth, the deviation may be significant. Assuming that scintillation is caused by a thin screen with density fluctuations in the free electron density, one expects the scintles to become wider with frequency ( ) (for e.g. Lorimer & Kramer, 2004). The ACF of the dynamic spectrum of FRB 20200915A along the frequency axis tells a different story. The islands of emission become visually narrower with increasing frequency which suggests that the observed emission cannot be explained by the standard model of interstellar scintillation from our Galaxy (Majid et al., 2021). If we assume that the 14.75 MHz structure is due to scintillation from the Inter Galactic Medium (IGM) or halos of intersecting foreground galaxies (Prochaska et al., 2019), the corresponding scattering timescale, = = 10 ns which is almost four orders of magnitude smaller than our finest sampling interval. While it has been shown that the IGM may not be able to contribute meaningfully to the scintillation (see Macquart & Koay, 2013, and the references therein), we cannot rule out that the structures we see are due to weak scintillation and scattering from foreground halos along the line of sight or the combination of the two (Ravi et al., 2016).
4.2 FRB 20201123A
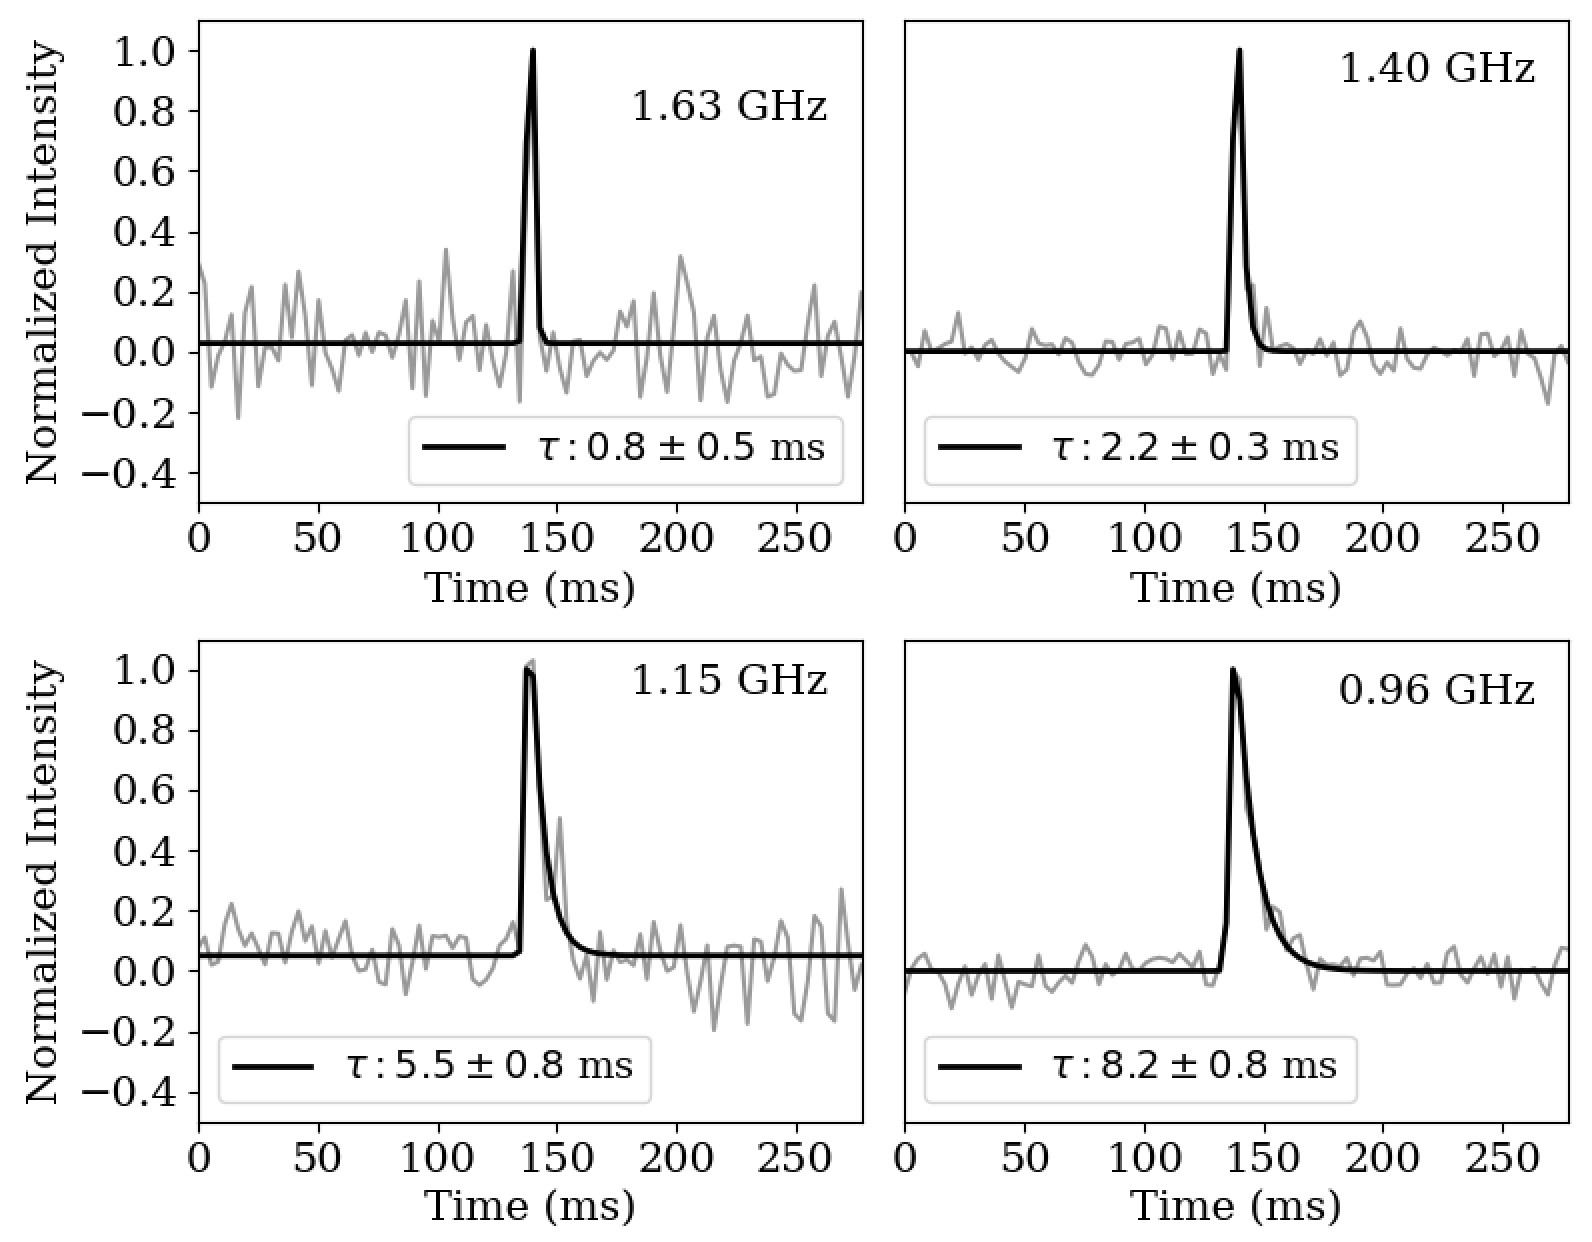
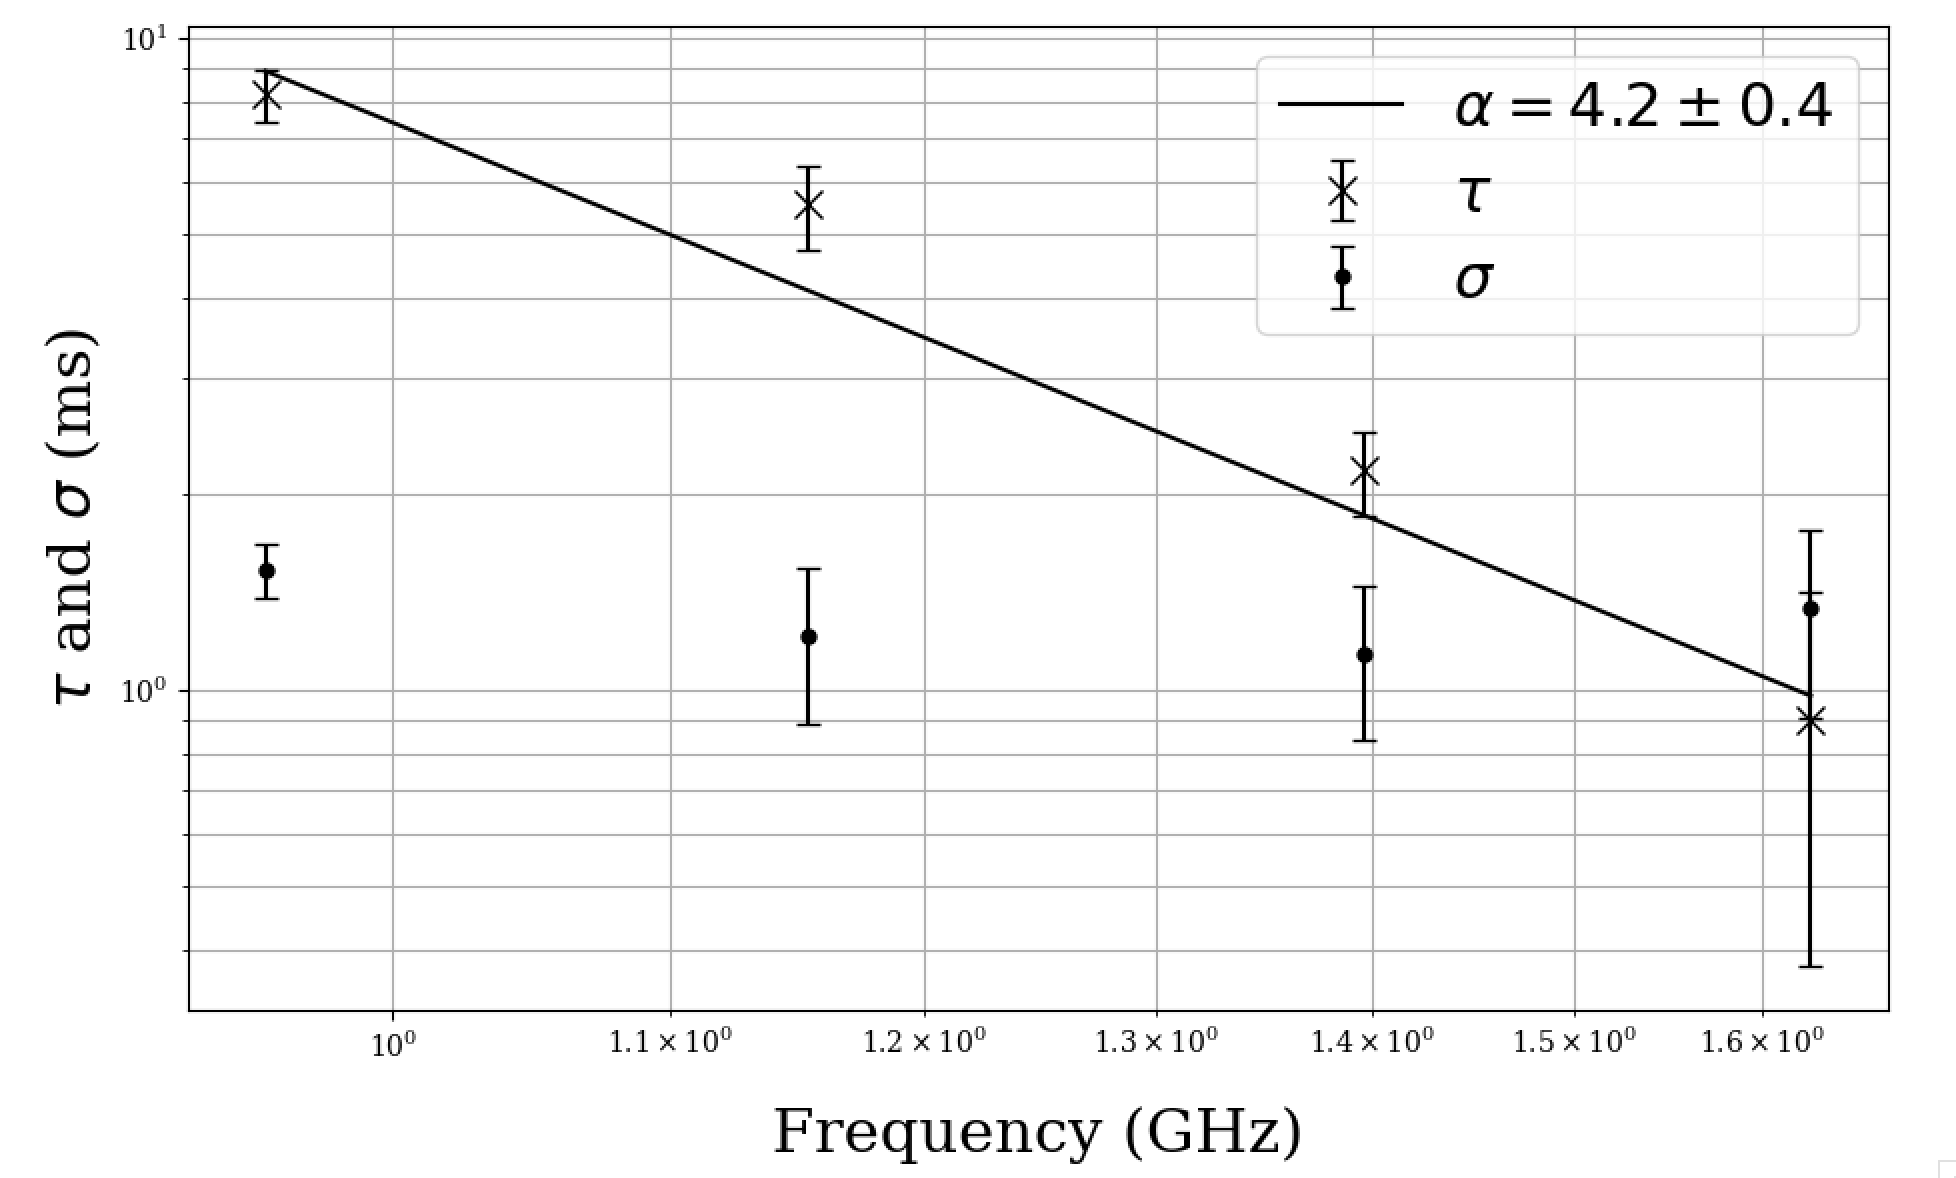
The dynamic spectrum of FRB 20201123A shows evidence for scattering. To fully characterize the scattering, we divided the data into four subbands, each 214 MHz wide with a compromise between bandwidth and the S/N of the burst in each subband. We assume the scattering is caused by a thin scattering screen between the source and the observer that leads to an exponential tail in the resulting profile (see Chawla et al., 2021, and the references therein). Then, we used the scamp-i software suite (Oswald et al., 2021) to fit the burst profile at each frequency with an exponentially modified Gaussian 555https://github.com/pulsarise/SCAMP-I. The code simultaneously fits for the scattering as well as the correction needed to the DM of the burst such that the peak of the burst under this model is aligned correctly in time after correcting for scatter broadening. The change in the DM from this fit is still consistent (within errors) with the optimized DM reported by mtcutils for this FRB (DM=433.55 pc cm-3). The fits are performed by sampling the likelihood function of the model using MCMC (see Oswald et al., 2021, for more details). Figure 3 shows the result of the fits. The scattering timescale at the lowest subband is a factor of 2 more than the maximum expected smearing due to dispersion (4.7 ms at the lowest frequency), further supporting that the extended tail is due to scattering of the burst. The scattering timescale for this FRB seems to follow a powerlaw () with = 4.20.4 which is consistent with what is expected from a scattering screen in our Galaxy based on the studies of known pulsars (Qiu et al., 2020). Despite that, the expected scattering at the best known Galactic latititude and longitude of FRB 20201123A (l=340.4, b=-9.67) cannot account for the scattering seen in this FRB (Cordes & Lazio, 2002) which gives an expected of 0.016 ms at 1 GHz compared to the measured of 7.5 ms at 1 GHz. This points to a different source of scattering (the host galaxy or the IGM, including intersecting halos or the combination of the two) where the medium is more turbulent than what is observed in our Galaxy (Chawla et al., 2021).
5 Localisation
For all these FRBs, we did not have visibility data correlations between different sets of antennas in the array) available hence localising the FRBs by imaging the data was not possible. Therefore, we rely on detections in the CBs and the IB to provide constraints on the location based on the best measured model of the CB and the IB (Chen et al., 2021). We also note that the error on the beam positions is much smaller than the beam width and so, negligibly contributes to the overall error on the position of the FRB. The complete methodology used and the corresponding validation and verification tests will be presented in an upcoming paper (Bezuidenhout et al., submitted.). The true position and the uncertainty of FRB 20200413A and FRB 20200915A are hard to gauge due the lack of detection in the CB and the FRBs are located anywhere between the FWHM of the IB (1.15∘ at 1284 MHz) and the edge of the CB tiling (as shown in detail below).
5.1 FRB 20200413A
A detection only in the IB meant that the localisation region for this FRB was unconstrained as the source could lie in any region where the IB was more sensitive than the CB (approximate CB FoV of 1.27 ). The exact localisation region is difficult to determine as beyond the primary beam, the beam response is highly asymmetric with multiple sidelobes with varying frequency dependence. However, the smooth appearance of 20200413A’s observed dynamic spectrum over a wide band (see Figure 1) suggests that the source is not located in a far sidelobe of the IB, as the positions of the sidelobes are strongly frequency dependent.
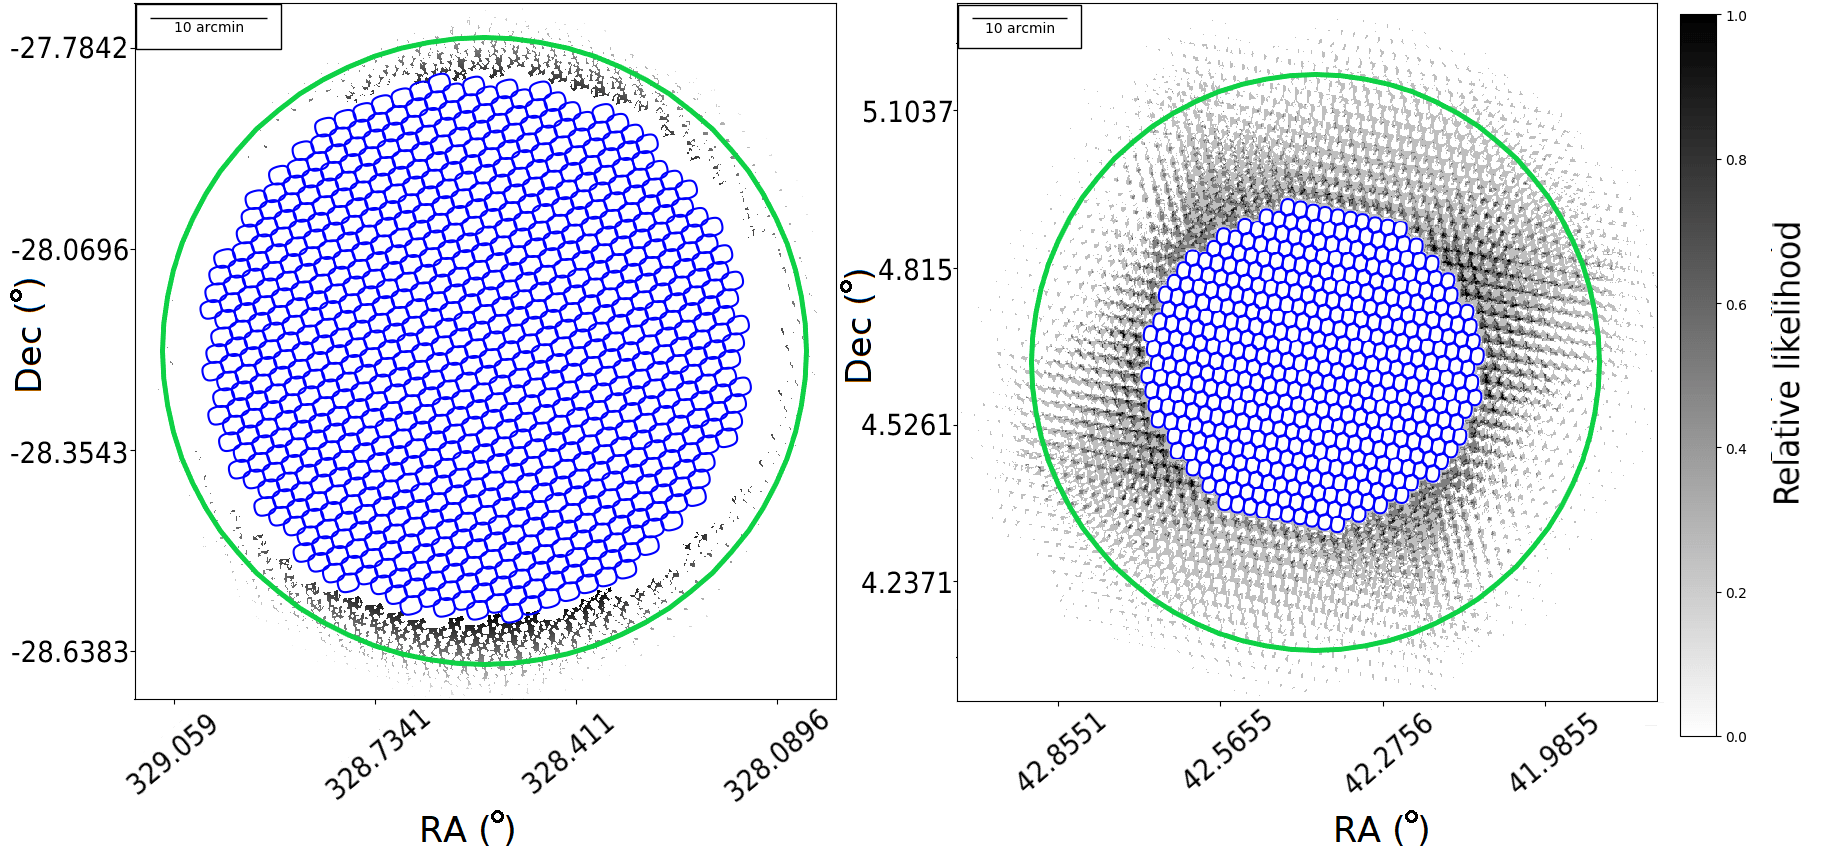
In order to more precisely constrain the region beyond the CB main lobes where the FRB might have originated, we used Mosaic (Chen et al., 2021) to generate a PSF for the CBs at various frequencies, as well as sensitivity maps of the MeerKAT primary beam obtained using astrophysical holography (e.g. Asad et al., 2021; de Villiers & Cotton, 2022). The ratio of the sensitivity of a CB, SCB to that of the IB, SIB, at a given point is given by
| (2) |
where N and N are the number of antennas used to form the CB and IB during the observation, respectively.
At each frequency, and for each CB, all coordinates were excluded as a potential origin for the FRB where
| (3) |
where S/NIB is the measured S/N in the IB at that frequency, and S/NCB is the predicted CB S/N that frequency. Hence, all positions where any CB was more sensitive than the IB, are excluded. Viable positions were assigned a value of one and excluded positions were assigned a value of zero.
This process was repeated at eight frequencies from 856 MHz to 1605 MHz, and the resulting maps added together are shown in the left-hand panel of Figure 4. The blue ellipsoids show the 25 per cent level666This number refers to the 25 per cent level of the maximum sensitivity of the CBs at the L-band centre frequency of 1.284 GHz as determined using Mosaic. of the main lobe of each CB. The colour scale corresponds to the number of sub-bands in which a given position was deemed viable; the maximum likelihood therefore occurs where the IB was more sensitive than all CBs in all sub-bands. This analysis indicates that the FRB most likely originated from immediately outside the CB tiling region.
5.2 FRB 20200915A
Similar to FRB 20200413A, FRB 20200915A has very little localisation information as it was only detected in the IB. The result of a similar localisation analysis as performed for FRB 20200413A is shown in the right-hand panel of Figure 4.
Since in this case MeerTRAP was piggybacking a MALS observation, the MeerKAT correlator saved correlations for every 8-second integration. This means that if the FRB is bright enough, it will be detected in the 8-second radio images of the field. For a pulse with a detected in the time domain search, the expected S/N in the image,
| (4) |
where is the gain of the telescope when it is fully phased and the signals from all antennas are coherently added, is the gain of the incoherent sum, the observed width of the FRB in the time-domain data and is the integration time of the image. For a total of 60 dishes used in the observation we estimate 2.75 K Jy-1 and 0.35 K Jy-1. We assume here that the beamforming efficiency was close to 1. Hence, for a S/N of 45 in the IB, we expect of 4.4 in a 8-second integration radio image.
The MALS data were processed using the Automated Radio Telescope Imaging Pipeline (ARTIP). The details of ARTIP and data processing steps are provided in Gupta et al. (2021). In short, we excluded edge frequency channels and applied a RFI mask to exclude the strong persistent RFI in the L-band. The data were then flagged and calibrated using the ARTIP-CAL package. The calibrated data were then processed using ARTIP-CONT to perform wideband continuum imaging. For this the calibrated target source data were averaged in frequency per 32 channels (0.8 MHz) and a more stringent RFI mask to completely exclude band edges and RFI-afflicted regions was applied. Next, the resultant frequency-averaged 960 channels were regridded along the frequency axis to obtain a measurement set with 16 physically distinct spectral windows. Three rounds of phase-only and one round of amplitude and phase self-calibration were performed. For the widefield (6k 6k image; pixel size = 2′′) broadband imaging, the CASA task tclean with w-projection as the gridding algorithm, with 128 planes, in combination with Multi-scale Multi-term Multi-frequency synthesis (MTMFS) for deconvolution, with nterms = 2 and four pixel scales to model the extended emission, were used. The images were deconvolved down to 3 using masks generated through the Python Blob Detector and Source Finder (pyBDSF777https://www.astron.nl/citt/pybdsf/). The final continuum image, made using robust=0 weighting, has a synthesized beam of (position angle = ). The continuum rms is 15 Jy beam-1.
For the FRB localization, we used a self-calibrated dataset, to make broadband images for 23 timestamps within the time range: 02:23:03.8 - 02:25:59.8. Since, the FRB has no signal above 1400 MHz, we considered only spectral windows 0 to 10 covering 890 - 1415 MHz. These 6k 6k timestamp images (pixel size = 2′′; Briggs robust=0 weighting; Briggs, 1995) at reference frequency of 1145.2 MHz typically have resolution and rms of and 160 Jy beam-1, respectively. The images were corrected for the primary beam attenuation using the model from the KATBEAM library888https://github.com/ska-sa/katbeam. The resulting primary beam corrected images were used for the difference imaging in order to detect a transient source. For this purpose, we used two different methods: subtracting an average image and subtracting consecutive images. We performed both of these methods for both sets of 8 second images. The average image was produced by adding all of the 23 8 second images together and dividing by 23. For the consecutive difference images we simply subtracted the previous 8 second image from the next image. After we had produced the sets of difference images, we used pyBDSF to extract sources from the images. We found that the signal to noise of the extracted sources in the difference images of the time step of the FRB, the time step before the FRB, and the timestep after the FRB was a normal distribution centered on S/N. A few S/N outliers (S/N7) were found, but were determined to be artefacts next to bright sources. As such we were unable to distinguish which source found by pyBDSF in the difference images may be the FRB.
5.3 FRB 20201123A
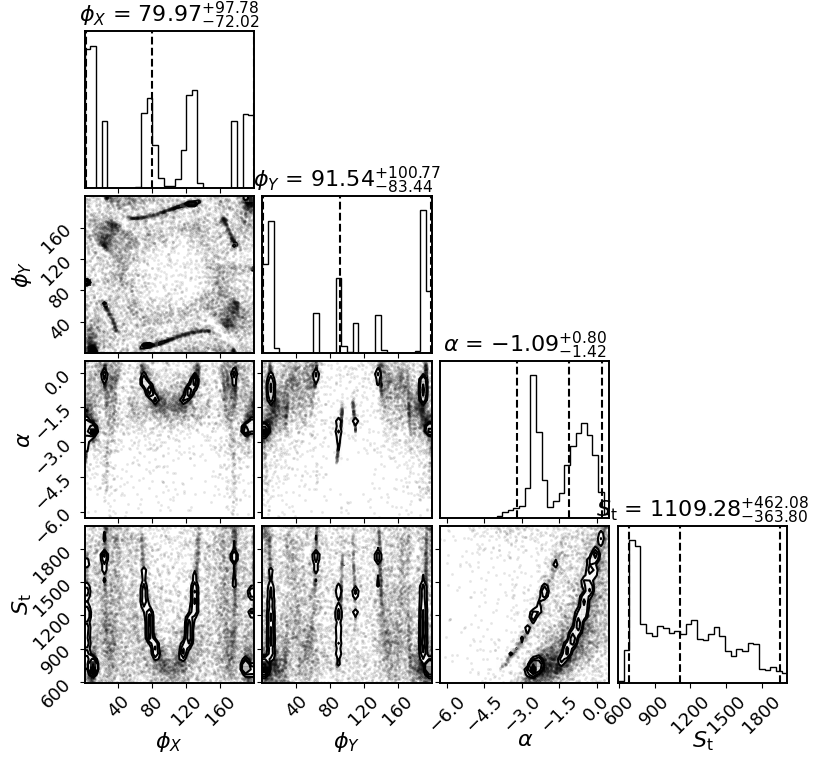
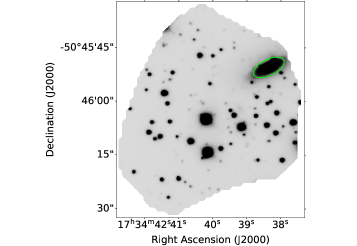
The detection of FRB 20201123A in only a single coherent beam (FWHM of 60 arc-seconds) does constrain its location to a 50"x51" ellipse within the coherent beam (see Figure 6) using SeeKAT999https://github.com/BezuidenhoutMC/SeeKAT, a tied array beam localisation algorithm designed to constrain location of bursts using detections in multiple beams (Bezuidenhout et al., submitted.). Hence, the uncertainties reported in Table 2 for FRB 20201123A are 25" in RA and DEC. One can see that the localisation region is slightly smaller than the size of the CB at 25 power level and that is because of the added constraint of the lack of detections in adjacent CBs 101010We note that the localisation region is strongly dependent on the beam spacing but for MeerTRAP, we have gone for a trade-off between the precision of localisation and the total sky covered by the CB tiling.. The detection in a single coherent beam with no IB detection suggests that the expected S/N in the IB was below the detection threshold of the search pipeline. While we did not save complex voltage data for this FRB, we are able to make several inferences on its potential host galaxy. In order to do that, we try and constrain the location using Bayesian inference on the burst within this single coherent beam. The main assumption we make here is that the intrinsic spectrum of the FRB is best characterized by a power-law function. In this scenario, for a burst with an intrinsic spectral index , the posterior probability of the offset from the boresight is
| (5) |
where the likelihood function is given by the following expression, having split the observing band into equal-sized sub-bands each with centre frequency :
| (6) |
where is the true integrated S/N in band (i.e. that would have been observed had the FRB occurred on boresight), is the observed integrated S/N in band , is a two-dimensional vector that represents the directional offset of the FRB from the boresight of the beam and is the beam response of the telescope. Assuming an ideal telescope receiver (i.e a flat response of the receiver across the entire band), the for a given frequency would scale as,
| (7) |
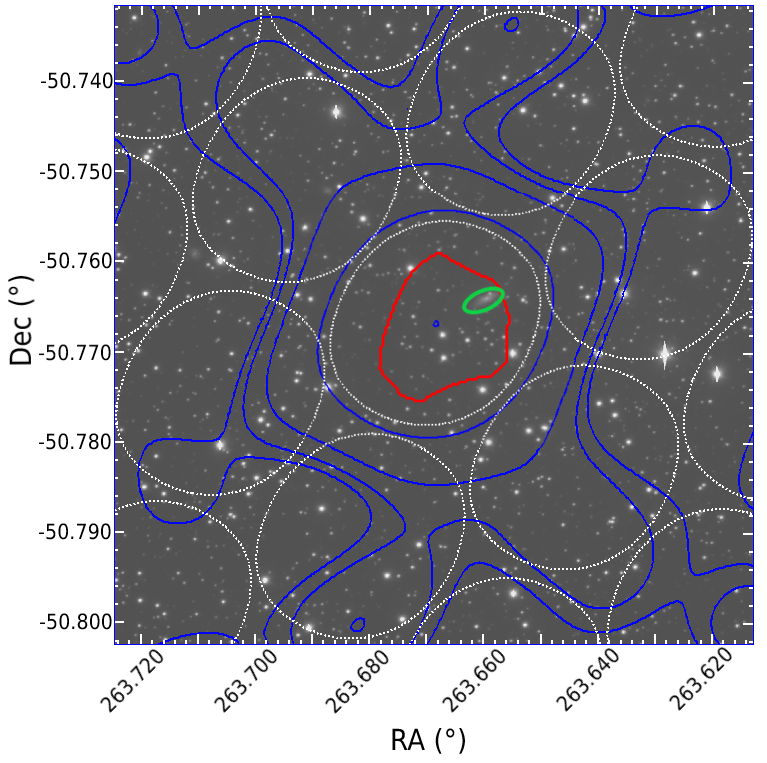
where is the highest frequency subband. The observed dynamic spectrum of FRB 20201123A can be approximated as a power-law and hence that assumption is valid. In order to perform the analysis, we split the data for FRB 20201123A into 4 frequency sub-bands and for each band we computed the S/N of the detected burst. was computed from the actual point spread function of the coherent beam where the FRB was detected. We used the Mosaic (Chen et al., 2021) software to generate the PSFs for various subbands. Each PSF is 200x200 pixels wide with a resolution of 1 arc-second/pixel. The resulting and S/N values were fed into the Bayesian framework to compute the posterior probability of the location of the FRB as shown in Figure 5. We used flat priors for , and . As one can see, the posterior distribution of and is degenerate with multiple local maxima. This suggests that while we can characterize the spectrum of FRB 20201123A as a power-law, one cannot break the degeneracy between the position of the burst in the beam and the S/N of the burst if we assume that bursts with extremely high S/N ratios ( 1000) are as likely as bursts with lower S/N ratios. Constraining the higher end of the prior on will only bias the posterior to favour the boresight of the beam. If there are no constraints on the priors, the 2-D posterior is expected to follow the PSF of the CB which is exactly what is seen in the left panel of Figure 5. Those regions can be ruled out by the fact that the FRB was not seen in any adjacent coherent beam which should have been the case if it were in any of those locations (see right panel of Figure 5). Hence, for the purposes of this analysis, the FRB is equally likely to be anywhere in the CB. This is a limitation of this technique in the case of a single beam detection. However, if the FRB is detected in multiple beams, one can compute the joint posterior distribution of the location of the burst to get more precise constraints on the location using this technique. Closely spaced beams where the beams overlap at a significant fraction of the maximum response will help constrain the location of the burst greatly in absence of detections in neighbouring beams. To overcome these limitations, we also decided to use another Bayesian framework to hone in on the location of the burst and in turn, identify the possible host galaxy for FRB 20201123A which we describe in the section below.
5.3.1 Host Association
On 2021-04-14 and 2021-05-15 UT, we obtained a series of s -band images of the field surrounding FRB 20201123A with the Gemini Multi-Object Spectrograph (GMOS; Hook et al., 2004) mounted on the Gemini-South telescope as part of program GS-2021A-Q-134. Given the low Galactic latitude ( deg), the field is crowded by stars, and thus we prioritized high image quality. These data were reduced with standard image processing techniques using the DRAGONS software.111111https://dragons.readthedocs.io The final stacked s image has an effective PSF FWHM of ′′, and it was astrometrically calibrated to match the Gaia DR2 catalog (Gaia Collaboration et al., 2018; Lindegren et al., 2018) with an astrometric accuracy of ′′.
Figure 6 shows the ′′ diameter localisation of FRB 201123 on the combined -band image. Because of the single-band detection, the localisation is nearly uniform within its boundary. In this region, one expects many tens of galaxies which challenges the association of FRB 201123 to its host galaxy. The association is further complicated by the presence of numerous stars and a Galactic extinction of mag. However, the image reveals a single bright galaxy (hereafter J173438.35504550.4) towards the north-west of the region. Galaxies with its apparent magnitude ( mag; corrected for Galactic extinction and by the presence of an interloper star) and half-light size () are very rare and one is intended to favor this system as the host on chance considerations alone.
We proceeded to perform a probabilistic association to transient host (PATH; Aggarwal et al., 2021) analysis for FRB 20201123A. From the -band image, we used the photutils package (Bradley et al., 2021) to detect sources within the localisation region. Table 3 lists all of these detected sources and their measured properties. Apparent magnitudes were calibrated using reference stars from the SkyMapper Southern Survey (Onken et al., 2019). In order to assess whether an object is a galaxy, we run Source Extractor (Bertin & Arnouts, 1996) and used the CLASS_STAR parameter as our star/galaxy classifier. In the following, we restrict to sources with a star/galaxy classifier value lower than 0.9 and assume the remainder are stars. Four of the sources detected by photutils were not detected by Source Extractor and thus these lack a star/galaxy classifier; in the following we will conservatively assume that these are all galaxies. Last, we correct the apparent magnitudes by mag for Galactic extinction.
| RA | DEC | object | ||||
|---|---|---|---|---|---|---|
| (deg) | (deg) | (′′) | (mag) | classifier | ||
| 263.66814 | -50.76320 | 0.30 | 18.6 | 0.99 | 0.000 | 0.000 |
| 263.66655 | -50.76323 | 0.18 | 20.9 | 0.98 | 0.000 | 0.000 |
| 263.65963 | -50.76407 | 1.75 | 16.5 | 0.03 | 0.838 | 0.915 |
| 263.67147 | -50.76451 | 0.24 | 20.1 | 0.98 | 0.000 | 0.000 |
| 263.65821 | -50.76454 | 0.20 | 20.9 | – | 0.006 | 0.008 |
| 263.67429 | -50.76465 | 0.22 | 20.3 | 0.98 | 0.000 | 0.000 |
| 263.66691 | -50.76538 | 0.19 | 20.9 | 0.99 | 0.000 | 0.000 |
| 263.65972 | -50.76561 | 0.15 | 21.7 | – | 0.003 | 0.004 |
| 263.67249 | -50.76610 | 0.34 | 17.8 | 0.99 | 0.000 | 0.000 |
| 263.66119 | -50.76641 | 0.21 | 20.6 | – | 0.008 | 0.011 |
| 263.65584 | -50.76682 | 0.26 | 19.4 | 0.98 | 0.000 | 0.000 |
| 263.67210 | -50.76691 | 0.23 | 20.1 | 0.98 | 0.000 | 0.000 |
| 263.67667 | -50.76731 | 0.15 | 21.5 | 0.98 | 0.000 | 0.000 |
| 263.66322 | -50.76732 | 0.63 | 22.2 | – | 0.002 | 0.002 |
| 263.66439 | -50.76746 | 0.19 | 20.7 | 0.98 | 0.000 | 0.000 |
| 263.65874 | -50.76765 | 0.29 | 18.9 | 0.99 | 0.000 | 0.000 |
| 263.66397 | -50.76782 | 0.29 | 18.9 | 0.98 | 0.000 | 0.000 |
| 263.66740 | -50.76814 | 0.52 | 15.6 | 0.96 | 0.000 | 0.000 |
| 263.66128 | -50.76787 | 0.24 | 20.0 | 0.88 | 0.014 | 0.019 |
| 263.65673 | -50.76838 | 0.35 | 17.7 | 0.98 | 0.000 | 0.000 |
| 263.67182 | -50.76831 | 0.24 | 19.9 | 0.98 | 0.000 | 0.000 |
| 263.67399 | -50.76835 | 0.24 | 19.9 | 0.98 | 0.000 | 0.000 |
| 263.66306 | -50.76873 | 0.38 | 16.6 | 1.00 | 0.000 | 0.000 |
| 263.65996 | -50.76859 | 0.31 | 18.6 | 0.98 | 0.000 | 0.000 |
| 263.67438 | -50.76912 | 0.29 | 18.8 | 0.99 | 0.000 | 0.000 |
| 263.65887 | -50.76920 | 0.30 | 18.7 | 0.98 | 0.000 | 0.000 |
| 263.67301 | -50.76945 | 0.29 | 19.1 | 0.98 | 0.000 | 0.000 |
| 263.67363 | -50.76963 | 0.16 | 21.2 | 0.98 | 0.000 | 0.000 |
| 263.66927 | -50.76982 | 0.34 | 17.7 | 0.95 | 0.000 | 0.000 |
| 263.66560 | -50.77039 | 0.28 | 19.3 | 0.84 | 0.030 | 0.041 |
| 263.66719 | -50.77070 | 0.51 | 15.8 | 0.99 | 0.000 | 0.000 |
| 263.65809 | -50.77129 | 0.28 | 19.2 | 0.98 | 0.000 | 0.000 |
| 263.66104 | -50.77129 | 0.14 | 21.7 | 0.98 | 0.000 | 0.000 |
| 263.67622 | -50.77218 | 0.18 | 20.8 | 0.98 | 0.000 | 0.000 |
| 263.67074 | -50.77272 | 0.28 | 19.7 | 0.98 | 0.000 | 0.000 |
| 263.67280 | -50.77278 | 0.23 | 20.0 | 0.98 | 0.000 | 0.000 |
| 263.65951 | -50.76679 | 0.23 | 20.7 | 0.98 | 0.000 | 0.000 |
| 263.65988 | -50.76690 | 0.20 | 20.9 | 0.98 | 0.000 | 0.000 |
In addition to the localisation and candidate galaxies, one must also adopt a set of priors to perform the PATH analysis. We follow the preferred assumptions of Aggarwal et al. (2021), i.e. their inverse prior and exponential offset function with . For the unseen prior we assume a value of % based on the angular sky coverage of the stars in the field. The last two columns of Table 3 list the prior probabilities and posterior probabilities for each of the galaxy candidates. The PATH results clearly favor J173438.35504550.4 as the host of FRB 20201123A with a posterior probability . We caution, however, that given the uniform localisation of this FRB, this result is primarily driven by its bright flux and large angular size. Nevertheless, we proceed with relatively high confidence in this association (e.g. its posterior probability exceeds that of every other candidate by an order-of-magnitude).
5.3.2 Putative Host Analysis
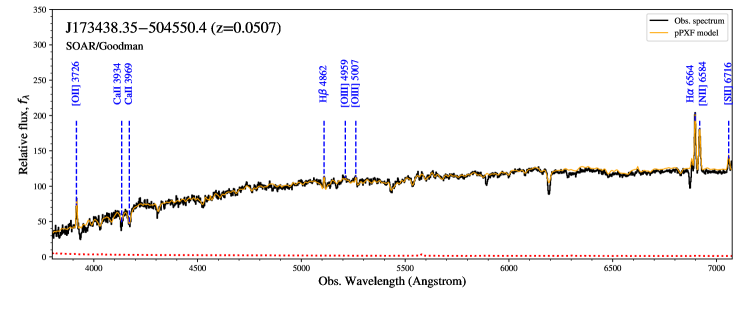
Adopting J173438.35504550.4 as the putative host galaxy for FRB 20201123A, we now proceed to measure its properties and compare these to other, secure FRB hosts (Heintz et al., 2020; Bhandari et al., 2021a). Figure 7 shows a spectrum of J173438.35504550.4 obtained on 2021-03-24 UT with the Goodman spectrograph (Clemens et al., 2004) on the SOAR telescope as part of program SOAR2021A-010. The instrument was configured with the 400_SYZY grating, a 1.0′′ long slit, and binning. These data were reduced with the PypeIt data reduction pipeline (Prochaska et al., 2020) and flux calibrated with a spectrophotmetric standard requiring the -band apparent magnitude match that of the galaxy (to crudely correct for slit losses). For the figure and subsequent analysis, we have corrected the data for Galactic extinction assuming a reddening mag and the Cardelli et al. (1989) extinction law. The galaxy exhibits strong nebular emission lines at a common redshift including [O ii], H, [O iii], H and [N ii].
We performed a stellar population fit to the data at wavelengths Å using the pPXF software package (Cappellari, 2012). For the analysis, we followed the assumptions of previous works (e.g. Heintz et al., 2020). The results provide an estimate of the stellar mass () and the emission-line flux of Hα ( ergs cm-2 s-1) with the latter yielding an inferred star formation rate of SFR after correcting for internal extinction with mag based on the Hα/Hβ ratio. Uncertainties in and SFR are dominated by systematics which include the assumed IMF, slit loss, and dust extinction (both Galactic and internal). We estimate 0.3 dex errors for each quantity. The and SFR values of J173438.35504550.4 place it well within the locus of measured values of highly secure FRB host galaxies (Bhandari et al., 2021b).
6 Fluence limits
Apart from FRB 20201123A, we do not have accurate localisation information on the newly discovered FRBs. This makes calculation of a fluence for the FRBs quite challenging. Hence, we estimate the lower limit on the fluences of the bursts if we assume that the FRB 20200413A and FRB 20200915A are close to the edge of the CB tiling pattern and FRB 20201123A is at the boresight of the CB in which it was discovered. Using the radiometer equation (Dewey et al., 1985), for an FRB with a signal-to-noise ratio , the fluence,
| (8) |
where, is the system temperature, is gain of the telescope in K Jy-1, is the measured width of the FRB in seconds (after de-dispersion and after compensating for any other smearing effects), is the number of polarizations summed and is the bandwidth of the receiver in Hz. Instrumental parameters for MeerKAT from Bailes et al. (2020) are =2, = 856 MHz. We use a =0.175 K/Jy for FRB 20200413A and 0.3 K Jy-1 for FRB 20200915A after taking into account the reduction in the gain of the IB telescope due to the offset from the boresight. This is because the power level at which the CB tiling ends is different for the two FRBs. We assume a gain of 1.75 K Jy-1 for the CB of FRB 20201123A (modified from 2.8 K/Jy since only 40 out of 64 MeerKAT dishes were used for the observations). The telescope’s system temperature is given by = + , with = 18 K the receiver temperature for the 1.4 GHz observations (Ridolfi et al., 2021). We assume the total sky temperature to be 23 K for all FRBs assuming a mean of 5 K contribution due to the sky. Using these values, we obtain a lower limit on the fluence, 3.1 Jy ms and 3 Jy ms for FRB 20200413A and FRB 20200915A respectively. For FRB 20201123A, we also correct the S/N to account for the reduction in the gain of the CB due to its offset from the boresight of the primary beam (18.072 arc-minutes). If we assume that FRB 20201123A originates from the host galaxy J173438.35504550.4, we can compute the true fluence of the burst. In order to do that, we obtain the true gain of the CB at the optical centre of J173438.35504550.4 by simulating the point spread function of the CB using mosaic (Chen et al., 2021)121212https://github.com/wchenastro/Mosaic. We estimate of 1.4 K Jy-1 and using this new value, we obtain 1.4 Jy ms. The final limits are presented in Table 2. Given the redshift of J173438.35504550.4, we estimate the lower limit on the energy of the burst in the MeerKAT band of 8.41034 J. This luminosity is consistent with the general population of FRBs (Luo et al., 2018).
7 Discussion
7.1 Limits on repeating bursts
Since MeerTRAP is a commensal survey instrument, there are always opportunities to follow-up newly discovered FRBs as the field is usually observed multiple times by the LSPs. This means that we were able to obtain follow-up of the fields to look for repeat bursts for the three FRBs reported in this paper. FRB 20201123A shows a post-cursor about 200 ms after the initial bright burst suggesting that it may be a repeater. Such post-cursor bursts have been observed in other repeating FRBs like FRB 20121102A (Zhang et al., 2018; Cruces et al., 2021) and could be a vital diagnostic to identify the nature of FRB 20201123A. So far, MeerTRAP has observed the same field for a total of 25.4 hours. No other burst was detected at the same DM at the S/N threshold of 8.0. If we assume that FRB 20201123A is a repeating source and the burst arrival times are Poisson distributed (Cruces et al., 2021), one can obtain a 95 confidence limit on the repeat rate for the effective sensitivity of the survey in that direction (assuming that it remains unchanged in that direction for successive observations). From Gehrels (1986), the 95 confidence level upper limit on the repeat rate is given by
| (9) |
where is the total observation time. This gives a limit on of 0.18 bursts per hour. For the other two FRBs, the total time on sky is too low (< 2 hours) to put any tight constraint on the repeat rate. We note that the gap between detection of the first event and the start of the follow-up observation is important to find repeat bursts (see Caleb et al., 2019, for more details) but since MeerTRAP does not have control over when the same field is observed, we can only provide rough limits on the repeat rate of these FRBs.
7.2 Scattering in FRB 20201123A
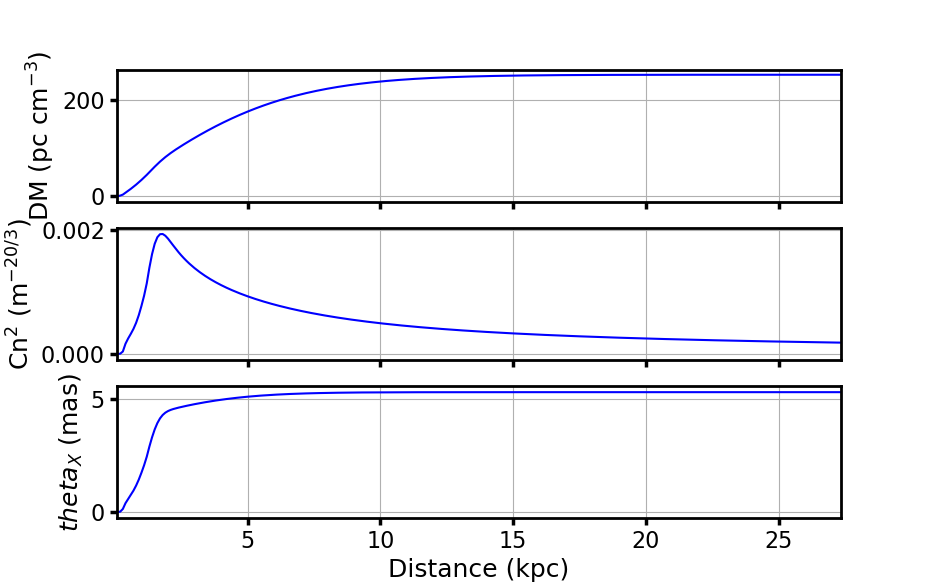
The spectral index of the scattering in FRB 20201123A () (the left panel of figure 3) is 4.2 which is consistent within 1- errobars to the relationship that is expected for a turbulent medium that follows a Kolmogorov spectrum (e.g Lorimer & Kramer, 2004). In order to determine the predicted scattering contribution from the Milky Way, we looked at the expected values from the electron density models of our Galaxy along this line of sight (Cordes & Lazio, 2002; Yao et al., 2017). For an FRB at a distance and a scattering screen distance, , where is the extragalactic angular broadening and is the speed of light (see Main et al., 2021, and the references therein). We took 100 randomly sampled Right Ascensions and Declinations within a 30"x30" circle around the centre of the CB in which FRB 20201123A was detected and computed the total Scattering Measure and the DM contribution of our Galaxy as a function of distance using the electron density models. Figure 8 shows the values of (the measure of scattering strength) and the DM contribution and one can clearly see that the maximum contribution to scattering comes from a putative screen at a distance of 1.8 kpc. Using 5.314 mas gives s at 1 GHz. The ymw16 model (Yao et al., 2017) reports an expected scattering timescale of 150 s which is still two orders of magnitude lower than the measured 10 ms at 1 GHz, suggesting that the scattering cannot originate from our Galaxy. This means that the scattering in this FRB might originate from an extremely turbulent medium close to the FRB itself as is inferred from the current FRB population (see Chawla et al., 2021).
Another possibility that we considered was that the majority of the scattering originates from an intersecting halo of a foreground galaxy (see Prochaska et al., 2019, for more details). While it is expected that the gas in halos of galaxies is not dense, the geometric boost under the thin screen scattering model may render an intervening halo to dominate the scattering comparable to turbulent environments in the host or our Galaxy if it is between the host galaxy and us. In order to quantify how likely it is that the sightline is intersected by foreground halos, we follow the same technique as presented in Prochaska et al. (2019). We use the Aemulus Halo Mass function (McClintock et al., 2019) to generate halos of masses between 21010 and 1016 . Then, we compute the average number of halos in the comoving volume enclosed at the redshift of the host galaxy of FRB 20201123A (z=0.0507), =0.227. Then, assuming the impact parameter of the FRB line of sight to be comparable to the virial radius of the intervening galaxy and assuming that the halos are Poisson distributed in the given comoving volume, the probability that the sightline is intersected by halos,
| (10) |
Hence the probability of intersecting at least one halo, is 1 which is 21. The value of is sensitive to the value of which in turn depends on the lowest halo mass assumed in the Halo Mass function. If we assume that the lower limit on the halo mass comes from the halo of a Milky Way like galaxy (1012 ), we get of 0.099 which reduces by a factor of 2. Regardless, this is a non-negligible probability and allows that the scattering could originate from multiple intersecting halos of foreground galaxies.
In order to distinguish between the two possibilities we predict the scattering that would be induced if it was originating in the host or originating in an intervening galaxy. Based on previous work by Ocker et al. (2021), the expected scattering time,
| (11) |
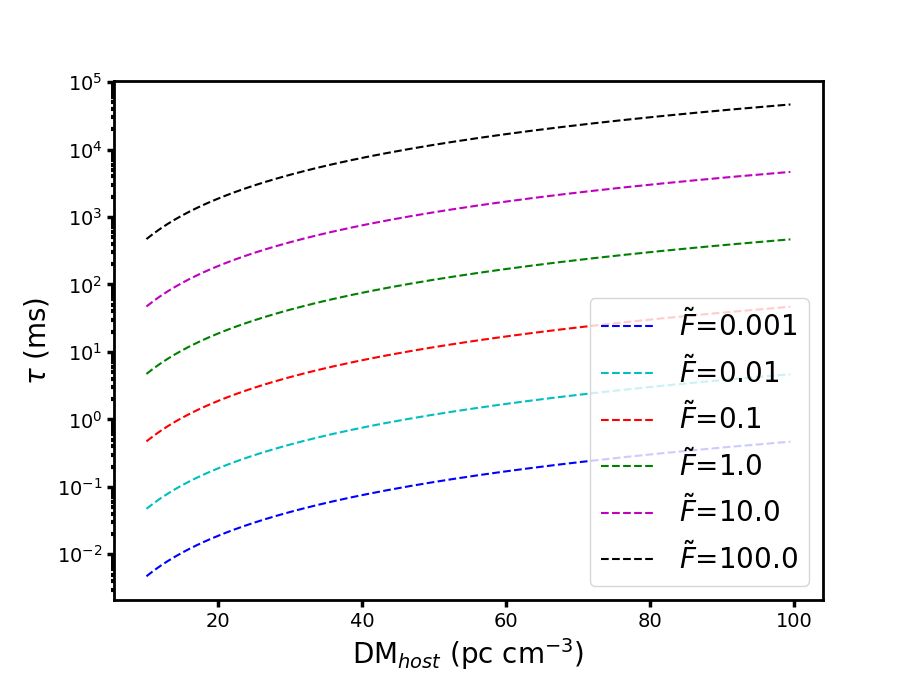
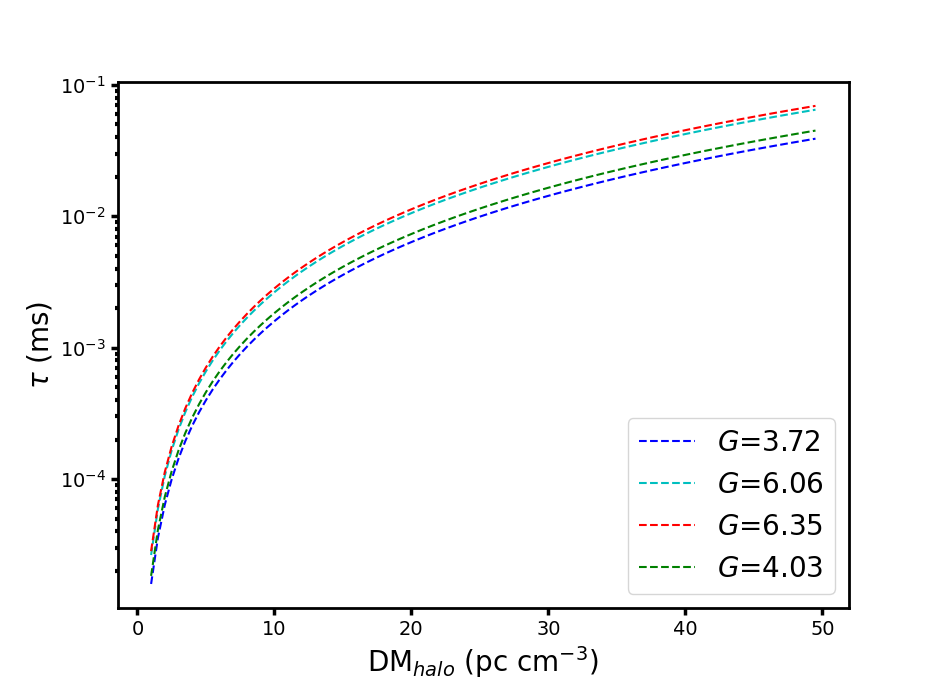
where is a factor close to unity, is factor that characterizes the turbulence in the scattering medium, is the geometric boosting to scattering due to the distance between the scattering screen, the source and the observer () where , and are the angular diameter distances of, source to lens, source to observer and lens to observer respectively. is the DM contribution from the scattering medium, is the redshift of the scattering medium and is the observing frequency. If the scattering originates in the host galaxy, we expect to dominate the total scattering time while . On the other hand, if the scattering is dominated by the intervening galaxy halo, we expect to be large () for where is the distance from the lens to the source or the observer. In this case, we expect little to no turbulence from the diffuse gas as shown from previous studies (see Prochaska et al., 2019, for more details). Here, we compute the scattering for a foreground galaxy that lies at a distance ranging from 25 to 75 of the redshift of the host. For the host galaxy scattering, we assume 1 and compute scattering for various values of . For scattering from an intervening halo, we used the smallest value of measured for pulsars in our Galaxy (Ocker et al., 2021) and computed scattering for various values of derived from the range of distances of the intervening halo. We also evolve with the Star-Formation rate using Eq. 21 in Ocker et al. (2022). We note that the value of used is very conservative as is expected to be even smaller but pulsars are unable to probe this diffuse gas. Figure 9 shows the expected scattering for both scenarios. It is clear that the foreground galaxies cannot account for the scattering seen in FRB 20201123A (7.5 ms at 1 GHz) even for all possible values of within the co-moving value enclosed by the host galaxy of FRB 20201123A while one can obtain the expected at 1 GHz from the host galaxy itself fairly easily. Hence, we conclude that the scattering in this FRB originates from the host galaxy.
7.3 Host galaxy of FRB 20201123A
Along with the time-domain detections, we identified J173438.35504550.4 as a potential host galaxy for FRB 20201123A using robust statistical treatment given the relatively small localisation error region. At face value, the low redshift of J173438.35504550.4 appears at odds with the large dispersion measure for FRB 20201123A (). Our Galaxy, however, contributes (NE2001 gives 229 and YMW16 gives 162 ) from its interstellar medium and a presumed from its halo (Prochaska & Zheng, 2019). This leaves for the cosmos () and the host (). At , the average cosmic contribution is (Macquart et al., 2020) but the intrinsic scatter in this quantity is predicted to be large. Adopting the best-fit model to the Macquart relation by Macquart et al. (2020), the 95% confidence interval is . Allowing for the maximum value of this interval (which would imply a significant foreground galaxy halo), we recover a minimum host contribution of . This is consistent with estimates for host galaxy contributions from theoretical and empirical treatments (Prochaska & Zheng, 2019; James et al., 2021). For a true value of this sightline closer to (or below) the mean, the host contribution would exceed . Such values are inferred for other FRB hosts (e.g. FRB 20121102A; Tendulkar et al., 2017). In conclusion, we find no strong evidence to rule out the association with J173438.35504550.4 based on its redshift and . The significant host contribution to the DM combined with the scattering in FRB 20201123A possibly originating in the host shows that it shares similarities with other highly active repeating FRBs like FRB 20121102A and FRB 20190520A and potentially resides in a turbulent and dense environment within the host.
7.4 Speckled emission of FRB 20200915A
As mentioned previously, we see speckled emission in the dynamic spectrum of FRB 20200915A whose frequency evolution may not with interstellar scintillation from our Galaxy. A more robust method of confirming this conjecture would be to fit the scintles analytically to show how the width varies with frequency. In the case of FRB 20200915A, the scintles are not bright enough or do not conform to a specific shape such that they could be fit by an analytical model. Hence, the disagreement with Galactic scintillation can only be marginally validated visually in this case. Another possibility is that the speckled behaviour may arise from plasma lensing of FRB emission in the vicinity of the progenitor giving rise to caustics that are observed in the dynamic spectrum. The caustics are chromatic in nature and can manifest themselves as magnified islands of emission in time and observed frequency space (see Cordes et al., 2017; Main et al., 2018, for more details). Within a perfect-lens approximation, the frequency width of a caustic due to magnification from a 1D elliptical lens,
| (12) |
where is the equivalent radius ( = / where is the Fresnel scale) of the lens in the circular approximation and is the semi-major axis of the lens. One caveat here is that the relative velocity between the source and lens will cause the waves to interfere and produce complex patterns in the frequency space that can manifest itself as islands of emission drifting in time and frequency. Since we do not see any drift in time as seen for other repeating FRBs (Hessels et al., 2019), we can only put an upper limit on the velocity of the plasma lens in the -direction with respect to the FRB. The relative velocity,
| (13) |
where the delay in obtaining a new caustic due to the relative motion is,
| (14) |
In our case, is constrained by the maximum dispersion smearing in our band which corresponds to 3.4 ms for FRB 20200915A. Assuming the size of the filament close to the FRB of 1 AU, we get 100 km. Using these values in Eq. 13 gives a lower limit on of 4.6102 km s-1. Regardless of which model we consider, they cannot explain the decrease in the spectral extent of the emission with increasing frequency. Thus, we conclude that the speckled emission seen in FRB 20200915A might be intrinsic to the FRB. Such speckled emission as also been observed in a number of FRBs discovered by ASKAP (Shannon et al., 2018) and could point to a common emission characteristic within the population. However, as mentioned previously, we cannot rule out weak scintillation arising from the halo of an intervening galaxy as confirming the same would require data at much higher time resolution.
8 Summary
In summary, we present the first three discoveries of FRBs from the MeerTRAP project. FRB 20200915A shows speckled emission structure in the dynamic spectrum that is reminiscent of a few FRBs discovered by ASKAP. We show that the decorrelation bandwidth of the scintles of FRB 20200915A does not seem to follow the typical frequency relation and also cannot be explained by plasma lensing in the host galaxy, suggesting that the speckled nature of the burst might be intrinsic in nature. FRB 20201123A shows clear evidence for scattering. We investigated the origin of scattering in FRB 20201123A and find that the scattering cannot originate from our Galaxy or the halo of an intervening galaxy and is most likely dominated by some turbulent material in close proximity to the source as expected from recent simulations by Chawla et al. (2021). As FRB 20201123A was detected only in a single coherent beam, we were able to put tight constraints on its location. Using the non-detection in adjacent beams and a Bayesian framework called path, we were able to hone in on the most probably host galaxy for FRB 20201123A. Assuming J173438.35504550.4 to be the host of FRB 20201123A, the DM contribution from the host is still consistent with what one would expect for the host galaxy contribution to the DM which can exceed 100 pc cm-3 for the smallest contribution from the IGM based on the Macquart relation. This combined with the scattering suggests some similarities between the environment of FRB 20201123A and few of the prolific repeating FRBs. None of the bursts were seen to repeat although a faint post-cursor was seen 200 ms after the main burst of FRB 20201123A.
Acknowledgements
K.M.R., B.W.S., M.C., F.J., M.S., T.B., L.D., S.S., M.M. and V.M. thank the MeerKAT Large Survey Project teams for allowing MeerTRAP to observe commensally. K.M.R., B.W.S., M.C., F.J., M.S., T.B., L.D., S.S., M.M. and V.M. acknowledge funding from the European Research Council (ERC) under the European Union’s Horizon 2020 research and innovation programme (grant agreement No. 694745). The authors also acknowledge the usage of TRAPUM infrastructure funded and installed by the Max-Planck-Institut für Radioastronomie and the Max-Planck-Gesellschaft. The authors would like to thank Christopher Williams and Aris Karastergiou for invaluable help during the commissioning of the MeerTRAP system. K.M.R. acknowledges support from the Vici research program ’ARGO’ with project number 639.043.815, financed by the Dutch Research Council (NWO). M.C. acknowledges support of an Australian Research Council Discovery Early Career Research Award (project number DE220100819) funded by the Australian Government and the Australian Research Council Centre of Excellence for All Sky Astrophysics in 3 Dimensions (ASTRO 3D), through project number CE170100013. J.K.K acknowledges support from the Swiss National Science Foundation under grant 185692. Authors W.F., C.K., J.X.P., and N.T. as members of the Fast and Fortunate for FRB Follow-up team, acknowledge support from NSF grants AST-1911140 and AST-1910471. N.T. and C.N. acknowledge support by FONDECYT grant 11191217. The authors would like to thank Rene Breton for invaluable discussions regarding the localisation of FRB 20201123A using the Bayesian Framework. The MeerKAT telescope is operated by the South African Radio Astronomy Observatory (SARAO), which is a facility of the National Research Foundation, an agency of the Department of Science and Innovation. The authors would also like to thank the South African Radio Astronomy Observatory staff for all the help during these observations. Based on observations obtained at the international Gemini Observatory, a program of NSF’s NOIRLab, which is managed by the Association of Universities for Research in Astronomy (AURA) under a cooperative agreement with the National Science Foundation on behalf of the Gemini Observatory partnership: the National Science Foundation (United States), National Research Council (Canada), Agencia Nacional de Investigación y Desarrollo (Chile), Ministerio de Ciencia, Tecnología e Innovación (Argentina), Ministério da Ciência, Tecnologia, Inovações e Comunicações (Brazil), and Korea Astronomy and Space Science Institute (Republic of Korea). The Gemini data were obtained from program GS-2021A-Q-134, and were processed using the DRAGONS (Data Reduction for Astronomy from Gemini Observatory North and South) package. The MALS data were processed using the MALS computing facility at IUCAA (https://mals.iucaa.in).
Data Availability
The data will be made available upon reasonable request to the authors. The galaxy observations of J173438.35504550.4 are available at https://github.com/FRBs/FRB.
References
- Adámek & Armour (2020) Adámek K., Armour W., 2020, The Astrophysical Journal Supplement Series, 247, 56
- Aggarwal et al. (2021) Aggarwal K., Budavári T., Deller A. T., Eftekhari T., James C. W., Prochaska J. X., Tendulkar S. P., 2021, ApJ, 911, 95
- Armour et al. (2011) Armour W., et al., 2011, in Astronomical Data Analysis Software and Systems XXI. pp 33–36
- Asad et al. (2021) Asad K. M. B., et al., 2021, MNRAS, 502, 2970
- Bailes et al. (2020) Bailes M., et al., 2020, Publ. Astron. Soc. Australia, 37, e028
- Barr (2018) Barr E. D., 2018, in Weltevrede P., Perera B. B. P., Preston L. L., Sanidas S., eds, Proceedings of the International Astronomical Union, IAU Symposium Vol. 337, Pulsar Astrophysics the Next Fifty Years. pp 175–178, doi:10.1017/S1743921317009036
- Bertin & Arnouts (1996) Bertin E., Arnouts S., 1996, A&AS, 117, 393
- Bezuidenhout et al. (2022) Bezuidenhout M. C., et al., 2022, MNRAS, 512, 1483
- Bhandari et al. (2021a) Bhandari S., et al., 2021a, arXiv e-prints, p. arXiv:2108.01282
- Bhandari et al. (2021b) Bhandari S., et al., 2021b, arXiv e-prints, p. arXiv:2108.01282
- Bochenek et al. (2020) Bochenek C. D., Ravi V., Belov K. V., Hallinan G., Kocz J., Kulkarni S. R., McKenna D. L., 2020, Nature, 587, 59
- Bradley et al. (2021) Bradley L., et al., 2021, astropy/photutils: 1.1.0, doi:10.5281/zenodo.596036
- Briggs (1995) Briggs D. S., 1995, in American Astronomical Society Meeting Abstracts. p. 112.02
- CHIME/FRB Collaboration et al. (2020) CHIME/FRB Collaboration et al., 2020, Nature, 587, 54
- Caleb et al. (2019) Caleb M., Stappers B. W., Rajwade K., Flynn C., 2019, MNRAS, 484, 5500
- Caleb et al. (2020) Caleb M., et al., 2020, MNRAS, 496, 4565
- Cappellari (2012) Cappellari M., 2012, pPXF: Penalized Pixel-Fitting stellar kinematics extraction (ascl:1210.002)
- Cardelli et al. (1989) Cardelli J. A., Clayton G. C., Mathis J. S., 1989, ApJ, 345, 245
- Chawla et al. (2021) Chawla P., et al., 2021, arXiv e-prints, p. arXiv:2107.10858
- Chen et al. (2021) Chen W., Barr E., Karuppusamy R., Kramer M., Stappers B., 2021, arXiv e-prints, p. arXiv:2110.01667
- Chime/Frb Collaboration et al. (2020) Chime/Frb Collaboration et al., 2020, Nature, 582, 351
- Clemens et al. (2004) Clemens J. C., Crain J. A., Anderson R., 2004, in Moorwood A. F. M., Iye M., eds, Society of Photo-Optical Instrumentation Engineers (SPIE) Conference Series Vol. 5492, Ground-based Instrumentation for Astronomy. pp 331–340, doi:10.1117/12.550069
- Cordes & Lazio (2002) Cordes J. M., Lazio T. J. W., 2002, arXiv e-prints, pp astro–ph/0207156
- Cordes & Rickett (1998) Cordes J. M., Rickett B. J., 1998, ApJ, 507, 846
- Cordes et al. (2017) Cordes J. M., Wasserman I., Hessels J. W. T., Lazio T. J. W., Chatterjee S., Wharton R. S., 2017, ApJ, 842, 35
- Cruces et al. (2021) Cruces M., et al., 2021, MNRAS, 500, 448
- Dewey et al. (1985) Dewey R. J., Taylor J. H., Weisberg J. M., Stokes G. H., 1985, ApJ, 294, L25
- Eatough et al. (2009) Eatough R. P., Keane E. F., Lyne A. G., 2009, MNRAS, 395, 410
- Gaia Collaboration et al. (2018) Gaia Collaboration et al., 2018, A&A, 616, A1
- Gehrels (1986) Gehrels N., 1986, ApJ, 303, 336
- Gupta et al. (2016) Gupta N., et al., 2016, in MeerKAT Science: On the Pathway to the SKA. p. 14 (arXiv:1708.07371)
- Gupta et al. (2021) Gupta N., et al., 2021, ApJ, 907, 11
- Heintz et al. (2020) Heintz K. E., et al., 2020, ApJ, 903, 152
- Hessels et al. (2019) Hessels J. W. T., et al., 2019, ApJ, 876, L23
- Hook et al. (2004) Hook I. M., Jørgensen I., Allington-Smith J. R., Davies R. L., Metcalfe N., Murowinski R. G., Crampton D., 2004, Publications of the Astronomical Society of the Pacific, 116, 425
- Huchra & Geller (1982) Huchra J. P., Geller M. J., 1982, ApJ, 257, 423
- James et al. (2021) James C. W., Prochaska J. X., Macquart J. P., North-Hickey F., Bannister K. W., Dunning A., 2021, arXiv e-prints, p. arXiv:2101.08005
- Jankowski et al. (2020) Jankowski F., et al., 2020, arXiv e-prints, p. arXiv:2012.05173
- Jonas & MeerKAT Team (2016) Jonas J., MeerKAT Team 2016, in MeerKAT Science: On the Pathway to the SKA. p. 1
- Lindegren et al. (2018) Lindegren L., et al., 2018, A&A, 616, A2
- Lorimer & Kramer (2004) Lorimer D. R., Kramer M., 2004, Handbook of Pulsar Astronomy. Cambridge observing handbooks for research astronomers Vol. 4
- Lorimer et al. (2007) Lorimer D. R., Bailes M., McLaughlin M. A., Narkevic D. J., Crawford F., 2007, Science, 318, 777
- Luo et al. (2018) Luo R., Lee K., Lorimer D. R., Zhang B., 2018, MNRAS, 481, 2320
- Macquart & Koay (2013) Macquart J.-P., Koay J. Y., 2013, ApJ, 776, 125
- Macquart et al. (2020) Macquart J. P., et al., 2020, Nature, 581, 391
- Main et al. (2018) Main R., et al., 2018, Nature, 557, 522
- Main et al. (2021) Main R. A., Hilmarsson G. H., Marthi V. R., Spitler L. G., Wharton R. S., Bethapudi S., Li D. Z., Lin H. H., 2021, arXiv e-prints, p. arXiv:2108.00052
- Majid et al. (2021) Majid W. A., et al., 2021, ApJ, 919, L6
- Malenta et al. (2020) Malenta M., et al., 2020, in Pizzo R., Deul E. R., Mol J. D., de Plaa J., Verkouter H., eds, Astronomical Society of the Pacific Conference Series Vol. 527, Astronomical Society of the Pacific Conference Series. p. 457
- McClintock et al. (2019) McClintock T., et al., 2019, ApJ, 872, 53
- Ocker et al. (2021) Ocker S. K., Cordes J. M., Chatterjee S., 2021, ApJ, 911, 102
- Ocker et al. (2022) Ocker S. K., et al., 2022, arXiv e-prints, p. arXiv:2202.13458
- Onken et al. (2019) Onken C. A., et al., 2019, Publ. Astron. Soc. Australia, 36, e033
- Oswald et al. (2021) Oswald L. S., et al., 2021, MNRAS, 504, 1115
- Platts et al. (2019) Platts E., Weltman A., Walters A., Tendulkar S. P., Gordin J. E. B., Kandhai S., 2019, Phys. Rep., 821, 1
- Pleunis et al. (2021) Pleunis Z., et al., 2021, ApJ, 923, 1
- Prochaska & Zheng (2019) Prochaska J. X., Zheng Y., 2019, MNRAS, 485, 648
- Prochaska et al. (2019) Prochaska J. X., et al., 2019, Science, 366, 231
- Prochaska et al. (2020) Prochaska J., et al., 2020, The Journal of Open Source Software, 5, 2308
- Qiu et al. (2020) Qiu H., et al., 2020, MNRAS, 497, 1382
- Rajwade et al. (2020) Rajwade K. M., et al., 2020, MNRAS, 495, 3551
- Ravi et al. (2016) Ravi V., et al., 2016, Science, 354, 1249
- Rickett (1970) Rickett B. J., 1970, MNRAS, 150, 67
- Ridolfi et al. (2021) Ridolfi A., et al., 2021, MNRAS, 504, 1407
- Sanidas et al. (2018) Sanidas S., Caleb M., Driessen L., Morello V., Rajwade K., Stappers B. W., 2018, in Weltevrede P., Perera B. B. P., Preston L. L., Sanidas S., eds, Vol. 337, Pulsar Astrophysics the Next Fifty Years. pp 406–407, doi:10.1017/S1743921317009310
- Shannon et al. (2018) Shannon R. M., et al., 2018, Nature, 562, 386
- Spitler et al. (2016) Spitler L. G., et al., 2016, Nature, 531, 202
- Tendulkar et al. (2017) Tendulkar S. P., et al., 2017, ApJ, 834, L7
- The CHIME/FRB Collaboration et al. (2021) The CHIME/FRB Collaboration et al., 2021, arXiv e-prints, p. arXiv:2106.04352
- Thornton et al. (2013) Thornton D., et al., 2013, Science, 341, 53
- Yao et al. (2017) Yao J. M., Manchester R. N., Wang N., 2017, ApJ, 835, 29
- Zhang et al. (2018) Zhang Y. G., Gajjar V., Foster G., Siemion A., Cordes J., Law C., Wang Y., 2018, ApJ, 866, 149
- de Villiers & Cotton (2022) de Villiers M. S., Cotton W. D., 2022, AJ, 163, 135