Abstract
The active galactic nucleus (AGN) phenomena results from a supermassive black hole accreting its surrounding gaseous and dusty material. The infrared (IR) regime provides most of the information to characterize the dusty structures that bridge from the galaxy to the black hole, providing clues to the black hole growth and host galaxy evolution. Over the past several decades, with the commissioning of various ground, airborne and space IR observing facilities, our interpretations of the AGN circumnuclear structures have advanced significantly through improved understanding of how their dust emission changes as a function of wavelength and how the heating of the dusty structures responds to variations of the energy released from the central engine. In this review, we summarize the current observational knowledge of the AGN IR broad-band spectral energy distributions (SEDs) and the IR time variability behavior covering large ranges of AGN luminosity and redshift, and discuss some first-order insights into the obscuring structures and host galaxy IR properties that can be obtained by integrating the relevant observations into a coherent picture.
keywords:
Active Galactic Nuclei; Dust Continuum Emission; Spectral Energy Distribution; Reverberation Mapping; Seyfert Galaxies; Quasars; AGN Host Galaxies; IR Galaxies; IR Astronomy; Time Domain Astronomy1 \issuenum1 \articlenumber0 \datereceived \dateaccepted \datepublished \hreflinkhttps://doi.org/ \TitleInfrared Spectral Energy Distribution and Variability of Active Galactic Nuclei: Clues to the Structure of Circumnuclear Material \TitleCitationInfrared Spectral Energy Distribution and Variability of Active Galactic Nuclei: Clues to the Structure of Circumnuclear Material \AuthorJianwei Lyu 1*\orcidA and George Rieke 1*\orcidB \AuthorNamesJianwei Lyu and George Rieke \AuthorCitationLyu, J.& Rieke, G. \corresCorrespondence: jianwei@arizona.edu (J.L.); grieke@arizona.edu (G.R.)
1 Introduction
Stars and supermassive black holes (SMBHs) in the form of active galactic nuclei (AGNs) are the two main sources of radiation energy in the Universe. Our understanding of stars stands on a foundation (the Russell-Vogt Theorem) that their properties to first order depend only on initial composition, mass, and age. AGNs, at least with our current understanding, are more complex. Unification theories relate the different manifestations of this phenomenon into a general picture. However, the variety of observable properties at all spatial scales and wavelength ranges can differ significantly in ways not predicted a priori by theory, nor is their evolution well understood.
A number of reviews of the AGN phenomenon have focused on separate aspects. For example, Ulrich et al. (1997) focus on the time variability of their outputs; Alexander & Hickox (2012) address the vexing issue of how supermassive black holes (SMBHs) grow to their immense masses; Heckman & Best (2014) discuss the interactions between the evolution of host galaxies and their SMBHs; Netzer (2015) discusses the unified model, largely from a theoretical perspective; Padovani et al. (2017) present a discussion of the unified model across the entire electromagnetic spectrum, with emphasis on the observational parameters; Ramos Almeida & Ricci (2017) describe the current understanding of how obscuration by circumnuclear material alters the observable parameters of AGN; Hickox & Alexander (2018) discuss AGNs that are heavily obscured by or even embedded in dense clouds of interstellar gas and dust; Lacy & Sajina (2020) focus on the advances in understanding AGN made with the Spitzer Space Telescope; and Cackett et al. (2021) review the reverberation mapping technique, where time delays in variations of different AGN components provide insights to the structure — they focus largely on the X-ray, UV, optical, and broad line regions (BLRs) where this technique has been applied extensively.
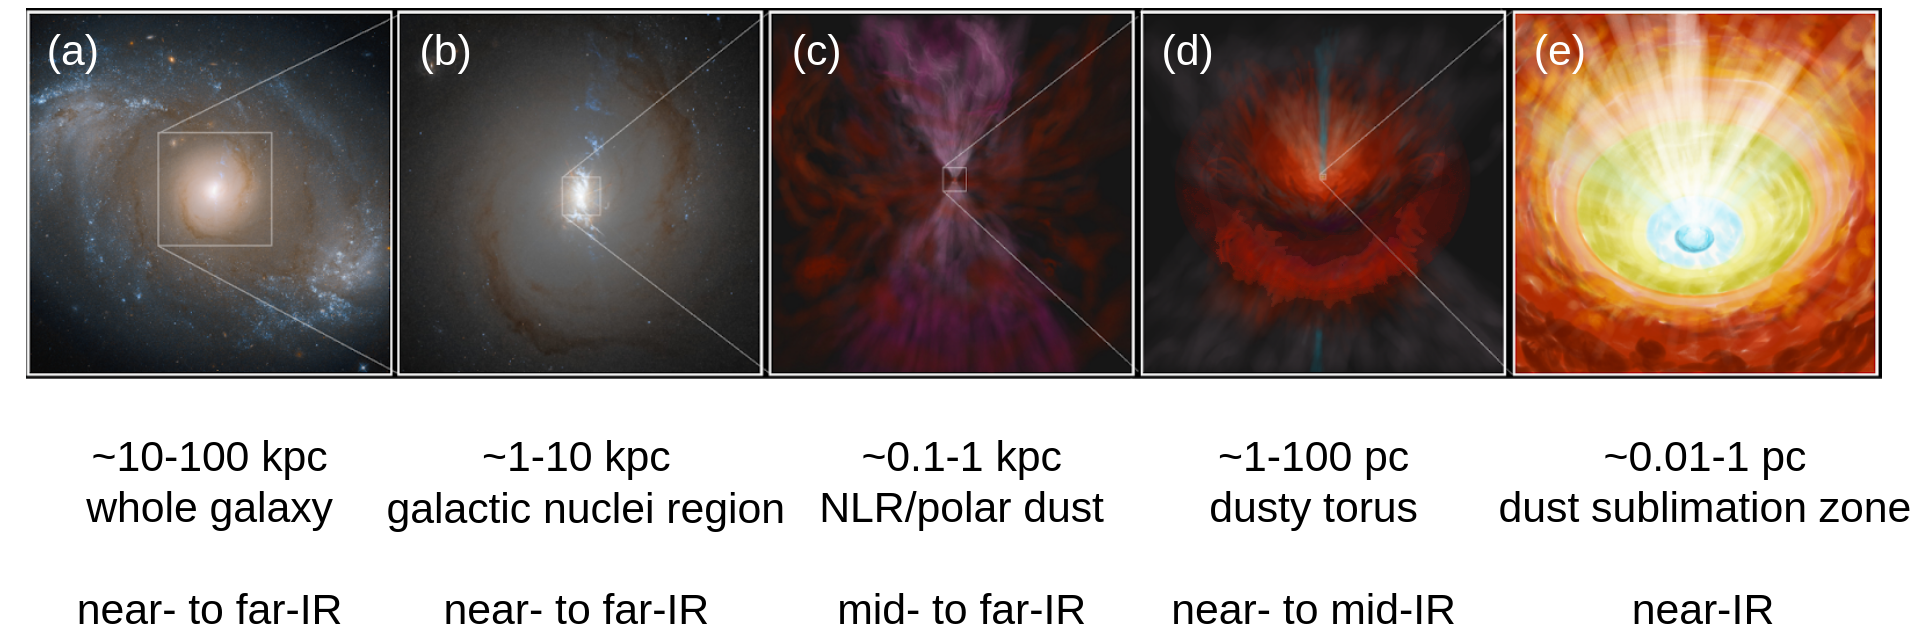
Where does this review fit in? The central engines of AGNs are surrounded by a complex set of gaseous and dusty structures, which affect the appearance of the AGN in virtually every direction. In addition, these structures trace the inflows and outflows of material to the central engine, providing important clues to the growth of the central SMBH and its relation with the host galaxy. This review summarizes how our knowledge of these structures has grown through extensive infrared (IR) observations and synthesizes the current understanding into a coherent picture. As a guide, Figure 1 gives an overview of the relevant structures that can contribute to the AGN IR emission across different wavelengths, along with their relative scales, as inferred from various current observations. Figure 2 zeros in on the possible dusty structures in the immediate region of the central engine of the AGN, whose observed empirical properties and their immediate implications will occupy much of our discussion.
The concepts illustrated in these two figures are largely based on studies of the AGN spectral energy distributions (SEDs) and time variability, with additional insights provided by IR interferometry and other spatially resolved observations of nearby objects. We organize this review around the first two approaches, with descriptions when appropriate of how interferometry has upset previous concepts and set the thought process on a new path. Section 2 summarizes the observed characteristics of AGN IR SEDs, including a brief history, our current ideas of the general AGN IR SED features as well as possible outliers, and some discussion of IR SED decomposition and the inferred host galaxy properties. Section 3 focuses on AGN IR dust reverberation mapping and time variability studies, discussing the challenges and the results from various campaigns. Section 4 stresses the important role of AGN IR selection to complete the AGN census with an overview of selection techniques such as color-color diagrams, SED analysis and time variability. We briefly integrate the various AGN IR observations discussed in this review to provide a synthesis of the constraints on the AGN dusty environment in Section 5.
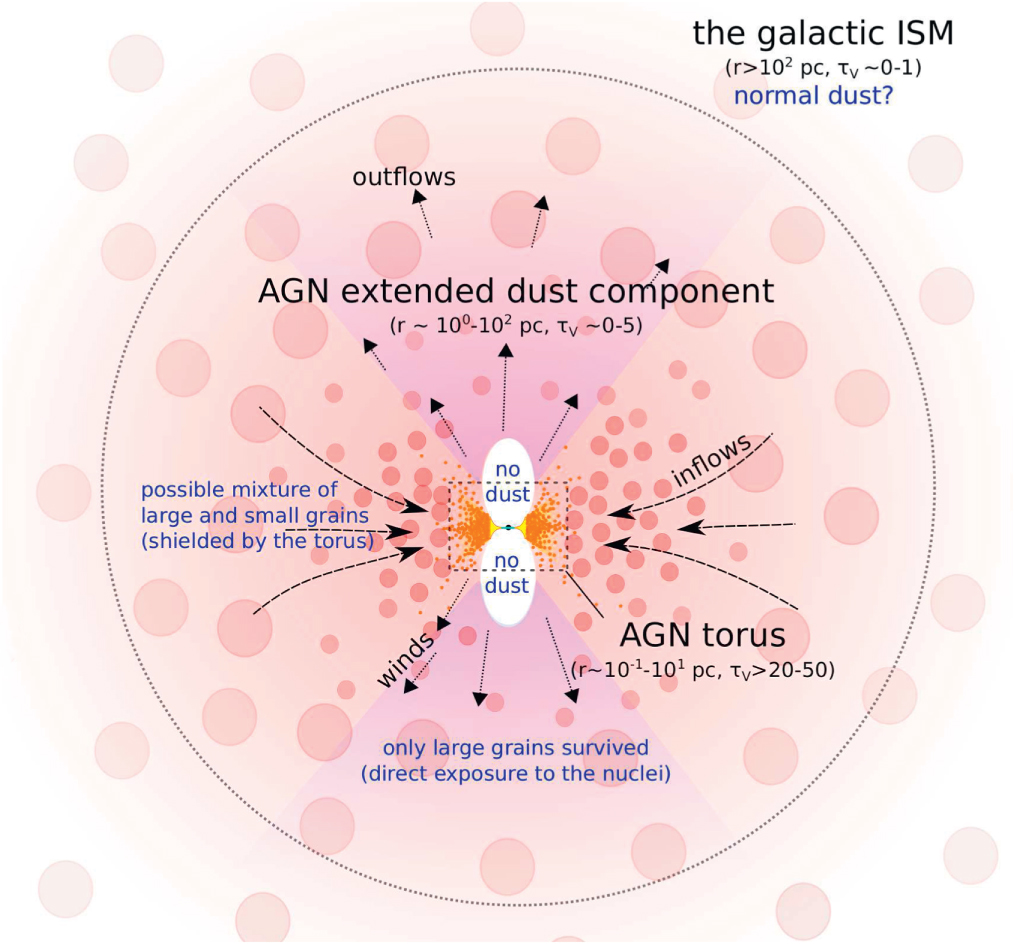
To clarify our terminology, we use “AGN” in a general way to describe any active nucleus whose bolometric luminosity . “Quasar”111 The term “quasar” has come into general use beyond the original designation of a radio source and encompasses “QSO”- quasi-stellar object. is reserved for the most energetic AGNs with ; the term by itself does not indicate if the nucleus is obscured or not. Relatively low-luminosity AGNs (–) are termed “Seyfert nucleus/galaxy”. The word “torus” is adopted to describe the relatively compact optically-thick dusty structures that surround the BH accretion disk, although the real geometry can be very different from the classical donut cartoon. We describe the more extended structure in the same plane as the circumnuclear disk. “Polar dust” refers to the dust distribution in the AGN polar direction, including dusty winds launched from the torus as well as the more extended dusty NLRs. We define near-IR as m, mid-IR as m, and far-IR as m.
2 The IR Spectral Energy Distribution of AGNs
2.1 Origin of AGN IR Emission: Thermal or Nonthermal?
The first near- and mid-IR measurements of AGNs, in 1968, showed a roughly power-law spectrum rising steeply towards 20 m (in the space) (Low & Kleinmann, 1968). In a prescient paper in 1969, Rees et al. (1969) demonstrated that this behavior was consistent with heating of circumnuclear dust through absorption of emission by a nuclear source luminous in the optical and ultraviolet. Nonetheless, a nonthermal explanation for the IR emission thrived alongside the thermal one for about a decade (e.g., Burbidge & Stein, 1970; Stein & Weedman, 1976; Neugebauer et al., 1979), bolstered by the roughly power-law IR spectral energy distributions. Rees et al. (1969) derived a minimum timescale for IR variations under their hypothesis that the emission was reradiation of nuclear energy by dust. The first measurements of IR variability (e.g., Penston et al., 1971) suggested timescales in violation of this limit, but these measurements were very early in the development of IR astronomy and were subject to significant uncertainties.
When more complete and detailed IR photometry became available, it was apparent that the power-law SEDs were illusory and nonthermal processes no longer needed to be invoked. The observations instead supported thermal models based on the emission from heated dust (Rieke, 1978). In 1981, Rieke & Lebofsky (1981) reported detailed observations of NGC 4151 that confirmed the expected behavior from thermal models, including the role of hot graphite dust in the near IR and the lack of variability at 10 m on yearly timescales. In 1987, Barvainis (1987) explained the 2 m SED bump in quasar spectra as arising from the thermal emission of graphite dust heated to its sublimation temperature. Two years later, Clavel et al. (1989) observed the expected phase lag between optical/UV variations and the IR response to them by heated dust at the expected light months distance from the central engine. Hunt et al. (1994) reported a search for fast timescale variations in the IR similar to those seen in the X-ray and concluded that there were none, i.e., the IR variations were consistent with reradiation by heated dust. The Infrared Astronomical Satellite (IRAS) established that many AGNs emit strongly in the far-IR, with SEDs similar to those of non-AGN star-forming galaxies (e.g., Soifer et al., 1987). Given this resemblance and the large IRAS beams (1.5′ 4.7′ at 60 m, 3′ 5′ at 100 m), this emission was attributed to the result of star formation in the AGN host galaxies.
These results were persuasive that dust heated by the central engine produces the majority of the near- and mid-IR emission for Seyfert galaxies, but that the far-IR probably was powered by young stars. However, the thermal/nonthermal ambiguity persisted for higher luminosity AGNs (e.g., Neugebauer et al., 1987; Kotilainen et al., 1992; Ulrich et al., 1997). Neugebauer & Matthews (1999) conducted variability monitoring of 25 quasars in the near-IR out to 10 m; variation at the latter wavelength would be a definitive demonstration that the emission was generated nonthermally. However, the signal to noise was inadequate for a definitive result. Thus, at the end of the twentieth century, the relative roles of the two classes of emission in various high luminosity AGN types — radio loud/quiet, for example — were not clear. Nonetheless, it was clear that all AGNs have a distinctive near- and mid-IR SED compared to stars or galaxies, which we discuss below.
2.2 Behavior of AGN IR Emission. I: General Features
As discussed throughout this review, the form of an AGN SED is a product of how it is viewed and how dust is distributed around it. Type-1 AGNs, by definition viewed pole-on and avoiding heavy dust clouds, are not heavily obscured and hence define the intrinsic SED of this class of source. The general category of obscured AGNs is traditionally termed as Type-2 and defined as not having extremely broad (FWHM km/s) permitted emission lines (e.g., H and H). This deficiency results from viewing the source from a perspective such that optically-thick matter hides the central engine and the BLR. Spectroscopically intermediate cases are designated as Type 1.2–1.9. However, the obscured category is much larger, including many objects so obscured at visible wavelengths that they are too faint to obtain optical spectra.
2.2.1 Intrinsic Near- and Mid-IR SEDs
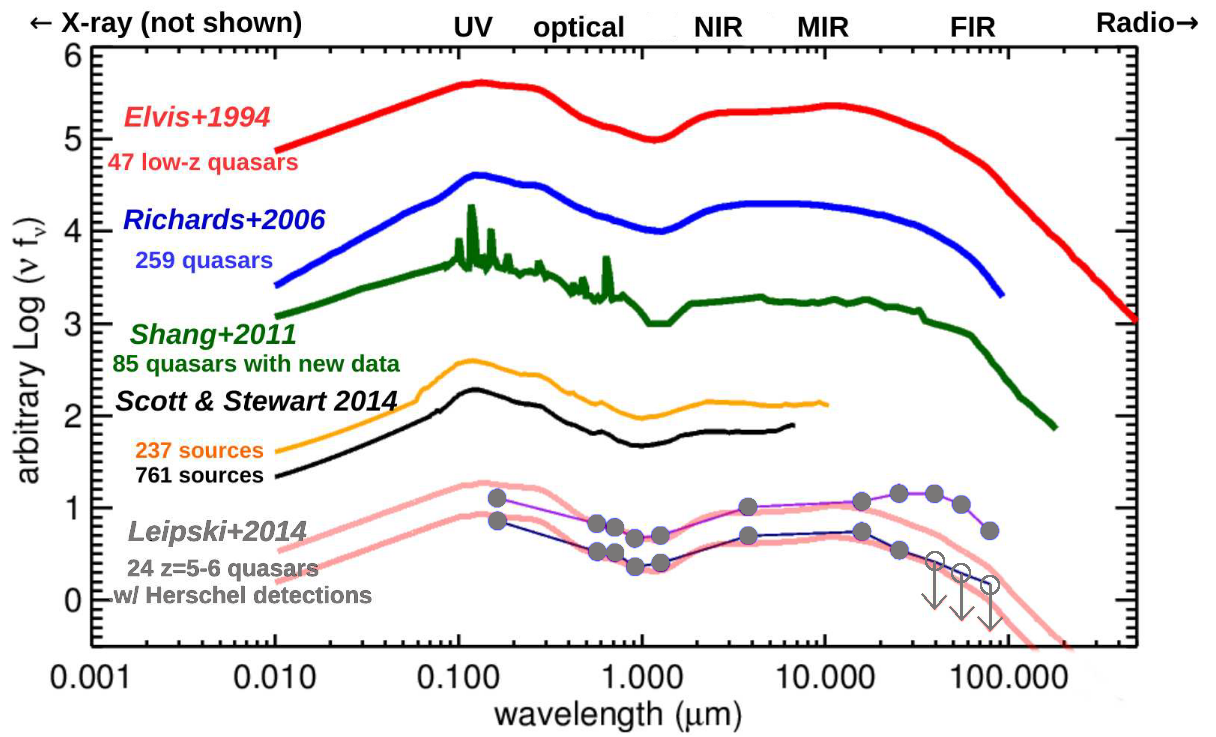
The near-IR SEDs of Type-1 AGNs were first determined reliably for high luminosity AGNs, i.e., quasars, where the AGN emission is so strong it overwhelms the stellar contribution in this spectral range (Neugebauer et al., 1979). Ward et al. (1987) used CCD images to determine and subtract the galaxy contribution to near IR photometry of lower luminosity AGNs, i.e., Seyfert galaxies. They showed that the variety of behavior was consistent with a single type of SED shape, modified by dust in the form of attenuation and IR emission. A classic paper led by Elvis (Elvis et al., 1994) proposed a “standard” SED extending from the IR into the X-ray. As shown in Figure 3, which also shows examples from Richards et al. (2006); Shang et al. (2011); Scott & Stewart (2014), subsequent determinations of the SED have been remarkably similar. This similarity extends to very high redshift, as shown by the quasar SED at 5–6.5 from Leipski et al. (2014). In the near-IR, the compendium of sub-arcsec measurements of Seyfert galaxies at and bands (3.78 m and 4.66 m respectively) by Isbell et al. (2021) separates the AGN from the galaxy contribution and allows testing this similarity for lower luminosity AGNs. Although the wavelength separation of the two bands is too small and the signal to noise too low for a determination for each galaxy, a weighted average of the ratio of the to band fluxes for 22 Type-1 to -1.9 AGNs (cutting two with anomalously large ratios) is 0.9 in , whereas the Elvis template predicts a ratio of 1.01, i.e., the agreement is excellent. In addition to these similar slopes, the rapid increase in the AGN near-SED near 2 m (see Figure 2) is also seen generally. It is associated with the inner edge of the dusty circumnuclear torus, where graphite dust is heated to its sublimation temperature (e.g., Barvainis, 1987; Mor & Netzer, 2012). That is, it appears that the shape of the AGN near-IR SEDs illustrated in Figure 3 is truly universal and insensitive to AGN luminosity or redshift. The SED shape at longer wavelengths presumably reflects the structure of this torus, although as foreshadowed by the initial attribution of nonthermal emission to apparently power-law SEDs (as discussed in Section 2.1), the interpretations can be highly degenerate.
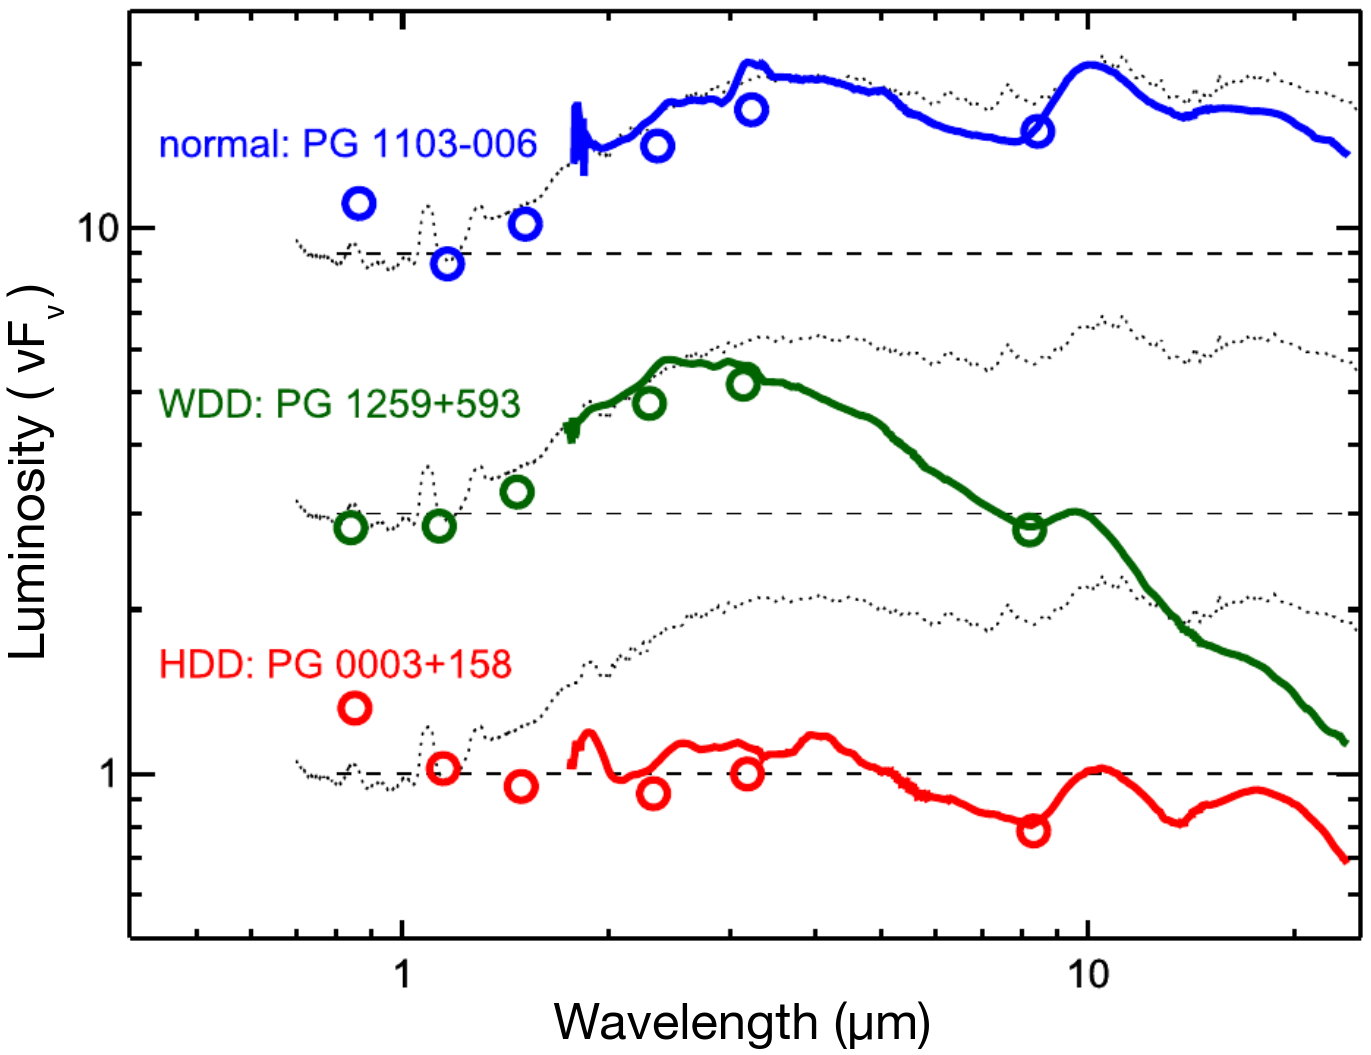
Nonetheless, there is some variation in this pattern for a modest number of AGNs. One notable example is the “dust-free” quasars reported firstly at z6 (Jiang et al., 2010), with SEDs that have a nearly flat continuum from the optical to the mid-IR. However, these objects are not exclusive to very high redshift (e.g., Hao et al., 2011). A comprehensive study of the AGN intrinsic IR SED variations (Lyu et al., 2017b) proposes categories of hot-dust-deficient (HDD: weak emission throughout the near- and mid-IR) and warm-dust-deficient (WDD: weak emission in the mid-IR but similar to those in Figure 3 in the near-IR), which contrast with normal quasars (e.g., those plotted in Figure 3). Figure 4 illustrates the SED characteristics of these types. Reverberation mapping shows that the near-IR output of even the most extreme HDD quasars is largely due to reradiation of the nuclear emission by hot dust (Lyu et al., 2019), i.e., their behavior reflects differences in torus structure, not a change in radiation mechanism. Lyu et al. (2017b) conclude that the HDD quasars constitute 15–20% of an IR unbiased sample. Later in this review, we will suggest that the “normal” category represents an average over all categories, with the HDD and WDD cases as subtypes within this average. There have also been suggestions of systematic intrinsic differences in the circumnuclear tori among Type-1 and Type-2 AGNs (thus their intrinsic SEDs are consequently different), but these claims must be assessed cautiously given the potential for selection biases (Elitzer, 2012).
2.2.2 Obscured SEDs
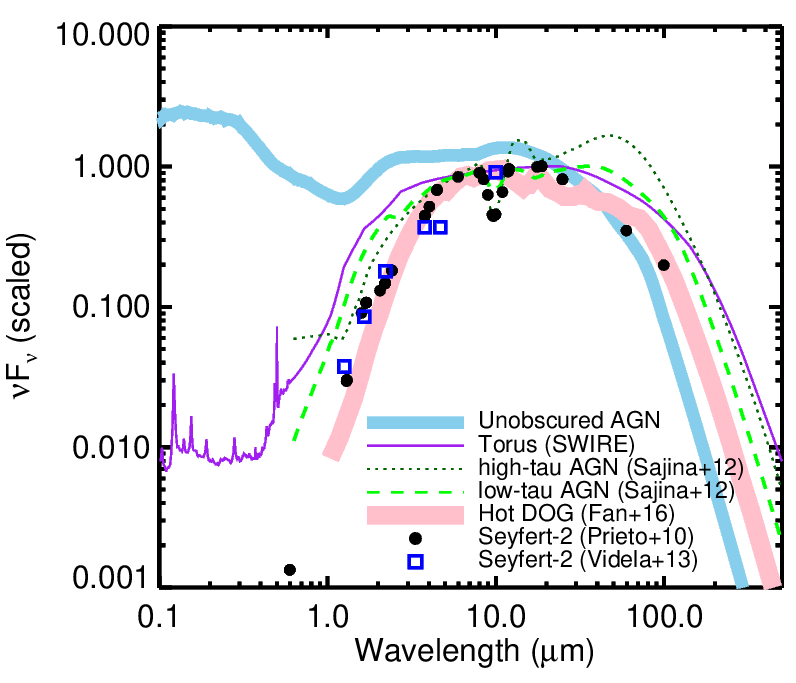
Another key aspect in understanding the AGN near- to mid-IR emission is the attenuation by dust. Although some low to moderate extinction occurs for many AGNs, strong attenuation is characteristic of Type-2 or obscured AGNs.222The classical unified model attributes the obscuration to the circumnuclear torus, but in reality there are many possibilities such as dust in the host galaxy, dusty clouds not in the torus but along the line of sight, or in extreme cases a dusty cocoon. In many cases, the galaxy stellar emission dominates the near-IR for Type-2 objects (e.g., Hickox et al., 2017), making the characterization of the AGN-heated SED behavior at these wavelengths very challenging. Two approaches are used. The first, useful at low-, is to isolate the nuclear emission from that of the host galaxy with high spatial resolution. For example, Prieto et al. (2010) present arcsec-resolution SEDs of some of the nearest Seyfert-2 galaxies, Circinus, NGC 1068, NGC 5506, NGC 7582, and build an average template for Seyfert-2 nuclei. Alonso-Herrero et al. (2001) and Videla et al. (2013) characterize the AGN SEDs at 1–15 m for a larger sample (dozens of objects) with the aid of imaging decomposition (as well as some SED decomposition). Alternatively, studies have focused on the very bright obscured quasar population at high- where the galaxy contamination is relatively weak. This approach includes, e.g., the torus template in the SWIRE library (Polletta et al., 2007), based on Spitzer measurements of a heavily obscured but very luminous AGN at z2.5 (Polletta et al., 2006), and average SEDs of IR bright AGNs (–) based on a sample of 12 obscured quasars with Spitzer and Herschel observations (Sajina et al., 2012).
In the left panel of Figure 5, we show the obscured AGN IR SEDs from these works (Polletta et al., 2006; Prieto et al., 2010; Sajina et al., 2012; Videla et al., 2013), including the average SED of the so-called hot dust-obscured galaxies, which are believed to host the most luminous obscured AGNs (Fan et al., 2016). Compared to the unobscured intrinsic AGN template, the SEDs of the obscured AGNs have weaker emission with the discrepancy increasing quickly toward shorter wavelengths. The differences are even noticeable in the mid-IR up to –m, as evidenced by the silicate absorption features at 10 and 18 m.

To reconcile the SED differences of unobscured and obscured AGNs, efforts have been made to generate an AGN attenuation curve. Such determinations have centered on the optical and ultraviolet (e.g., see a brief summary in Li 2007), not the near- to mid-IR that is critical to understand Type-2 objects (e.g., Zafar et al., 2015). In the IR, the SEDs of obscured AGNs are frequently represented by obscuring a Type-1 AGN template with a foreground screen of dust with some standard extinction curve [typically similar to the extinction curve for the Small Magellanic Clouds (SMC)]. However, the assumption that the extinction curves that work in the UV-optical can be extended into the IR in this simple way is not justified. The AGN accretion disk UV-optical emission and the dust IR emission come from a diverse range of physical scales and the cause of their obscuration can be quite different (for example, the accretion disk can be obscured by the dust along the polar direction while the AGN near-IR emission is obscured by relatively cold dust in the circumnuclear torus along the equatorial plane). In addition, the properties of dust grains surrounding AGNs are likely modified by the harsh environment, as pointed out by, e.g., Laor & Draine (1993) and Maiolino et al. (2001), and the resulting attenuation curve is therefore likely to be unique. Moreover, the source of obscuration can be also diverse, ranging from the central dusty torus to the host galaxy ISM (see reviews by Bianchi, Maiolino, & Risaliti, 2012; Hickox & Alexander, 2018). Given the typically unresolved observations of AGN structure, it is challenging to constrain the AGN extinction curve in this spectral range. Nevertheless, Lyu & Rieke (2022c) have used the AGN IR SED variations as a function of silicate absorption at m to generate a near- to mid-IR attenuation curve, based on the behavior from unobscured to heavily obscured AGNs. This attenuation curve can be applied to the intrinsic AGN templates (Type-1, Figure 3) to reproduce the SEDs of obscured AGNs reasonably well, as illustrated in the right panel of Figure 5.
2.2.3 Polar/Extended Dust
Spatially resolved imaging reaches resolutions of a few tens of pc for nearby AGNs, using 10-m class telescopes. Emission over 50 pc or more in the mid-IR (10 m) has been reported for many Seyfert nuclei, including Type-2 AGNs in NGC 1068 (Braatz et al., 1993; Cameron et al., 1993; Bock et al., 2000), Cygnus A (Radomski et al., 2002), Circinus (Packham et al., 2005; Reunanen et al., 2010), NGC 1386 (Reunanen et al., 2010), IC 5063 and MCG-3-34-64 (Hönig et al., 2010), and the Type-1.5 AGN in NGC 4151 (Radomski et al., 2003), and there is evidence that it is co-spatial with the AGN NLR clouds traced by the optical [O III] lines (e.g., Bock et al., 2000; Radomski et al., 2003). Isbell et al. (2021) and Asmus et al. (2016) present a comprehensive study of sub-arcsec-resolution images of AGNs in the near-IR (3–5 m) and mid-IR (10 m), reporting extended dust structures for many objects. Based on Point-Spread-Function (PSF) subtraction on the arcsec-resolution images of 7 AGNs, Fuller et al. (2019) found extended dust emission over 0.1–1 kpc at 37 m for three AGNs (Mrk 3, NGC 4151, and NGC 4388) that might also be attributed to the NLR.
Mid-IR interferometry at 8–13 m with spatial resolution of just a few pc for nearby AGNs often reveals a polar-elongated dust component, instead of equatorial torus-like structures. Together with the more extended polar emission, these components dominate or contribute significantly to the AGN mid-IR emission in both Type-2 (e.g., NGC 1068, Circinus galaxy, NGC 424; López-Gonzaga et al. (2016) and references therein) and Type-1 objects (NGC 3783 Hönig et al. (2013), NGC 5506 López-Gonzaga et al. (2016), ESO 323-G77 Leftley et al. (2018)). Although these studies are critical for understanding the mid-IR emission, they do not undermine the existence of the circumnuclear torus, since its outer zones may just be shadowed by the inner parts so little energy is deposited in them to be reradiated in the mid-IR.
How this polar dust emission behaves as a function of wavelength is poorly known due to the lack of multi-band spatially resolved observations. Efforts have been made to infer the behavior through SED analysis with some simple assumptions. Figure 6 shows the SED of NGC 3783, which has strong polar emission (Hönig et al., 2013). Compared with the intrinsic AGN templates discussed in Section 2.2.1, it has a strong peak in the 20–30 m range. A similar mid-IR spectral bump is seen in many other Seyfert nuclei (Deo et al., 2009). Lyu & Rieke (2018) attribute this feature to polar dust (e.g., a dusty wind or NLR) and propose a semi-empirical model to match the observations. They apply the obscuration of this extended dust component to the WDD AGN template, showing that this model reproduces the integrated SED and the observed mid-IR polar emission strength of NGC 3783 (Figure 6). The validity of such a simple model has been further corroborated by fitting three more prototypical Type-1 AGNs constrained by interferometry (ESO 323-77, NGC 4507) or by high-resolution imaging (NGC 4151), indicating similar properties for these objects. The fitted SED shape among these sources is very similar (Lyu & Rieke, 2018), with a peak near 25–30 m. Most of the SED variations seen among Seyfert-1 nuclei and quasars can be reconciled by adding a similar polar dust SED onto the AGN intrinsic templates (Lyu et al., 2017b) .

The polar emission is likely to be associated with the NLRs, as suggested by e.g., Netzer & Laor (1993). Although there can be exceptions where a strong NLR is not associated with polar IR emission (e.g., Alonso-Herrero et al., 2021), there are virtually no cases with confirmed polar emission that do not also have strong narrow emission lines. Taking advantage of this association, Asmus (2019) selected galaxies with strong fluxes in the high-excitation [O IV] 25.89 m line and found from interferometry that nearly all show polar emission in the 10 m range. This led to the suggestion that polar emission is ubiquitous and dominant in the mid-IR for nearly all AGNs. However, it is not clear if the [O IV] selection biased the result.
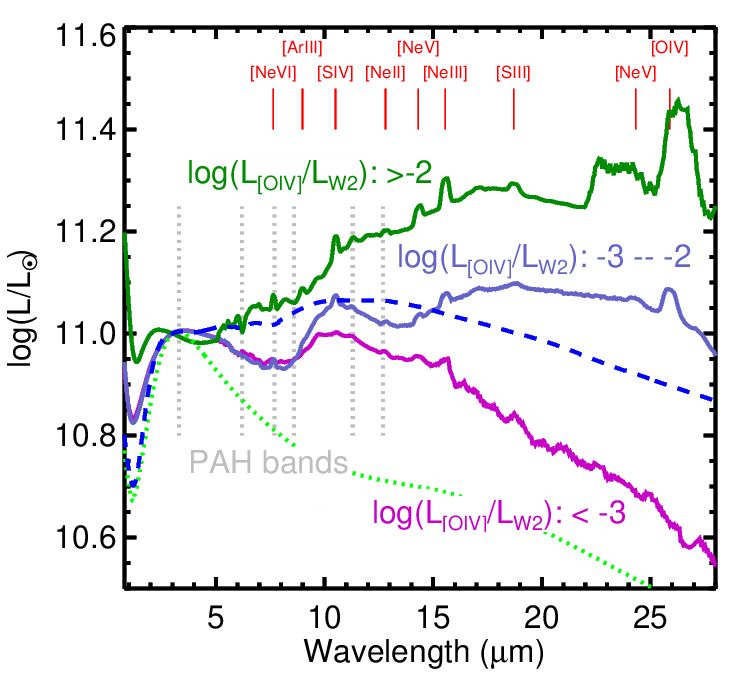
Lyu & Rieke (2022b) explore in a more general way if the AGN NLR strength influences the IR SED behavior. They trace the relative strength of the NLR by the flux ratio between the mid-IR [O IV] line and the WISE W2 (4.6 m) continuum (the latter traces the hot dust emission luminosity at a wavelength where the contamination by the stellar emission is minimized) and studied its relation to AGN IR colors such as WISE W2W3 and W2W4. The W3 band ( 12 m) probes the wavelength range where the existence of polar dust is well established and the W4 band (22 m) is near the suggested peak of the polar dust SED (Figure 6). They found a strong correlation toward larger color differences (more emission in W3 and W4) as the relative [O IV] line strength increases, i.e., a correlation between the NLR as traced by [O IV] and the strength of the emission by polar dust. Lyu & Rieke (2022b) derived average IR SED/spectral templates, as seen in Figure 7, which show the dramatic differences in the mid-IR SEDs as a function of [O IV] relative strength. The suggestion from this behavior is that the “normal” SED represents an average, including a range from the HDD case to cases with stronger mid-IR than even indicated by the normal template. This conclusion is consistent with how the normal template is derived — as an average over a sample of AGNs without selection for individual SED behavior.
In contrast to spatially-resolved observations of AGN polar dust that are limited to low- objects with preferred inclination angles, SED analysis helps us explore the incidence of polar dust among AGNs in general. For example, from a study of 64 nearby Seyfert-1 galaxies, Lyu & Rieke (2018) suggested that about 1/3 had SEDs consistent with strong emission by polar dust, 1/3 showed no evidence for such emission, and the remaining 1/3 were ambiguous. An indication of the role of polar dust at higher luminosities can be derived from Xu et al. (2015a), who used the Elvis/normal template to fit quasar SEDs and found in some cases that a warm dust component (with strong emission at rest-frame 3–60 m) had to be added. However, for 37% of their 99 sources, the luminosity in any fitted warm component was 5% of the total luminosity attributed to the AGN, in agreement, if a bit higher, with the fraction of the Seyfert galaxies with no evidence for polar dust. The relative strengths of AGN warm dust emission and NLR emission may both decrease towards higher AGN luminosity (e.g., Maiolino et al., 2007; Stern & Laor, 2012), indicating a gradual decrease of the significance of the polar dust component for brighter AGNs. This suggestion is aligned with the increasing fraction of WDD AGNs (Lyu et al., 2017b) and the lower UV-optical extinction seen in quasars compared to Seyfert nuclei (e.g. see Figure 6 in (Lyu & Rieke, 2018)).
2.2.4 Intrinsic Far-IR Emission
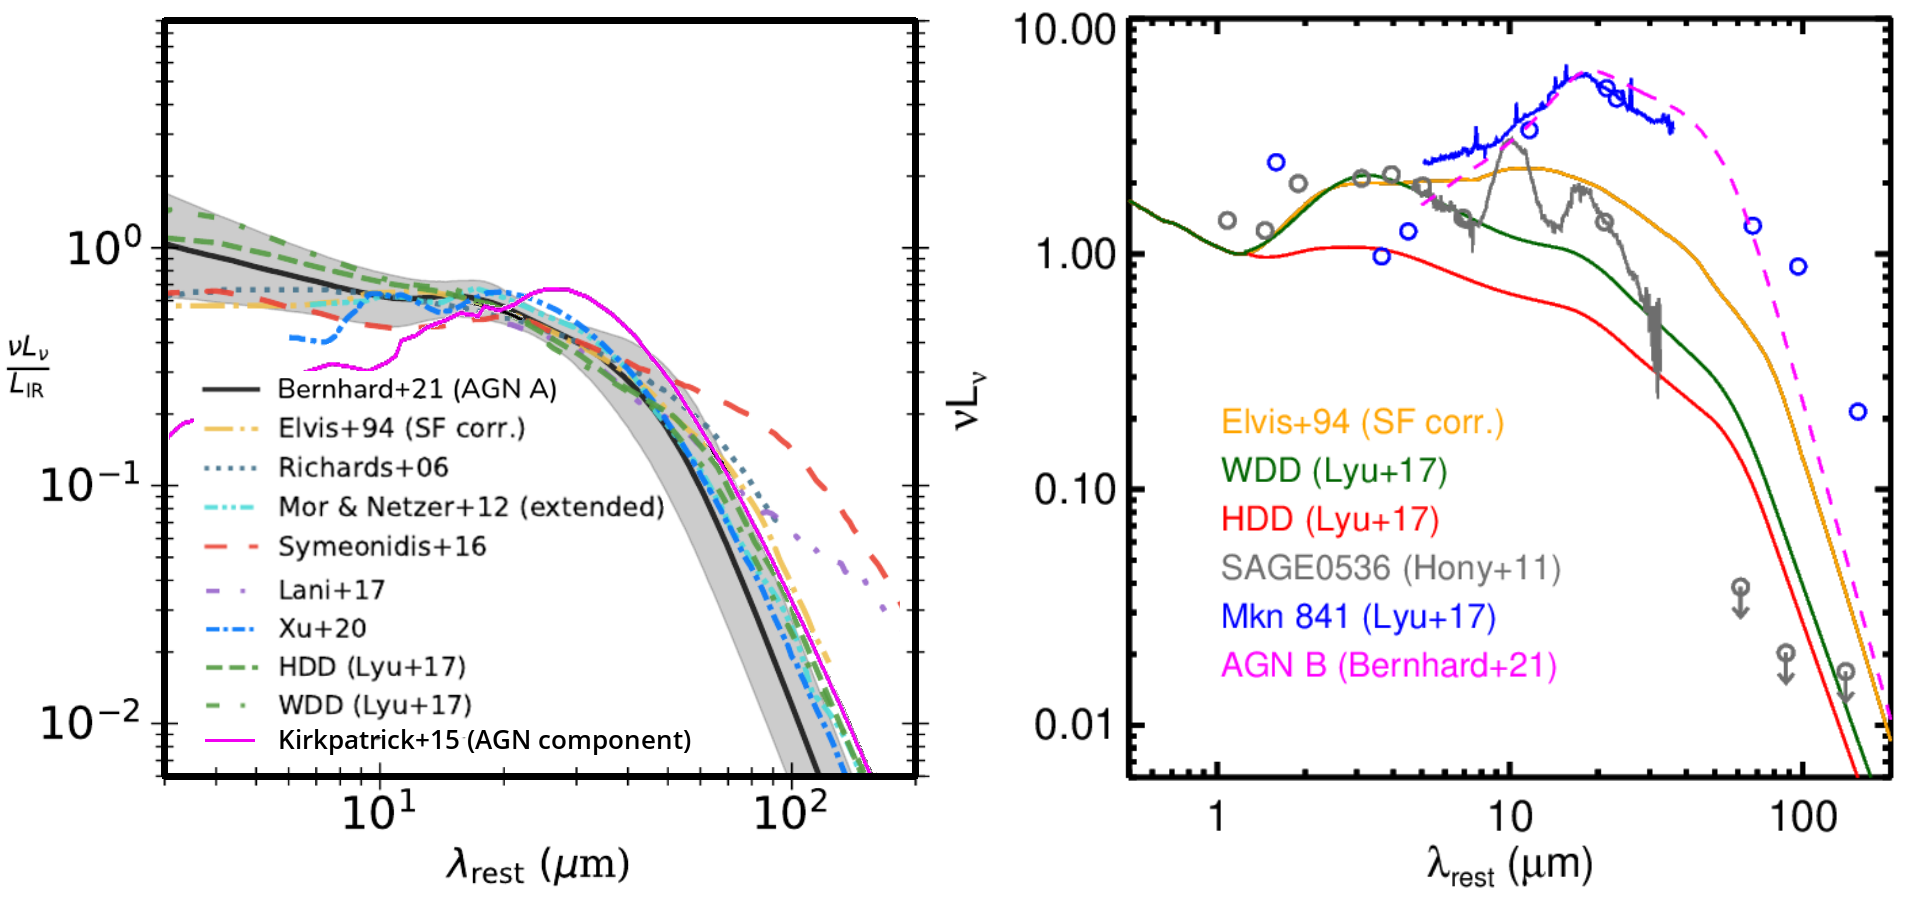
The intrinsic far-IR SEDs of AGNs333By “intrinsic” we refer to the product of direct energy input from the AGN, not necessarily to the integrated SED of the entire galaxy. provide clues to their surroundings on a large scale. However, determining the typical far-IR SED has been challenging. Beyond 30 m, there are often substantial contributions from emission by star-formation-heated dust in the host galaxies (e.g., Rodriguez Espinosa et al., 1987; Wilson, 1988; Rowan-Robinson, 1995), which can contaminate the AGN intrinsic SEDs. Removing this contamination is difficult given that the far-IR measurements are made with beam sizes that include both AGN and host. Three approaches have been used to meet this challenge: (1) high spatial resolution on nearby AGNs to isolate the AGN from its host galaxy; (2) use of the aromatic/PAH band(s) to estimate the SFR and its FIR contribution; and (3) use of the FIR SED itself as an estimate of the star formation contribution. Methods of the third type run a risk of being degenerate against the possibility that part of the FIR is powered by the AGN, or that some of the AGN contribution is attributed to star formation. For example, arguments that galaxies with large ratios of 30 m to shorter wavelength mid-IR fluxes are dominated by star formation (e.g., Sajina et al., 2012) did not anticipate the ability of AGN polar dust to produce similar behavior. Although some minor differences do exist, the majority of studies agree that the intrinsic IR SED of most AGNs turns over in the 20–40 m range and drops quickly into the far-IR (e.g., Miley et al., 1985; Netzer et al., 2007; Deo et al., 2009; Mullaney et al., 2011; Rosario et al., 2012; Mor & Netzer, 2012; Xu et al., 2015b; Kirkpatrick et al., 2015; Lyu & Rieke, 2017; Lani et al., 2017; Lopez-Rodriguez et al., 2018; Xu et al., 2020; Bernhard et al., 2021) (see left panel in Figure 8).444Despite this near-consensus, one notable exception is Symeonidis et al. (2016), who predicted much weaker host galaxy far-IR output from the 11.3 m PAH feature and thus stronger intrinsic far-IR emission from AGNs. Since its publication, this conclusion has been questioned by a number of independent groups based on studies of the same or a similar sample (e.g., Lyu & Rieke, 2017; Lani et al., 2017; Xu et al., 2020), .
In a few nearby cases, achieving sufficiently high physical resolution to isolate the AGN emission has been possible (Rieke & Low, 1975, 1975b; García-González et al., 2016; Lopez-Rodriguez et al., 2018; Fuller et al., 2019). With the exception of NGC 1068, however, even in these cases an unambiguous separation is not possible past 40 m. Frequently in the 30–40 m range there is extended emission that can originate either from the NLR/polar dust (and should be included in the FIR SED) or star formation (which should be excluded) (Fuller et al., 2019). The best-determined cases show SEDs that fall off beyond 30 m similarly to the quasar SEDs in Figure 3 — i.e., NGC 1068 (Lopez-Rodriguez et al., 2018; Rieke & Low, 1975), NGC 4151 (Rieke & Low, 1975b; Fuller et al., 2019). Similar behavior probably also holds for Mrk 3 and NGC 3227, but the combined central and polar SED of NGC 4388 rises at least to 40 m (Fuller et al., 2019). García-González et al. (2016) used small-aperture photometry on Herschel data to identify a few additional candidates to have significant AGN-powered output past 40 m; we will discuss their results further in Section 2.2.5. In general, even with high spatial resolution, it is desirable to have a spectrum to confirm that circumnuclear star formation is not contributing to the flux, since AGNs may be surrounded by compact star-forming regions (see Section 2.4.4).
Many studies of much larger samples have successfully used the 11.3 m aromatic band to estimate the SFR and thus the far-IR emission it is responsible for. Subtracting this component from the integrated SED of an AGN plus host galaxy can provide the AGN component. The basis for this approach is that the PAH band provides an independent measure of the star formation in the host galaxy that allows estimating its contribution to the far-IR output without resolving the nucleus separately. Typically, a large number of the resulting SF-subtracted SEDs are averaged to get the final AGN far-IR template(s) (e.g., Netzer et al., 2007; Xu et al., 2015b; Symeonidis et al., 2016; Lani et al., 2017; Lyu & Rieke, 2017).
We now elaborate on some cautions for this approach. The carriers of many aromatic features are destroyed around AGNs (e.g., Smith et al., 2007). However, the 11.3 m feature is relatively robust in this environment (Diamond-Stanic & Rieke, 2010; Esquej et al., 2014; Alonso-Herrero et al., 2014). There are arguments that it can be excited by the AGN (Jensen et al., 2017) (but at levels generally well below the integrated output of an entire star forming galaxy). Taking it as a valid measure of the SFR, there are still a number of practical issues in its use for that purpose. We illustrate some of them starting with the study of Palomar-Green (PG) quasars by Petric et al. (2015) that concluded that there was inadequate energy from star formation to power the far-IR from these objects.
The first issue is simply obtaining an accurate measure of the PAH feature flux. The profiles of the PAH features are very broad and blended, leading to two approaches to measure their strengths: (1) a few feature-free continuum points are fitted (typically with linear or spline fits) to determine a local pseudo-continuum above which the core of each individual feature is measured, assuming these features do not have any overlap (e.g. Brandl et al., 2006); or (2) a decomposition is employed that includes the full PAH features, cores plus wings, as exemplified by “PAHFIT” (Smith et al., 2007). Typically, the latter approach returns higher values by factors of 2 compared to the measurements based on the simple interpolated continua (Smith et al., 2007). Ignoring these systematics can undermine the results.555To estimate the far-IR SFR from PAH strength, Petric et al. (2015) put PAH strength measurements from Shi et al. (2007), which used the first method, into a formula from Diamond-Stanic & Rieke (2012), which is derived based on PAHFIT values. We can estimate the difference by comparing the equivalent widths (EWs) for the same objects of the 11.3 m feature from Shi et al. (2007) with those from Shi et al. (2014), since the latter used a procedure similar to PAHFIT. The average ratio of the two EW measurements of the 11.3 m PAH is 1.74. (also note, Petric et al. (2015) incorrectly cite Diamond-Stanic & Rieke (2010) rather than Diamond-Stanic & Rieke (2012).) Another concern is the conversion of IR luminosity to SFR; we take the version presented by Calzetti (2013), which is a factor of 1.36 lower than that used by Petric et al. (2015). After correcting the systematics behind the - and -SFR relations, we find that the SFR estimated from the total IR luminosity is only a factor of 1.26 greater than that through the 11.3 m feature for the sample of Petric et al. (2015). This level of discrepancy could arise because the PAH feature lies on the wings of the silicate absorption and hence may be modestly attenuated (e.g., Lani et al., 2017; Lyu & Rieke, 2017; Hernán-Caballero et al., 2020). That is, the estimates agree within errors and there is no need for a substantial additional energy source, i.e. the AGN, to power the far-IR in the PG sample. This result is confirmed by Xie et al. (2021), who use a method based on neon fine structure lines rather than the 11.3 m feature to determine SFRs for the PG quasar host galaxies and find that the far-IR emission of the PG quasars is generally powered by star formation, not by quasar energy. The above litany of issues based on use of the 11.3 m feature illustrates the care that must be employed to get accurate SFR values in this application.
The third approach to infer the AGN intrinsic far-IR SED assumes that the observed far-IR emission is largely powered by star formation and conducts SED fitting with dust emission templates of purely star forming galaxies plus very flexible models of AGN IR emission that are suggested to include realistic AGN SEDs. The AGN model that fits the most observations is then selected as the intrinsic AGN template. This approach can be very useful in the mid-IR where the contrast of AGN to star-forming contributions is high (as shown, for example, in the identification of AGNs as “warm” IRAS sources 666These objects are defined with spectral indices between 25 and 60 m of ), see the reference for details. (e.g., de Grijp et al., 1985)). However, it runs the risk of being a circular process for determining the AGN far-IR SED. Nonetheless, it returns results similar to those using the other two methods (e.g., Mullaney et al., 2011; Mor & Netzer, 2012; Xu et al., 2020; Bernhard et al., 2021), which supports the conclusion that the far-IR is indeed powered by star formation, as assumed.
ALMA observations in the submillimeter show a circumnuclear disk with an extent of 40 pc diameter around many AGNs (García-Burillo et al., 2021). From spatially resolved spectral indices in the submm-mm region, the emission mechanism appears to be highly inhomogeneous with contributions from thermal emission by dust, synchrotron emission from jets, and free-free emission (e.g., Alonso-Herrero et al., 2019; García-Burillo et al., 2019). It is unlikely, however, that this component contributes significantly in the mid-IR, since there is no trace of it in high resolution images such as those discussed at the beginning of Section 2.2.3. It is dramatically absent in very high resolution images of NGC 1068 (Gámez Rosas et al., 2022) and the Circinus Galaxy (Isbell et al., 2022).
2.2.5 Are There AGNs with Substantial Far-IR Output?
The possibility that some AGNs have substantial far-IR emission on top of the typical SEDs described above has been the subject of a number of theoretical models (e.g., Ballantyne et al., 2006; Roebuck et al., 2016; McKinney et al., 2021). Such models are challenged to include realistically the anisotropy of the AGN output and its orientation relative to the host galaxy. In addition, any AGN spectral templates utilized need to be free of contributions from star formation. The latter requirement not only calls for templates that remove star formation effects robustly, as discussed in Section 2.2.4, but can be made more difficult by the increased level of circumnuclear star formation possibly observed in AGNs (see Section 2.4.4 below). From an observational perspective, there is not a convincing case that AGNs power a substantial portion of the far-IR in the typical case of host galaxies with high levels of star formation (see Section 2.2.4). Here we discuss whether this situation might nonetheless apply to a subset of AGNs.
Indeed, some cases have been identified where the AGN is claimed to contribute significantly to the flux at 70 m (Mullaney et al., 2011; García-González et al., 2016). For (Mullaney et al., 2011), the cause is clearly (their figure 5) that the far-IR contribution from star formation in these galaxies is small and as a result the AGN dominates at 70 m by default; the AGN SED turns over as described in Section 2.2.4. For the second reference, we have used the “normal” template normalized at 24 m to estimate the AGN contribution at 70 m. The result is that the AGN may contribute 50% of the 70m flux in the central 1 kpc region for three of nine of their candidates for this behavior (NGC 3783, 4151, and 5347), 30% for IC 5063, and 15% for three more (NGC 4253, 7213, and 7479). If the AGN contribution at 70 and 100 m is removed, the ratio of fluxes at 70 and 100 m is slightly bluer in some cases than for main sequence star forming galaxies (based on Skibba et al., 2011; Dale et al., 2017), suggesting that IC 5063, NGC 4253, and NGC 7479 might have a detectable far-IR contribution from the AGN.
Candidates for this behavior might also appear in the sample of PG quasars analyzed by Lyu & Rieke (2017) in the form of a much weaker 11.3 m PAH band than predicted by the fits to the far-IR using star forming templates. Among the cases measured with good signal to noise, there are three candidates for this behavior that also have adequate far-IR data to determine SEDs. Two of these (Mkn 841 and PG 1543+489) have spectral drops in the 30–40 m range similar to the other AGNs; only PG 1149-110 has a significant far-IR excess above this behavior.
Netzer et al. (2014, 2016) have examined this issue for the most luminous known quasars out to z 4.8. They conclude that the far-IR emission in these cases is derived from star formation with, in general, contributions by the AGN being significantly less important. Symeonidis (2017) reanalyzed the sample of Netzer et al. (2016) and concluded that their far-IR emission was powered by the AGN; however, her conclusion depends on the validity of her quasar SED template as discussed in Section 2.2.4.
Thus, although strong far-IR emission may occasionally occur associated with AGN heating, it must be relatively rare, at least among unobscured sources. It remains an interesting possibility in heavily obscured cases, as discussed in Section 2.3.2 . An important corollary of the above discussion is that if the far-IR emission of an AGN exceeds the prediction of the normal template significantly, it is very likely to arise from dust heated by recently formed stars (using the far-IR as a SFR indicator should avoid the 5–30 m region where the AGN can be dominant). This means that treating the far-IR of an ensemble of galaxies as being predominantly due to star formation is valid although it may not be for individual cases, e.g. where the far-IR output is weak.
2.3 Behavior of AGN IR Emission II: Complications and Possible Outliers
So far, our discussion has focused on “typical” AGNs and has shown how their SED characteristics can be linked by relatively simple arguments, which is very useful in treating a large ensemble of AGNs on the assumption that “one template applies for all.” There is, however, a menagerie of possible exceptions that we discuss below, indicating that this can be a naive premise for some individual objects.
2.3.1 Compton-thick AGNs
Compton-thick AGNs owe their name to having sufficiently large line-of-sight (LOS) gas columns, cm-2, to be optically thick to soft X-rays. Applying a standard relation between gas column and dust extinction (Güver Özel, 2009), this corresponds to , i.e., the visible light from the nucleus will be totally lost and the IR SED will show very strong obscuration. These sources are nearly invisible from the near IR through the soft X-ray, but have received increased attention with NuSTAR hard X-ray observations. Much of their energy is absorbed and thermalized and emerges in the mid-IR; a promising spectral region to search for them is 4–5 m, where stellar photospheric emission from the host galaxy is low and PAH bands associated with star formation are absent (e.g., Severgnini et al., 2012). The greatly improved IR diagnostics possible with the James Webb Space Telescope (JWST) should revolutionize their study.
Alberts et al. (2020) suggest that Compton-thick AGNs can be divided, in roughly equal numbers, into two categories, both of which will have similar SED properties. One is cases where the circumnuclear torus is edge-on as we view it, blocking the view of the central engine and accretion disk with a very high gas and dust column, but potentially identified by NLRs appearing as ionization cones on either side of the central engines. They give as an example NGC 5728, studied in detail by Durré & Mould (2018). The second is truly deeply buried AGNs whose energy is thermalized in the surrounding gas and dust. An possible example is IRAS 08572+3915. This source has extremely deep silicate absorption, (Armus et al., 2007) but an otherwise featureless continuum, including a complete absence of emission lines and aromatic features. The depth of the silicate absorption requires by radiative transfer arguments that the luminosity source be buried in the emitting cloud, rather than the emission originating through illumination from the outside the cloud (Levenson et al., 2007; Sirocky et al., 2008; Nikutta et al., 2009), possibly indicative of a very deeply embedded AGN (discussion to be continued in the next section).
2.3.2 Embedded AGNs and FIR Emission
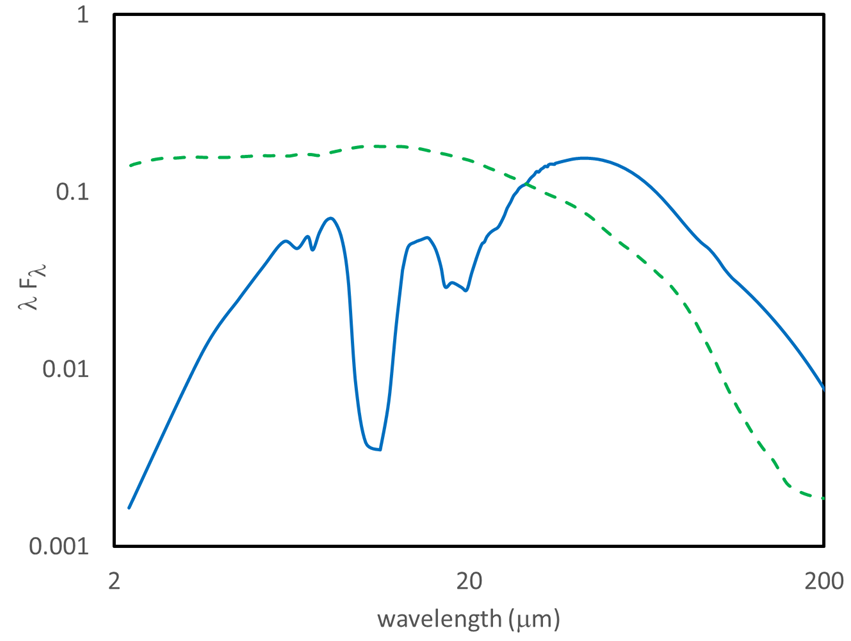
As an example of a case where the far-IR may be powered by an embedded AGN, along with the complexities in interpreting the observations, we continue the discussion of IRAS08572+3915, see Figure 9. Models along the line of the obscured standard AGN SEDs discussed in Section 2.2.2 fail to account for the prominent peak in the far-IR, i.e., this object does have substantial far-IR emission above the standard cases, consistent with models such as those of Roebuck et al. (2016). However, Spoon et al. (2007); Marshall et al. (2018) show that a very similar SED can result from extremely deeply embedded star formation. Nonetheless, Barcos-Muñoz et al. (2017) find that IRAS08572+3915 has an extremely compact radio nucleus and substantial IR emission above the predictions of the IR/radio relation. In addition, Iwasawa et al. (2011); Yamada et al. (2021) show it is a hard X-ray source. Thus, it appears that an embedded AGN heats the surrounding ISM to some extent, although a star powered component to the far-IR is still possible. The radio and X-ray measurements are critical to support this interpretation.
2.3.3 Hot Dust-Obscured Galaxies
Eisenhardt et al. (2012) discovered a class of extreme sources in WISE photometry, faint or undetected in W1 and W2 (3.4 and 4.6 m) but well detected in W3 and W4 (12 and 22 m). They were confirmed to be AGNs by Wu et al. (2012) and termed hot Dust Obscured Galaxies (hot DOGs). Subsequent work has found many more such sources (e.g., Tsai et al., 2015). A possibly related but less extreme category of extremely red quasars (ERQs) has been reported by Ross et al. (2015). Both types of source appear to favor relatively high redshifts, . Yan et al. (2019) confirm that these sources have huge gas columns ( cm-2), consistent with their having very hard but faint X-ray outputs (Vito et al., 2018; Zappacosta et al., 2018). They are also the sites of large, high-velocity outflows (e.g., Hamann et al., 2017; Finnerty et al., 2020).
Some modeling of the SEDs of hot DOGs suggests that their emission is dominated by their circumnuclear tori, which must have very large covering fractions (Fan et al., 2016). Alternatively, it has been suggested that their extreme properties result from their very strong outflows or winds (Lyu & Rieke, 2018; Calistro Rivera et al., 2021). The relatively large ratio of [O III]5007Å flux to H (Zakamska et al., 2016a; Yan et al., 2019; Jun et al., 2020) is consistent with the latter possibility. It would not be surprising if both hypotheses were relevant. Given their exotic nature, it would be foolhardy to be very specific about the circumnuclear environment of these objects until more constraints are available.
2.3.4 Suppressed Near IR?
The Type 1.5 AGN Mkn 841 (=PG 1501+106) is a thoroughly studied example with very weak PAH emission. Not only is this apparent from the Spitzer IRS spectrum, but Martínez-Paredes et al. (2019) searched for the 11.3 m PAH feature on sub-arcsec scales and compare with the large-beam measurements with IRS. The feature is not detected in either case and they place an upper limit of 0.2 M⊙ yr-1 for the SFR in a 400 pc region around the nucleus as well as for the entire galaxy. The SED must therefore represent purely the AGN; it is shown in the right panel of Figure 8.777Because the host galaxy has significant photospheric stellar emission (i.e., from a relatively old stellar population), we have used the sub-arcsec measurements at and from Isbell et al. (2021). The -band point is from Peletier et al. (1999); we have subtracted the galaxy as a = 4 Sérsic profile (sometimes known as a de Vaucouleurs profile); the fit for the inner 3′′ radius is excellent. Compared with normal AGNs, the SED of this object has strong mid-IR excess emission peaked around 20 m, but the SED still cuts off toward longer wavelengths as for the more typical cases. The large rise from the near IR to this peak might be expected for an obscured AGN but is very atypical for a Type-1.5 one.
This behavior might be caused by the AGN-heated extended/polar dust, but in that case Mkn 841 is an extreme example. The ratio of fluxes in [O III]5007Å to H of 0.62 (Winter et al., 2010) is relatively high but not extreme, suggesting that the necessary extreme form of polar emission is unlikely. Other geometries are possible, such as a very strong outflow approaching the situation Lyu & Rieke (2018) suggest for hot DOGs. In general, the Mkn 841 type of mid-IR SED is likely to be characteristic of any case where a substantial amount of dust near the nucleus is illuminated directly by the AGN accretion disk.
2.3.5 AGNs Deficient in 20–30 m Output
In the opposite direction, some AGN SEDs have much less far-IR emission than discussed in Sections 2.2.1–2.2.4. For example, both HDD and WDD quasars may have considerably lower far-IR emission compared to other quasars, as seen in the right panel of Figure 8. As noted by Lyu et al. (2017b), normalized by the accretion disk luminosity, the HDD AGN has only 40% of the dust emission at 1.25–1000 m of a “normal” (or average) AGN and this value for WDD AGN is about 70%. An even more extreme case has been reported by Hony et al. (2011) for the galaxy SAGE1CJ053634.78-722658.5 at . Although it has similar hot dust emission and mid-IR continuum as a WDD AGN, its far-IR emission drops very quickly (see the right panel of Figure 8).
2.3.6 AGN SEDs in the High-Redshift Universe
To first order, the SEDs of AGNs/quasars at very high redshift () are very similar to those at lower redshift, as shown in Figure 3. For the examples with Herschel detections from Leipski et al. (2014), the far-IR can very plausibly be associated with star formation in the host galaxies (Lyu et al., 2016), increasing the case for strong similarities. Similar near- to mid-IR SED variations such as WDD and HDD are also seen up to these redshifts (Lyu et al., 2017b), further supporting the generally similar behaviors.
It might be expected that very high redshift quasars would lie in low metallicity galaxies and possibly be dust-poor, with reduced circumnuclear tori. This was apparently confirmed with the discovery of HDD objects in early Spitzer data (Jiang et al., 2010), but the subsequent discovery of similar objects at much lower redshift has undermined this explanation. Another possibility is that heavily dust-embedded phases in quasar formation and evolution will be more common at high redshift, and in this regard the tendency of hot DOGS and extremely red quasars (ERQs) to be found at high redshift is intriguing (e.g., Fan et al., 2016), though efforts have been made to reconcile their SEDs with low- AGNs (Lyu & Rieke, 2018). JWST, with its enhanced mid-IR photometry capabilities used to conduct a more complete census of obscured AGNs, may provide new insights to this possibility.
2.3.7 Contamination from Non-thermal Processes
Besides dust emission, non-thermal processes such as synchrotron emission from a jet can also produce near- to far-IR emission, as seen directly in the spatially-resolved images of nearby radio-loud systems (e.g., McLeod & Rieke, 1994; Uchiyama et al., 2006). According to the classical unification model of radio-loud AGNs (Urry & Padovani, 1995), the synchrotron emission can be greatly enhanced by relativistic beaming if a powerful jet points toward the observer, so this component may dominate the IR emission in some AGNs.
Some authors have explored the significance of the non-thermal contribution in the AGN IR emission by spectral/SED decomposition (e.g., Shi et al., 2005; Cleary et al., 2007; Westhues et al., 2016). Notably, Cleary et al. (2007) decomposed the mid-IR spectra of radio systems (radio galaxies and radio-bright quasars) and claimed that the nonthermal contribution can account for 20-90% of the emission in some systems. However, as pointed out by Haas et al. (2008), such analyses can be problematic given the fitting degeneracies. A more practical solution, as demonstrated in e.g., (Shi et al., 2005; Westhues et al., 2016), is to extrapolate the synchrotron emission to the IR, using the constraints in the radio and millimeter bands that show power laws steepening toward higher frequency. The general conclusion is that the non-thermal emission is not dominant in the IR for most radio-loud AGN, but with some exceptions (e.g., Shi et al., 2005). In fact, the standard SED decomposition techniques (see Section 2.4) have been successfully applied to study the galaxy and AGN dust-related properties in many radio-bright AGNs (Podigachoski et al., 2015; Westhues et al., 2016) and the necessity for a non-thermal component is not obvious for the majority of cases. The generally insignificant contribution of non-thermal emission is also strongly supported by the very similar average IR SEDs of radio-quiet and radio-loud AGNs (e.g., Elvis et al., 1994; Richards et al., 2006; Shang et al., 2011).
Steep spectrum radio sources commonly do not show strong IR variability associated with a significant nonthermal source component in the IR (Lyu et al., 2019). However, the nonthermal IR contribution becomes very prominent for flat spectrum radio sources (e.g., Lyu et al., 2019) (see Section 3.4.1). Since the AGN IR SEDs are typically not observed at the same time, the variability of the jet IR emission can cause some non-physical SED features, which complicates the interpretations for some radio-bright objects.
2.4 IR SED Decomposition and Host Galaxy Properties
At some level, the IR SEDs of all AGNs are a combination of contributions by the nuclei and the host galaxies. To constrain their properties, SED fitting or decomposition is typically desired to separate these two components over a wide wavelength range.
2.4.1 Decomposition of Galaxy SEDs with AGN Contributions
Normally, there are three dominant components responsible for the integrated IR emission of an AGN and its host galaxy: (1) stellar photospheric emission; (2) mid- and far-IR emission by dust heated by young stars; and (3) dust heated by the AGN. The first of these components has a nearly uniform spectral behavior throughout the IR and can be included robustly in SED fitting (e.g., Willner et al., 1984; Mannucci et al., 2001; Brown et al., 2014). The second is also reasonably uniform in spectral behavior from 1 to 15 m where many of the challenges in SED fitting are focused (e.g., da Cunha et al., 2008; Lyu et al., 2022a), although there is more variety at longer wavelengths. This behavior is discussed further in Section 4.2.1. The mischief lies in the third item.
For the vast majority of AGNs, the existing data provide relatively few truly independent constraints for IR SED fitting (where there are multiple measurements, e.g., points in a spectrum, they are often linked by the underlying physics and the number of independent constraints is much less than the number of spectral points). Thus some AGN SED model or template is assumed. One popular approach is the adoption of dust radiative transfer models under the assumption that the obscuring structures can be described as smooth tori (Fritz et al., 2006), clumpy tori (Nenkova et al., 2008) or some hybrid version (Stalevski et al., 2012; Siebenmorgen et al., 2015). Such theoretical models have been used by many authors to fit AGN SEDs (e.g., Berta et al., 2013; Leja et al., 2018; Shangguan, Ho, & Xie, 2018; Brown et al., 2019; Yang et al., 2020, 2022; Azadi et al., 2020; Pouliasis et al., 2020). In general, models of this type have more free parameters than the limited number of independent constraints, thus parameter degeneracy has to be considered (e.g., with the aid of Bayesian fittings). In addition, these models may lack key features we now understand to be important but where general constraints are still not understood (e.g., emission by polar dust). Moreover, our ability to test the validity of the theoretical models is limited; in some sense, we have a classic chicken or egg problem because the predictions of the models often can only be verified through SED deconvolution. This problem is exacerbated when models representing some kind of average behavior are applied to individual sources without regard to their eccentricities. In fact, it has been shown that none of the popular models provide good SED fits to a significant subset of AGNs (González-Martín et al., 2019).888We may find that they have further difficulties with obscured AGNs when we have a more complete sample.
Another useful SED fitting approach is based on empirically-determined families of AGN SED templates. Tools have been developed to fit spectra (e.g., Nardini et al., 2008; Hernán-Caballero et al., 2015), photometry (e.g., Calistro Rivera et al., 2016; Lyu et al., 2022a), or a combination of both (e.g., Mullaney et al., 2011; Bernhard et al., 2021), which have also been used over wide ranges of AGN luminosity and redshift (e.g., Mullaney et al., 2012; Xu et al., 2015a; Lyu et al., 2016, 2017b; Ichikawa et al., 2019). Ciesla et al. (2015) have used a hybrid approach based on theoretical SED models but down-selected to the minimum needed to fit the range of observational parameters. The success of these approaches relies on the challenging process of empirical characterization of the SEDs, including the possible variations, of both the pure AGN component and galaxy component. Although well-conceived approaches of this type must by definition represent the average observed behavior reasonably well, they typically do not give insight to the underlying causes of that behavior. In addition, if the number of free parameters is restricted, the empirical templates can be accurate in an average sense but not cover the range of behavior well.
Given the degeneracies and other limitations of SED fitting, it is mainly useful for deriving first order properties, such as: (1) AGN SED shape and luminosity (already discussed); (2) host galaxy properties directly reflected by the luminosity, such as star formation rates and stellar masses (discussed below); and (3) identifying candidates for obscured AGNs (to be discussed in Section 4.2).
2.4.2 Constraining the Stellar Masses
Very high resolution imaging can sometimes be used to subtract the AGN emission and measure the flux from the host galaxy, leading to estimates of parameters such as the stellar mass. However, this procedure is often compromised by stray light from the bright AGN component of the image.
An accurate knowledge of the AGN SED allows reasonably good measurements of host galaxy properties through SED decomposition. In the near-IR, the galaxy stellar continuum is almost identical for different galaxy types, with the SED peaking around 1 m and dropping quickly following a Rayleigh-Jeans tail towards the mid-IR. In contrast, the AGN SED presents a dip around 1.3 m with hot dust emission peaking at 2–4 m. With good wavelength coverage of the integrated galaxy emission, we can separate these two components accordingly and retrieve the galaxy light fraction at each band. Ciesla et al. (2015) have simulated the ability of such SED fitting to return accurate estimates of the stellar contribution of the host galaxies and converted the results to mass using star formation history models. Their study focuses on galaxies with 10 log(M∗) 11 and considers AGN templates contributing a range of the total IR luminosity from 0 to 70%. The results are very promising for cases with good photometric coverage, as shown in Figure 10. As expected, the derived host galaxy properties are very well constrained for type-2 AGNs, since the optical and near-IR emission is dominated by the stars. However, reasonably accurate values are also returned for type-1 and intermediate cases. For a practical application, Lyu et al. (2017b) show that a simple SED decomposition with empirical templates can yield results consistent with dedicated AGN-galaxy image decompositions for the PG quasar sample. With an assumed stellar mass-to-light ratio, the AGN host galaxy stellar masses can be reasonably determined. This approach is particularly useful for statistical studies where high-resolution image analysis is unavailable (e.g., Xu et al., 2015a).

2.4.3 Host IR SED Properties
IR SED decomposition is widely used to measure the far-IR luminosity as an estimate of the host galaxy star formation, under the assumption that the IR SEDs of these galaxies are the same as those of normal star-forming galaxies (SFGs). Empirical SFG templates are useful, since more theoretically-based ones contain more free parameters that may result in over-fitting. Based on AGN and galaxy empirical templates that are well-calibrated against statistical observations, standard templates provide a satisfactory fit to the far-IR emission of quasar host galaxies at ((e.g., Netzer et al., 2007; Xu et al., 2015b; Lyu & Rieke, 2017; Bernhard et al., 2021); see also Section 2.2.4). However, a model with local SFG templates does not work well for quasar host galaxies at (see Figure 11). Nevertheless, after subtracting the AGN contribution, the far-IR SEDs of these very high- quasars resemble those of very luminous purely star forming galaxies at similar redshifts (Lyu et al., 2016; De Rossi et al., 2018), still consistent with the argument that their far-IR emission is largely a result of star formation in the hosts.

2.4.4 Star Formation
SFRs estimated from far-IR luminosities have been used to conclude that quasar host galaxies tend to lie on or near to the star-forming galaxy main sequence (Santini et al., 2012; Mullaney et al., 2012; Rosario et al., 2013; Berta et al., 2013; Xu et al., 2015b; Zhang et al., 2016; Dai et al., 2018; Li et al., 2020; Hatcher et al., 2021). However, Xie et al. (2021) recently concluded that AGN hosts predominantly lie above the main sequence. The difference lies almost entirely in the assumed width of the main sequence. For example, Xie et al. (2021) take it to be 0.2 dex wide, while Xu et al. (2015b) take it to be +0.5 dex and 1 dex, and Zhang et al. (2016) take it to be 0.6 dex wide. If we apply the Xu et al. (2015b) limits to the =0.2 main sequence in Xie et al. (2021), we find that only 14/86 of the Xie et al. (2021) sample lie above it. That is, there is general agreement that the quasar host galaxies overall have main-sequence levels of star formation, although the sample includes a significant minority of starbursts and may lie a bit high relative to the central main sequence. Even this small bias may be the result of selection effects; the host galaxies of X-ray selected AGNs align more closely with the main sequence with greater scatter around it (Ji et al., 2022). Also, there is some evidence that AGN hosts lie below the main sequence at low redshifts (Barrows et al., 2021).
In Section 4.3 we mention a sample of AGNs selected via IRAC variability (Polimera et al., 2018). It was found that the AGN hosts have similar morphologies to those of a control sample, with perhaps a modest bias toward disturbed or asymmetric galaxies. A similar result was found by Kocevski et al. (2012) using a different AGN selection method.999Kocevski et al. (2015) suggest that abnormalities are more frequent for hosts of Compton-thick AGNs. That is, AGN hosts do not seem preferentially to be interacting/merging systems (Shah et al., 2020). These results, as with the finding that hosts are largely on the star forming main sequence, emphasizes the normality of AGN host galaxies.
The one possible exception to this rather boring normality is that a number of groups have found evidence that the star formation rate in the immediate vicinity of the AGN is often elevated (Diamond-Stanic & Rieke, 2012; Esquej et al., 2014; Zhuang & Ho, 2020; Dahmer-Hahn et al., 2022).
There have been many studies that find that the black hole accretion rate scales with the SFR (e.g., Dai et al., 2018). However, Xu et al. (2015b) show that this probably arises because galaxies on the main sequence have a trend of SFR with stellar mass, and the Magorrian relation between the bulge stellar mass and the SMBH mass shows the black hole mass also to grow with stellar mass. Given similar distributions of fractional Eddington luminosities, the range of SMBH masses will be reflected in a similar range of luminosities. In fact, Xu et al. (2015b) show that the slightly off-1:1 correlation of SFR with stellar mass indicated by the slope of the main sequence is reflected in a similar relation for the SFR vs. AGN luminosity. Dai et al. (2018) confirm the slope of SFR vs. AGN luminosity that leads to this conclusion. This is evidence that the apparent linking of the SFR and SMBH luminosity may arise not through a direct causal connection, but because both characteristics share a dependence on stellar mass (Xu et al., 2015b; Suh et al., 2019).
2.4.5 Do AGN Types Correlate with Different SFRs in Host Galaxies?
It has been suggested that the star formation in Type-2 Seyfert host galaxies is systematically higher than in Type-1 hosts. Maiolino et al. (1995) found a significant enhancement in the ratio of compact to extended emission for Type-2 hosts by comparing small-aperture groundbased and IRAS measurements at 10.6 and 12 m respectively, suggesting that the Type-2 hosts have higher SFRs. Others have found supporting evidence (e.g., Buchanan et al., 2006; Mélendez et al., 2008). However, Diamond-Stanic & Rieke (2012) used Spitzer imaging data and found no statistically significant differences between AGN types in the distributions of nuclear SFRs, extended SFRs, or total SFRs. Similarly, Masoura et al. (2021) studied a X-ray selected sample and also found no significant difference in SFRs with nuclear column101010However, the majority of their SFR estimates were based on WISE photometry, extending only to 22 m, which is worrisome because of the potential for AGN contamination. Observational biases might explain the apparent differences in results, such as enhanced star formation boosting the brightness of the Type-2 nuclei at 12 m and producing an IR sample biased toward this behavior; anisotropy in the IR emission affecting the 10 m outputs of Type 2 AGNs (e.g., Nikutta et al., 2021a); or different measures of the SFRs. Zou et al. (2019) provide an interesting summary of the contradictions and uncertainties revolving around the issue of systematic type-related differences in AGN host galaxies.
This issue of differences in SFRs has been examined with a large sample by Zhuang & Ho (2020). They have developed a method using the [O II] and [O III] optical lines to determine the SFRs. They find a significant tendency toward enhanced SFR in Type-2 hosts. After examining possible selection and other biases, they conclude that their analysis “suggest[s] that, on average, the host galaxies of type-2 AGNs have intrinsically higher SFRs than those of Type-1 AGNs.” Kalfountzou (2015) used the 250 m luminosity as an indicator of the SFR and also found a tendency for type-2 hosts to have higher SFR rates than type-1 hosts, with a formal probability of 0.08 for the two to be drawn from the same distribution for her high signal to noise (at 250 m) sample (but a probability of 0.23 for a lower signal to noise sample). Zou et al. (2019) have conducted another in-depth examination of this possibility, using far-IR luminosity as an indicator of SFRs. They find a tendency at the 1.4 level for the hosts of Type-2 AGNs to have higher SFRs than Type-1 ones. They also show that the host galaxies of type-2 nuclei tend to be slightly more massive. These results are all tantalizing but do not establish an effect at very high confidence. The mass difference along with the tendency for main-sequence levels of star formation suggests that any difference might just relate to small systematic differences in host masses.
To test this latter possibility, we will look for a type-dependent difference in specific SFR (sSFR), i.e. SFR relative to the main sequence. To do so, we use the sample of galaxies with high resolution -band photometry from Isbell et al. (2021) (excluding radio bright objects, LINERs, galaxies classified as star-forming, Arp 220, and the Circinus galaxy). Given the close correlation between galaxy stellar mass and the luminosity in the 3.6 m region (e.g., Wen et al., 2013; Meidt et al., 2014), we use the integrated flux at this wavelength as a proxy for the stellar mass. To derive this flux, we subtract the sub-arcsec resolution and photometry reported by Isbell et al. (2021) from integrated -band fluxes for a galaxy (from the NASA Extragalactic Database (NED)), giving the -band flux for the bulk of its stellar population.111111We test whether the L-band flux captures the integrated output by comparing with the disk flux in the integrated band from 2MASS, where we subtract the nuclear emission at according to the subarcsec brightess and the normal template for Type-1 and 40% of this value for Type-2 (the selection of values between 0 and 100% had only a 5% effect on the average and median values). We correct to the expected to flux ratio if there is a deficiency. Next, the luminosity at 60–100 m correlates closely to the total IR luminosity (e.g., Rieke et al., 2009) and we can use it as a proxy for the star formation rate. Thus, the ratio of the 70 and 3.5 m luminosities, or for galaxies at low redshift, of the fluxes, becomes a proxy for sSFR. In this sample, the distribution of this ratio is offset by 0.3 dex higher for Type-2 hosts than for Type-1 ones; the Kolmogorov-Smirnov probability that these two distributions are drawn from the same population is 12%. This result and those by Zou et al. (2019); Zhuang & Ho (2020) are of modest statistical significance, but their suggestion of an effect is worthy of further investigation.
3 Probing AGN Dusty Structure with IR Reverberation Mapping and Variability
Initially it was hypothesized that AGN IR emission might be generated nonthermally (Section 2.1). The first observations of IR variability in AGNs addressed this issue, testing for variations sufficiently rapid to require a nonthermal origin. The demonstration of phase lags in the IR relative to variations in the blue and UV, as predicted for a thermal origin, largely settled this issue (e.g., Clavel et al., 1989; Sitko et al., 1993). Attention then turned to using the observed time delays between nuclear variations and changes in the IR as circumnuclear dust absorbed and reradiated the nuclear emission — “reverberation mapping” — to learn about the structures of the material surrounding the AGN central engines.
3.1 Challenges
Reverberation mapping is applied extensively in the X-ray, ultraviolet, optical, and for both continuum and emission lines, where it has revealed aspects of the structure of the regions emitting in these spectral ranges (see a recent review by Cackett et al. (2021)). From this experience, achieving unambiguous results requires a measurement sequence that samples the variations at the Nyquist rate, with this sampling extending over as a minimum three times the longest reverberation lag, although modest gaps in longer datasets should not strongly affect the results (e.g., Horne et al., 2004). With limited datasets, even longer monitoring is needed, e.g. 10 times the longest period (Kozlowski, 2017). This degree of sampling is relatively easy to achieve in the ultraviolet or optical, where the relevant lag timescales are days or at most weeks. However, the inner edges of the circumnuclear tori in Seyfert galaxies are sufficiently distant from the central engines that minimum lags of months are typical, and the lags for quasar luminosities can be years. This lag length makes it challenging in conventional ground-based campaigns to observe at high cadence over three or more cycles. Shorter sequences, or less intensive sampling, can be useful only if the free parameters in the lag determination are severely limited.
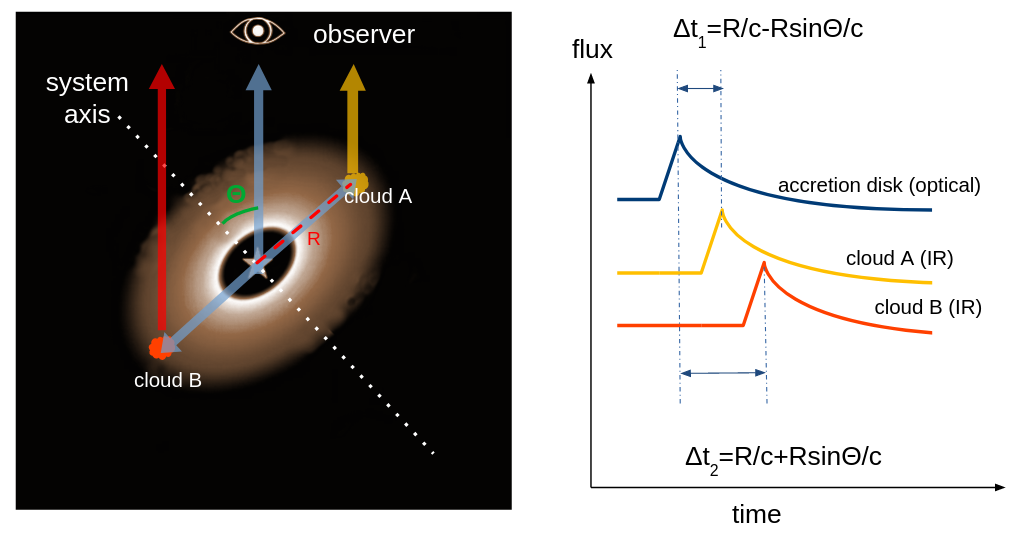
A second issue is general to reverberation mapping. The extent of the emitting region along the line of sight smooths the lag and blurs features that might be indicative of structures, as illustrated in Figure 12. An example might be a circumnuclear torus that lies with its plane along the line of sight. The part of the torus closest to the observer would then show virtually no lag, while that furthest from the observer would show a lag indicative of twice the radius of the torus. Other parts of the torus would fill in between these extremes. That is, the lag itself would be appropriate for the size of the torus but the smoothing could make it impossible to deduce much more about the structure. One way to mitigate this issue is to focus on Type-1 AGN, where one expects the circumnuclear torus to lie closer to the plane of the sky than in Type-2 objects.
3.2 Lag Measurement Campaigns and Basic Results
A pioneering and very extensive groundbased near IR AGN monitoring effort was conducted at the Crimean Observatory of the Sternberg Astronomical Institute (SAI) from 1994 through 2018 (Lyutyi et al., 1998; Shenavrin et al., 2011; Taranova & Shenavrin, 2013; Oknyansky et al., 2018), with some monitoring extending back to 1985 (Lyutyi et al., 1998). These measurements used an aperture photometer with an InSb detector, allowing not only the (1.25 m), (1.65 m), and (2.2 m) bands to be covered, but also the band (3.6 m). To mitigate the influence of atmospheric seeing on aperture observations (Peterson et al, 1995), the measurements were made with a large aperture (12′′), requiring an accurate correction for the galaxy emission within this aperture. Because of the long extent of the measurement series, including phases where the AGN was very faint, accurate corrections were possible (e.g., Taranova & Shenavrin, 2013).
The Multicolor Active Galactic Nuclei Monitoring (MAGNUM) project (Yoshii et al., 2003) used a photometer specifically designed for reverberation-type observations. It fed the visible light to a CCD and the IR to an InSb detector array, allowing simultaneous observations from the -band (0.36 m) through the -band (3.6 m). It was used to monitor a number of Type-1 Seyfert galaxies and quasars in the -,-, -, -, -, and - bands (e.g., Minezaki et al., 2004; Suganuma et al., 2006) from 2001 through 2007, with the results summarized in e.g., Koshida et al. (2014) and Minezaki et al. (2019). In principle, the use of an IR array should improve the robustness against seeing fluctuations and allow subtraction of the galaxy contribution by profile fitting (but for the latter, Lyu & Rieke (2021) find that the galaxy is under-subtracted, possibly due to a strong central concentration of the stellar population).
In addition to these two large-scale reverberation mapping campaigns, there are a large number of focused studies of individual, or a few, sources utilizing near-IR photometry out to the -band, including e.g., 3C273 (Sobrino Figaredo et al., 2020), NGC 5548 (Landt et al., 2019), MCG 6-30-15, (Lira et al., 2015), NGC 3783 and MR 2251-178 (Lira et al., 2011), PGC 50427, (Pozo Nũnez et al., 2015), 3C120 (Ramolla et al., 2018), H0507+164 (Mandal et al., 2018), and Z229-15 (Mandal et al., 2021). -band measurements are well-suited to determining the behavior of the hottest dust ( 1500 K) at low redshift, but to extend the study to higher redshifts and/or lower-temperature dust, it is essential to monitor at longer wavelengths. Of the ground-based observations discussed so far, only the Sternberg Astronomical Institute campaign goes to -band at 3.6 m. With Spitzer/IRAC observations of Seyfert-1 nucleus in NGC 6418, Vazquez et al. (2015) report dust time lags at 3.6 and 4.5 m and find they are roughly consistent with the K-band reverberation results.
The WISE/NEOWISE mission, which completes an all-sky survey roughly every 6 months in two photometric bands at 3.4 and 4.6 m, offers the opportunity to conduct statistical AGN near-IR reverberation mapping with the combination of optical time-domain surveys on the ground, as firstly demonstrated by Lyu et al. (2019). The low cadence of the IR light curves requires that reverberation mapping using these data must be focused on high luminosity objects, where it is expected that the circumnuclear torus is large and hence the reverberation timescales are long. Some representative studies using these data include: e.g., PG 1302-102 (Jun et al., 2015); 87 PG quasars (Lyu et al., 2019); 690 quasars in SDSS Stripe 82 (Yang et al., 2020). The latter two studies use different approaches to smooth and compare the visible and IR light curves, but they obtain very consistent results (Yang et al., 2020). Lyu et al. (2022a) studied the IR reverberation properties of 13 changing-look AGNs and found they follow a similar relation defined by the PG quasars (Lyu et al., 2019). Finally, Noda et al. (2020) use X-ray and NEOWISE data on the Type-2 AGN NGC 2110, finding a lag consistent with those for Type-1 objects.
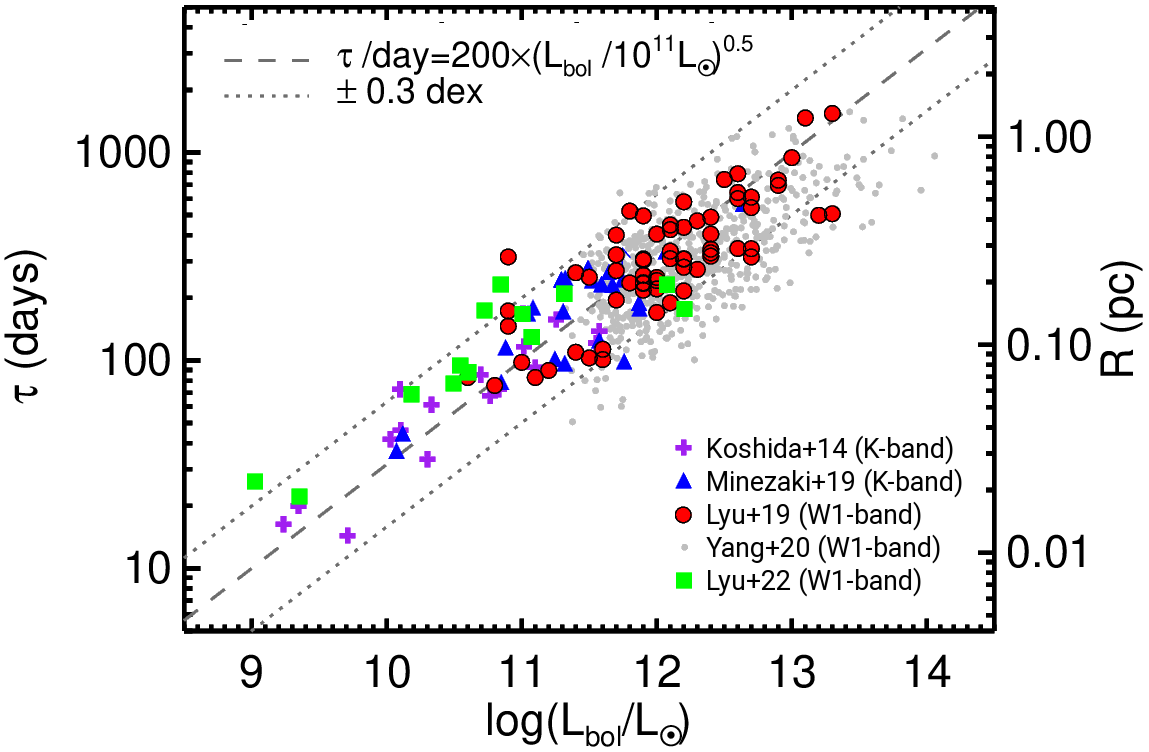
All of these studies are consistent with the hottest dust, i.e., the innermost region of the dusty circumnuclear torus, lying near the graphite sublimation distance from the accretion disk. This behavior is illustrated in Figure 13. Despite the different data and analysis used by different authors, the general trend between the near-IR dust time lag (i.e., the hot dust size) and AGN bolometric luminosity extends over 5 orders of magnitude of AGN luminosity and it follows the expected relation as days with a relatively low dispersion (0.2–0.3 dex). This conclusion is now strongly supported by interferometric data at 2 m for many nearby AGNs that find structures — in some cases even resolved as rings — at the expected radius (Figure 13, right axis) with some additional structures in a few cases (e.g., Gravity Collaboration, 2020a, b, 2021).
Various other constraints have been reported in some studies. We will evaluate them after discussing the IR reverberation behavior of NGC 4151, which has by far the most extensive set of measurements (next section). It provides a prototype that can be helpful in evaluating the measurements of other AGNs.
3.3 NGC 4151 as a Prototype
NGC 4151 is unique in the extensive IR monitoring available, over 30–40 years, see Figure 14. Nonetheless, the full potential has not been realized because each group monitoring the behavior has tended to analyze its data alone without merging into a comprehensive dataset. Lyu & Rieke (2021) integrated all the data and analyzed the AGN behavior from 1 through 34 m.
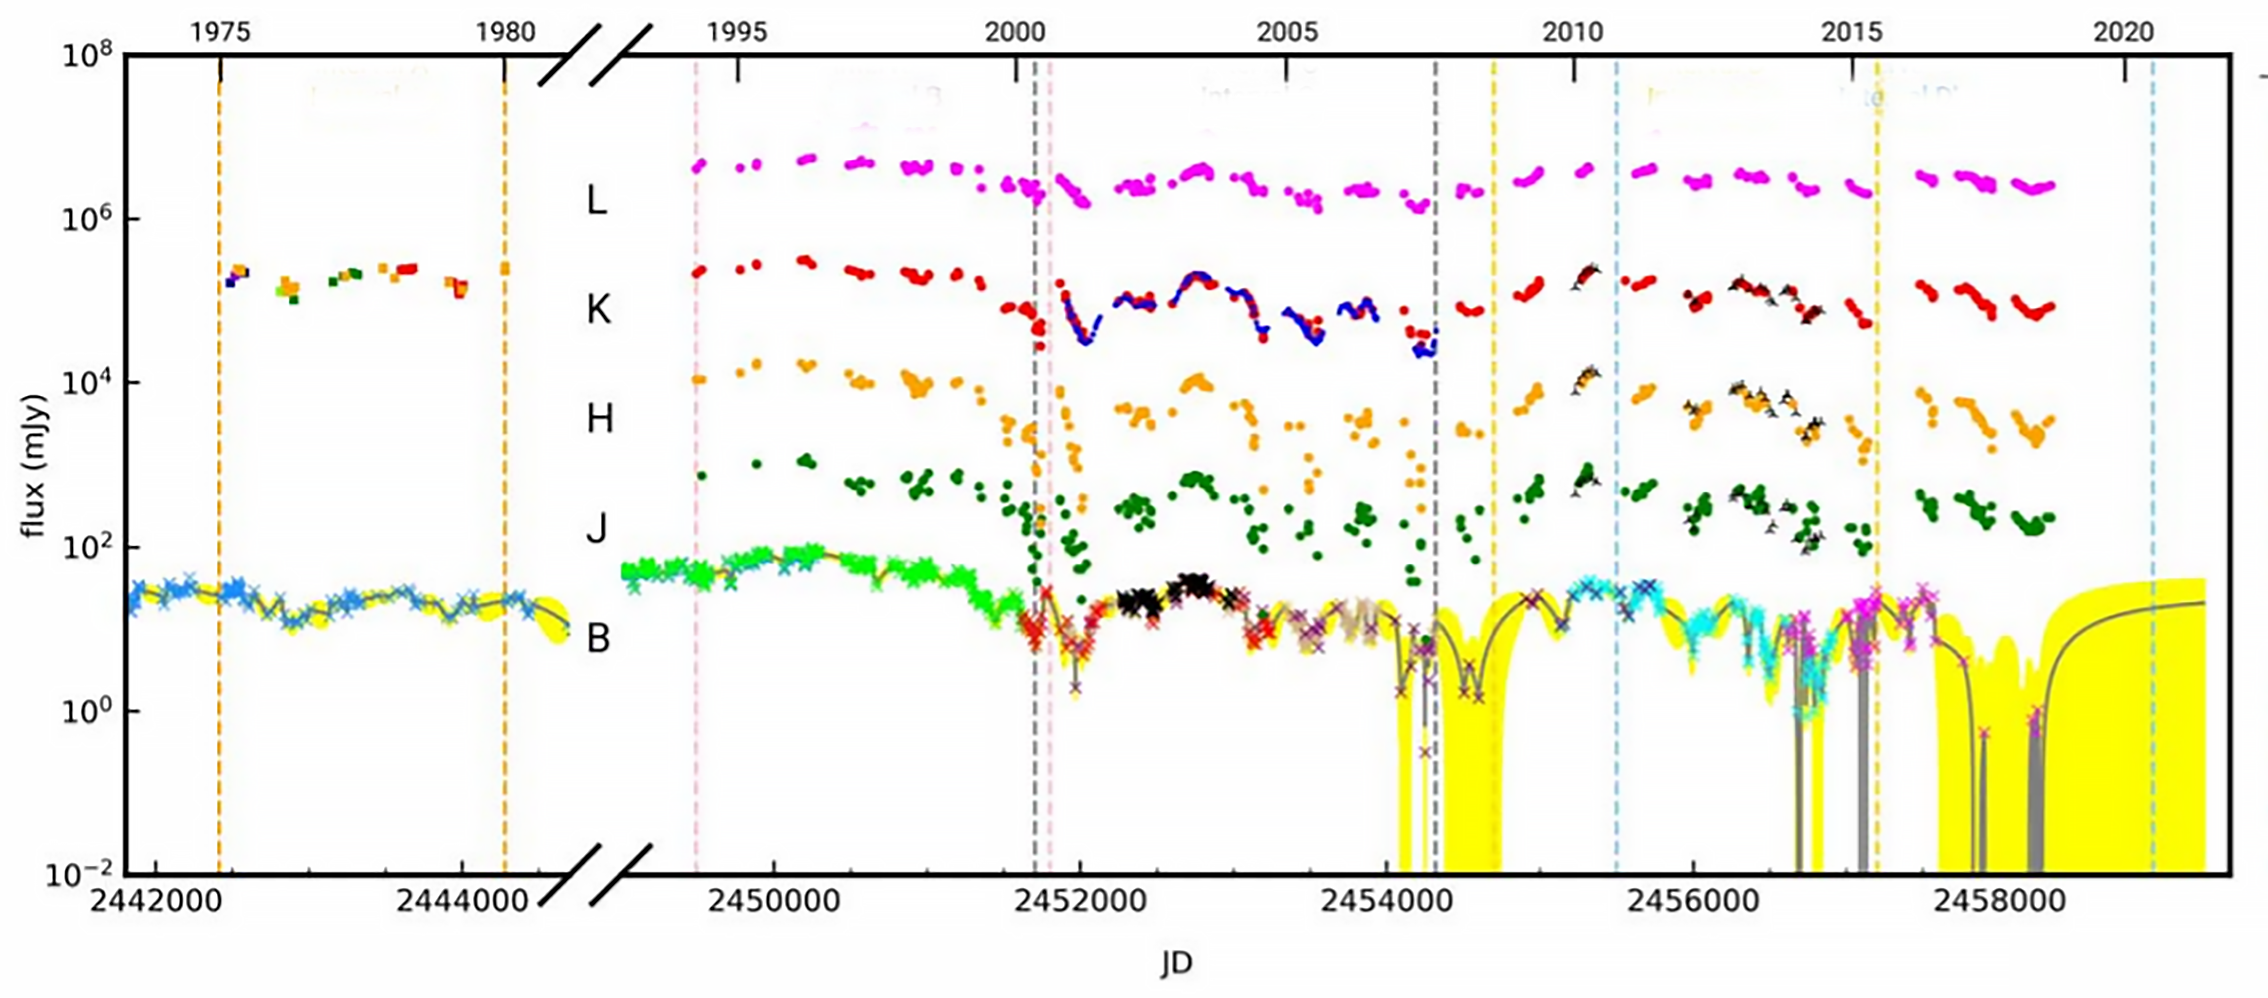
For the near-IR reverberation signals of NGC 4151, Lyu & Rieke (2021) found two distinct dust lags of 41 and 90 days with the latter contribution increasing as a function of wavelength and becoming dominant in the -band (see Figure 15). Lyu et al. (2022a) recently measured the WISE 3.4 and 4.5 m dust time lags of NGC 4151 to be 75–100 days, consistent with the longer lag. Previous near-IR reverberation mapping of this object had led to the conclusion that the lags are wavelength-independent from through the band (Oknyansky et al., 2015). The contradiction is not complete; that work found lags generally clustered around the same two values, with 4/7 of those longer than 80 days associated with and only 2/9 cases with lags 80 days in this band. In addition, previous works report substantial changes in the time delay as summarized for NGC 4151 (Koshida et al., 2009) and it and other galaxies in Oknyansky et al. (2015). In contrast, Lyu & Rieke (2021) found relatively little variation over the same time interval and using the same data (see their Table 6). Again, the contradiction is not complete — all studies tend toward lags close to 40 days. To probe the cause of the discrepancies, Lyu & Rieke (2021) took the period when the galaxy was being monitored by both the SAI and MAGNUM groups (generally providing Nyquist or sometimes better sampling) and repeated their analysis using only the SAI data, dropping the sampling cadence to sub-Nyquist. There was a significant effect on the lags, changing from 41 and 90 days to 30 and 48 days. As expected, adequate sampling is critical to obtaining reliable results.

The detailed monitoring of NGC 4151 shows the potential of multi-wavelength IR reverberation mapping to obtain physical insights about AGNs. Lyu & Rieke (2021) identify five source components: (1) one with a lag 41 days and a temperature 1500 K, probably associated with graphite dust at its sublimation temperature and presumably defining the inner rim of the dusty circumnuclear torus at 0.033 pc from the central engine; (2) another with a lag of 90 days and temperature of 900 K, probably dominated by silicate dust at its sublimation temperature (see Section 3.4.4) at a distance of 0.076 pc; (3) a persistent component at 700K that changes output only over long timescales — over most of the duration of the study the emission from this component increased by 4%/year, but prior to that time it underwent a decrease from the 1980s to the early 1990s (Oknyanskij, Lyuty, Taranova, & Shenavrin, 1999): it is probably emission by dust buried in the torus; (4) a component with a lag of 3000 days corresponding to a distance from the central engine of 2.2–3.3 pc and at a temperature of 285 K, possibly associated either with the outer part of a flared circumnuclear torus or as part of a polar wind; and (5) a non-variable component that dominates the output at 20 m.
These conclusions correlate with structures deduced from the SED, imaging, and interferometry. The placement of the inner edge of the dusty torus at the graphite sublimation radius agrees with the conclusions of Barvainis (1987); Mor & Netzer (2012) from modeling of the SED, and with interferometric measurements (Hönig et al., 2014). The long reverberation lag at 10 m agrees with the size of the source at this wavelength measured with interferometry (Burtscher et al., 2009). This behavior clarifies the relation of these structures to each other and their overall placement within AGNs. The large difference in timescales between the lags around 2 m (41 days) and the lag at 10 m ( 3000 days), plus the amplitudes of the lagging source components, presents a challenge to purely clumpy models for the torus, which generally predict only modestly longer timescales and lower amplitudes for 10 m variations compared with those at 2 m (Almeyda, 2017; Almeyda et al., 2020). This discrepancy is discussed in Section 5.2. In comparison, the time scales are readily consistent with the wind models proposed by Hönig et al. (2013), although the spectrum of the AGN does not show the expected strong silicate emission. Before discussing these issues, we extend the discussion to AGN variability in general.
3.4 Other Observation of AGN IR Variability
3.4.1 General Lack of Classical AGN Variability at 10–24 m
If the mid-IR flux of classical AGNs arises through dust in a wind or outer zones of a torus reprocessing the nuclear UV-optical luminosity, there is a prediction that the components dominating the output at the longer mid-IR wavelengths should have very long reverberation-type variability timescales, as demonstrated for NGC 4151. For sources more luminous than that example, the outputs at 10–20 m should appear to be non-variable over any reasonable measurement period. This prediction has been confirmed by Lyu et al. (2019). They took advantage of the ability of the MIPS instrument on Spitzer to provide photometry repeatable to the 1% level in observations at 24 m. They found that, except for blazars and flat-spectrum radio sources whose mid-IR emission could be non-thermal, the majority of AGNs have typical variation amplitudes at 24 m of no more than 10% of that in the WISE W1 band, indicating that the dust reverberation signals damp out quickly at longer wavelengths. In particular, steep-spectrum radio quasars also lack strong 24 m variability, consistent with the unification picture of radio-loud AGNs.
3.4.2 Ubiquitous IR Variability of Steep Spectrum Radio Sources
Although they are not within the scope of this review, we remark that flat spectrum radio sources - a category that includes blazars and their relations - are very commonly, perhaps ubiquitously, variable across the mid-IR (Lyu et al., 2019). This behavior is consistent with the unification of radio-loud AGNs (Urry & Padovani, 1995) that the jet emission of these objects has been greatly amplified due to beaming effects with a very small inclination angle.
3.4.3 Near-IR SED of the Variable Nonthermal AGN Continuum
In the near IR, accurate determination of the emission by the dust depends on being able to remove the nonthermal continuum associated with the central engine. Theoretically, the slope into the IR is expected to be (Shakura & Sunyaev, 1973). However, it has been difficult to confirm this behavior in the optical (Gaskell, 2008), and thus, there is no obvious reason to expect it in the IR. Kishimoto et al. (2008) tested for this behavior on six luminous quasars, finding a spectrum . García-Bernete et al. (2019) used very small aperture photometry and found slopes consistent with the theoretical value. Lyu & Rieke (2021) analyzed the Schülle et al. (2015) data that gave simultaneous coverage of the nonthermal regime at the z band (0.9 m) and the JHK bands extending into the thermal one and found evidence for a steeper-than-theoretical slope for the nonthermal spectrum. Fortunately, the differences among these possibilities are modest in the 1–1.3 m range, and at longer wavelengths the radiation by the dust overwhelms the contribution by the nonthermal continuum in any case.
3.4.4 Presence of Two Lags in Near-IR Reverberation Signals of AGNs
The influence of graphite at its sublimation temperature in the torus SED is well established. The second lag observed for NGC 4151 might be associated with a range of possible torus structures, although its relative lag suggests an association with sublimation of silicate grains. A test of this possibility is whether there is a similar second lag in other AGNs, differing in lag time by about the same ratio as the two in NGC 4151. From experience fitting NGC 4151, at K-band the longer lag component should still account for a significant fraction of the total signal. The photometry of Koshida et al. (2014) and Minezaki et al. (2019) is sufficiently accurate to allow a search for such a double lag. It is necessary to discard cases with inadequate data, light curves that clearly depart from the reverberation mapping paradigm (e.g, large departures between the delayed B-band and K-band curves), and cases with poor fits. Nonetheless, the fits are successful for 14/17 of the Koshida et al. (2014) sample and 19/30 of the Minezaki et al. (2019) one, with overall relations to the trend of with bolometric luminosity of
| (1) |
and
| (2) |
The ratio of short to long lags is then , identical to that for NGC 4151, which is 0.41. The longer lags are also consistent with the reverberation results at 3.4 and 4.6 m (Lyu et al., 2019), where the corresponding dust component becomes more dominant. It appears that the two-lag behavior, with a similar difference in the lags, is a general phenomenon, justifying the connection with silicate grain sublimation. That is, the inner zones of the circumnuclear tori in many/most/all(?) AGNs have structures likely governed by the sublimation of graphite and silicate grains.
4 Completing the AGN Census with IR Selection
Optical spectroscopic surveys such as SDSS enable the identifications of large numbers of AGNs through their unique optical/UV emission line characteristics. They have been supplemented by selections using distinctive characteristics of AGN SEDs: UV excess; X-ray emission, particularly with a hard spectrum; or variability in the optical/UV. All these approaches are, unfortunately, biased against heavily obscured samples (Hickox & Alexander, 2018). The unique IR SED features of AGNs, as compared with quiescent and star-forming galaxies, are central to completing the census of the whole AGN population through discovery of representative obscured objects.
4.1 Selection via Color-Color Diagrams
It was apparent early-on that AGNs have characteristic IR behavior. However, a sensitive all-sky survey covering the mid-IR was required to identify AGNs using this behavior, which was provided for the first time by IRAS. These observations were used to detect luminous AGNs through the unique “warmer” SEDs they exhibited compared with star forming galaxies (e.g., de Grijp et al., 1985; Osterbrock & De Robertis, 1985). The 2MASS survey provided another opportunity to identify AGNs through photometric colors; Cutri et al. (2000) reported the discovery of a large number of AGNs from 2MASS data. These methods were extended further into the IR with ISO data (Laurent et al., 2000; Leipski et al., 2005).
Spitzer launched a variety of methods to use IR photometry to identify AGNs, most notably IRAC color-color diagrams proposed by Lacy et al. (2004) and Stern et al. (2005) or, at low redshift, just the 3–5 m color (e.g., İkiz et al., 2020_). Veilleux et al. (2009) proposed a color-color selection based on longer wavelength continua measured spectroscopically. An alternative approach used fitting to the IRAC colors to identify objects with power law SEDs (Alonso-Herrero et al., 2006; Donley et al., 2007). The color and power law methods were merged by Donley et al. (2012), who proposed a more constrained selection criterion in the form of a power law zone within the previously proposed color-color diagrams. These methods have proven quite powerful; however, because the longest IRAC band is centered at 8 m, they lose sensitivity to obscured AGN at modest redshift, and they are best suited to find cases with typical Type-1 SEDs or modestly obscured Type-1 behavior (Donley et al., 2012). To improve on this situation, Alonso-Herrero et al. (2006); Donley et al. (2007) selected in IRAC colors and then checked 24 m and argued that there was an obscured population from the full SED. Using the R[4.5] color, Hickox et al. (2007) found a significant population of obscured AGN in the Bootes field. At the same time, they show (their Figure 9) how there is a strong bias against strongly obscured AGN even at moderate redshift. Surprisingly, even with this limitation a large number of sources are found that are very faint in the X-ray, indicative of strong absorption there despite the lack of evidence for strong obscuration in the optical and near IR (e.g., Donley et al., 2012; Del Moro et al., 2016).
The WISE W3 band at 12 m improved the wavelength baseline for finding AGNs (Assef etal., 2018), with less bias against obscured nuclei (e.g., Jarrett et al., 2011; Stern et al., 2012; Mateos et al., 2012; Hainline et al., 2014; Secrest et al., 2015; Hviding et al., 2018; Asmus et al., 2020; Carroll et al., 2021). Recent improvements in this approach are described by Hviding et al. (2022), based on an extensive study of AGNs identified through optical spectroscopy. This approach allows them to optimize the color selection method so it can be applied in cases too obscured for reliable optical identification and to push the color selection down to lower AGN luminosities. Combining hard X-ray all-sky surveys with WISE or other mid-IR data has resulted in significant advances in finding heavily obscured AGNs locally (e.g., Gandhi et al., 2009; Mateos et al., 2012; Asmus et al., 2020), although it is believed that the sample is still incomplete (e.g., Asmus et al., 2020; Carroll et al., 2021). WISE mid-IR measurements have also proven useful to locate and confirm Compton thick AGNs in the NuSTAR data (e.g., Boorman et al., 2016; LaMassa et al., 2019). The addition of the two mid-IR bands from Akari provided more possibilities in this direction (Lam et al., 2019). Reliable selection can be achieved by combining mid-IR photometry from IRAC and MIPS on Spitzer with far-IR photometry from PACS and SPIRE on Herschel (Kirkpatrick et al., 2013). However, all of these methods rely on datasets that are relatively shallow, limiting the results to either very luminous or relatively nearby examples.
The color-color and power law fitting techniques have the major advantage that they are simple and involve a minimum of free parameters. Given that they are being used with a limited set of mid-IR photometry, these features are important for returning unambiguous results. Nonetheless, there is a range of interpretations of the number and characteristics of AGNs found in this manner, as discussed in the next section. Proposals have been made to use similar approaches with the more extensive photometry that will be provided by the James Webb Space Telescope (JWST) (e.g., Messias et al., 2012; Kirkpatrick et al., 2017).
4.1.1 Limitations of AGN IR color selection
IR color selection is a powerful technique to identify AGNs, including many not revealed by other methods. Used conservatively it can be quite accurate (Satyapal et al., 2018). Of course, the approach also has limitations. The methods are not very sensitive to low luminosity AGNs that might not stand out from the host galaxy colors. In addition, with deep IRAC data the color selection becomes degenerate with stellar continua at high redshifts (e.g., Donley et al., 2008; Mendez et al., 2013). The limited ability to characterize SEDs is also a weakness. Finally, most popular color selection methods are unable to identify heavily obscured AGNs, but are focused on power law SEDs with perhaps only modest reddening. Methods extending into the far-IR avoid some of these issues (Kirkpatrick et al., 2013) but are limited by the availability of observations of sufficient depth.
The interest in IR selection largely arises because of the possibility of finding additional highly obscured cases. So far the results are inconclusive. For example, Mendez et al. (2013) concluded that only 10% of IR-selected AGNs are heavily obscured, but this result appears to be contradicted by Del Moro et al. (2016), who concluded that 30% of the IRAC-selected AGN were too obscured in the X-ray to be detected there. Rather than viewing the difference as a contradiction, it is a reflection of our ignorance and it is better to take both numbers as probable lower limits. Indeed, the predictions of a very large population of heavily obscured AGN (e.g., Ananna et al., 2019) suggest that the current methods are only finding a small fraction. The more extensive JWST color information may mitigate these issues, but using simple color-color diagrams will be a relatively primitive approach to the extensive dataset that will become available.
4.2 Selection by SED analysis
In principle, a more powerful approach is to fit the photometry with SEDs representing the various underlying components — stars, AGNs, star-formation powered IR excesses, extinction. Models of this type have been demonstrated by Fan et al. (2016); Brown et al. (2019); Azadi et al. (2020); Pouliasis et al. (2020). However, as discussed in Section 2.4, these models are characterized by large numbers of free parameters, e.g., a large number for the star forming SEDs and 10 AGN SEDs for Brown et al. (2019), or 23 free parameters listed by Pouliasis et al. (2020), and/or they are strongly based on theoretical models that themselves are subject to many free parameters and are not constrained by prior matching to observations of well-studied AGNs (Brown et al., 2019; Azadi et al., 2020). These approaches are best suited to characterizing AGNs measured at good signal to noise in multiple independent photometric bands to help remove degeneracies in the fits.
4.2.1 Inputs to SED Fitting
In general, the data to be fitted with model SEDs to search for new AGNs consist even in the most favorable case of a modest set of photometry, with many measurements linked by the underlying physics and not truly independent. Therefore, the ability of such fitting approaches to provide unambiguous answers depends critically on selecting inputs that provide accurate fits with a minimum of free parameters. Given the importance of this statement, we describe the approaches in detail.
Yang et al. (2021) address an approach to a model for JWST data but do not apply it to existing data. They used X-CIGALE to provide a library of non-AGN galaxy SEDs. They then added an AGN using theoretical predictions from Stalevski et al. (2012, 2016), and subjected the resulting synthetic images to JWST/MIRI simulated photometry. They used X-CIGALE for Markov Chain Monte Carlo SED fitting to the results to extract the AGNs. Their approach is thus similar to the other SED-fitting efforts in the number of free parameters and hence risk of degeneracies, as discussed in Section 2.4.1.
Lyu et al. (2022a) took a much more aggressive approach to limiting the free parameters in their fits. They used existing capabilities in the Bayesian fitting program Prospector (Leja et a., 2017) to fit the stellar photospheric continua. In the GOODS-S region where they have applied this approach, the data over the relevant spectral range are extensive and Prospector is thoroughly optimized to provide accurate fits. Importantly for identifying obscured AGNs in the mid-IR, the stellar photospheric SEDs of galaxies are very uniform from 1–5 m regardless of the galaxy type (e.g., Willner et al., 1984; Mannucci et al., 2001; Brown et al., 2014).
In the mid-IR spectral region of interest for the models, the dominant feature in star-formation-heated dust is PAH bands, and in fact the bands short of 15 m, since the longer-wavelength SED is shifted beyond reach of the Spitzer 24 m band (and of JWST/MIRI) at the redshifts of interest. At the redshifts ( 2) and luminosities of interest, the variety of star-formation-heated far-IR SEDs is much less than locally (Rujopakarn et al., 2011, 2013; Shipley et al., 2016). Therefore, Lyu et al. (2022a) have taken the star-heated dust spectrum from the log(L(IR)) = 11.25 template of Rieke et al. (2009), which provides a good fit to the overall IR SED of high-luminosity star forming galaxies at the relevant redshift (De Rossi et al., 2018). For solar metallicities, the 6–12 m PAH bands are usually similar in relative strength; typical variations in relative band strengths are 30%, 1- (Smith et al., 2007) . The general behavior of these bands has little dependence upon metallicity (although the 17 m complex does change significantly), as can be seen comparing the spectra presented in Hunt et al. (2010) with templates determined from solar metallicity galaxies (Rieke et al., 2009). In addition, for the narrow range of luminosities of interest and in the 2–15 m range, the continua underlying the PAH bands are very similar, independent of luminosity (da Cunha et al., 2008; Rieke et al., 2009). Therefore, it is possible to fit the star-formation-heated dust emission with a single free parameter, i.e., the normalization of the spectrum.
For AGNs, the 2–5 m region is critical, where the flux from star formation is low but there is significant flux from AGNs (Figure 4). Lyu et al. (2022a) use the “normal” quasar SED to minimize free parameters and because it is an appropriate average (Section 2.2.3). The application of the AGN-based attenuation curve (Section 2.2.2) allows them to fit a full range of obscuration with a single additional free parameter. In summary, their AGN fits depend on two free parameters — the normalization of the intrinsic SED type and the amount of obscuration.121212With the additional constraints with the multiband JWST MIRI measurements, more flexibility can be added to the fits, for example to include a HDD template and a term for polar dust.
4.2.2 Results
Figure 16 illustrates a fit from Lyu et al. (2022a). The elevated points above the photospheric level in the 3–6 m range are an unambiguous signature of an embedded AGN; the star-forming PAH-dominated template normalized to account for these points exceeds the 24 m point substantially. Lyu et al. (2022a) found their SED analysis was responsible for 40% of the identified AGN candidates, many of them unique to this method.
The source in Figure 16 is a counterexample to the comment by Hickox & Alexander (2018): "A surprising result from the analysis of the mid-IR continuum of AGN is that obscured AGN have broadly similar mid-IR SEDs to unobscured AGN." The SED fitting indicates that as many as 20% of the indicated AGNs are sufficiently strongly obscured to show strong effects in the mid-IR SEDs. If confirmed once we have the more detailed JWST data between 5 and 25 m, this would indicate that the lack of obscured SEDs is a selection bias and that there are many more such AGNs to discover.
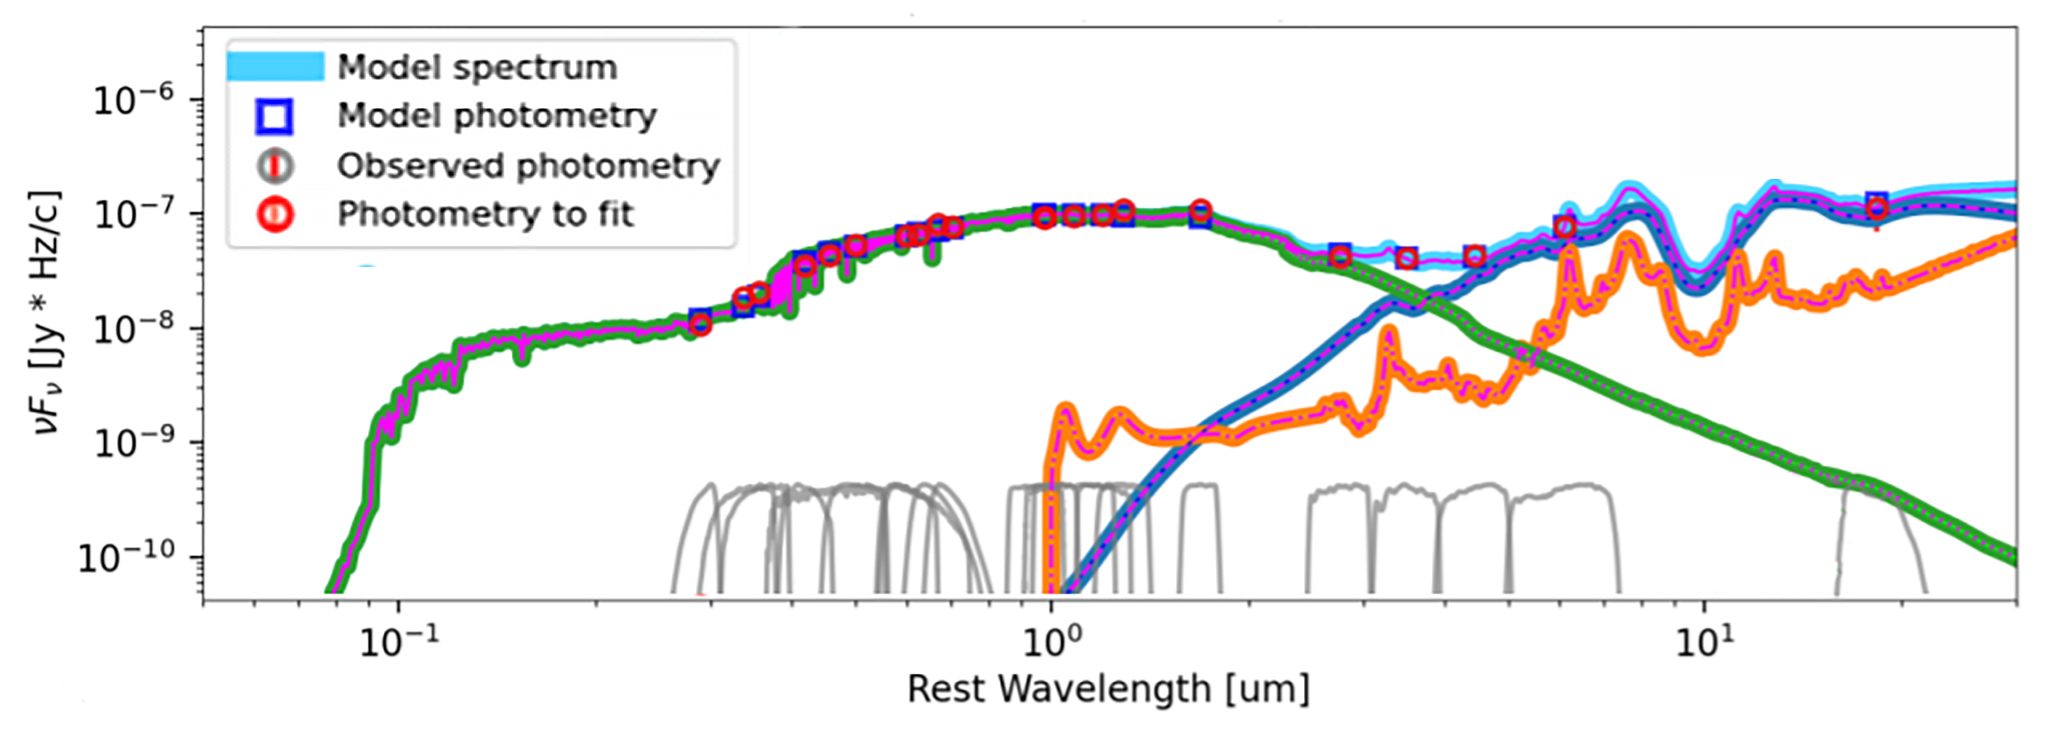
4.3 Selection by IR variability
AGN variability across the full spectrum is a huge subject and most of it is outside the scope of this review. However, here we discuss use of near- to mid-IR variability to supplement optical/UV variability surveys (Ulrich et al., 1997), providing another way to identify AGNs. As summarized in Section 3, although the longer IR wavelengths tend not to vary on useful timescales, the AGN near-IR (1–5 m) emission contains the signals from the dust reverberation response to the accretion disk variability. Given that the IR wavelengths are relatively less obscured than the optical band, IR variability is expected to be very useful to identify obscured AGNs.
A pioneering investigation of this type is reported by Secrest & Satyapal (2020), who ironically found that variability is not a good indicator of AGNs in dwarf galaxies, possibly indicating a fundamental difference in their AGNs from those in more massive host galaxies. Early efforts with Spitzer include IRAC 3.6 and 4.5 m and MIPS 24 m variability selections in some deep survey fields where multiple exposures have been carried out (Kozłowski et al., 2010; García-González et al., 2015; Kozłowski et al., 2016). Kozłowski et al. (2016) found a large number of AGNs using repeated IRAC photometry of the nine square degree Boötis survey. A detailed survey of multiple fields surveyed with IRAC is described by Polimera et al. (2018). At typical redshifts for their targets, the rest wavelengths are generally in the 1–3 m range, i.e., variability could arise either from the nonthermal emission or from the reradiation by dust. They found 1% of the galaxies in multiple fields are variable, indicative of AGNs.
With the time-domain surveys made accessible by the WISE/NEOWISE mission and groundbased JHK surveys, more authors have explored use of IR variability to find AGNs (e.g., Assef etal., 2018; Ward et al., 2021). Recently, Elmer et al. (2020) explored high- AGN selection with long-term near-IR variability using archival UKIDSS data. This is an example of a number of investigations with groundbased JHK data; typically at the redshifts of the sources these studies are investigating the nonthermal source variations rather than true rest-IR variability.
Sheng et al. (2017) showed that the transitions between broad H recombination lines and weak ones in changing look AGNs are accompanied by large changes in the fluxes in the WISE bands (see also Assef etal. (2018)). This behavior indicates that the IR fluxes are reradiation by circumnuclear dust of energy absorbed from variations in the accretion disks, as confirmed by their reverberation lags (Lyu et al., 2022a). The alternative explanation for the hydrogen line changes, changing obscuration, is not likely given that even larger changes would be expected in the optical continua and furthermore that the orbital period for a cloud to occult the circumnuclear torus is much too long (LaMassa et al., 2015; Sheng et al., 2017). Stern et al. (2018) discuss causes for the changing look behavior further. WISE data are being used to find these “changing look” AGNs (Stern et al., 2018; Sheng et al., 2020).
JWST and the Nancy Grace Roman Space Telescope will enable long-term variability determination through comparison of fluxes with these missions to those measured with Spitzer and groundbased near IR surveys, respectively. There are some lessons learned for these future studies from optical variability monitoring. An alarming result is that methods of increased sophistication have failed to confirm a large majority of apparently variable AGNs, even using virtually the same optical dataset (Pouliasis, 2019). This may result from the effects of low-level electron production from cosmic ray hits (Hagan et al., 2021). In any case, it indicates the importance of self-confirmation in variability studies, e.g., by detecting the effect in more than one spectral band and separated in time.
5 Synthesis of Constraints on the AGN Dusty Environment
This section integrates what we have learned from AGN SEDs and reverberation analysis to provide insights to the dusty structures around AGN central engines. In the literature, quite a number of theoretical models relate hypothesized AGN structures and their emission in detailed ways (for impressive examples, see, e.g., the radiative transfer study of NGC 1068 by Viaene et al. (2020), the library of clumpy disk models by Nikutta et al. (2021a), the combined clumpy disk and wind models of CAT3D-WIND (Hönig & Kishimoto, 2017), and the hydrodynamic models of Williamson et al. (2020), among many others). In these works, with the assumed dust structures and grain properties, the resulting IR SEDs and images can be directly computed through radiation-transfer calculations. To make an analogy, this approach is similar to imagining the behavior of a dragon and predicting its tracks as a test. However, such models are typically degenerate and have been challenged by recent observations (see discussions below). Our review will take an inverse approach by making largely qualitative (and more limited but perhaps more certain) descriptions of the AGN dusty structures (the dragon) based on the relevant empirical observations (the tracks).
5.1 The Uniformity of the 1–5 m SEDs and the Radial Structure of the Inner Torus
The general similarity of AGN dust emission SEDs at 1–5 m (Section 2.2) indicates similar properties of the inner zones of the circumnuclear torus. The same conclusion holds to , where the quasar hot dust emission SED shows no evidence for evolution compared with low redshift AGNs. Reverberation mapping suggests that the hot inner dusty torus has two separated dust components. From a theoretical viewpoint, the inner radius of the dust structures defined by the sublimation of graphite grains is (Barvainis, 1987, see also (Lyu & Rieke, 2021)):
| (3) |
Similarly, for the silicate grains, we have
| (4) |
If the innermost boundary is set by the sublimation of graphite dust, then we expect a second component at just over twice the radius due to sublimation of silicate grains. This prediction is consistent with the observed difference in reverberation lags of just over a factor of two (Sections 3.3 and 3.4.4).
Since the metallicities of material surrounding AGNs are high out to the highest redshifts probed (Maiolino & Manucci, 2019), the relative abundance of graphite and silicates will be similar in AGN environments. The result is that the inner zones of the circumnuclear tori will be governed by the stability of the grains and will have very similar structures. That is, the similar near IR properties among different AGNs indicate the similar temperatures, positions (adjusted for central engine luminosity), and compositions of the emitting grains in the AGN sublimation zones. However, our probing is limited because most reverberation mapping campaigns extend only to 2.2 m; learning more about the inner dusty torus would benefit by extending reverberation mapping toward 5 m.
5.2 Pure Clumpy Torus Models vs. Observations
The torus is expected to be clumpy, based on very general considerations of which the most compelling is the variability in absorption in the X-ray (Markowitz et al., 2014; Laha et al., 2020), modeled in terms of clumpy models by Buchner et al. (2019). Clumps are also needed to account for the low dust temperatures seen close to the nuclei of AGNs (e.g., Poncelet et al., 2006). This possibility was anticipated in the prescient work of Krolik & Begelman (1988). A closeup version, without the intense energy input from an active AGN, is provided by the clumpy, tidally sheared circumnuclear disk in the Milky Way’s Galactic Center (Tsuboi et al., 2018).
Purely clumpy models, i.e., little or nothing between the clumps, have been successful in fitting most features of the AGN torus SED (e.g., Ramos Almeida et al., 2009, 2011; Alonso-Herrero et al., 2011; Lopez-Rodriguez et al., 2018). However, as summarized by Netzer (2015): "torus models contain enough free parameters to fit almost any observed SED." Nonetheless, they have three observational shortfalls. First, they do a poor job of fitting the 1–4 m SED (Mor et al., 2009; Hernan-Caballero et al., 2016). Mor et al. (2009) introduced a hot black body component associated with sublimating graphite dust to improve their fits, illustrated by the modeling of Swain et al. (2021). García-González et al. (2017) show how adjustments in the standard clumpy model can produce improved fits. Almeyda et al. (2020) found that the predicted torus sizes at 2.2 m from traditional clumpy models are typically a factor of 2 larger than the constrains from K-band reverberation mapping, consistent with the existence of a graphite-dominated torus innermost region. These results suggest that this issue can be addressed by augmenting the models, as discussed in Nikutta et al. (2021a).
A second, and more fundamental issue, is the lack of variability at wavelengths near 10 m and longer (Sections 3.3 and 3.4.1). Variability at 10 m is an intrinsic characteristic of most pure clumpy torus models. For an optically thick clump, the direct heating from the AGN is deposited within the first few optical depths, raising a thin layer on the central-engine side of the clump to a high temperature. The remainder of the clump is warmed by diffuse radiation, e.g. from this hot layer, and can have a modest temperature gradient. Thus the surface of the clump not heated directly emits at much lower temperature and can contribute substantially to the output of the torus in the mid-IR. This behavior is modeled in detail by Almeyda (2017) and the predicted variations at 10 m have amplitudes a significant fraction of the amplitudes in the near IR, with modest smoothing in time. This prediction is strongly contradicted by the behavior of NGC 4151 (Lyu & Rieke, 2021) and implicitly by the general lack of variations at observed 24 m (rest 16–24 m) for a large number of luminous traditional AGNs (Lyu & Rieke, 2017). Hönig & Kishimoto (2011) present another study of the IR variability of clumpy torus models, based on a less detailed analytic model than the model of Almeyda (2017). They predict variability at 8 m to be an order of magnitude less than at 2.2 m even in the favorable case of a narrow torus (i.e., density falling rapidly with radius). The behavior of NGC 4151 is also inconsistent with this prediction (Lyu & Rieke, 2021).
The third issue is that clumpy models — indeed torus models in general — do not predict the correlation between the strength of the narrow line emission and the mid-IR excess (Section 2.2.3). This correlation implies that a substantial fraction of the mid-IR emission originates in the NLR, not in the torus. At the same time, the persistence of significant mid-IR emission (perhaps as WDD or HDD templates) even for AGNs with virtually no narrow line emission suggests that there may be a significant component due to the disk itself, with an augmentation by polar dust in cases with strong narrow line emission. The relative roles of the torus and the wind in the mid-IR emission is a central issue for future research. We need to develop means to separate these contributions in large, representative samples of AGNs. High resolution imaging with giant telescopes can play a central role in this goal (Nikutta et al., 2021b).
5.3 The Structure of the Torus: Clumpy, Smooth, or Both?
Krolik & Begelman (1988) identified the critical issue for maintaining static clumps: resisting tidal shearing and stripping in the vicinity of the black hole. If a clump is to be long-lived, it needs to be stabilized against these effects either by gravity or magnetic fields. To put some numbers on this requirement, we treat the case of gravity, following the discussion in Elitzur (2008). To avoid severe shearing, the Jeans timescale for gravitational collapse should be less than the Keplerian period of the orbit. This leads to a density requirement on the cloud:
| (5) |
where is the density of hydrogen atoms and is the radius of the orbit of the cloud around the black hole. Taking values appropriate for NGC 4151 just outside the silicate sublimation radius, say = 0.1 and = 107 M⊙, the lower limit on the clump density is cm-3.
Thus stable clumps must be extremely dense and compact. Athena sprang from the skull of Zeus fully formed, but the analogy is not valid for interstellar clouds and clumps. Instead, on very basic grounds, the clumps must be extreme products of turbulence in the torus gas, with weaker clumps and a continuous gas background distributed between. Hybrid clumpy/smooth models have been developed by Stalevski et al. (2012); Siebenmorgen et al. (2015), which correspond more closely to this picture than either purely clumpy or purely smooth models. However, detailed modeling of the 10 and 20 m spectrum of NGC 1068 (Victoria-Ceballos et al., 2022) combined with the high resolution imaging at 10 m (Gámez Rosas et al., 2022) reveal complexities that none of these models can account for, requiring us to consider them to be useful approximations that remain a bit abstract. Indeed, it appears that none of the popular models are totally successful, even within the limited constraints, of accounting for the torus properties comprehensively (González-Martín et al., 2019).
The torus has been the subject of intense theoretical modeling (e.g., Netzer, 2015). The various hydrodynamical simulations predict a violent environment featuring both inflow and outflow. The simulations of Wada (2012), for example, show a circumnuclear torus dominated by turbulence and transitory density enhancements (i.e., “clumps”) embedded in a smoother gas distribution, with a density contrast of factor of a few. They predict turbulence and winds continuously lifting significant amounts of material off the torus, which would naturally explain long term trends seen for NGC 4151, such as the growing (and variable) hot dust emission, as well as the maintenance of the polar dust. Other models (e.g., Hönig & Kishimoto, 2017; Namekata & Umemura, 2016; Vollmer et al., 2018; Venanzi et al., 2020; Takasao et al., 2022) make qualitatively similar predictions. The models also provide a unification of hybrid clumpy/smooth torus models and the driving of winds. However, much of the modeling to date has concentrated on the compact, pc-sized circumnuclear torus. ALMA finds both dust and gas in a disk on much larger scales and the future should see more models linking this outer structure with the pc-sized one and simulating the flows that feed the accretion disk.
5.4 Torus, Polar Dust and Dusty Narrow-line Regions
As summarized in Section 2.2.3, the extended polar dust, typically associated with the NLR, can dominate the mid-IR output of an AGN as shown for NGC 1068 in Figure 17. On 10–100 pc scales (left panel), its mid-IR dust emission is very extended and elongated similar to the NLR (Bock et al., 2000). Over 0.1–1 pc scales, the high resolution image (Gámez Rosas et al., 2022) shows a roughly conical wind rising from the vicinity of the nucleus and sublimation zones, although even at the resolution of MATISSE131313MATISSE stands for Multi AperTure mid-Infrared SpectroScopic Experiment on the Very Large Telescope Interferometer (VLTI), an instrument that can resolve structures down to 3.5 milli-arcsecond. See more at https://www.eso.org/sci/facilities/paranal/instruments/matisse.html the exact geometry and any contributions by disk emission are not discernible. As another example, the MATISSE image of the Circinus galaxy (Isbell et al., 2022) shows the mid-IR to be dominated by polar emission (see also (Stalevski et al., 2019)), with only some blobs of emission along the direction expected for a circumnuclear disk. The lack of emission from the disk in this case could, of course, result because it is shadowed by its inner structure and not sufficiently heated to emit at 10 m, not that the disk is absent. In comparison, ring-like dust structure is clearly revealed in NGC 1068 at shorter wavelengths (2.2 m) (Gravity Collaboration, 2020b), indicating that the relative brightness of the polar dust component is a function of wavelength. That is, for most AGNs the torus-like dust structures dominate the near-IR emission, as is supported by dust reverberation analysis and interferometry observations in the near-IR (Section 3.2), while the polar dust emission is significant at longer wavelengths (Section 2.2.3).
Alonso-Herrero et al. (2021) study the relation between the torus and polar dust in additional AGNs. They compare high resolution (typical beam diameters of 40 pc) images at 10 m with ALMA images at 870 m at about three times higher resolution. ALMA traces the extended circumnuclear disk that delineates the orientation of the classical torus (see Figure 1). In six of the twelve galaxies studied, there is extended mid-IR structure on a 50–150 pc scale, i.e. similar to that of the extended NLR, that emerges perpendicular to the plane of the torus. The presence of this emission correlates with indicators of conditions that can drive outflows (Venanzi et al., 2020), i.e., moderate Eddington ratios and moderate-to-high gas column densities.
The cases with bright NLRs but without extended emission in Alonso-Herrero et al. (2021) have lower Eddington ratios and/or have lower gas columns that allow clearing of material through blowout. In Section 2.2.3, we also found that about 1/3 of AGNs, particularly those with weak NLR emission, also have much fainter - or absent - polar emission. Understanding what underlies the range from those with mid-IR dominated by polar dust to those where this dust plays a much less prominent role is a major challenge to detailed radiative modeling of the AGN IR emission.
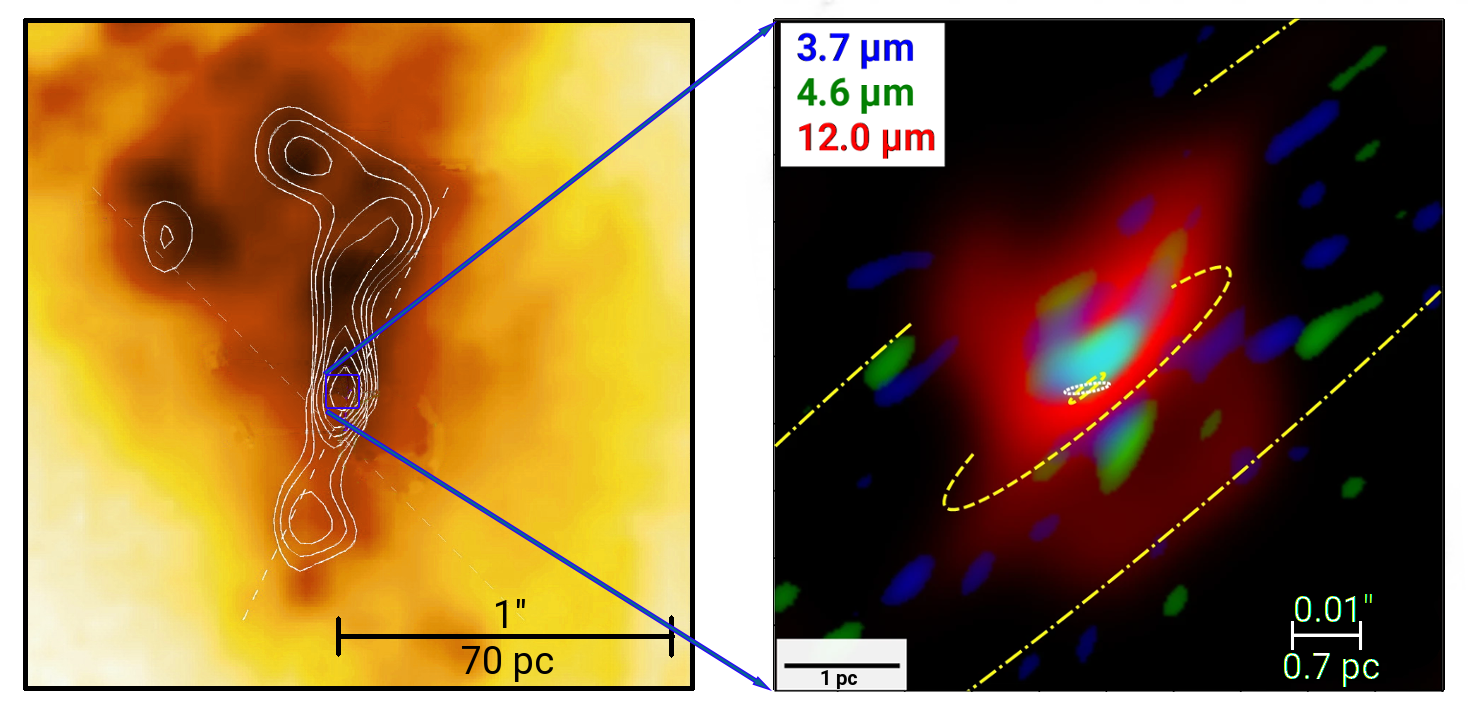
5.5 Torus Evolution and Its Relation to the Central Engine and Host Galaxy
Dust reverberation analysis and spatially resolved observations show that the AGN torus plus disk covers physical scales bridging from the black hole accretion zone (0.01 pc) out to the host galaxy ISM (100 pc). Structures on this latter scale are indeed seen in the submm (García-Burillo et al., 2021), although their exact nature is likely to be complex with a variety of emission sources playing a role (e.g., Alonso-Herrero et al., 2019; García-Burillo et al., 2019). To feed the accretion disk and grow the SMBH, the dusty clouds within the torus have to migrate inward, become turbulent, and be tidally disrupted. This process can naturally produce the AGN broad line emission (Wang et al., 2017).
The mass accretion rate of the SMBH can be estimated by
| (6) |
where is the efficiency of conversion of mass to energy and is the resulting black hole luminosity. An average extended disk plus torus mass of M⊙ has been determined from ALMA measurements (García-Burillo et al., 2021). A typical AGN duty cycle is years (Khrykin et al., 2021). Therefore, for an average luminosity for local AGNs of , about 20% of the total disk plus torus mass eventually needs to be accreted by the black hole, a plausible value. The issues linking the torus as discussed here and the larger gas structures feeding it and thus the black hole are reviewed in detail by Hönig (2019) and beautifully revealed by García-Burillo et al. (2021).
AGNs are proposed to be borne in ultraluminous IR galaxies and emerge as the star formation dies out (e.g., Sanders et al., 1988; Hopkins et al., 2006). The discovery of Compton-thick sources in the nuclei of many luminous IR galaxies (Ricci et al., 2021) confirms the basic hypothesis. Predictions of how AGNs and their host galaxies co-evolve have suggested feedback from AGNs, typically associated with (dusty) winds along the AGN polar direction, is the key to regulate the galaxy-BH relation (e.g., Hopkins et al., 2012, 2016; Trebitsch, Volonteri, & Dubois, 2019).
However, it is a bit embarrassing that by-and-large the hosts of non-obscured AGNs appear to be normal main-sequence star forming galaxies. They have at most only a slight tendency to be disturbed or have asymmetric morphology compared with non-AGN galaxies, and their star formation appears neither to be quenched nor substantially enhanced. Efforts to deduce a time-sequence for AGN evolution have been generally unsuccessful (e.g., Xu et al., 2015b; Hatcher et al., 2021). How the AGN dusty and obscuring structures evolve is also an open question. Important clues may lie in an as-yet undiscovered population of heavily obscured AGNs. We should find many of these AGNs with JWST, if they exist, and can look forward to answers to some of these questions.
The authors have contributed equally to writing this article.
This work was supported by NASA grants NNX13AD82G and 1255094.
Acknowledgements.
We received extensive and very helpful comments on an early draft from Almudena Alonso-Herrero, Kevin Hainline, Luis Ho, and Robert Nikutta. We also thank Minghao Yue, Feige Wang and Jinyi Yang for their feedback on the readability of a later draft. We benefitted from discussions with Anna Sajina, Alexandra Pope, and Mark Lacy, and we particularly thank Prof. Sajina for her leadership on this special issue. This research has made use of the NASA’s Astrophysics Data System Bibliographic Services and VizieR catalog access tool, CDS, Strasbourg, France. This publication makes use of data products from the Wide-field IR Survey Explorer, which is a joint project of the University of California, Los Angeles, and the Jet Propulsion Laboratory/California Institute of Technology, funded by the National Aeronautics and Space Administration. \conflictsofinterestThe authors declare no conflict of interest. \abbreviationsAbbreviations The following abbreviations are used in this manuscript:| AGN | Active Galactic Nucleus |
| ALMA | Atacama Large Millimeter Array |
| BH | Black Hole |
| BLR | Broad-Line Region |
| DOG | Dust Obscured Galaxy |
| CCD | Charge-Coupled Device |
| EW | Equivalent Width |
| FWHM | Full Width at Half Maximum |
| HDD | Hot Dust Deficient |
| HST | Hubble Space Telescope |
| IR | InfraRed |
| IRAC | InfraRed Array Camera (on Spitzer) |
| IRAS | InfraRed Astronomical Satellite |
| IRS | InfraRed Spectrograph (on Spitzer) |
| ISM | InterStellar Medium |
| ISO | Infrared Space Observatory |
| JWST | James Webb Space Telescope |
| LINER | Low-Ionization Nuclear Emission-line Region |
| MAGNUM | Multicolor Active Galactic Nuclei Monitoring |
| MATISSE | Multi AperTure mid-Infrared SpectroScopic Experiment (on the VLT) |
| MIPS | Multiband Imaging Photometer for Spitzer |
| NEOWISE | Near-Earth Object Wide-field IR Survey Explorer |
| NLR | Narrow-Line Region |
| PAH | Polycyclic Aromatic Hydrocarbon |
| PACS | Photoconductor Array Camera and Spectrometer (on Herschel) |
| PG | Palomar-Green |
| PSF | Point Spread Function |
| SAI | Sternberg Astronomical Institute |
| SDSS | Sloan Digital Sky Survey |
| SED | Spectral Energy Distribution |
| SFG | Star Forming Galaxy |
| SFR | Star Formation Rate |
| SMBH | SuperMassive Black Hole |
| SPIRE | Spectral and Photometric Imaging RecEiver (on Herschel) |
| SWIRE | Spitzer Wide-area Infrared Extragalactic (survey) |
| UKIDSS | UKIRT Infrared Deep Sky Survey |
| UV | UltraViolet |
| VLTI | Very Large Telescope Interferometer |
| WDD | Warm Dust Deficient |
| WISE | Wide-field Infrared Survey Explorer |
References
- (1)
- Alberts et al. (2020) Alberts, S., Rujopakarn, W., Rieke, G. H , Jagannathan, P., & Nyland, K. Completing the Census of AGN in GOODS-S/HUDF: New Ultradeep Radio Imaging and Predictions for JWST. ApJ 2020, 901, 168 - 188
- Alexander & Hickox (2012) Alexander, D. M. & Hickox, R. C. What drives the growth of black holes? NewAR 2012, 56, 93 - 121
- Almeyda (2017) Almeyda, T. R. Dusty donuts: modeling the reverberation response of the circumnuclear dusty torus emission in AGN. Ph.D. Thesis, Rochester Institute of Technology, Rochester NY, June, 2017
- Almeyda et al. (2020) Almeyda, T. R., Robinson, A., Richmond, M., Nikutta, R., & McDonough, B. Modeling the Infrared Reverberation Response of the Circumnuclear Dusty Torus in AGNs: An Investigation of Torus Response Functions. ApJ 2020, 891, 26 - 63
- Alonso-Herrero et al. (2001) Alonso-Herrero, A., Quillen, A. C., Simpson, C., Efstathiou, A., & Ward, M. J. The Nonstellar Infrared Continuum of Seyfert Galaxies, AJ, 2001, 121, 1369 - 1384
- Alonso-Herrero et al. (2006) Alonso-Herrero, A., Pérez-González, P. G., Alexander, D. M. et al. Infrared Power-Law Galaxies in the Chandra Deep Field-South: Active Galactic Nuclei and Ultraluminous Infrared Galaxies. ApJ 2006, 640, 167 - 184
- Alonso-Herrero et al. (2011) Alonso-Herrero, A., Ramos Almeida, C., Mason, R. et al. Torus and Active Galactic Nucleus Properties of Nearby Seyfert Galaxies: Results from Fitting Infrared Spectral Energy Distributions and Spectroscopy. ApJ 2011, 736, 82 - 111
- Alonso-Herrero et al. (2014) Alonso-Herrero, A., Ramos Almeida, C., Esquej, P. et al. Nuclear 11.3 m PAH emission in local active galactic nuclei. MNRAS 2014, 443, 2766 - 2782
- Alonso-Herrero et al. (2019) Alonso-Herrero, A., García-Burillo, S., Pereira-Santaella, M. et al. Nuclear molecular outflow in the Seyfert galaxy NGC 3227. A&A 2019, 628, 65 - 81
- Alonso-Herrero et al. (2021) Alonso-Herrero, A., García-Burillo, S., Hönig, S. F. et al. The Galaxy Activity, Torus, and Outflow Survey (GATOS). II. Torus and polar dust emission in nearby Seyfert galaxies. A&A 2021, 652, 99 - 124
- Ananna et al. (2019) Ananna, T. T., Treister, E., Urry, C. M. et al. The Accretion History of AGNs. I. Supermassive Black Hole Population Synthesis Model. ApJ 2019, 871, 240 - 262
- Armus et al. (2007) Armus, L., Charmandaris, V., Bernard-Salas, J. et al. Observations of Ultraluminous Infrared Galaxies with the Infrared Spectrograph on the Spitzer Space Telescope. II. The IRAS Bright Galaxy Sample. ApJ 2007, 656, 148 - 167
- Asmus et al. (2014) Asmus, D., Hönig, S. F., Gandhi, P., Smette, A., & Duschl, W. J. The subarcsecond mid-infrared view of local active galactic nuclei - I. The N- and Q-band imaging. MNRAS 2014, 439, 1648 - 1679
- Asmus et al. (2016) Asmus, D., Hönig, S. F., & Gandhi, P. The Subarcsecond Mid-infrared View of Local Active Galactic Nuclei. III. Polar Dust Emission. ApJ 2016, 822, 109 - 121
- Asmus (2019) Asmus, D. New evidence for the ubiquity of prominent polar dust emission in AGN on tens of parsec scales. MNRAS 2019, 489, 2177 - 2188
- Asmus et al. (2020) Asmus, D., Greenwell, C. L., Gandhi, P. et al. Local AGN survey (LASr): I. Galaxy sample, infrared colour selection, and predictions for AGN within 100 Mpc. MNRAS 2020 494, 1784 - 1816
- Assef etal. (2018) Assef, R. J., Stern, D., Noirot, G., et al. The WISE AGN Catalog. ApJS 2018, 234, 23 - 44
- Azadi et al. (2020) Azadi, M., Wilkes, B., Kuraszkiewicz, J., et al. Disentangling the AGN and star-formation contributions to the radio-X-ray emission of radio-loud quasars at 12, arXiv e-prints, 2020, arXiv:2011.03130 -
- Ballantyne et al. (2006) Ballantyne, D. R., Shi, Y., Rieke, G. H. et al. Does the AGN Unified Model Evolve with Redshift? Using the X-Ray Background to Predict the Mid-Infrared Emission of AGNs. ApJ 2006, 653, 1070 - 1088
- Barcos-Muñoz et al. (2017) Barcos-Muñoz, L., Leroy, A. K., Evans, A. S. et al. A 33 GHz Survey of Local Major Mergers: Estimating the Sizes of the Energetically Dominant Regions from High-resolution Measurements of the Radio Continuum. ApJ 2017, 843, 117 - 143
- Barrows et al. (2021) Barrows, R. S., Comerford, J. M., Stern, D., & Assef, R. J.A Catalog of Host Galaxies for WISE-selected AGN: Connecting Host Properties with Nuclear Activity and Identifying Contaminants. ApJ 2021, 922, 179 - 193
- Barvainis (1987) Barvainis, R. Hot Dust and the Near-Infrared Bump in the Continuum Spectra of Quasars and Active Galactic Nuclei. ApJ 1987 320, 537 - 544
- Baskin & Laor (2018) Baskin, A. & Laor, A. Dust inflated accretion disc as the origin of the broad line region in active galactic nuclei. MBRAS 2018, 474, 1970 - 1994
- Bernhard et al. (2021) Bernhard, E., Tadhunter, C., Mullaney, J. R. et al. The post-Herschel view of intrinsic AGN emission: constructing templates for galaxy and AGN emission at IR wavelengths. MNRAS 2021, 503, 2598 - 2621
- Berta et al. (2013) Berta, S., Lutz, D., Santini, P., et al. Panchromatic spectral energy distributions of Herschel sources. A&A 2013, 551, 100 - 121
- Bianchi, Maiolino, & Risaliti (2012) Bianchi, S., Maiolino, R., & Risaliti, G. AGN Obscuration and the Unified Model, Advances in Astronomy, 2012, 2012, 782030 -
- Bock et al. (2000) Bock, J. J., Neugebauer, G., Matthews, K. et al. High Spatial Resolution Imaging of NGC 1068 in the Mid-Infrared. AJ 2000, 120, 2904 - 2919
- Boorman et al. (2016) Boorman, P. G., Gandhi, P., Alexander, D. M. et al. IC 3639—a New Bona Fide Compton-Thick AGN Unveiled by NuSTAR. ApJ 2016, 833, 245 - 262
- Braatz et al. (1993) Braatz, J. A., Wilson, A. S., Gezari, D. Y., Varosi, F., & Beichman, C. A. High-Resolution Mid-Infrared Imaging and Astrometry of the Nucleus of the Seyfert Galaxy NGC 1068. ApJL 1993, 409, 5 - 8
- Brandl et al. (2006) Brandl, B. R., Bernard-Salas, J., Spoon, H. W. W., et al. The Mid-Infrared Properties of Starburst Galaxies from Spitzer-IRS Spectroscopy, ApJ, 2006, 653, 1129 - 1144
- Brown et al. (2014) Brown, M. J. I., Moustakas, J., Smith, J. -D. T. et al. An Atlas of Galaxy Spectral Energy Distributions from the Ultraviolet to the Mid-infrared. ApJS 2014, 212, 18 - 35
- Brown et al. (2019) Brown, A., Nayyeri, H, Cooray A. et al. Infrared Contributions of X-Ray Selected Active Galactic Nuclei in Dusty Star-forming Galaxies. ApJ 2019, 871, 87 - 100
- Buchanan et al. (2006) Buchanan, C. L., Gallimore, J. F., O’Dea, C. P. et al. Spitzer IRS Spectra of a Large Sample of Seyfert Galaxies: A Variety of Infrared Spectral Energy Distributions in the Local Active Galactic Nucleus Population. AJ 2006, 132, 401 - 409
- Buchner et al. (2019) Buchner, J., Brightman, M., Nandra, K., Nikutta, R. & Bauer, F. E. X-ray spectral and eclipsing model of the clumpy obscurer in active galactic nuclei. A&A 2019, 629, 16 - 29
- Burbidge & Stein (1970) Burbidge, G. R. & Stein, W. A. Cosmic Sources of Infrared Radiation. ApJ 1970, 160, 573 - 593
- Burtscher et al. (2009) Burtscher, L., Jaffe, W., Raban, D. et al. Dust Emission from a Parsec-Scale Structure in the Seyfert 1 Nucleus of NGC 4151. ApJL 2009, 705, 53 - 57
- Cackett et al. (2021) Cackett, E. M., Bentz, Misty C., & Kara, E. Reverberation mapping of active galactic nuclei: from X-ray corona to dusty torus. iScience, 2021, 24, 102557
- Calistro Rivera et al. (2016) Calistro Rivera, G., Lusso, E., Hennawi, J. F., & Hogg, D. W. AGNfitter: A Bayesian MCMC Approach to Fitting Spectral Energy Distributions of AGNs. ApJ 2016, 833, 98 - 117
- Calistro Rivera et al. (2021) Calistro Rivera, G., Alexander, D. M., Rosario, D. J. et al. The multiwavelength properties of red QSOs: Evidence for dusty winds as the origin of QSO reddening. A&A 2021, 649, A102 - A122
- Calzetti (2013) Calzetti, D. Star Formation Rate Indicators. in Secular Evolution of Galaxies, J. Falcón-Barroso & J. H. Knapen, Eds, Cambridge University Press: Cambridge, UK, 2013, 419 - 459
- Cameron et al. (1993) Cameron, M., Storey, J. W. V., Rotaciuc, Valentin et al. Subarcsecond Mid-Infrared Imaging of Warm Dust in the Narrow-Line Region of NGC 1068. ApJ 1993, 419, 136 - 150
- Carroll et al. (2021) Carroll, C. M., Hickox, R. C., Masini, A. et al. A Large Population of Luminous Active Galactic Nuclei Lacking X-Ray Detections: Evidence for Heavy Obscuration? ApJ 2021, 908, 185 - 196
- Ciesla et al. (2015) Ciesla, L., Charmandaris, V., Georgakakis, A. et al. Constraining the properties of AGN host galaxies with spectral energy distribution modelling. A&A 2015, 576, 10 - 28
- Clavel et al. (1989) Clavel, J., Wamsteker, W., & Glass, I. S. Hot Dust on the Outskirts of the Broad-Line Region in Fairall 9. ApJ 1989, 337, 236 - 250
- Cleary et al. (2007) Cleary, K., Lawrence, C. R., Marshall, J. A., Hao, L., & Meier, D. Spitzer Observations of 3C Quasars and Radio Galaxies: Mid-Infrared Properties of Powerful Radio Sources, ApJ, 2007, 660, 117 - 145
- Cutri et al. (2000) Cutri, R. M., Nelson, B. O., Huchra, J. P., & Smith, P. S. The 2MASS Red AGN Survey. Bul. AAS 2000, 197, ID 74.08
- da Cunha et al. (2008) da Cunha, E., Charlot, S., & Elbaz, D. A simple model to interpret the ultraviolet, optical and infrared emission from galaxies. MNRAS 2008, 388, 1595 - 1617
- Dahmer-Hahn et al. (2022) Dahmer-Hahn, L. G., Riffel, R., Rodríguez-Ardila, A. et al. Stellar populations in local AGNs: evidence for enhanced star formation in the inner 100 pc. MNRAS 2022, 509, 4653 - 4668
- Dai et al. (2018) Dai, Y. S., Wilkes, B. J., Bergeron, J. et al. Is there a relationship between AGN and star formationin IR-bright AGNs? MNRAS 2018, 478, 4238 - 4254
- Dale et al. (2017) Dale, D. A., Cook, D. O., Roussel, H. et al. Updated 34-band Photometry for the SINGS/KINGFISH Samples of Nearby Galaxies. ApJ 2017, 837, 90 -109
- de Grijp et al. (1985) de Grijp, M. H. K., Miley, G. K., Lub, J., & de Jong, T. Infrared Seyferts: a new population of active galaxies? Nature 1985, 314, 240 - 242
- Del Moro et al. (2016) Del Moro, A., Alexander, D. M., Bauer, F. E. et al. Mid-infrared luminous quasars in the GOODS-Herschel fields: a large population of heavily obscured, Compton-thick quasars at z2. MNRAS 2016, 456, 2105 -2125
- Deo et al. (2009) Deo, R. P., Richards, G. T., Crenshaw, D. M., & Kraemer, S. B. The Mid-Infrared Continua of Seyfert Galaxies. ApJ 2009, 705, 14 - 31
- De Rossi et al. (2018) De Rossi, M. E., Rieke, G. H., Shivaei, I., Bromm, V., & Lyu, J. The Far-infrared Emission of the First Massive Galaxies. ApJ 2018, 869, 4 - 17
- Diamond-Stanic & Rieke (2010) Diamond-Stanic, A., & Rieke, G. H. The Effect of Active Galactic Nuclei on the Mid-infrared Aromatic Features. ApJ 2010, 724, 140 - 153
- Diamond-Stanic & Rieke (2012) Diamond-Stanic, A., & Rieke, G. H. The Relationship between Black Hole Growth and Star Formation in Seyfert Galaxies. ApJ 2012, 746, 168- 181
- Donley et al. (2007) Donley, J. L., Rieke, G. H., Pérez-González, P. G., Rigby, J. R., & Alonso-Herrero, A. Spitzer Power-Law Active Galactic Nucleus Candidates in the Chandra Deep Field-North. ApJ 2007, 660, 167 - 190
- Donley et al. (2008) Donley, J. L., Rieke, G. H., Pŕez-González, P. G., & Barro, G. Spitzer’s Contribution to the AGN Population. ApJ 2008, 687, 111 - 132
- Donley et al. (2012) Donley, J. L., Koekemoer, A. M., Brusa, M. et al. Identifying Luminous Active Galactic Nuclei in Deep Surveys: Revised IRAC Selection Criteria. ApJ 2012, 748, 142 - 163
- Dors et a. (2021) Dors, O. L., Contini, M., Riffel, R. A. et al. Chemical abundances of Seyfert 2 AGNs - IV. Composite models calculated by photoionization + shocks. MNRAS 2021, 501, 1370 - 1383
- Durré & Mould (2018) Durré, M. & Mould, J. The AGN Ionization Cones of NGC 5728. I. Excitation and Nuclear Structure. ApJ 2018, 867, 149 - 174
- Eisenhardt et al. (2012) Eisenhardt, P. R. M., Wu, J., Tsai, C.-W. et al. The First Hyper-luminous Infrared Galaxy Discovered by WISE. ApJ 2012, 755, 173 - 183
- Elitzur (2008) Elitzur, M. The toroidal obscuration of active galactic nuclei. New Ast. Rev. 2008, 52, 274 - 288
- Elitzer (2012) Elitzur, M. On the Unification of Active Galactic Nuclei. ApJ 2012, 747, L33 - L35
- Elmer et al. (2020) Elmer, E., Almaini, O., Merrifield, M., et al. Long-term NIR variability in the UKIDSS Ultra Deep Survey: a new probe of AGN activity at high redshift, MNRAS, 2020, 493, 3026 - 3035
- Elvis et al. (1994) Elvis, M., Wilkes, B. J., McDowell, J. C. et al. Atlas of Quasar Energy Distributions. ApJS 1994, 95, 1 - 67
- Esquej et al. (2014) Esquej, P., Alonso-Herrero, A., González-Martín, O. et al. Nuclear Star Formation Activity and Black Hole Accretion in Nearby Seyfert Galaxies. ApJ 2014, 780, 86 -100
- Fan et al. (2016) Fan, Lulu, Han, Yunkun, Nikutta, R., Drouart, G. & Knudsen, K. K. Infrared Spectral Energy Distribution Decomposition of WISE-selected, Hyperluminous Hot Dust-obscured Galaxies. ApJ 2016, 823, 107 - 123
- Finnerty et al. (2020) Finnerty, L., Larson, K., Soifer, B. T. et al. Fast Outflows in Hot Dust-obscured Galaxies Detected with Keck/NIRES. ApJ 2020, 905, 16 - 35
- Fritz et al. (2006) Fritz, J., Franceschini, A., & Hatziminaoglou, E. Revisiting the infrared spectra of active galactic nuclei with a new torus emission model. MNRAS, 2006, 366, 767 - 786
- Fuller et al. (2019) Fuller, L., Lopez-Rodriguez, E., Packham, C., et al. SOFIA/FORCAST resolves 30-40 m extended dust emission in nearby active galactic nuclei, MNRAS, 2019, 483, 3404 - 3419
- Gámez Rosas et al. (2022) Gámez Rosas, V., Jacob W. Isbell, J. W., Jaffe, W. et al. Thermal imaging of dust hiding the black hole in NGC 1068. Nature 2022, 403 - 407
- Gandhi et al. (2009) Gandhi, P., Horst, H., Smette, A. et al. Resolving the mid-infrared cores of local Seyferts. A&A, 2009 502, 457 - 472
- García-Bernete et al. (2019) García-Bernete, I., Ramos Almeida, C., Alonso-Herrero, A., et al. Torus model properties of an ultra-hard X-ray selected sample of Seyfert galaxies, MNRAS, 2019, 486, 4917 - 4935
- García-Burillo et al. (2019) García-Burillo, S., Combes, F., Ramos Almeida, C. et al. ALMA images the many faces of the NGC 1068 torus and its surroundings. A&A 2019, 632, 61 - 88
- García-Burillo et al. (2021) García-Burillo, S., Alonso-Herrero, A., Ramos Almeida, C. et al. The Galaxy Activity, Torus, and Outflow Survey (GATOS). I. ALMA images of dusty molecular tori in Seyfert galaxies. A&A 2021, 652, A98 - A137
- García-González et al. (2016) García-González, J., Alonso-Herrero, A., Hernán-Caballero, A. et al. The nuclear and integrated far-infrared emission of nearby Seyfert galaxies. MNRAS 2016, 458, 4512 – 4529
- García-González et al. (2015) García-González, J., Alonso-Herrero, A., Pérez-González, P. G., et al. Selection of AGN candidates in the GOODS-South Field through Spitzer/MIPS 24 m variability, MNRAS, 2015, 446, 3199 - 3223
- García-González et al. (2017) García-González, J., Alonso-Herrero, A., Hönig, S. F. et al. A mid-infrared statistical investigation of clumpy torus model predictions. MNRAS 2017, 470, 2578 - 2598
- Gaskell (2008) Gaskell, C. M. Accretion Disks and the Nature and Origin of AGN Continuum Variability. The Nuclear Region, Host Galaxy and Environment of Active Galaxies (Eds. Erika Benítez, Irene Cruz-González, & Yair Krongold) 2008, 32, 1 - 11
- González-Martín et al. (2019) González-Martín, O., Masegosa, J. García-Bernete, I. et al. Exploring the Mid-infrared SEDs of Six AGN Dusty Torus Models. II. The Data. ApJ 2019, 884, 11 - 33
- Gravity Collaboration (2020a) Gravity Collaboration, Dexter, J., Shangguan, J., et al. The resolved size and structure of hot dust in the immediate vicinity of AGN. A&A 2020, 635, 92 - 105
- Gravity Collaboration (2020b) Gravity Collaboration, Pfuhl, O., Davies, R. et al. An image of the dust sublimation region in the nucleus of NGC 1068. A&A 2020, 634, 1 - 12
- Gravity Collaboration (2021) Gravity Collaboration, Amorim, A., Bauböck, M. et al. The central parsec of NGC 3783: a rotating broad emission line region, asymmetric hot dust structure, and compact coronal line region. A&A 2021, 648,117 - 140
- Güver Özel (2009) Güver, T., & Özel, F. The relation between optical extinction and hydrogen column density in the Galaxy. MNRAS 2009, 400, 2050 - 2053
- Haas et al. (2008) Haas, M., Willner, S. P., Heymann, F., et al. Near- and Mid-Infrared Photometry of High-Redshift 3CR Sources, ApJ, 2008, 688, 122 - 127
- Hagan et al. (2021) Hagan, J. B., Rieke, G. H., Fox, O. D. et al. Cosmic-ray-related Signals from Detectors in Space: The Spitzer/IRAC Si:As IBC Devices. PASP 2021 133, 40 - 70
- Hainline et al. (2014) Hainline, K. N., Hickox, R. C., Carroll, C. M. et al. A Spectroscopic Survey of WISE-selected Obscured Quasars with the Southern African Large Telescope. ApJ 2014, 795, 124 - 142
- Hamann et al. (2017) Hamann, F., Zakamska, N. L., Ross, N. et al. Extremely red quasars in BOSS. MNRAS 2017, 464, 3431 - 3463
- Hao et al. (2011) Hao, H., Elvis, M., Civano, F., & Lawrence, A. Hot-dust-poor Quasars in Mid-infrared and Optically Selected Samples. ApJ 2011, 733, 108 - 117
- Hatcher et al. (2021) Hatcher, C., Kirkpatrick, A., Fornasini, F. et al. Where Do Obscured AGN Fit in a Galaxy’s Timeline? AJ 2021, 162, 65 - 77
- Heckman & Best (2014) Heckman, T. M., & Best, P. N. The Coevolution of Galaxies and Supermassive Black Holes: Insights from Surveys of the Contemporary Universe. ARAA 2014, 52, 589 - 660
- Hernán-Caballero et al. (2015) Hernán-Caballero, A., Alonso-Herrero, A., Hatziminaoglou, E., et al. Resolving the AGN and Host Emission in the Mid-infrared Using a Model-independent Spectral Decomposition, ApJ, 2015, 803, 109 -
- Hernan-Caballero et al. (2016) Hernán-Caballero, A., Hatziminaoglou, E., Alonso-Herrero, A., & Mateos, S. The near-to-mid infrared spectrum of quasars. MNRAS 2016, 463, 2064 - 2078
- Hernán-Caballero et al. (2020) Hernán-Caballero, A., Spoon, H. W. W., Alonso-Herrero, A. et al. Extinction in the 11.2 µm PAH band and the low L11.2/LIR in ULIRGs. MNRAS 2020, 497, 4614 - 4625
- Hickox et al. (2007) Hickox, R. C., Jones, C., Forman, W. R., et al. A Large Population of Mid-Infrared-selected, Obscured Active Galaxies in the Boötes Field. ApJ 2007, 671, 1365 - 1387
- Hickox et al. (2017) Hickox, R. C., Myers, A. D., Greene, J. E., et al. Composite Spectral Energy Distributions and Infrared-Optical Colors of Type 1 and Type 2 Quasars, ApJ, 2017, 849, 53 -
- Hickox & Alexander (2018) Hickox, R. C., & Alexander, D. M. Obscured Active Galactic Nuclei. ARAA 2018, 56, 625 - 671
- Hönig (2019) Hönig, S. F. Redefining the Torus: A Unifying View of AGNs in the Infrared and Submillimeter. ApJ 2019, 884, 171 - 183
- Hönig et al. (2010) Hönig, S. F., Kishimoto, M., Gandhi, P. et al. The dusty heart of nearby active galaxies. I. High-spatial resolution mid-IR spectro-photometry of Seyfert galaxies. A&A 2010, 515, 23 - 44
- Hönig & Kishimoto (2011) Hönig, S. F. & Kishimoto, M. Constraining properties of dusty environments by infrared variability. A&A 2011, 534, 121 - 128
- Hönig et al. (2013) Hönig, S. F., Kishimoto, M., Tristram, K. R. W. et al. Dust in the Polar Region as a Major Contributor to the Infrared Emission of Active Galactic Nuclei. ApJ 2013, 771, 87 - 100
- Hönig et al. (2014) Hönig, S. F., Watson, D., Kishimoto, M., & Hjorth, J. A dust-parallax distance of 19 megaparsecs to the supermassive black hole in NGC 4151. Nature 2014, 515, 528 - 530
- Hönig & Kishimoto (2017) Hönig, S. F., & Kishimoto, M. Dusty Winds in Active Galactic Nuclei: Reconciling Observations with Models. ApJL 2017, 838, 20 - 25
- Hopkins et al. (2006) Hopkins, P. F., Hernquist, L., Cox, T. J., et al. A Unified, Merger-driven Model of the Origin of Starbursts, Quasars, the Cosmic X-Ray Background, Supermassive Black Holes, and Galaxy Spheroids, ApJS, 2006, 163, 1 - 49
- Hopkins et al. (2012) Hopkins, P. F., Hayward, C. C., Narayanan, D., & Hernquist, L. The origins of active galactic nuclei obscuration: the ’torus’ as a dynamical, unstable driver of accretion, MNRAS, 2012, 420, 320 - 339
- Hopkins et al. (2016) Hopkins, P. F., Torrey, P., Faucher-Giguère, C.-A., Quataert, E., & Murray, N. Stellar and quasar feedback in concert: effects on AGN accretion, obscuration, and outflows, MNRAS, 2016, 458, 816 - 831
- Hony et al. (2011) Hony, S., Kemper, F., Woods, P. M., et al. The Spitzer discovery of a galaxy with infrared emission solely due to AGN activity. A&A2011, 531, 137 - 143
- Horne et al. (2004) Horne, K., Peterson, B. M., Collier, S. J. & Netzer, Hagai Observational Requirements for High-Fidelity Reverberation Mapping. PASP 2004, 116, 465 - 476
- Hunt et al. (1994) Hunt, L. K., Zhekov, S., Salvati, M., Mannucci, F., & Stanga, R. M. Limits on the short-timescale near-infrared variability of Seyfert 1 nuclei. A&A 1994, 292, 67 - 75
- Hunt et al. (2010) Hunt, L. K., Thuan, T. X., Izotov, Y. I., & Sauvage, M. The Spitzer View of Low-Metallicity Star Formation. III. Fine-Structure Lines, Aromatic Features, and Molecules. ApJ 2010, 712, 164 - 187
- Hviding et al. (2018) Hviding, R. E., Hickox, R. C., Hainline, K. N. et al. Characterizing the WISE-selected heavily obscured quasar population with optical spectroscopy from the Southern African Large Telescope. MNRAS 2018, 474, 1955 - 1969
- Hviding et al. (2022) Hviding, R. E., Hainline, K. N., Rieke, M. J. et al. A New Infrared Criterion for Selecting Active Galactic Nuclei to Lower Luminosities. AJ 2022, in press
- Ichikawa et al. (2019) Ichikawa, K., Ricci, C., Ueda, Y., et al. BAT AGN Spectroscopic Survey. XI. The Covering Factor of Dust and Gas in Swift/BAT Active Galactic Nuclei, ApJ, 2019, 870, 31 -
- İkiz et al. (2020_) İkiz, T., Peletier, R. F., Barthel, P. D., & Yeşilyaprak, C. Infrared-detected AGNs in the local Universe. A&A 2020, 640, 68 - 77
- Isbell et al. (2021) Isbell, J. W., Leonard Burtscher, L., Asmus, D. et al. Subarcsecond Mid-infrared View of Local Active Galactic Nuclei. IV. The L- and M-band Imaging Atlas. ApJ 2021, 910, 104 - 123
- Isbell et al. (2022) Isbell, J. W., Meisenheimer, K., Pott J.-U. et al. Imaging the Circumnuclear Dust in Circinus. IR2022 2022, in “IR2022: An Infrared Bright Future for Ground-based IR Observatories in the Era of JWST"
- Iwasawa et al. (2011) Iwasawa, K., Sanders, D. B., Teng, S. H. et al. C-GOALS: Chandra observations of a complete sample of luminous infrared galaxies from the IRAS Revised Bright Galaxy Survey. A&A 2011, 529, 106 - 155
- Jarrett et al. (2011) Jarrett, T. H., Cohen, M., Masci, F. et al. The Spitzer-WISE Survey of the Ecliptic Poles. ApJ 2011, 735, 112 - 144
- Jensen et al. (2017) Jensen, J. J., Hönig, S. F., Rakshit, S. et al. PAH features within few hundred parsecs of active galactic nuclei. MNRAS 2017, 470, 3071 - 3094
- Ji et al. (2022) Ji, Z., Giavalisco, M., Kirkpatrick, A. et al. AGN Selection Methods Have Profound Impacts on the Distributions of Host-galaxy Properties. ApJ 2022, 925, 74 - 99
- Jiang et al. (2010) Jiang, L., Fan, X., Brandt, W. N., et al. Dust-free quasars in the early Universe. Nature 2010, 464, 380 - 383
- Jun et al. (2015) Jun, H. D., Stern, D., Graham, M. J. et al. Infrared Time Lags for the Periodic Quasar PG 1302-102. ApJL 2015, 814, 12 - 16
- Jun et al. (2020) Jun, H. D., Assef, R. J., Bauer, F. E. et al. Spectral Classification and Ionized Gas Outflows in z2 WISE-selected Hot Dustobscured Galaxies. ApJ 2020, 888, 110 - 131
- Kalfountzou (2015) Kalfountzou, E. The evolution of AGN and their host galaxies. Ph.D. thesis, University of Hertfordshire, UK, July, 2015
- Khrykin et al. (2021) Khrykin, I., Hennawi, J. F., Worseck, G., & Davies, F. B. The first measurement of the quasar lifetime distribution. MNRAS 2021, 505, 649 - 662
- Kirkpatrick et al. (2013) Kirkpatrick, A., Pope, A., Charmandaris, V. et al. GOODS-Herschel: Separating High-redshift Active Galactic Nuclei and Star-forming Galaxies Using Infrared Color Diagnostics. ApJ 2013, 763, 123 - 134
- Kirkpatrick et al. (2015) Kirkpatrick, A., Pope, A., Sajina, A., et al. The Role of Star Formation and an AGN in Dust Heating of z = 0.3-2.8 Galaxies. I. Evolution with Redshift and Luminosity, ApJ, 2015, 814, 9 -
- Kirkpatrick et al. (2017) Kirkpatrick, A., Alberts, S., Pope, A. et al. The AGN-Star Formation Connection: Future Prospects with JWST. ApJ 2017, 849, 111 - 125
- Kishimoto et al. (2008) Kishimoto, M., Antonucci, R., Blaes, O. et al. The characteristic blue spectra of accretion disks in quasars as uncovered in the infrared. Nature 2008 454, 492- 494
- Kocevski et al. (2012) Kocevski, D. D., Faber, S. M., Mozena, M. et al. CANDELS: Constraining the AGN-Merger Connection with Host Morphologies at z2. ApJ 2012, 744, 148 - 156
- Kocevski et al. (2015) Kocevski, D. D., Brightman, M., Nandra, K. et al. Are Compton-thick AGNs the Missing Link between Mergers and Black Hole Growth? ApJ 2015, 814, 104 - 115
- Koshida et al. (2009) Koshida, S., Yoshii, Y., Kobayashi, Y. et al. Variation of Inner Radius of Dust Torus in NGC4151. ApJL 2009, 700, 109 - 113
- Koshida et al. (2014) Koshida, S., Minezaki, T., Yoshii, Y. et al. Reverberation Measurements of the Inner Radius of the Dust Torus in 17 Seyfert Galaxies, ApJ 2014, 788, 159 - 179
- Kotilainen et al. (1992) Kotilainen, J. K., Ward, M. J., Boisson, C., Depoy, D. L., & Smith, M. G. Near-infrared imaging of hard X-ray selected active galaxies - II. The non-stellar continuum. MNRAS 1992, 256, 149 - 165
- Kozłowski et al. (2010) Kozłowski, S., Kochanek, C. S., Stern, D., et al. Mid-infrared Variability from the Spitzer Deep Wide-field Survey. ApJ 2010, 716, 530 - 543
- Kozłowski et al. (2016) Kozłowski, S., Kochanek, C. S., Ashby, M. L. N., et al. Quasar Variability in the Mid-Infrared. ApJ 2016, 817, 119 - 132
- Kozlowski (2017) Kozłowski, S. Limitations on the recovery of the true AGN variability parameters using damped random walk modeling. A&A 2017, 597,128 - 134
- Krolik & Begelman (1988) Krolik, J. H., & Begelman, M. C. Molecular Tori in Seyfert Galaxies: Feeding the Monster and Hiding It. ApJ 1988, 329, 702 - 711
- Lacy et al. (2004) Lacy, M., Storrie-Lombardi, L. J., Sajina, A. et al. Obscured and Unobscured Active Galactic Nuclei in the Spitzer Space Telescope First Look Survey. ApJS 2004, 154, 166 - 169
- Lacy & Sajina (2020) Lacy, M. & Sajina, A. Active galactic nuclei as seen by the Spitzer Space Telescope. NatAs 2020, 4, 352 - 363
- Laha et al. (2020) Laha, S., Markowitz, A. G., Krumpe, M. et al. The Variable and Non-variable X-Ray Absorbers in Compton-thin Type II Active Galactic Nuclei. ApJ 2020, 897, 55 - 120
- Lam et al. (2019) Lam, A., Malkan, M., & Wright, E. Far-infrared dust properties of highly dust-obscured active galactic nuclei from the AKARI and WISE all-sky surveys. PASJ 2019, 71, 9 - 24
- LaMassa et al. (2015) LaMassa, S. M., Cales, S., Moran, E. C. et al. The Discovery of the First “Changing Look” Quasar: New Insights Into the Physics and Phenomenology of Active Galactic Nucleus. ApJ 2015,800, 144 - 153
- LaMassa et al. (2019) LaMassa, S. M., Yaqoob, T., Boorman, P. G. et al. NuSTAR Uncovers an Extremely Local Compton-thick AGN in NGC 4968. ApJ 2019, 887, 173 - 186
- Landt et al. (2019) Landt, H., Ward, M. J., Kynoch, D. et al. The first spectroscopic dust reverberation programme on active galactic nuclei: the torus in NGC 5548. MNRAS 2019, 489, 1572 - 1589
- Lani et al. (2017) Lani, C., Netzer, H., & Lutz, D. Intrinsic AGN SED & black hole growth in the Palomar-Green quasars. MNRAS 2017, 471, 59 - 79
- Laor & Draine (1993) Laor, A., & Draine, B. T. Spectroscopic Constraints on the Properties of Dust in Active Galactic Nuclei, ApJ, 1993, 402, 441 -
- Laurent et al. (2000) Laurent, O., Mirabel, I. F., Charmandaris, V. et al. Mid-infrared diagnostics to distinguish AGNs from starbursts. A&A 2000, 359, 887 - 899
- Leftley et al. (2018) Leftley, J. H., Tristram, K. R. W., Hönig, S. F. et al. New Evidence for the Dusty Wind Model: Polar Dust and a Hot Core in the Type-1 Seyfert ESO 323-G77. ApJ 2018, 862, 17 - 31
- Leipski et al. (2005) Leipski, C., Haas, M., Meusinger, H. et al. The ISO-2MASS AGN survey: on the type-1 sources. A&A 2005, it 440, L5 - L8
- Leipski et al. (2014) Leipski, C., Meisenheimer, K., Walter, F. et al. Spectral Energy Distributions of QSOs at z > 5: Common Active Galactic Nucleus-heated Dust and Occasionally Strong Star-formation. ApJ, 2014, 785, 154 - 175
- Leja et a. (2017) Leja, J., Johnson, B. D., Conroy, C., van Dokkum, P. G. & Byler, N. Deriving Physical Properties from Broadband Photometry with Prospector: Description of the Model and a Demonstration of its Accuracy Using 129 Galaxies in the Local Universe. ApJ, 2017, 837, 170 - 204
- Leja et al. (2018) Leja, J., Johnson, B. D., Conroy, C., et al. Hot Dust in Panchromatic SED Fitting: Identification of Active Galactic Nuclei and Improved Galaxy Properties. ApJ 2018 854 62 - 80
- McLeod & Rieke (1994) McLeod, K. K., & Rieke, G. H. Near-Infrared Imaging of Low-Redshift Quasar Host Galaxies. II. High-Luminosity Quasars, ApJ, 1994, 431, 137 -
- Levenson et al. (2007) Levenson, N. A., Sirocky, M. M., Hao, L. et al. Deep Mid-Infrared Silicate Absorption as a Diagnostic of Obscuring Geometry toward Galactic Nuclei. ApJL 2007, 654, L45 - L48
- Li (2007) Li, A. Dust in Active Galactic Nuclei, The Central Engine of Active Galactic Nuclei, ASP Conf. Ser. 2007, 373, 561 - 573
- Li et al. (2020) Li, J., Xue, Y., Sun, M. et al. Piercing through Highly Obscured and Compton-thick AGNs in the Chandra Deep Fields. II. Are Highly Obscured AGNs the Missing Link in the Merger-triggered AGN-Galaxy Coevolution Models? ApJ 2020, 903, 49 - 66
- Lira et al. (2011) Lira, P., Arévalo, P., Uttley, P., McHardy, I. M. M., & Videla, L. Optical and near-IR long-term monitoring of NGC 3783 and MR 2251-178: evidence for variable near-IR emission from thin accretion discs. MNRAS 2011, 415, 1290 - 1303
- Lira et al. (2015) Lira, P., Arévalo, P., Uttley, P., McHardy, I. M. M., & Videla, L. Long-term monitoring of the archetype Seyfert galaxy MCG-6-30-15: X-ray, optical and near-IR variability of the corona, disc and torus. MNRAS 2015, 454, 368 - 379
- López-Gonzaga et al. (2016) López-Gonzaga, N., Burtscher, L., Tristram, K. R. W., Meisenheimer, K., & Schartmann, M. Mid-infrared interferometry of 23 AGN tori: On the significance of. polar-elongated emission. A&A 2016, 591, 47 - 57
- Lopez-Rodriguez et al. (2018) Lopez-Rodriguez, E., Fuller, L., Alonso-Herrero, A. et al. The Emission and Distribution of Dust of the Torus of NGC 1068. ApJ 2018, 859, 99 - 108
- Low & Kleinmann (1968) Low, J., & Kleinmann, D. E. Proceedings of the Conference on Seyfert Galaxies and Related Objects: 17. Infrared Observations of Seyfert Galaxies, Quasistellar Sources, and Planetary Nebulae, AJ, 1968, 73, 868 -
- Lyu et al. (2022a) Lyu, B., Wu Q., Yan, Z., Yu, W., & Liu, H. WISE view of changing-look AGNs: evidence for a transitional stage of AGNs. ApJ 2022, 927, 227 - 240
- Lyu et al. (2016) Lyu, J., Rieke, G. H., & Alberts, S. The Contribution of Host Galaxies to the Infrared Energy Output of z5.0 Quasars. ApJ 2016, 816, 85 - 107
- Lyu & Rieke (2017) Lyu, J., & Rieke, G. H. The Intrinsic Far-infrared Continua of Type-1 Quasars. ApJ 2017, 841, 76 - 89
- Lyu et al. (2017b) Lyu, J., Rieke, G. H., & Shi, Yong Dust-deficient Palomar-Green Quasars and the Diversity of AGN Intrinsic IR Emission. ApJ 2017, 835, 257 - 283
- Lyu & Rieke (2018) Lyu, J., & Rieke, G. H. Polar Dust, Nuclear Obscuration, and IR SED Diversity in Type-1 AGNs. ApJ 2018, 866, 92 - 119
- Lyu et al. (2019) Lyu, J., Rieke, G. H., & Smith, P. S. Mid-IR Variability and Dust Reverberation Mapping of Low-z Quasars. I. Data, Methods, and Basic Results. ApJ 2019, 886, 33 - 65
- Lyu & Rieke (2021) Lyu, J., & Rieke, G. H. The Dusty Heart of NGC 4151 Revealed by 1-40 m Reverberation Mapping and Variability: A Challenge to Current Clumpy Torus Models. ApJ 2021, 912, 126 - 155
- Lyu et al. (2022a) Lyu, J., Alberts, S., Rieke, G. H., & Rujopakarn, W. AGN Selection and Demographics in GOODS-S/HUDF from X-ray to Radio. ApJ, submitted 2022
- Lyu & Rieke (2022b) Lyu, J., & Rieke, G. H. Polar Dust Emission in Quasar IR SEDs and Its Correlation with Narrow Line Regions. ApJ, submitted
- Lyu & Rieke (2022c) Lyu, J., & Rieke, G. H. Infrared Attentuation Curve for AGNs. in preparation
- Lyutyi et al. (1998) Lyuty, V. M., Taranova, O. G., & Shenavrin, V. I. Nuclear variability of NGC 4151 in UVB and JHKL: A new cycle of activity. Ast. Let. 1998, 24, 199 - 205
- Maiolino et al. (1995) Maiolino, R., Ruiz, M., Rieke, G. H. & Keller, L. D. New Constraints on the Unified Model of Seyfert Galaxies. ApJ 1995, 446, 561 - 573
- Maiolino et al. (2001) Maiolino, R., Marconi, A., Salvati, M. et al. Dust in active nuclei. I. Evidence for “anomalous” properties. A&A 2001, 365, 28 - 36
- Maiolino et al. (2007) Maiolino, R., Shemmer, O., Imanishi, M., et al. Dust covering factor, silicate emission, and star formation in luminous QSOs, A&A, 2007, 468, 979 - 992
- Maiolino & Manucci (2019) Maiolino, R., & Mannucci, F. De re metallica: the cosmic chemical evolution of galaxies. ARAA 2019, 27, 3 - 141
- Mandal et al. (2018) Mandal, A. K., Rakshit, S., Kurian, K S. et al. Determination of the size of the dust torus in H0507+164 through optical and infrared monitoring. MNRAS 2018, 475, 5330 -5337
- Mandal et al. (2021) Mandal, A. K., Rakshit, S., Stalin, C. S. et al. Dust reverberation mapping of Z229-15. MNRAS 2021, 501, 3905 - 3915
- Mannucci et al. (2001) Mannucci, F., Basile, F., Poggianti, B. M. et al. Near-infrared template spectra of normal galaxies: k-corrections, galaxy models and stellar populations. MNRAS 2001, 326, 745 - 758
- Markowitz et al. (2014) Markowitz, A. G., Krumpe, M., & Nikutta, R. First X-ray-based statistical tests for clumpy-torus models: eclipse events from 230 years of monitoring of Seyfert AGN. MNRAS 2014, 439, 1403 - 1458
- Marshall et al. (2018) Marshall, J. A., Elitzur, M., Armus, L., Diaz-Santos, T., & Charmandaris, V. The Nature of Deeply Buried Ultraluminous Infrared Galaxies: A Unified Model for Highly Obscured Dusty Galaxy Emission. ApJ 2018, 858, 59 - 78
- Martínez-Paredes et al. (2019) Martínez-Paredes, M., Aretxaga, I., González-Martín, O. et al. Quantifying Star Formation Activity in the Inner 1 kpc of Local MIR Bright QSOs. ApJ 2019, 871, 190 - 197
- Masoura et al. (2021) Masoura, V. A., Mountrichas, G., Georgantopoulos, I., & and Plionis, M. Relation between AGN type and host galaxy properties. A&A 2021, 646, 167 - 177
- Mateos et al. (2012) Mateos, S., Alonso-Herrero, A., Carrera, F. J. et al. Using the Bright Ultrahard XMM-Newton survey to define an IR selection of luminous AGN based on WISE colours. MNRAS 2012, 426, 3271 - 3281
- McKinney et al. (2021) McKinney, J., Hayward, C. C., Rosenthal, L. J. et al. Dust-enshrouded AGNs Can Dominate Host-galaxy-scale Cold Dust Emission. ApJ 2021, 951, 55 - 64
- Meidt et al. (2014) Meidt, S. E., Schinnerer, E., van de Ven, G. et al. Reconstructing the Stellar Mass Distributions of Galaxies Using S4G IRAC 3.6 and 4.5 m Images. II. The Conversion from Light to Mass. ApJ 2014, 788, 144 - 155
- Mélendez et al. (2008) Meléndez, M., Kraemer, S. B., Schmitt, H. R. et al. Constraining the Active Galactic Nucleus Contribution in a Multiwavelength Study of Seyfert Galaxies. ApJ 2008, 689, 95 - 107
- Mendez et al. (2013) Mendez, A. J., Coil, A. L., Aird, J., et al. PRIMUS: Infrared and X-Ray AGN Selection Techniques at 0.2 < z < 1.2. ApJ 2013, 770, 40 - 64
- Messias et al. (2012) Messias, H., Afonso, J., Salvato, M. et al. A New Infrared Color Criterion for the Selection of 0 < z < 7 AGNs: Application to Deep Fields and Implications for JWST Surveys. ApJ 2012, 754, 120 - 135
- Miley et al. (1985) Miley, G. K., Neugebauer, G., & Soifer, B. T. IRAS observations of Seyfert galaxies. ApJL 1985, 293, 11 - 14
- Minezaki et al. (2004) Minezaki, T., Yoshii, Y., Kobayashi, Y et al. Inner Size of a Dust Torus in the Seyfert 1 Galaxy NGC 4151. ApJL 2004, 600, 35 - 38
- Minezaki et al. (2019) Minezaki, T., Yoshii, Y., Kobayashi, Y. et al. Reverberation Measurements of the Inner Radii of the Dust Tori in Quasars. ApJ 2019, 856, 150 - 173
- Mor et al. (2009) Mor, R., Netzer, H., & Elitzur, M. Dusty Structure Around Type-I Active Galactic Nuclei: Clumpy Torus Narrow-line Region and Near-nucleus Hot Dust. ApJ 2009, 705, 298 - 313
- Mor & Netzer (2012) Mor, R., & Netzer, H. Hot graphite dust and the infrared spectral energy distribution of active galactic nuclei. MNRAS 2012, 420, 526 - 541
- Mullaney et al. (2011) Mullaney, J. R., Alexander, D. M., Goulding, A. D., & Hickox, R. C. Defining the intrinsic AGN infrared spectral energy distribution and measuring its contribution to the infrared output of composite galaxies. MNRAS 2011, 414, 1082 - 1110
- Mullaney et al. (2012) Mullaney, J. R., Pannella, M., Daddi, E. et al. GOODS-Herschel: the far-infrared view of star formation in active galactic nucleus host galaxies since z3. MNRAS 2012, 419, 95 - 115
- Namekata & Umemura (2016) Namekata, D. & Umemura, M. Sub-parsec-scale dynamics of a dusty gas disc exposed to anisotropic AGN radiation with frequency-dependent radiative transfer. MNRAS 2016, 460, 980 - - 1018
- Nardini et al. (2008) Nardini, E., Risaliti, G., Salvati, M., et al. Spectral decomposition of starbursts and active galactic nuclei in 5-8 m Spitzer-IRS spectra of local ultraluminous infrared galaxies, MNRAS, 2008, 385, L130 - L134
- Nenkova et al. (2008) Nenkova, M., Sirocky, M. M., Nikutta, R., Ivezić, Ž., & Elitzur, M. AGN Dusty Tori. II. Observational Implications of Clumpiness. ApJ 2008, 685, 160 - 180
- Netzer (2015) Netzer, H. Revisiting the Unified Model of Active Galactic Nuclei. ARAA 2015, 53, 365 -408
- Netzer & Laor (1993) Netzer, H. & Laor, A. Dust in the Narrow-Line Region of Active Galactic Nuclei. ApJL 1993, 404, L51 - L54
- Netzer et al. (2007) Netzer H., Lutz, D., Schweitzer, M. et al. Spitzer Quasar and ULIRG Evolution Study (QUEST). II. The Spectral Energy Distributions of Palomar-Green Quasars. ApJ 2007, 666, 806 - 816
- Netzer et al. (2014) Netzer, H., Mor, R., Trakhtenbrot, B., Shemmer, O., & Lira, P. Star Formation and Black Hole Growth at z = 4.8. ApJ 791, 791, 34 - 48
- Netzer et al. (2016) Netzer, H., Lani, C., Nordon, R. et al. Star Formation Black Hole Growth and Dusty Tori in the Most Luminous AGNs at z=2-3.5. ApJ 2016, 819, 123 - 145
- Neugebauer et al. (1979) Neugebauer, G., Oke, J. B., Becklin, E. E., & Matthews, K. Absolute spectral energy distribution of quasi-stellar objects from 0.3 to 10 microns. ApJ 1979, 230, 79 - 94
- Neugebauer et al. (1987) Neugebauer, G., Green, R. F., Matthews, K. et al. Continuum Energy Distributions of Quasars in the Palomar-Green Survey. ApJS 1987, 63, 615 - 644
- Neugebauer & Matthews (1999) Neugebauer, G., & Matthews, K. Variability of Quasars at 10 Microns. AJ 1999, 118, 35 - 45
- Nikutta et al. (2009) Nikutta, R., Elitzur, M., & Lacy, M. On the 10 m Silicate Feature in Active Galactic Nuclei. ApJ 2009, 707, 1550 - 1559
- Nikutta et al. (2021a) Nikutta, R., Lopez-Rodriguez, E., Ichikawa, K. et al. Hypercubes of AGN Tori (HYPERCAT). I. Models and Image Morphology. ApJ, 2021a, 919, 136 - 156
- Nikutta et al. (2021b) Nikutta, R., Lopez-Rodriguez, E., Ichikawa, K. et al. Hypercubes of AGN Tori (HYPERCAT). II. Resolving the Torus with Extremely Large Telescopes. ApJ 2021b, 923, 127 - 143
- Noda et al. (2020) Noda, H., Kawamuro, T., Kokubo, M., & Minezaki, T. Dust reverberation mapping of type 2 AGN NGC 2110 realized with X-ray and 3-5 m IR monitoring. MNRAS 2020, 495, 2921 - 2929
- Oknyanskij, Lyuty, Taranova, & Shenavrin (1999) Oknyanskij, V. L., Lyuty, V. M., Taranova, O. G., & Shenavrin, V. I. Correlation between the infrared and optical variations of NGC 4151 in 30 years: Change in the sizes of the infrared source, Astronomy Letters, 1999, 25, 483 - 492
- Oknyansky et al. (2015) Oknyansky, V. L., Gaskell, C. M., & Shimanovskaya, E. V. The Relative Wavelength Independence of IR Lags in Active Galactic Nuclei: Implications for the Distribution of the Hot Dust. Odessa Ast. Pub.2015, 28, 175 - 180
- Oknyansky et al. (2018) Oknyansky, V. L., Shenavrin, V. I., Metlova, N. V., & Gaskell, C. M. Additional Support for Relative Wavelength Independence of IR Lags in NGC 4151 Over the Past Decade. Odessa Ast. Pub. 2018, 31, 94 - 99
- Osterbrock & De Robertis (1985) Osterbrock, D. E. & De Robertis, M. M. Optical spectra of IRAS "warm" galaxies. PASP 1985, 97, 1129 - 1141
- Packham et al. (2005) Packham, C., Radomski, J. T., Roche, P. F. et al. The Extended Mid-Infrared Structure of the Circinus Galaxy. ApJL 2005, 618, 17 - 20
- Padovani et al. (2017) Padovani, P., Alexander, D. M., Assef, R. J. et al. Active galactic nuclei: what’s in a name? A&ARv 2017, 25, 2 - 57
- Peletier et al. (1999) Peletier, R. F., Knapen, J. H., Shlosman, I. et al. A Subarcsecond-Resolution Near-Infrared Study of Seyfert and “Normal” Galaxies. I. Imaging Data. ApJS 1999, 125, 363 - 407
- Penston et al. (1971) Penston, M. V., Penston, M. J., Neugebauer, G. X. et al. Observations of NGC 4151 during 1970 in the optical and infra-red. MNRAS 1971, 153, 29 - 40
- Peterson et al (1995) Peterson, B. M., Pogge, R. W., Wanders, I., Smith, S. M., & Romanishin, W. Aperture Effects and Limitations on the Accuracy of Ground-Based Spectrophotometry of Active Galactic Nuclei. PASP 1995, 107, 759 - 769
- Petric et al. (2015) Petric, A. O., Ho, L. C., Flagey, N. J. M., & Scoville, N. Z. Herschel Survey of the Palomar-Green QSOs at Low Redshift. ApJS 2015, 219, 22 - 41
- Podigachoski et al. (2015) Podigachoski, P., Barthel, P. D., Haas, M., et al. Star formation in z 1 3CR host galaxies as seen by Herschel, A&A, 2015, 575, A80 -
- Polimera et al. (2018) Polimera, M., Sarajedini, V., Ashby, M. L. N., Willner, S. P., & Fazio, G. G. Morphologies of mid-IR variability-selected AGN host galaxies. MNRAS 2018, 476, 1111 - 1119
- Polletta et al. (2006) Polletta, M. del C., Wilkes, B. J., Siana, B., et al. Chandra and Spitzer Unveil Heavily Obscured Quasars in the Chandra/SWIRE Survey, ApJ, 2006, 642, 673 - 693
- Polletta et al. (2007) Polletta, M., Tajer, M., Maraschi, L., et al. Spectral Energy Distributions of Hard X-Ray Selected Active Galactic Nuclei in the XMM-Newton Medium Deep Survey, ApJ, 2007, 663, 81 - 102
- Poncelet et al. (2006) Poncelet, A., Perrin, G., & Sol, H. A new analysis of the nucleus of NGC 1068 with MIDI observations. A&A 2006, 450, 483 - 494
- Pouliasis (2019) Pouliasis, E. Identification of Active Galactic Nuclei through different selection techniques. Ph.D. Thesis, National and Kapodistrian University of Athens, Feb., 2020
- Pouliasis et al. (2020) Pouliasis, E., Mountrichas, G., Georgantopoulos, I., Ruiz, A., Yang, M., & Bonanos, A. Z. An obscured AGN population hidden in the VIPERS galaxies: identification through spectral energy distribution decomposition. MNRAS 2020, 495, 1853 - 1873
- Pozo Nũnez et al. (2015) Pozo Nuñez, F., Ramolla, M., Westhues, C., et al. The broad-line region and dust torus size of the Seyfert 1 galaxy PGC 50427. A&A 2015, 576, A73 - A83
- Prieto et al. (2010) Prieto, M. A., Reunanen, J., Tristram, K. R. W., et al. The spectral energy distribution of the central parsecs of the nearest AGN, MNRAS, 2010, 402, 724 - 744
- Radomski et al. (2002) Radomski, J. T., Piña, R. K., Packham, C. High-Resolution Mid-Infrared Morphology of Cygnus A ApJ 2002, 566, 675 - 681
- Radomski et al. (2003) Radomski, J. T., Piña, R. K., Packham, C. Resolved Mid-Infrared Emission in the Narrow-Line Region of NGC 4151. ApJ 2003, 587, 117 - 122
- Ramolla et al. (2018) Ramolla, M., Haas, M., Westhues, C. et al. Simultaneous H and dust reverberation mapping of 3C 120: Testing the bowl-shaped torus geometry. A&A 2018, 620A, A137 - A152
- Ramos Almeida & Ricci (2017) Ramos Almeida, C., & Ricci, C. Nuclear obscuration in active galactic nuclei. NatAs 2017, 1, 679 - 689
- Ramos Almeida et al. (2009) Ramos Almeida, C., Levenson, N. A., Rodríguez Espinosa, J. M., et al. The Infrared Nuclear Emission of Seyfert Galaxies on Parsec Scales: Testing the Clumpy Torus Models, ApJ, 2009, 702, 1127 - 1149
- Ramos Almeida et al. (2011) Ramos Almeida, C., Levenson, N. A., Alonso-Herrero, A. et al. Testing the Unification Model for Active Galactic Nuclei in the Infrared: Are the Obscuring Tori of Type 1 and 2 Seyferts Different?. ApJ 2011, 731, 92 - 115
- Rees et al. (1969) Rees, M. J., Silk, J. I., Werner, M. W., & Wickramasinghe, N. C. . Infrared Radiation from Dust in Seyfert Galaxies. Nature 1969, 223, 788 - 791
- Reunanen et al. (2010) Reunanen, J., Prieto, M. A., & Siebenmorgen, R. VLT diffraction-limited imaging at 11 and 18 m of the nearest active galactic nuclei. MNRAS 2010, 402, 879 - 894
- Ricci et al. (2021) Ricci, C., Privon, G. C., Pfeifle, R. W. et al. A hard X-ray view of luminous and ultra-luminous infrared galaxies in GOALS - I. AGN obscuration along the merger sequence. MNRAS 2021, 506, 5935 - 5950
- Richards et al. (2006) Richards, G. T., Lacy, M., Storrie-Lombardi, L. J. et al. Spectral Energy Distributions and Multiwavelength Selection of Type 1 Quasars. ApJS 2006, 166, 470 - 497
- Rieke & Low (1975) Rieke, G. H., & Low, F. J. The infrared spectrum of NGC 1068. ApJL 1975, 199, L13 - L17
- Rieke & Low (1975b) Rieke, G. H. & Low, F. J. Measurements of galactic nuclei at 34 microns. ApJL 1975, 200, L67 - L69
- Rieke (1978) Rieke, G. H. The infrared emission of Seyfert galaxies. ApJ 1978, 226, 550 -558
- Rieke & Lebofsky (1981) Rieke, G. H. & Lebofsky, M. J. Spectral components of NGC 4151. ApJ 1981, 250, 87 - 97
- Rieke et al. (2009) Rieke, G. H., Alonso-Herrero, A., Weiner, B. J. et al. Determining Star Formation Rates for Infrared Galaxies. ApJ 2009, 692, 556 - 573
- Rodriguez Espinosa et al. (1987) Rodriguez Espinosa, J. M., Rudy, R., & Jones, B. Star Formation in Seyfert Galaxies. ApJ 1987, 312, 555 - 565
- Roebuck et al. (2016) Roebuck.E., Sajina, A., Hayward, C. C. et al. The Role of Star Formation and AGN in Dust Heating of z=0.3-2.8 Galaxies - II. Informing IR AGN Fraction Estimates through Simulations. ApJ 2016, 833, 60 - 73
- Rosario et al. (2012) Rosario, D. J., Santini, P., Lutz, D. et al. The mean star formation rate of X-ray selected active galaxies and its evolution from z2.5: results from PEP-Herschel. A&A 2012, 545, A45 - A62
- Rosario et al. (2013) Rosario, D. J., Trakhtenbrot, B., Lutz, D. et al. The mean star-forming properties of QSO host galaxies. A&A 2013, 560, 72 - 85
- Ross et al. (2015) Ross, N. P., Hamann, F., Zakamska, N. L. et al. Extremely red quasars from SDSS, BOSS and WISE: classification of optical spectra. MNRAS 2015, 453, 3932 - 3952
- Rowan-Robinson (1995) Rowan-Robinson, M. A new model for the infrared emission of quasars. MNRAS 1995, 272, 737 - 748
- Rujopakarn et al. (2011) Rujopakarn, W., Rieke, G. H., Eisenstein, D. J., & Juneau, S. Morphology and Size Differences Between Local and High-redshift Luminous Infrared Galaxies. ApJ 2011, 726, 93 - 103
- Rujopakarn et al. (2013) Rujopakarn, W., Rieke, G. H., Weiner, B. J. et al. Mid-infrared Determination of Total Infrared Luminosity and Star Formation Rates of Local and High-redshift Galaxies. ApJ 2013, 767, 73 - 87
- Sajina et al. (2012) Sajina, A., Yan, L., Fadda, D., Dasyra, K., & Huynh, M. Spitzer- and Herschel-based Spectral Energy Distributions of 24 m Bright z 0.3-3.0 Starbursts and Obscured Quasars, ApJ, 2012, 757, 13 -
- Sanders et al. (1988) Sanders, D. B., Soifer, B. T., Elias, J. H., et al. Ultraluminous Infrared Galaxies and the Origin of Quasars, ApJ, 1988, 325, 74 -
- Santini et al. (2012) Santini, P., Rosario, D. J., Shao, L. et al. Enhanced star formation rates in AGN hosts with respect to inactive galaxies from PEP-Herschel observations. A&A 2012. 540, A109 - A128
- Yamada et al. (2021) Yamada, S., Ueda, Y., Tanimoto, A. et al. Comprehensive Broadband X-Ray and Multiwavelength Study of Active Galactic Nuclei in 57 Local Luminous and Ultraluminous Infrared Galaxies Observed with NuSTAR and/or Swift/BAT. ApJS 2021, 257, 61 - 128
- Satyapal et al. (2018) Satyapal, S., Abel, N. P. & Secrest, N. J. Star-forming Galaxies as AGN Imposters? A Theoretical Investigation of the Mid-infrared Colors of AGNs and Extreme Starbursts. ApJ 2018, 858, 38 - 49
- Schülle et al. (2015) Schnülle, K., Pott, J.-U., Rix, H.-W., et al. Monitoring the temperature and reverberation delay of the circumnuclear hot dust in NGC 4151. A&A 2015, 578, A57 - A74
- Scott & Stewart (2014) Scott, A. E. & Stewart, G. C. Do the spectral energy distributions of type 1 active galactic nuclei show diversity? MNRAS 2014, 438, 2253 - 2266
- Secrest et al. (2015) Secrest, N. J., Dudik, R. P., Dorland, B. N. et al. Identification of 1.4 Million Active Galactic Nuclei in the Mid-Infrared using WISE Data. ApJS 2015, 221, 12- 21
- Secrest & Satyapal (2020) Secrest, N. J., & Satyapal, S. A Low Incidence of Mid-infrared Variability in Dwarf Galaxies. ApJ 2020, 900, 56 - 63
- Severgnini et al. (2012) Severgnini, P., Caccianiga, A., & Della Ceca, R. A new technique to efficiently select Compton-thick AGN. A&A 2012, 542, 46 - 54
- Shah et al. (2020) Shah, E. A., Kartaltepe, J.S., Magagnoli, C. T. et al. Investigating the Effect of Galaxy Interactions on the Enhancement of Active Galactic Nuclei at 0.5 < z < 3.0. ApJ 2020, 904, 107 - 127
- Shakura & Sunyaev (1973) Shakura N. I., Sunyaev R. A. Black holes in binary systems. Observational appearance. A&A 1973, 24, 33 - 51
- Shang et al. (2011) Shang, Z., Brotherton, M. S., Wills, B. J. et al. The Next Generation Atlas of Quasar Spectral Energy Distributions from Radio to X-Rays. ApJS, 2011, 196, 2 - 24
- Shangguan, Ho, & Xie (2018) Shangguan, J., Ho, L. C., & Xie, Y. On the Gas Content and Efficiency of AGN Feedback in Low-redshift Quasars, ApJ, 2018, 854, 158 -
- Shenavrin et al. (2011) Shenavrin, V. I., Taranova, O. G., and Nadzhip, A. E. Search for and study of hot circumstellar dust envelopes. Ast. Reports 2011, 55, 31 - 81
- Sheng et al. (2017) Sheng, Z., Wang, T., Jiang, N. et al. Mid-infrared Variability of Changing-look AGNs. ApJL 2017, 846, L7 - L13
- Sheng et al. (2020) Sheng, Z., Wang, T., Jiang, N. et al. Initial Results from a Systematic Search for Changing-look Active Galactic Nuclei Selected via Mid-infrared Variability. ApJ 2020, 889, 46 - 54
- Shi et al. (2005) Shi, Y., Rieke, G. H., Hines, D. C., et al. Far-Infrared Observations of Radio Quasars and FR II Radio Galaxies, ApJ, 2005, 629, 88 - 99
- Shi et al. (2007) Shi, Yong, Ogle, P., Rieke, G. H. et al. Aromatic Features in AGNs: Star-forming Infrared Luminosity Function of AGN Host Galaxies. ApJ 2007, 669, 841 - 861
- Shi et al. (2014) Shi, Yong, Rieke, G. H., Ogle, P. M., Su, K. Y. L., & Balog, Z. Infrared Spectra and Photometry Of Complete Samples of Palomar-Green and Two Micron All Sky Survey Quasars. ApJS 2014, 214, 23 - 39
- Shipley et al. (2016) Shipley, H. V., Papovich, C., Rieke, G. H., Brown, M. J. I., & Moustakas, J. A New Star Formation Rate Calibration from Polycyclic Aromatic Hydrocarbon Emission Features and Application to High-redshift Galaxies. ApJ 2016, 818, 60 - 79
- Siebenmorgen et al. (2015) Siebenmorgen, R., Heymann, F., & Efstathiou, A. Self-consistent two-phase AGN torus models: SED library for observers. A&A 2015, 583, 120 - 137
- Sirocky et al. (2008) Sirocky, M. M., Levenson, N. A., Elitzur, M., Spoon, H. W. W., & Armus, L. Silicates in Ultraluminous Infrared Galaxies. ApJ 2008, 678, 729 - 743
- Sitko et al. (1993) Sitko, M. L., Sitko, A. K., Siemiginowska, A., & Szczerba, R. Multifrequency Observations of the Optically Active Radio-quiet Quasar GQ Comae. II. Ultraviolet, Optical, and Infrared Continuum Variability. ApJ 1993, 409, 139 - 148
- Skibba et al. (2011) Skibba, R. A., Engelbracht, C. W., Dale, D. A. et al. The Emission by Dust and Stars of Nearby Galaxies in the Herschel KINGFISH Survey. ApJ 2011, 739, 89 - 106
- Smith et al. (2007) Smith, J. D. T., Draine, B. T., Dale, D. A. et al. The Mid-Infrared Spectrum of Star-forming Galaxies: Global Properties of Polycyclic Aromatic Hydrocarbon Emission. ApJ 2007, 656, 770 - 791
- Sobrino Figaredo et al. (2020) Sobrino Figaredo, C., Haas, M., Ramolla, M. et al. Dust Reverberation of 3C 273: Torus Structure and Lag-Luminosity Relation. AJ 2020, 159, 259 - 276
- Soifer et al. (1987) Soifer, B. T., Sanders, D. B., Madore, B. F., et al. The IRAS Bright Galaxy Sample. II. The Sample and Luminosity Function, ApJ, 1987, 320, 238 -
- Spoon et al. (2007) Spoon, H. W. W., Marshall, J. A., Houck, J. R. et al. Mid-Infrared Galaxy Classification Based on Silicate Obscuration and PAH Equivalent Width. ApJL 2007, 654, L49 - L52
- Stalevski et al. (2012) Stalevski, M., Fritz, J., Baes, M., Nakos, T., Popović, L. C̆. 3D radiative transfer modelling of the dusty tori around active galactic nuclei as a clumpy two-phase medium. MNRAS 2012, 420, 2756 - 2772
- Stalevski et al. (2016) Stalevski, M., Ricci, C., Ueda, Y. et al. The dust covering factor in active galactic nuclei. MNRAS 2016, 458, 2288 - 2302
- Stalevski et al. (2019) Stalevski, M., Tristram, K. R. W., & Asmus, D. Dissecting the active galactic nucleus in Circinus - II. A thin dusty disc and a polar outflow on parsec scales. MNRAS 2019, 484, 3334 - 3355
- Stein & Weedman (1976) Stein, W. A., & Weedman, D. W. The origin of ultraviolet and infrared continuum radiation from Seyfert galaxies. ApJ 1976, 205, 44 - 51
- Stern et al. (2005) Stern, D., Eisenhardt, P., Gorjian, V. et al. Mid-Infrared Selection of Active Galaxies. ApJ 2005, 631, 163 - 168
- Stern et al. (2012) Stern, D., Assef, R. J., Benford, D. J. et al. Mid-infrared Selection of Active Galactic Nuclei with the Wide-Field Infrared Survey Explorer. I. Characterizing WISE-selected Active Galactic Nuclei in COSMOS. ApJ 2012, 753, 30 - 47
- Stern et al. (2018) Stern, D. McKernan, B., Graham, M. J. et al. A Mid-IR Selected Changing-look Quasar and Physical Scenarios for Abrupt AGN Fading. ApJ 2018, 864, 27 - 35
- Stern & Laor (2012) Stern, J., & Laor, A. Type 1 AGN at low z - II. The relative strength of narrow lines and the nature of intermediate type AGN, MNRAS, 2012, 426, 2703 - 2718
- Suganuma et al. (2006) Suganuma, M., Yoshii, Y., Kobayashi, Y. et al. Reverberation Measurements of the Inner Radius of the Dust Torus in Nearby Seyfert 1 Galaxies. ApJ 2006, 639, 46 - 63
- Suh et al. (2019) Suh, H., Civano, F., Hasinger, G. et al. Multi-wavelength Properties of Type 1 and Type 2 AGN Host Galaxies in the Chandra-COSMOS Legacy Survey. ApJ 2019, 872, 168 - 185
- Swain et al. (2021) Swain, S., Shalima, P., Latha, K. V. P., & Swamy, K. B. S. Hot graphite dust in the inner regime of NGC 4151. MNRAS 2021, 503, 5877 - 5893
- Symeonidis et al. (2016) Symeonidis M., Giblin B. M., Page M. J. et al. AGN are cooler than you think: the intrinsic far-IR emission from QSOs. MNRAS 2016, 459, 257 - 276
- Symeonidis (2017) Symeonidis, M. What produces the far-infrared/submillimetre emission in the most luminous QSOs?. MNRAS 2017, 465, 1401 - 1408
- Takasao et al. (2022) Takasao, S., Shuto, Y., & Wada, K. Spontaneous Formation of Outflows Powered by Rotating Magnetized Accretion Flows in a Galactic Center. ApJ 2022, 926, 50 - 70",
- Taranova & Shenavrin (2013) Taranova, O. G., & Shenavrin, V. I. Activity of the Seyfert galaxy NGC 4151 in the near-IR in 1994-2011. Ast. Reports 2013, 57, 71 - 83
- Tazaki & Ichikawa (2020) Tazaki, R. & Ichikawa, K. Dust Destruction by Drift-induced Sputtering in Active Galactic Nuclei. ApJ 2020, 892, 149 - 162
- Trebitsch, Volonteri, & Dubois (2019) Trebitsch, M., Volonteri, M., & Dubois, Y. Black hole obscuration and duty-cycles mediated by AGN feedback in high-redshift galaxies, MNRAS, 2019, 487, 819 - 831
- Tsai et al. (2015) Tsai, C.-W., Eisenhardt, P. R. M., Wu, J. et al. The Most Luminous Galaxies Discovered by WISE. ApJ 2015, 805, 90 - 104
- Tsuboi et al. (2018) Tsuboi, M., Kitamura, Y., Uehara, K. et al. ALMA view of the circumnuclear disk of the Galactic Center: tidally disrupted molecular clouds falling to the Galactic Center. PASJ 2018, 70, 85 - 115
- Uchiyama et al. (2006) Uchiyama, Y., Urry, C. M., Cheung, C. C., et al. Shedding New Light on the 3C 273 Jet with the Spitzer Space Telescope, ApJ, 2006, 648, 910 - 921
- Ulrich et al. (1997) Ulrich, M.-H., Maraschi, L., & Urry, C. M. Variability of Active Galactic Nuclei. ARAA 1995, 35, 445 - 502
- Urry & Padovani (1995) Urry, C. M. & Padovani, P. 1995, PASP, 107, 803. doi:10.1086/133630
- Vazquez et al. (2015) Vazquez, B., Galianni, P., Richmond, M., et al. Spitzer Space Telescope Measurements of Dust Reverberation Lags in the Seyfert 1 Galaxy NGC 6418, ApJ, 2015, 801, 127 -
- Veilleux et al. (2009) Veilleux, S., Rupke, D. S. N., Kim, D. -C. et al. Spitzer Quasar and Ulirg Evolution Study (QUEST). IV. Comparison of 1 Jy Ultraluminous Infrared Galaxies with Palomar-Green Quasars. ApJS 2009, 182, 628 - 666
- Venanzi et al. (2020) Venanzi, M., Hönig, S., & Williamson, D. The Role of Infrared Radiation Pressure in Shaping Dusty Winds in AGNs. 2020 ApJ, 900, 174 - 185
- Viaene et al. (2020) Viaene, S., Nersesian, A., Fritz, J. et al. High-resolution, 3D radiative transfer modelling. IV. AGN-powered dust heating in NGC 1068. A&A 2020, 638, 150 - 166
- Victoria-Ceballos et al. (2022) Victoria-Ceballos, C. I., González-Martín, O., Fritz, J. et al. The complex infrared dust continuum emission of NGC 1068: ground-based N- and Q-band spectroscopy and new radiative transfer models. 2022, arXiv:2201.11869
- Videla et al. (2013) Videla, L., Lira, P., Andrews, H., et al. Nuclear Infrared Spectral Energy Distribution of Type II Active Galactic Nuclei, ApJS, 2013, 204, 23 -
- Vito et al. (2018) Vito, F., Brandt, W. N., Stern, D. et al. Heavy X-ray obscuration in the most luminous galaxies discovered by WISE. MNRAS 2018, 474, 4528 - 4540
- Vollmer et al. (2018) Vollmer, B., Schartmann, M., Burtscher, L. et al. Thick turbulent gas disks with magnetocentrifugal winds in active galactic nuclei. Model infrared emission and optical polarization. A&A 2018, 615, 164 - 196
- Wada (2012) Wada, K. Radiation-driven Fountain and Origin of Torus around Active Galactic Nuclei, ApJ, 2012, 758, 66 -
- Wang et al. (2017) Wang, J.-M., Du, P., Brotherton, M. S., et al. Tidally disrupted dusty clumps as the origin of broad emission lines in active galactic nuclei, Nature Astronomy, 2017, 1, 775 - 783
- Ward et al. (2021) Ward, C., Gezari, S., Nugent, P., et al. Variability-selected intermediate mass black hole candidates in dwarf galaxies from ZTF and WISE, arXiv e-prints, 2021, arXiv:2110.13098 -
- Ward et al. (1987) Ward, M., Elvis, M., Fabbiano, G. et al. The Continuum of Type 1 Seyfert Galaxies. I. A Single Form Modified by the Effects of Dust. ApJ 1987, 315, 74- 91
- Wen et al. (2013) Wen, X.-Q., Hong Wu, H., Zhu, Y.-N. et al. The stellar masses of galaxies from the 3.4 m band of the WISE All-Sky Survey. MNRAS, 2013, 433, 2946 – 2957
- Westhues et al. (2016) Westhues, C., Haas, M., Barthel, P., et al. Star Formation in 3CR Radio Galaxies and Quasars at z 1, AJ, 2016, 151, 120 -
- Williamson et al. (2020) Williamson, D., Hönig, S., & Venanzi, M. Radiation Hydrodynamics Models of Active Galactic Nuclei: Beyond the Central Parsec. ApJ 2020, 897, 26 - 45
- Willner et al. (1984) Willner, S. P., Ward, M., Longmore, A. et al. JHKL photometry of the nuclei of normal spiral galaxies. PASP 1984, 96, 143 - 147
- Wilson (1988) Wilson, A. S. Star formation and nuclear activity in Seyfert galaxies. A&A 1988, 206, 41 - 46
- Winter et al. (2010) Winter, L. M., Karen T. Lewis, K. T., Koss, M. et al. Optical Spectral Properties of Swift Burst Alert Telescope Hard X-Ray-Selected Active Galactic Nuclei Sources. ApJ 2010, 710, 503 - 539
- Wu et al. (2012) Wu, J., Tsai, C.-W., Sayers, J., et al. Submillimeter Follow-up of WISE-selected Hyperluminous Galaxies. ApJ 2012, 756, 96 - 109
- Xie et al. (2021) Xie, Y., Ho, L. C., Zhuang, M.-Y., & Shangguan, J. The Infrared Emission and Vigorous Star Formation of Low-redshift Quasars. ApJ 2021, 910, 124 - 134
- Xu et al. (2015a) Xu, Lei, Rieke, G. H., Egami, E. et al. A Herschel Study of 24 m-Selected AGNs and Their Host Galaxies. ApJS 2015a, 219, 18 - 53
- Xu et al. (2015b) Xu, Lei, Rieke, G. H., Egami, E. et al. The Relation between Luminous AGNs and Star Formation in Their Host Galaxies. ApJ 2015b, 808, 159 - 168
- Xu et al. (2020) Xu, J., Sun, M., & Xue, Y. AGNs Are Not That Cool: Revisiting the Intrinsic AGN Far-infrared Spectral Energy Distribution. ApJ 2020, 894 21 - 32
- Yan et al. (2019) Yan, W., Hickox, R. C., Hainline, K. N., et al. NuSTAR and Keck Observations of Heavily Obscured Quasars Selected by WISE. ApJ 2019, 870, 33 - 43
- Yang et al. (2020) Yang, Q., Shen, Y., Liu, X. et al. Dust Reverberation Mapping in Distant Quasars from Optical and Mid-infrared Imaging Surveys. ApJ 2020, 900, 58 - 74
- Yang et al. (2022) Yang, G., Boquien, M., Brandt, W. N. et al. Fitting AGN/galaxy X-ray-to-radio SEDs with CIGALE and improvement of the code. 2022, arXiv:2201.03718
- Yang et al. (2021) Yang, G., Papovich, C., Bagley, M. B. et al. JWST/MIRI Simulated Imaging: Insights into Obscured Star Formation and AGNs for Distant Galaxies in Deep Surveys. ApJ 2021, 908, 144 - 170
- Yoshii et al. (2003) Yoshii, Y., Tomita, H., Kobayashi, Y. et al. The Optical/Near-Infrared Light Curves of SN 2002ap for the First 140 Days after Discovery. ApJ 2003, 592, 467 - 474
- Zafar et al. (2015) Zafar, T., Møller, P., Watson, D. et al. Extinction curve template for intrinsically reddened quasars. A&A 2015, 584, 100 - 107
- Zakamska et al. (2016a) Zakamska, N. L., Hamann, F., Pâris, I. et al. Discovery of extreme [O III] 5007 outflows in high-redshift red quasars. MNRAS 2016, 459, 3144 - 3160
- Zakamska et al. (2016b) Zakamska, Nadia L., Lampayan, K., Petric, A. et al. Star formation in quasar hosts and the origin of radio emission in radio-quiet quasars. MNRAS 2016, 455,4191 - 4211
- Zappacosta et al. (2018) Zappacosta, L., Piconcelli, E., Duras, F. et al. The hyperluminous Compton-thick z 2 quasar nucleus of the hot DOG W1835+4355 observed by NuSTAR. A&A 2018, 618, 28 - 38
- Zhang et al. (2016) Zhang, Z., Shi, Yong, Rieke, G. H. et al. Distributions of Quasar Hosts on the Galaxy Main Sequence Plane. ApJL 2016, 819, 27 - 32
- Zhuang & Ho (2020) Zhuang, M.-Y. & Ho, L. C. The Interplay between Star Formation and Black Hole Accretion in Nearby Active Galaxies. ApJ 2020, 896, 108 - 120
- Zou et al. (2019) Zou, F., Yang, G., Brandt, W. N., & Xue, Y. The Host-galaxy Properties of Type 1 versus Type 2 Active Galactic Nuclei. ApJ 2019, 878, 11 - 26